
Alteration of the Expression and Functional Activities of Myosin II Isoforms in Enlarged Hyperplastic Prostates

Abstract
1. Introduction
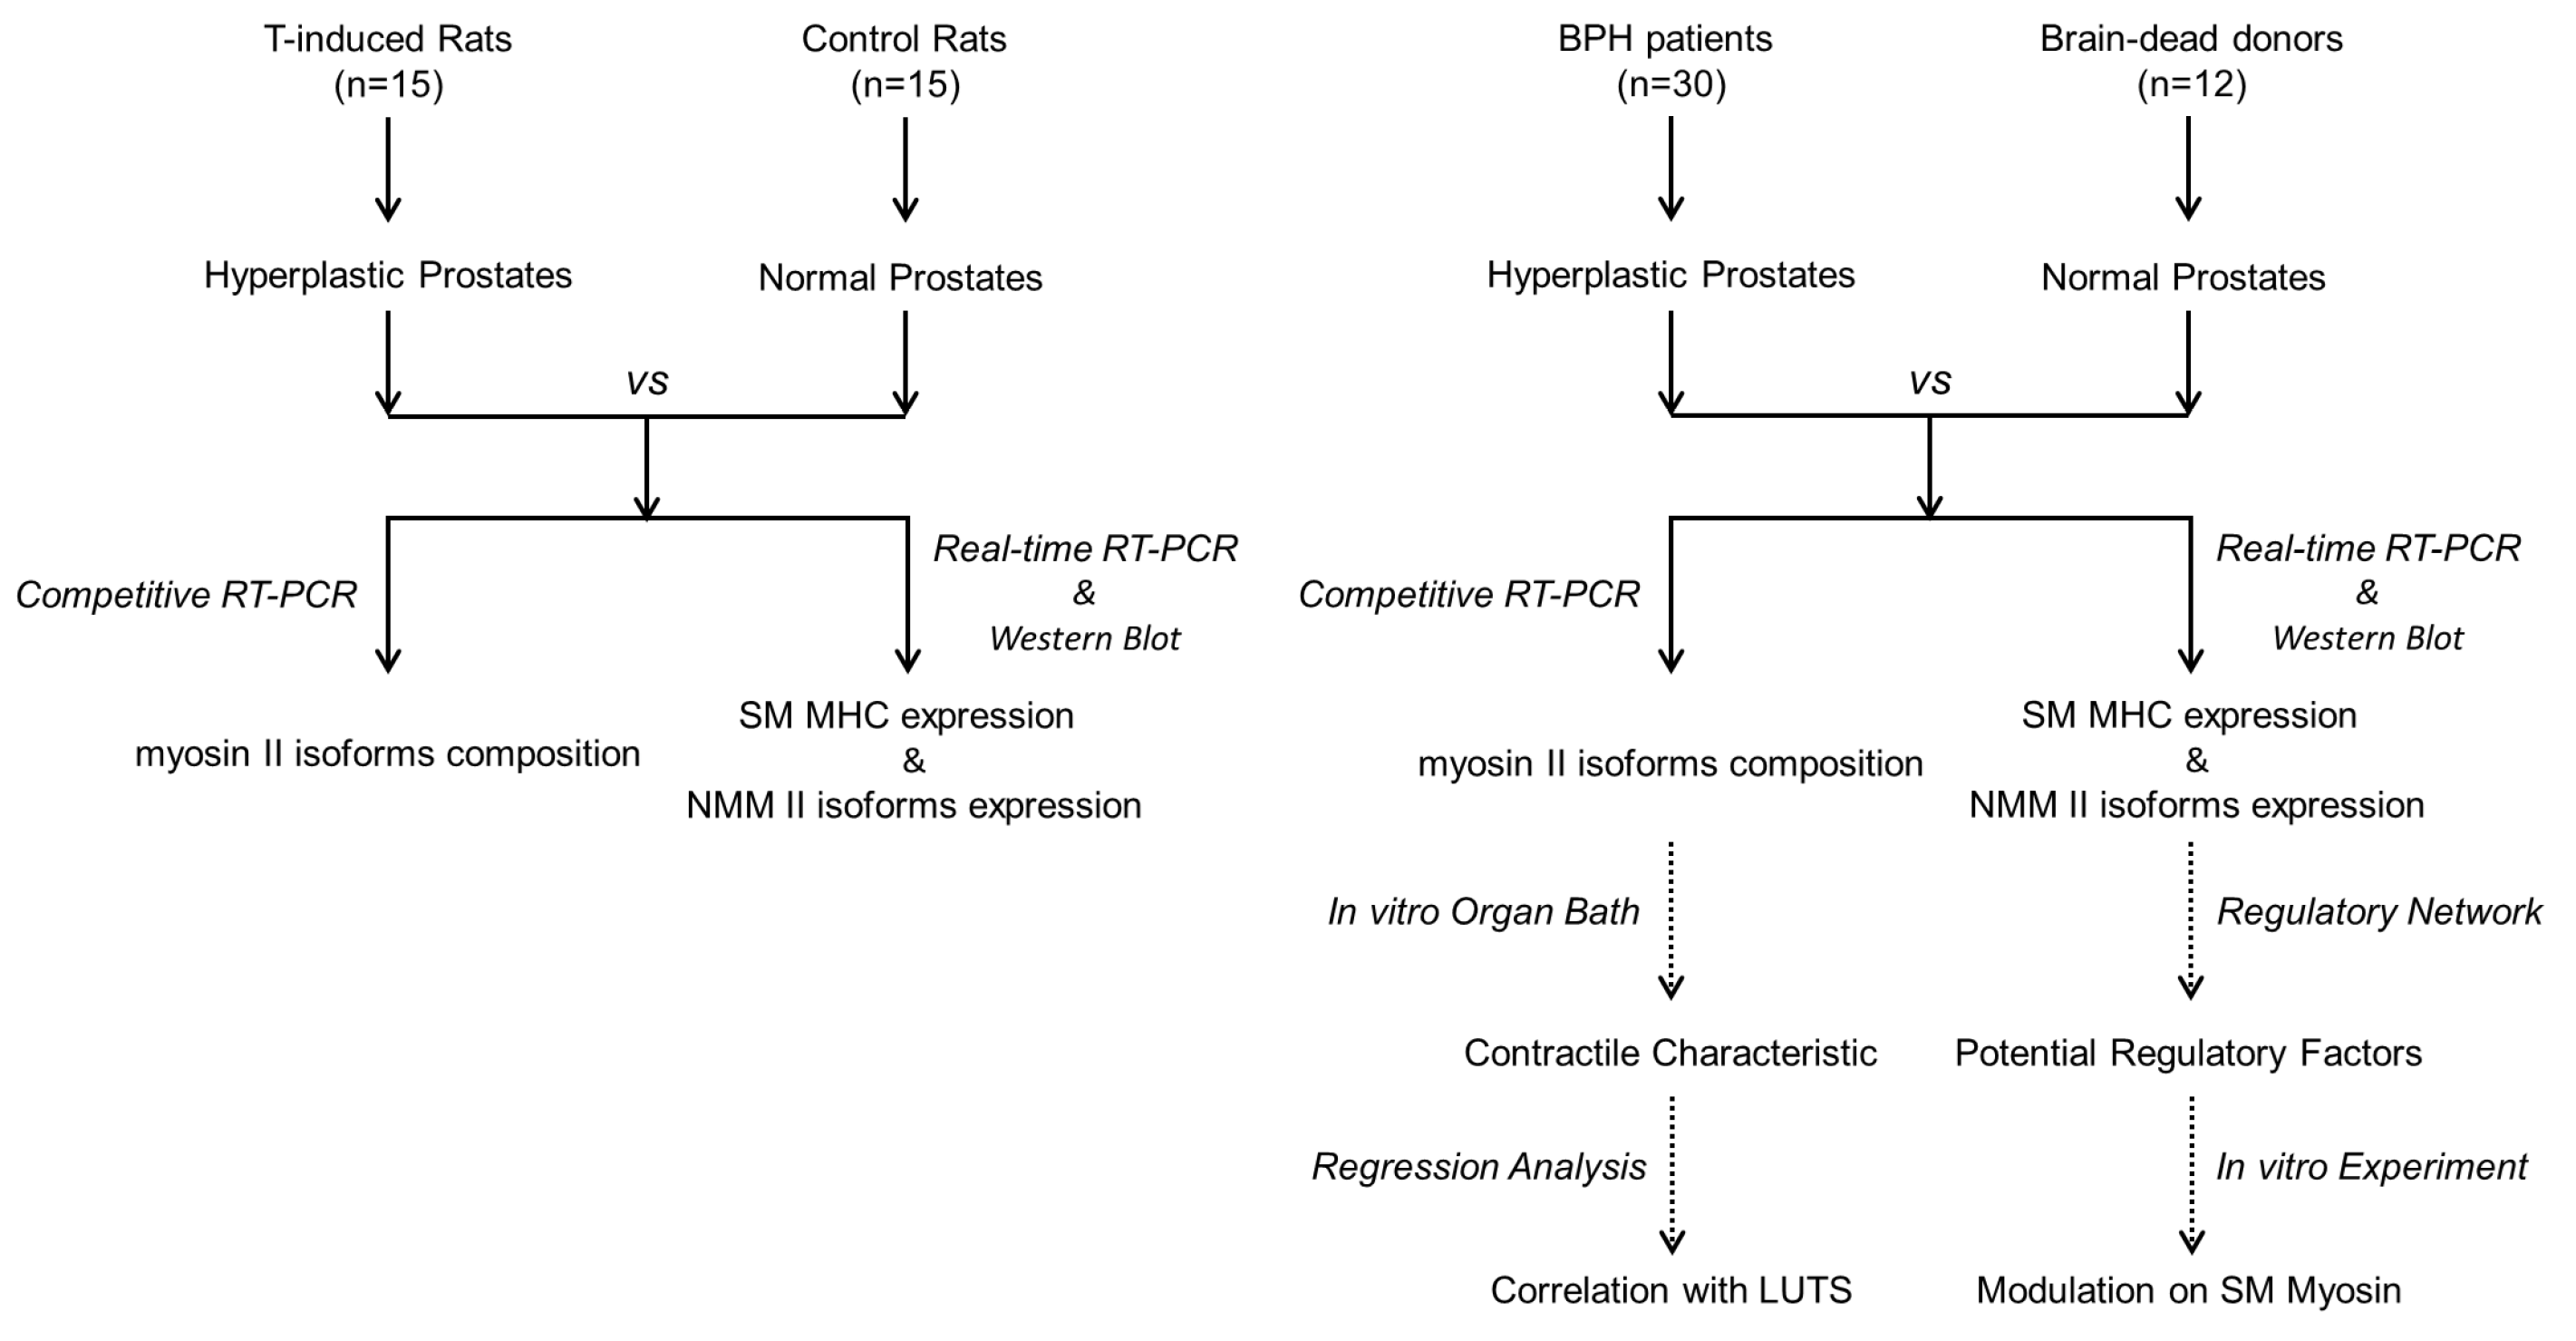
2. Methods
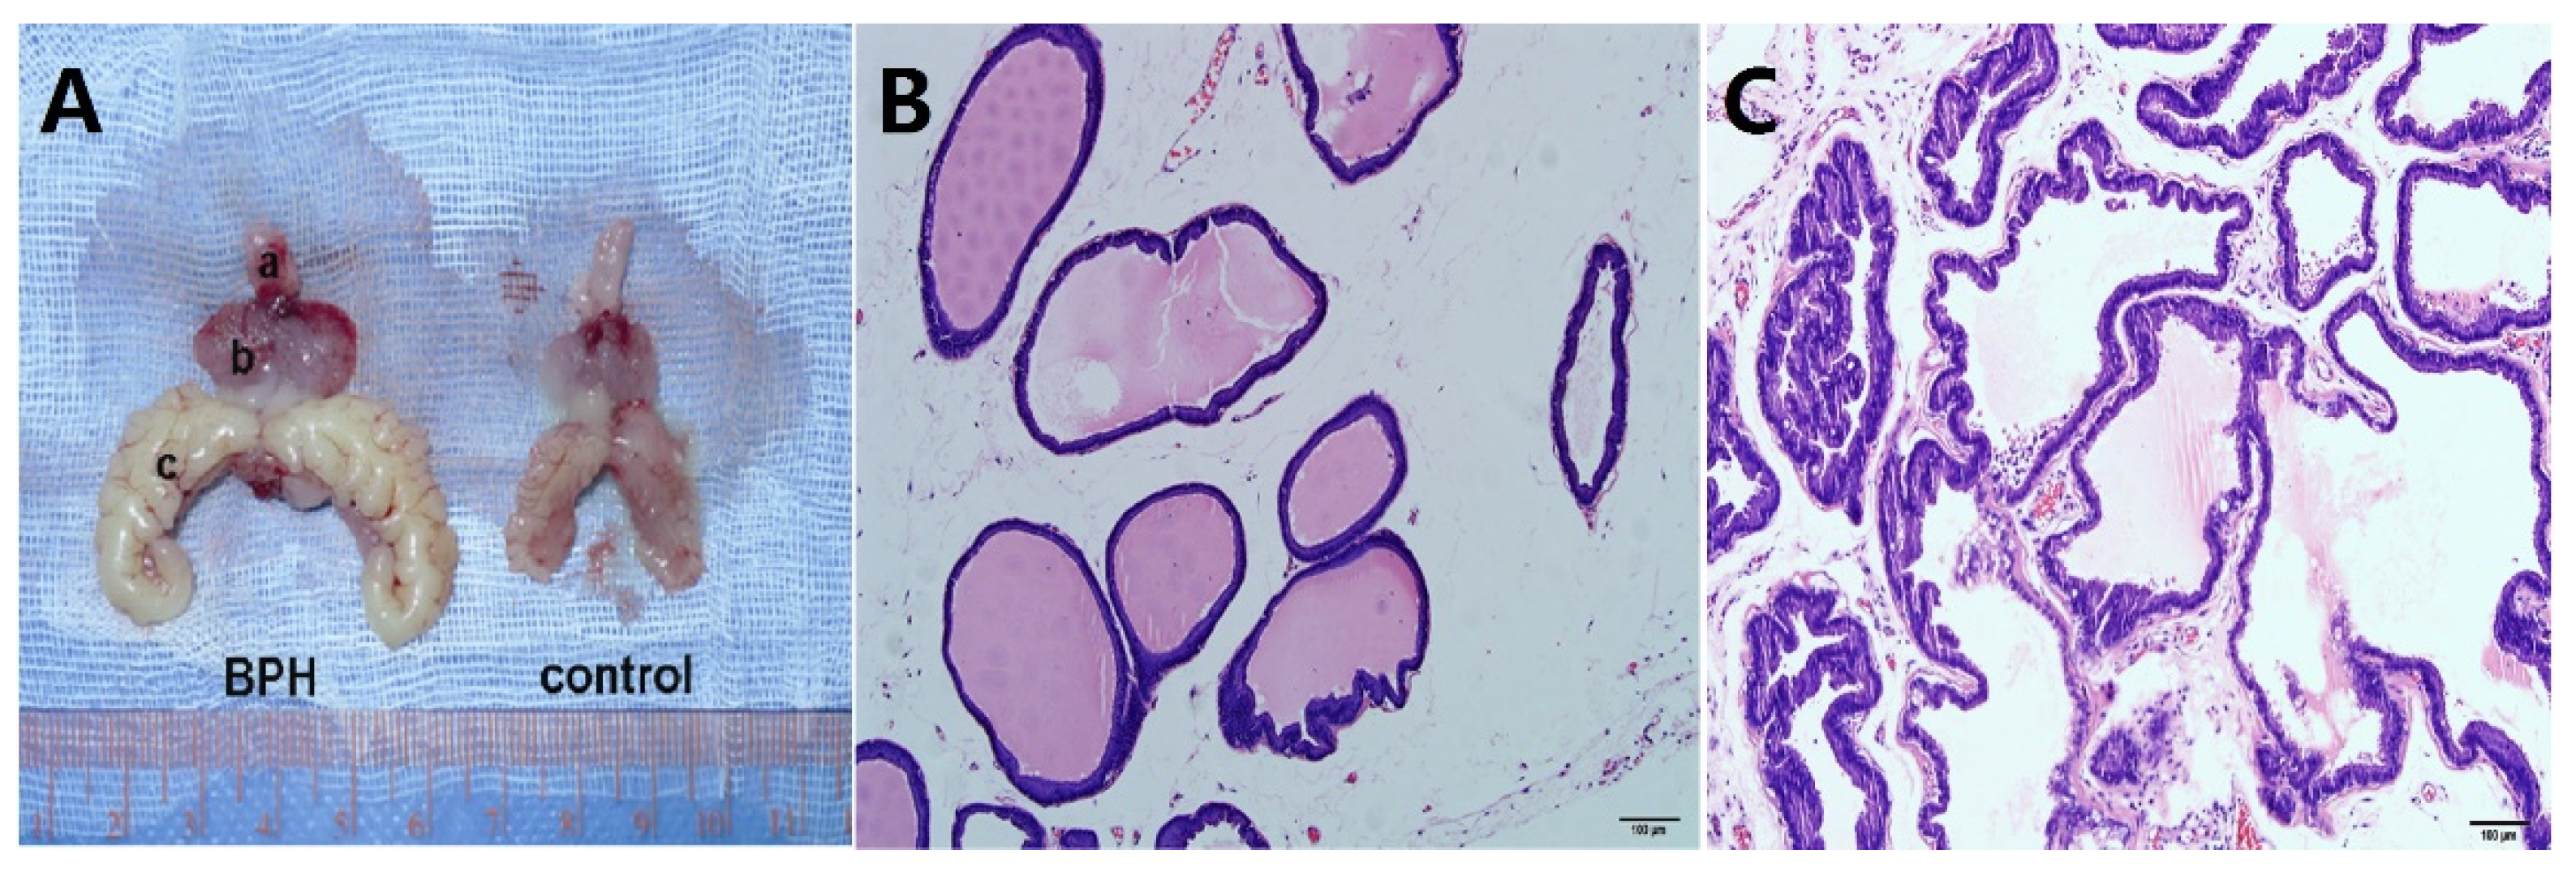
2.1. Animal Protocol
2.2. Human Specimens
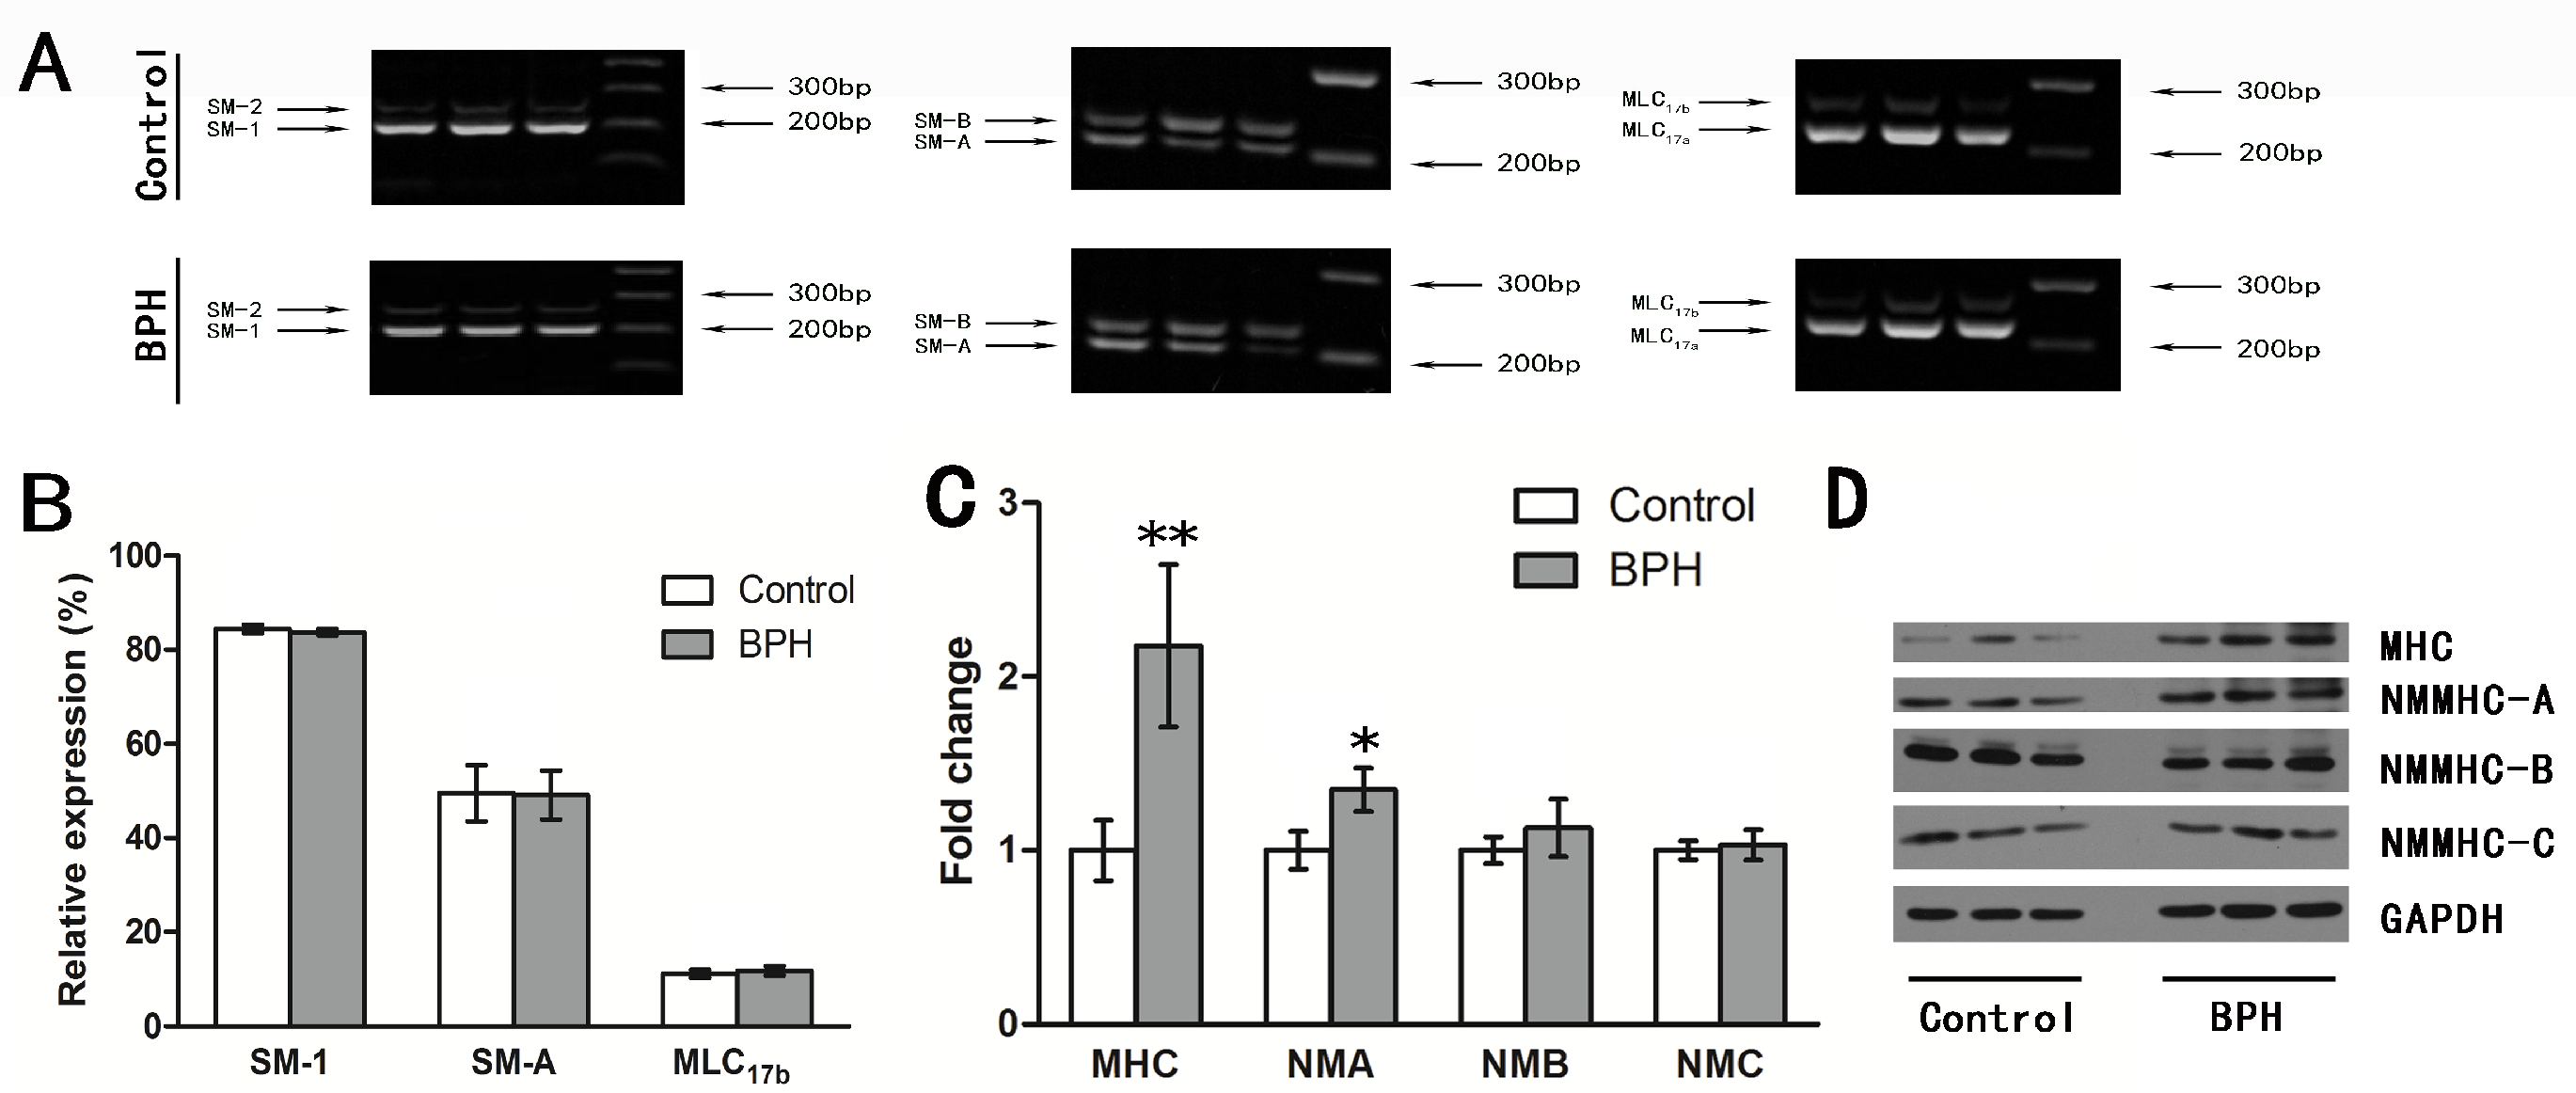
2.3. Total RNA Extraction and Real-Time RT-PCR
2.4. Competitive RT-PCR
2.5. In Vitro Organ Bath Studies
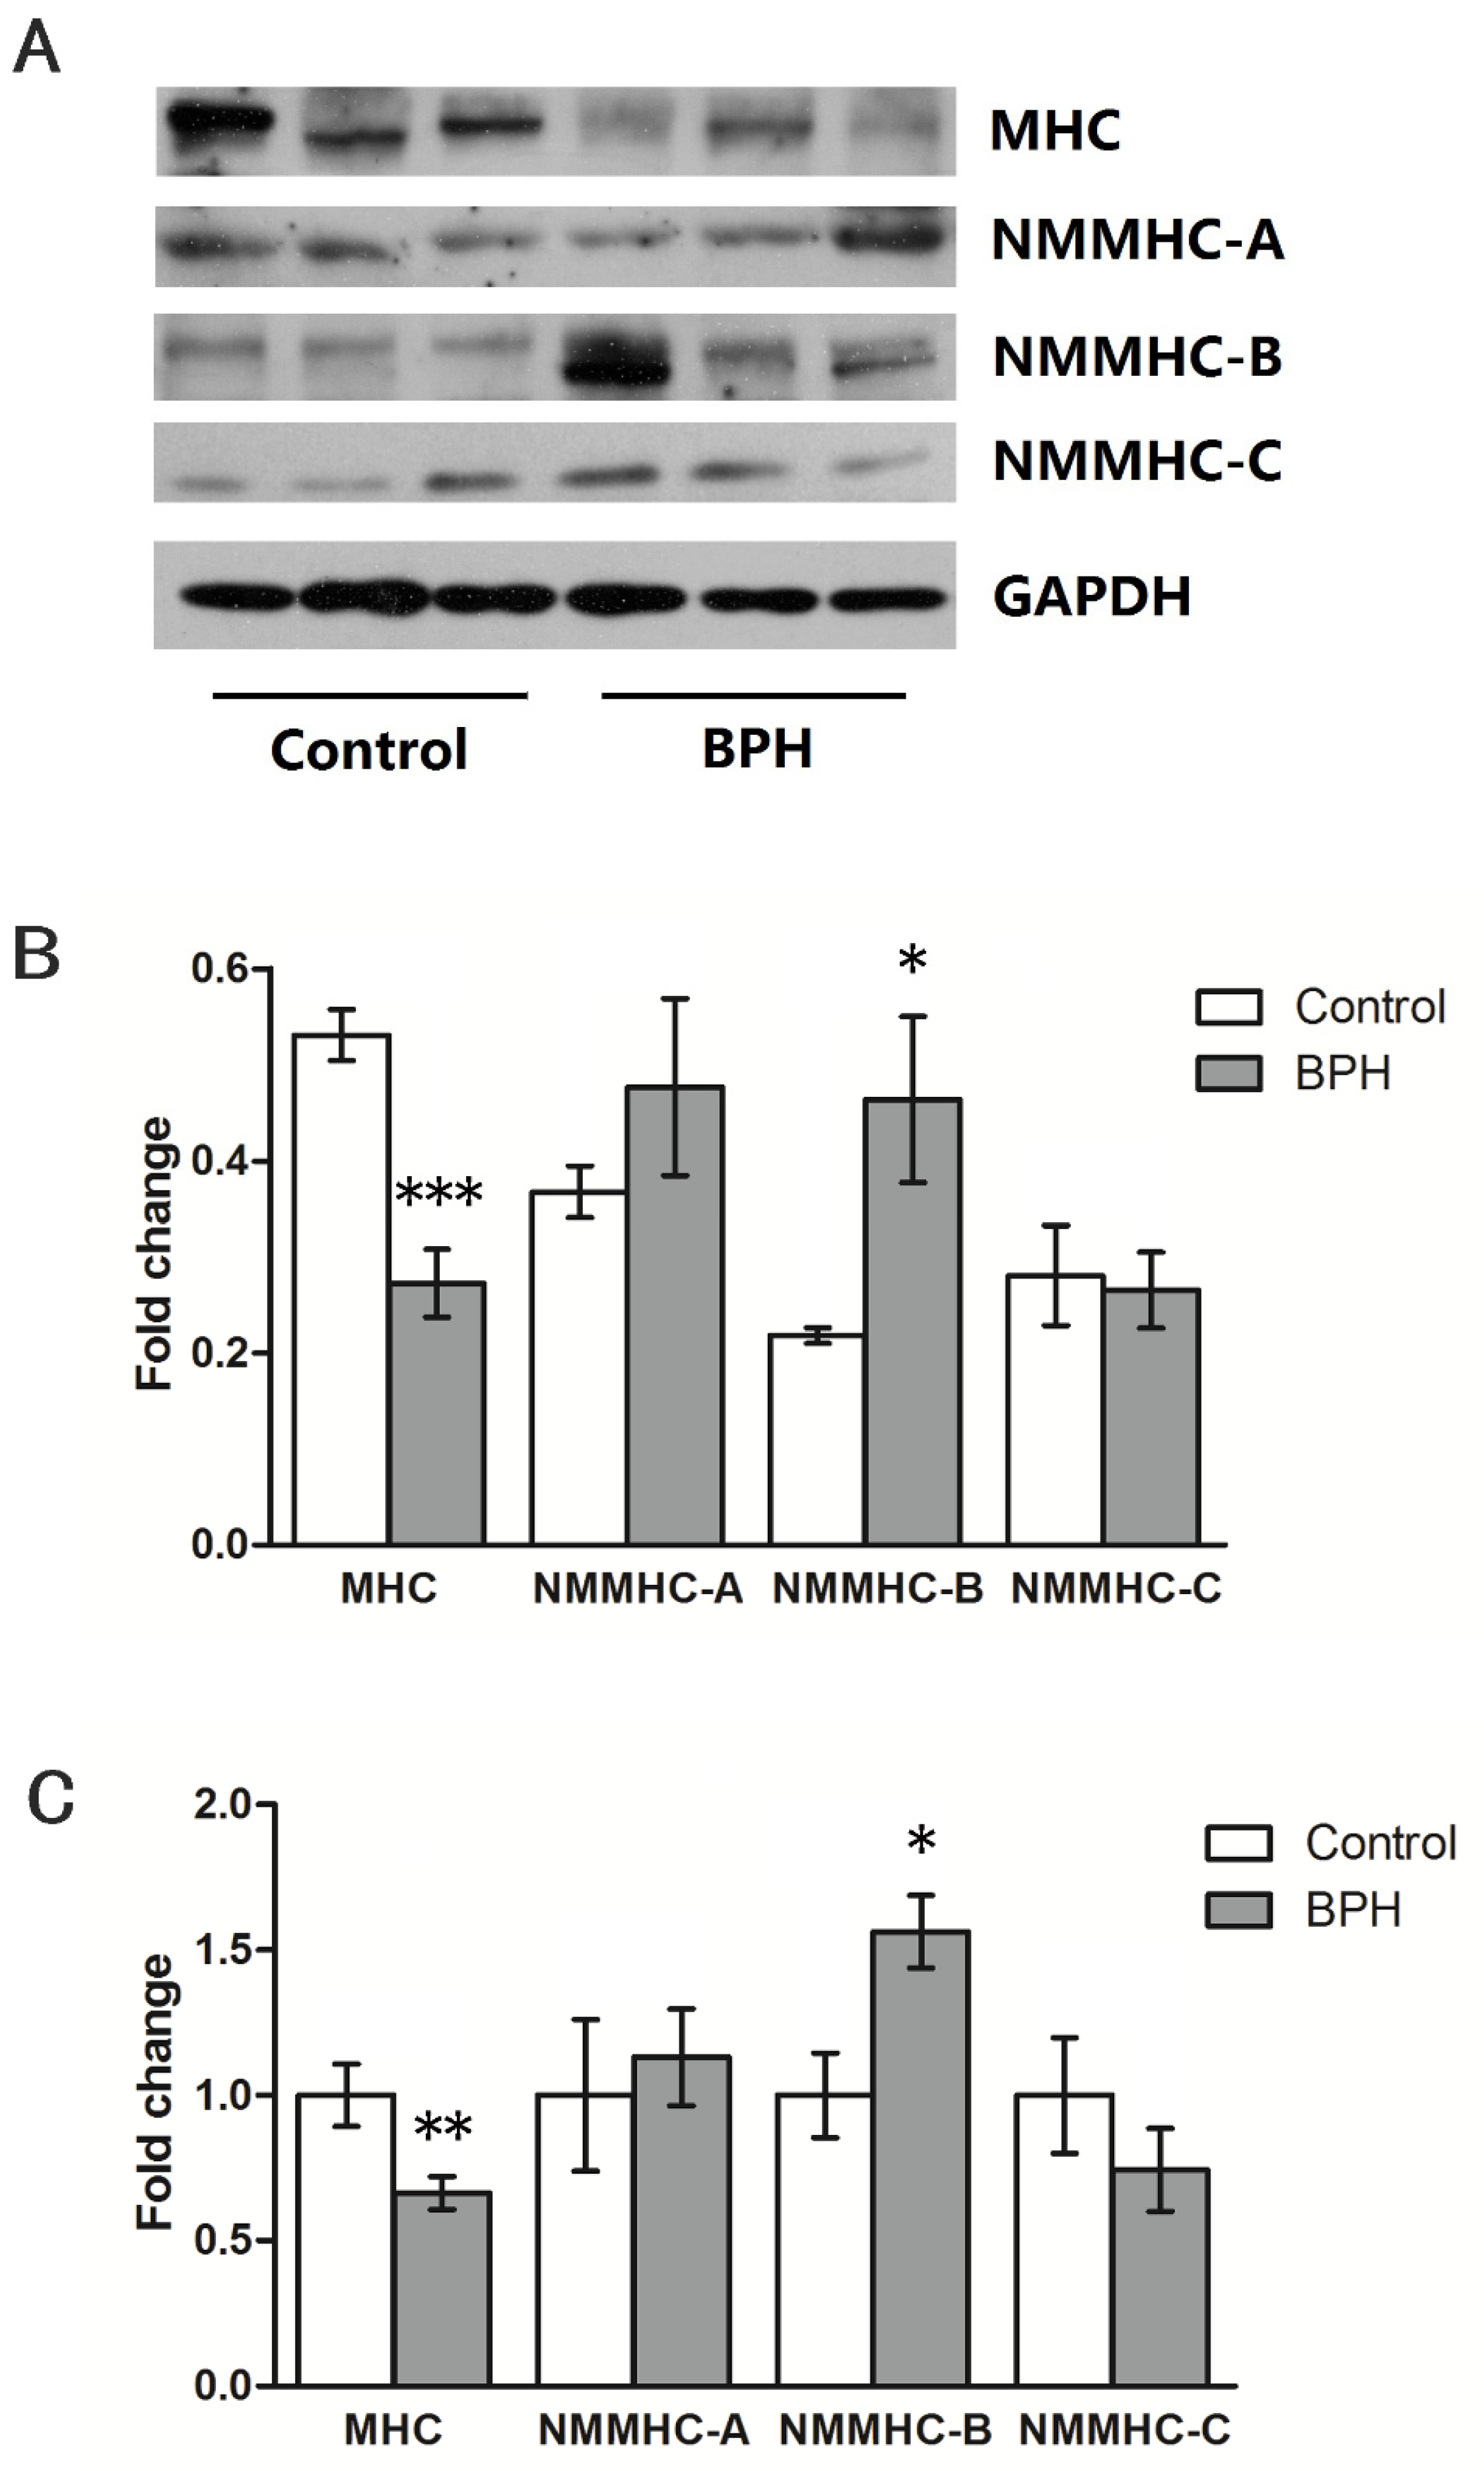
2.6. SDS-PAGE and Western Blot Analysis
2.7. Immunofluorescence
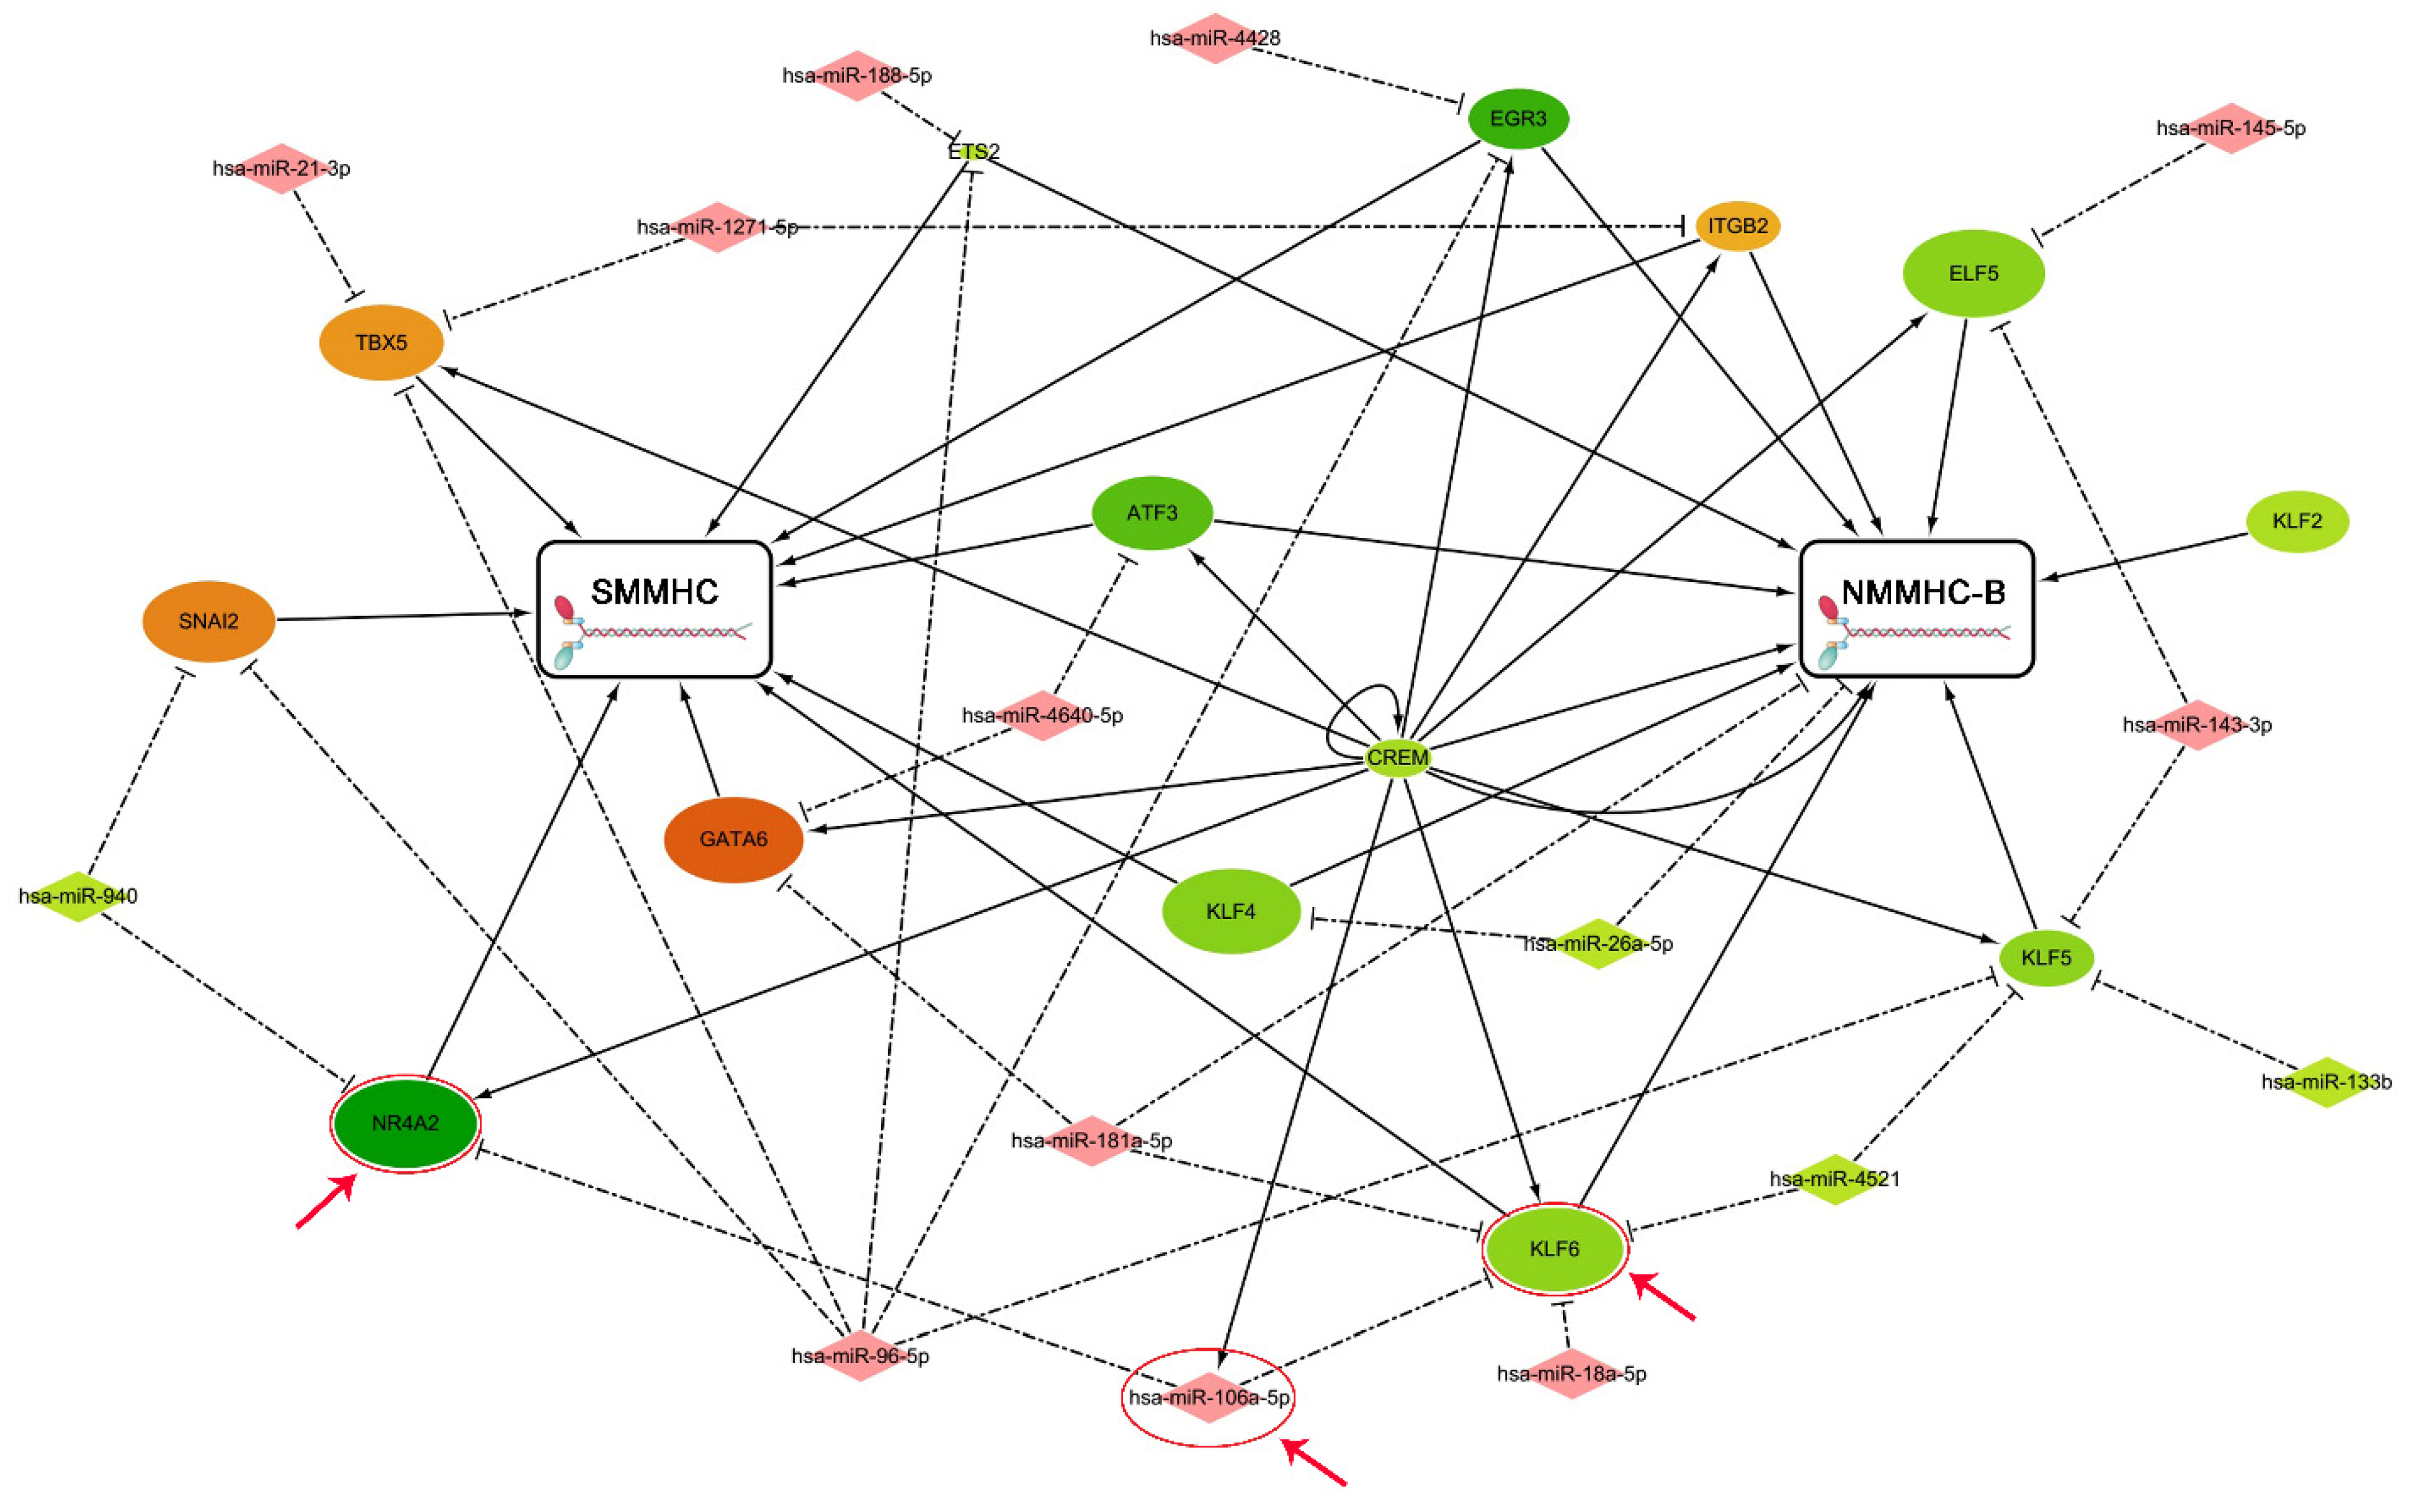
2.8. Regulatory Network Analysis
2.9. Cell Culture, Transfection, and Immunofluorescence
2.10. Statistical Analysis
2.11. Ethical Standards
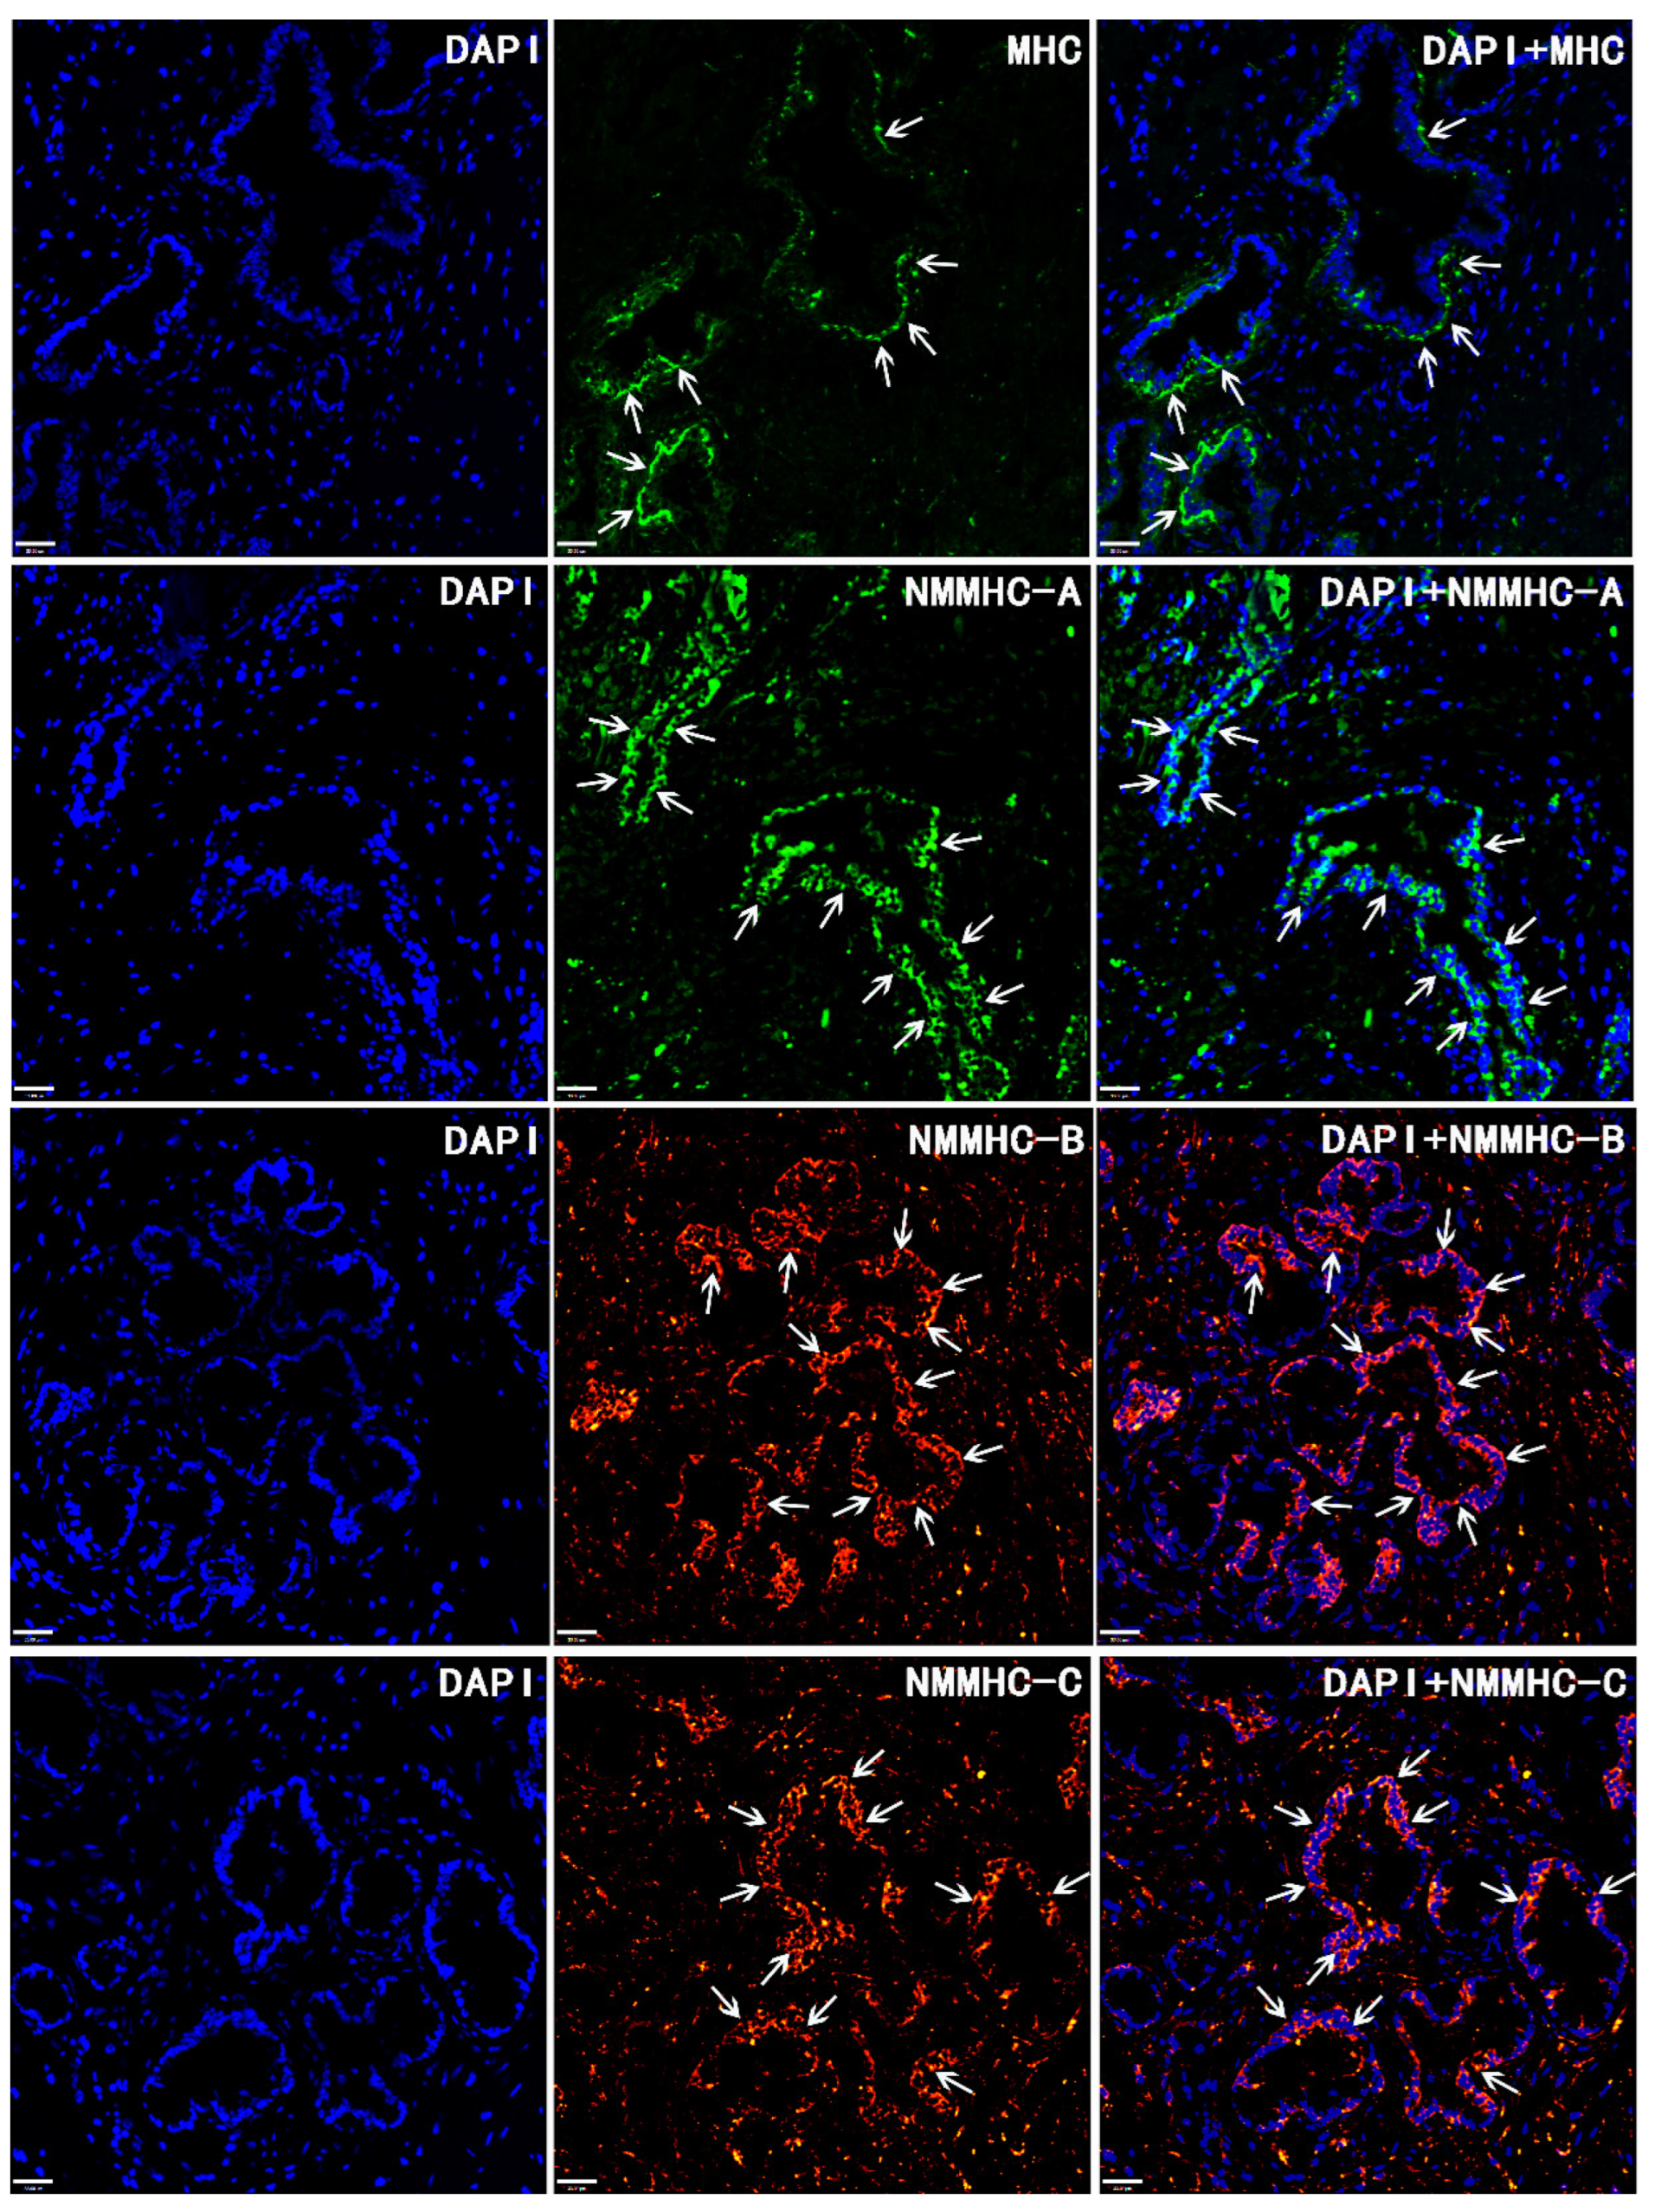
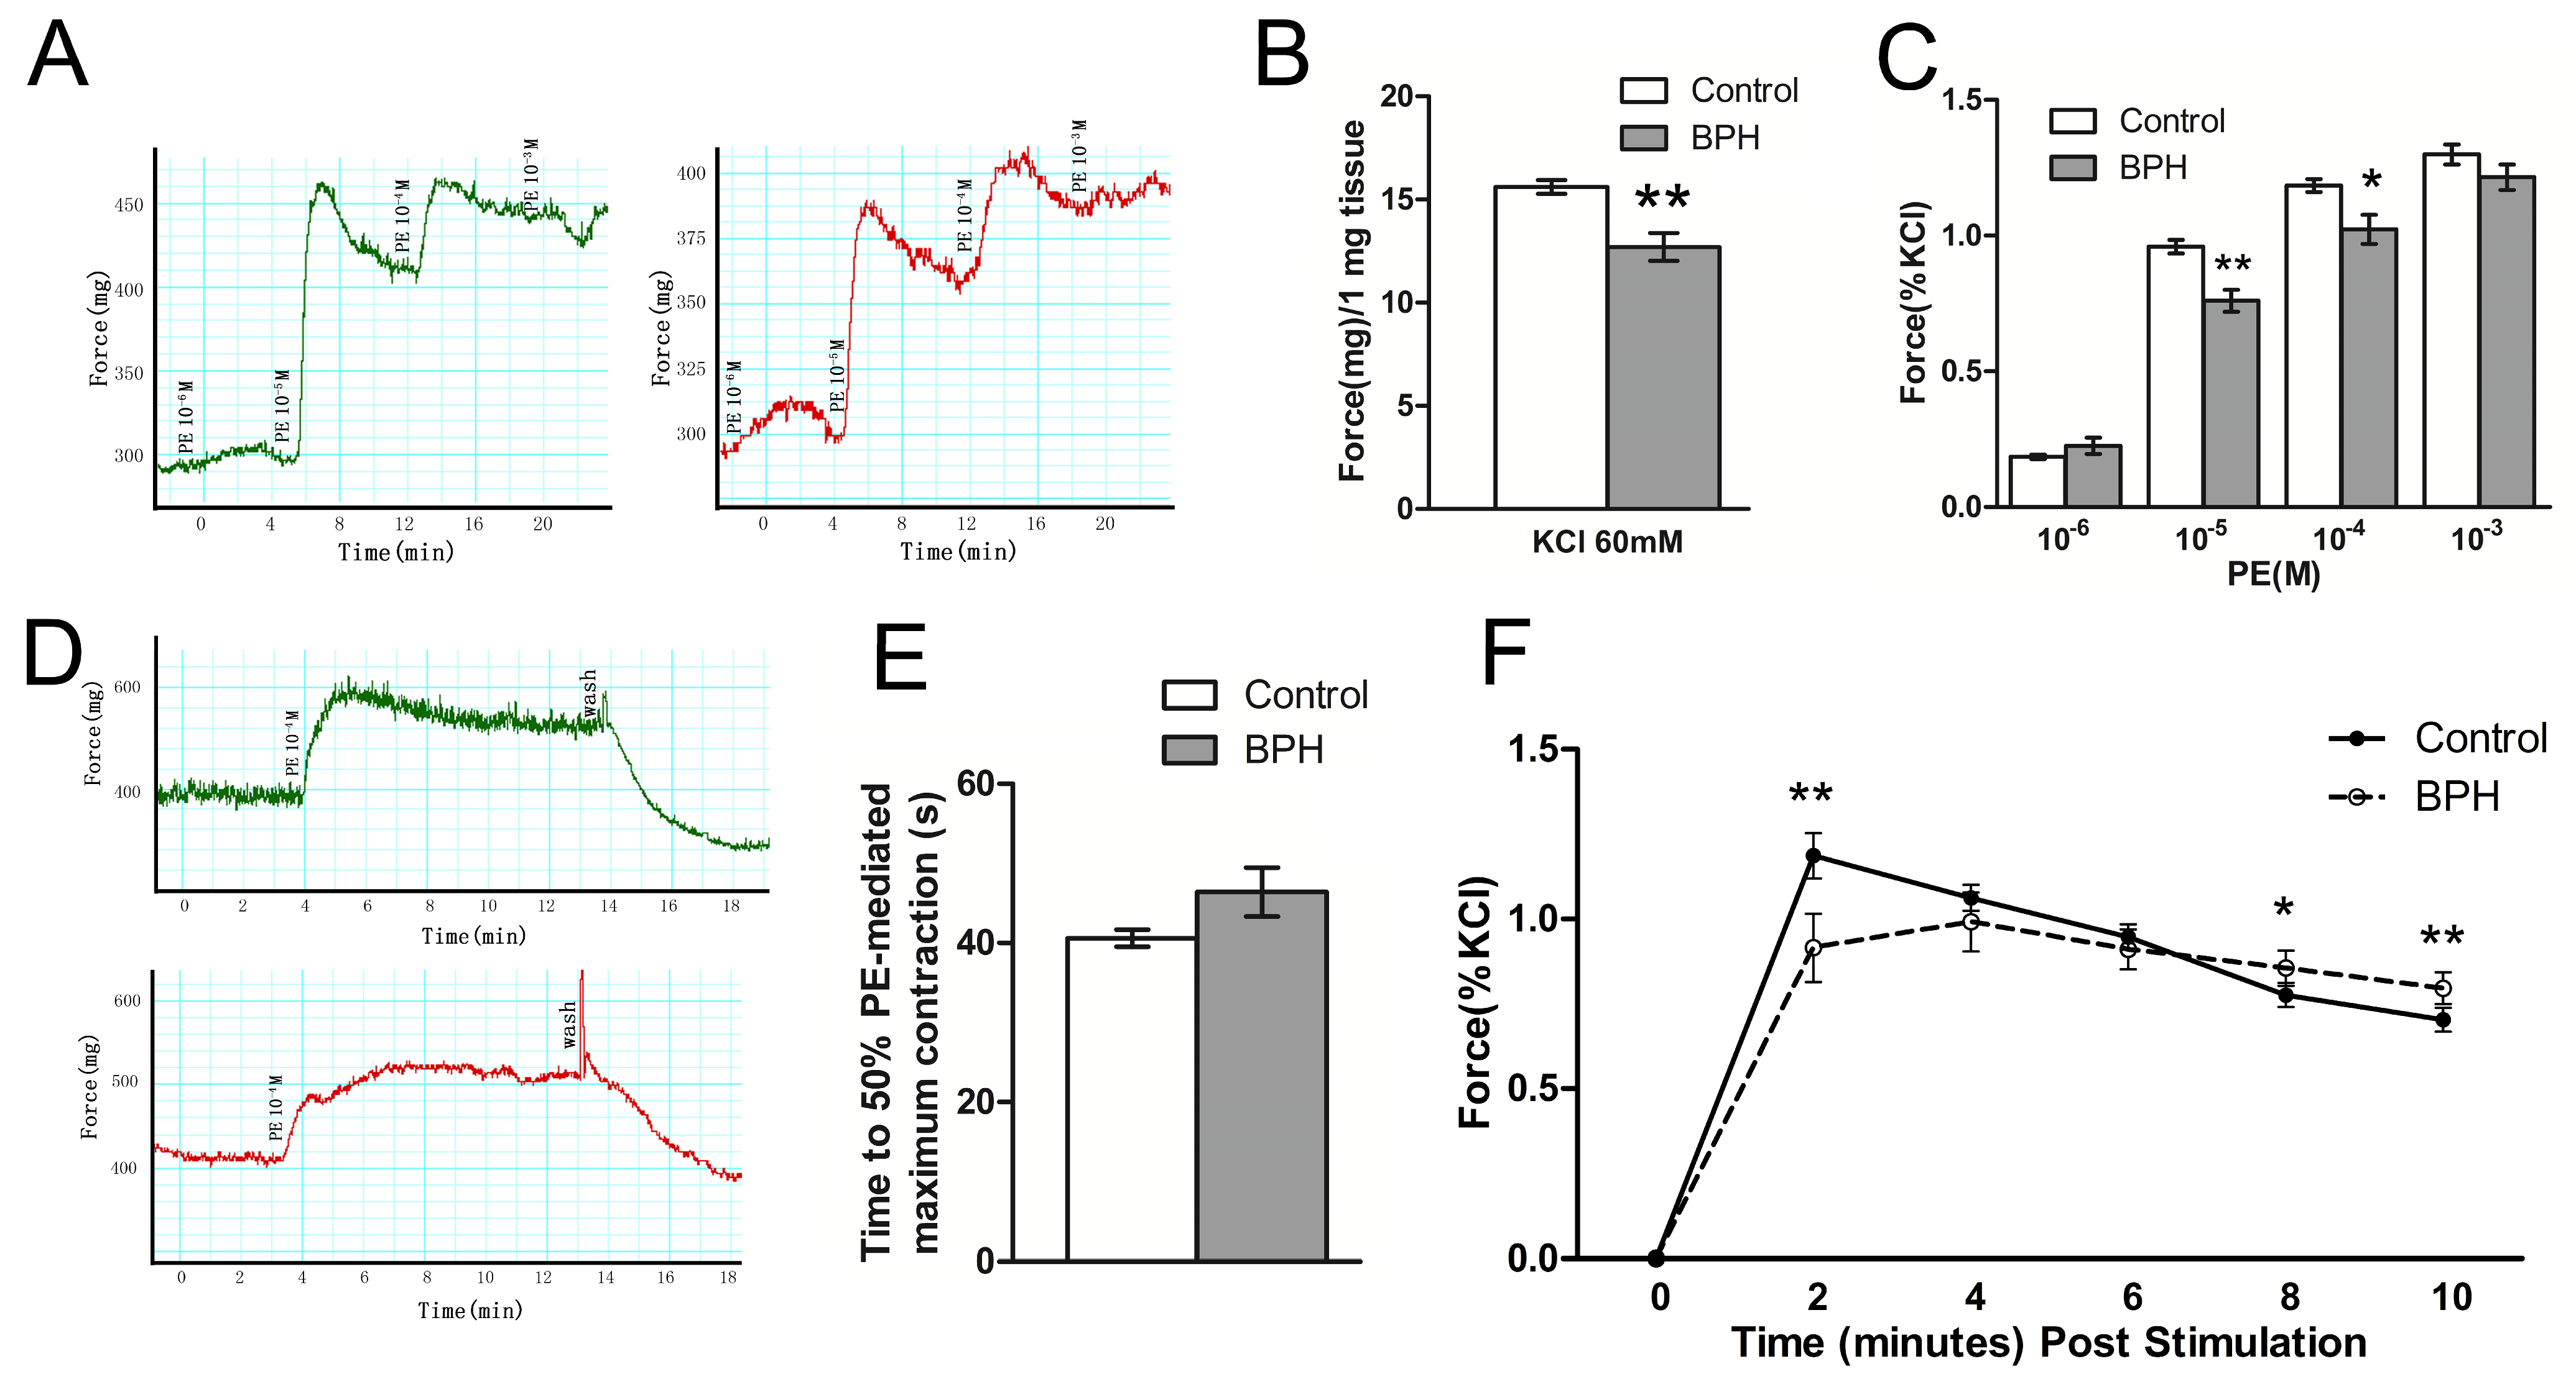
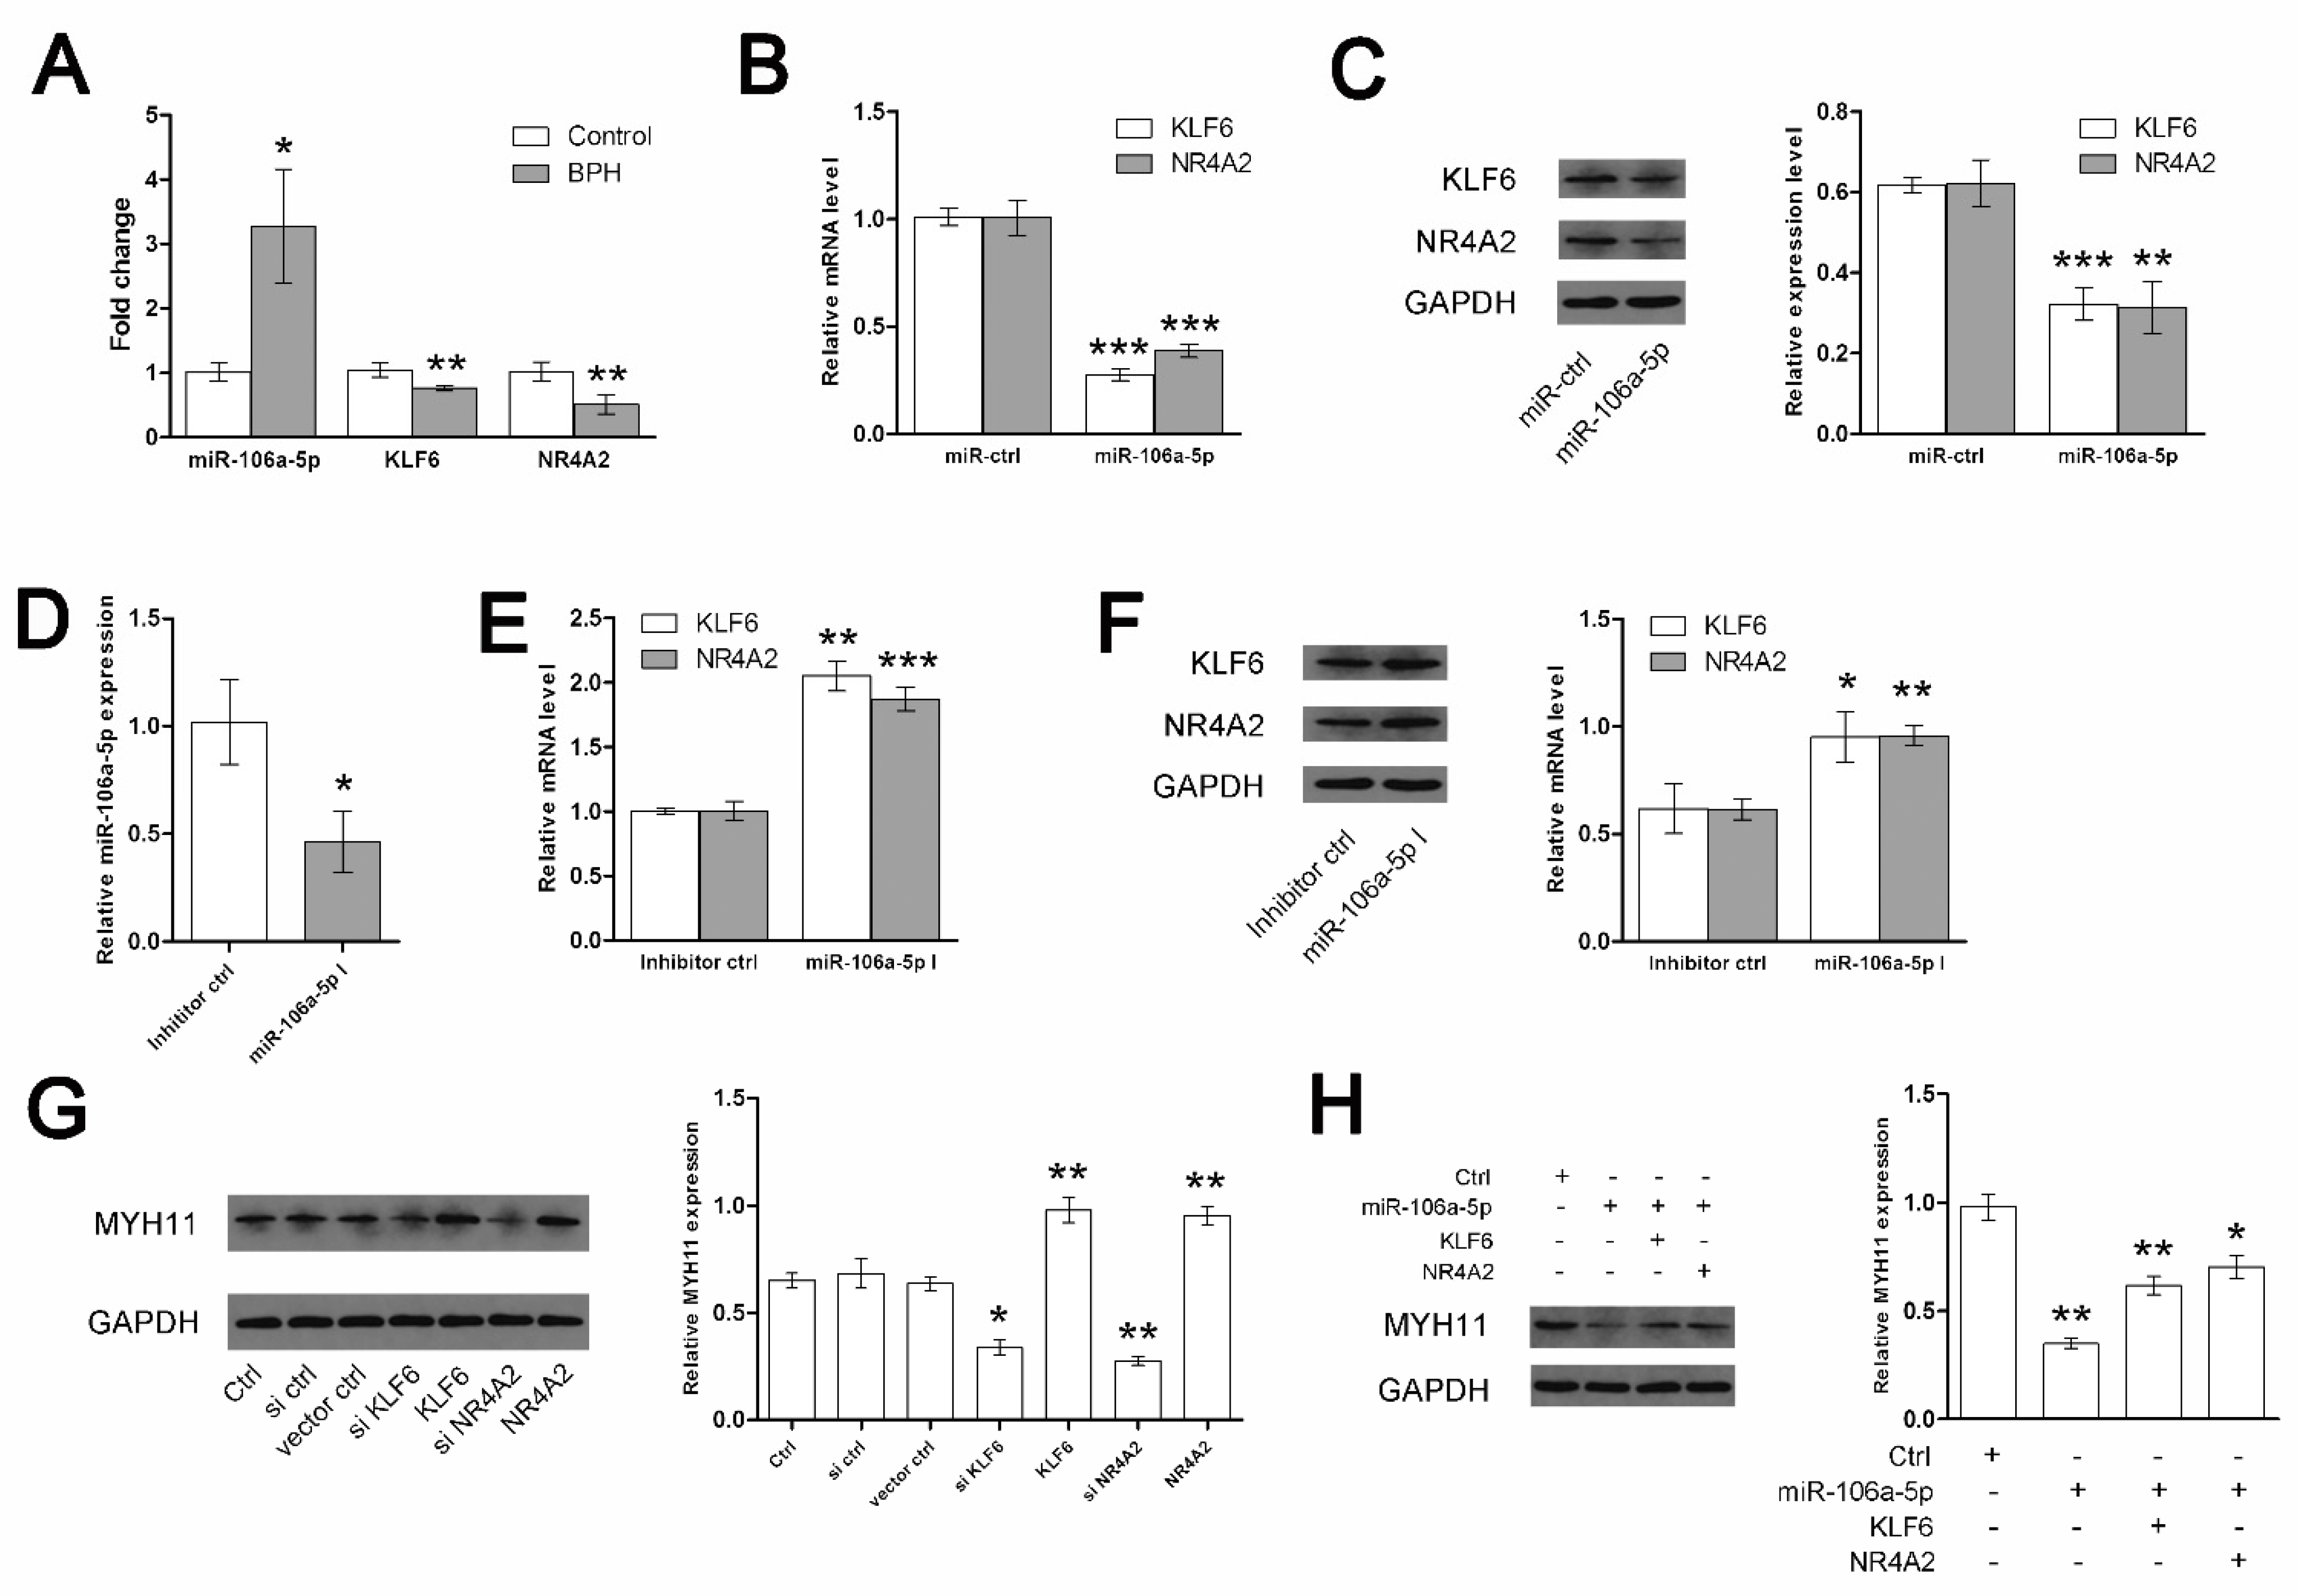
3. Results
4. Discussion
5. Conclusions
Author Contributions
Funding
Institutional Review Board Statement
Informed Consent Statement
Data Availability Statement
Conflicts of Interest
References
- Buskin, A.; Singh, P.; Lorenz, O.; Robson, C.; Strand, D.W.; Heer, R. A Review of Prostate Organogenesis and a Role for iPSC-Derived Prostate Organoids to Study Prostate Development and Disease. Int. J. Mol. Sci. 2021, 22, 13097. [Google Scholar] [CrossRef] [PubMed]
- Pattabiraman, G.; Bell-Cohn, A.J.; Murphy, S.F.; Mazur, D.J.; Schaeffer, A.J.; Thumbikat, P. Mast cell function in prostate inflammation, fibrosis, and smooth muscle cell dysfunction. Am. J. Physiol. Renal. Physiol. 2021, 321, F466–F479. [Google Scholar] [CrossRef] [PubMed]
- Liu, Y.; Wang, R.; Huang, R.; Rutz, B.; Ciotkowska, A.; Tamalunas, A.; Hu, S.; Trieb, M.; Waidelich, R.; Strittmatter, F.; et al. Inhibition of growth and contraction in human prostate stromal cells by silencing of NUAK1 and -2, and by the presumed NUAK inhibitors HTH01-015 and WZ4003. Front. Pharmacol. 2023, 14, 1105427. [Google Scholar] [CrossRef] [PubMed]
- Spek, A.; Li, B.; Rutz, B.; Ciotkowska, A.; Huang, R.; Liu, Y.; Wang, R.; Strittmatter, F.; Waidelich, R.; Stief, C.G.; et al. Purinergic smooth muscle contractions in the human prostate: Estimation of relevance and characterization of different agonists. Naunyn Schmiedebergs Arch. Pharmacol. 2021, 394, 1113–1131. [Google Scholar] [CrossRef]
- Zhang, X.; Zang, N.; Wei, Y.; Yin, J.; Teng, R.; Seftel, A.; Disanto, M.E. Testosterone regulates smooth muscle contractile pathways in the rat prostate: Emphasis on PDE5 signaling. Am. J. Physiol. Endocrinol. Metab. 2012, 302, E243–E253. [Google Scholar] [CrossRef] [PubMed]
- Wang, L.; Chitano, P.; Seow, C.Y. Filament evanescence of myosin II and smooth muscle function. J. Gen. Physiol. 2021, 153, e202012781. [Google Scholar] [CrossRef] [PubMed]
- Li, M.; Li, S.; Rao, Y.; Cui, S.; Gou, K. Loss of smooth muscle myosin heavy chain results in the bladder and stomach developing lesion during foetal development in mice. J. Genet. 2018, 97, 469–475. [Google Scholar] [CrossRef] [PubMed]
- Chen, P.; Yin, J.; Guo, Y.M.; Xiao, H.; Wang, X.H.; DiSanto, M.E.; Zhang, X.H. The expression and functional activities of smooth muscle myosin and non-muscle myosin isoforms in rat prostate. J. Cell. Mol. Med. 2018, 22, 576–588. [Google Scholar] [CrossRef]
- Brozovich, F.V.; Nicholson, C.J.; Degen, C.V.; Gao, Y.Z.; Aggarwal, M.; Morgan, K.G. Mechanisms of Vascular Smooth Muscle Contraction and the Basis for Pharmacologic Treatment of Smooth Muscle Disorders. Pharmacol. Rev. 2016, 68, 476–532. [Google Scholar] [CrossRef]
- Sun, J.; Qiao, Y.N.; Tao, T.; Zhao, W.; Wei, L.S.; Li, Y.Q.; Wang, W.; Wang, Y.; Zhou, Y.W.; Zheng, Y.Y.; et al. Distinct Roles of Smooth Muscle and Non-muscle Myosin Light Chain-Mediated Smooth Muscle Contraction. Front. Physiol. 2020, 11, 593966. [Google Scholar] [CrossRef]
- Hammell, M.J.; Kachmar, L.; Balassy, Z.; Ijpma, G.; Lauzon, A.-M. Molecular-level evidence of force maintenance by smooth muscle myosin during LC20 dephosphorylation. J. Gen. Physiol. 2022, 154, e202213117. [Google Scholar] [CrossRef] [PubMed]
- Chen, P.; Xiao, H.; Huang, W.; Xu, D.Q.; Guo, Y.M.; Wang, X.; Wang, X.H.; DiSanto, M.E.; Zhang, X.H. Testosterone regulates myosin II isoforms expression and functional activity in the rat prostate. Prostate 2018, 78, 1283–1298. [Google Scholar] [CrossRef] [PubMed]
- Brito, C.; Sousa, S. Non-Muscle Myosin 2A (NM2A): Structure, Regulation and Function. Cells 2020, 9, 1590. [Google Scholar] [CrossRef] [PubMed]
- Dey, S.K.; Singh, R.K.; Chattoraj, S.; Saha, S.; Das, A.; Bhattacharyya, K.; Sengupta, K.; Sen, S.; Jana, S.S. Differential role of nonmuscle myosin II isoforms during blebbing of MCF-7 cells. Mol. Biol. Cell 2017, 28, 1034–1042. [Google Scholar] [CrossRef] [PubMed]
- Zhang, W.; Gunst, S.J. S100A4 is activated by RhoA and catalyses the polymerization of non-muscle myosin, adhesion complex assembly and contraction in airway smooth muscle. J. Physiol. 2020, 598, 4573–4590. [Google Scholar] [CrossRef] [PubMed]
- He, W.; Wang, X.; Zhan, D.; Li, M.; Wang, Q.; Liu, J.; Liu, D.; Fu, X.; Qian, Q.; Li, Y.; et al. Changes in the expression and functional activities of Myosin II isoforms in human hyperplastic prostate. Clin. Sci. 2021, 135, 167–183. [Google Scholar] [CrossRef] [PubMed]
- Zhang, W.; Zang, N.; Jiang, Y.; Chen, P.; Wang, X.; Zhang, X. Upregulation of Phosphodiesterase type 5 in the Hyperplastic Prostate. Sci. Rep. 2015, 5, 17888. [Google Scholar] [CrossRef] [PubMed]
- Zhang, N.; Li, Z.; Bai, F.; Ji, N.; Zheng, Y.; Li, Y.; Chen, J.; Mao, X. MicroRNA expression profiles in benign prostatic hyperplasia. Mol. Med. Rep. 2018, 17, 3853–3858. [Google Scholar] [CrossRef] [PubMed]
- Xiao, H.; Jiang, Y.; He, W.; Xu, D.; Chen, P.; Liu, D.; Liu, J.; Wang, X.; DiSanto, M.E.; Zhang, X. Identification and functional activity of matrix-remodeling associated 5 (MXRA5) in benign hyperplastic prostate. Aging 2020, 12, 8605–8621. [Google Scholar] [CrossRef]
- Janky, R.; Verfaillie, A.; Imrichova, H.; Van de Sande, B.; Standaert, L.; Christiaens, V.; Hulselmans, G.; Herten, K.; Naval Sanchez, M.; Potier, D.; et al. iRegulon: From a gene list to a gene regulatory network using large motif and track collections. PLoS Comput. Biol. 2014, 10, e1003731. [Google Scholar] [CrossRef]
- Cao, Y.; Zhang, H.; Tu, G.L.; Tian, Y.; Tang, X.H.; Tang, L.; Luo, M.X.; Wang, Y.D.; Wang, Z.; Xia, S.J.; et al. The Symptoms of Benign Prostatic Hyperplasia Patients with Stromal-Dominated Hyperplasia Nodules May Be Associated with Prostate Fibrosis. Int. J. Gen. Med. 2023, 16, 1181–1191. [Google Scholar] [CrossRef] [PubMed]
- Yu, E.Y.; Siegal, J.A.; Meyer, G.E.; Ji, X.R.; Ni, X.Z.; Brawer, M.K. Histologic differences in benign prostate hyperplasia between Chinese and American men. Prostate 1997, 31, 175–179. [Google Scholar] [CrossRef]
- Thiyagarajan, M.; Kaul, C.L.; Ramarao, P. Enhancement of alpha-adrenoceptor-mediated responses in prostate of testosterone-treated rat. Eur. J. Pharmacol. 2002, 453, 335–344. [Google Scholar] [CrossRef] [PubMed]
- Kajiwara, S.; Ishii, K.; Sasaki, T.; Kato, M.; Nishikawa, K.; Kanda, H.; Arima, K.; Watanabe, M.; Sugimura, Y. Castration-induced stromal remodeling disrupts the reconstituted prostate epithelial structure. Lab. Investig. 2020, 100, 670–681. [Google Scholar] [CrossRef] [PubMed]
- Liu, J.; Zhang, J.; Fu, X.; Yang, S.; Li, Y.; Liu, J.; DiSanto, M.E.; Chen, P.; Zhang, X. The Emerging Role of Cell Adhesion Molecules on Benign Prostatic Hyperplasia. Int. J. Mol. Sci. 2023, 24, 2870. [Google Scholar] [CrossRef] [PubMed]
- Andriole, G.; Bruchovsky, N.; Chung, L.W.; Matsumoto, A.M.; Rittmaster, R.; Roehrborn, C.; Russell, D.; Tindall, D. Dihydrotestosterone and the prostate: The scientific rationale for 5alpha-reductase inhibitors in the treatment of benign prostatic hyperplasia. J. Urol. 2004, 172, 1399–1403. [Google Scholar] [CrossRef] [PubMed]
- Isaacs, J.T. Prostate stem cells and benign prostatic hyperplasia. Prostate 2008, 68, 1025–1034. [Google Scholar] [CrossRef] [PubMed]
- Cao, D.; Sun, R.; Peng, L.; Li, J.; Huang, Y.; Chen, Z.; Chen, B.; Li, J.; Ai, J.; Yang, L.; et al. Immune Cell Proinflammatory Microenvironment and Androgen-Related Metabolic Regulation During Benign Prostatic Hyperplasia in Aging. Front. Immunol. 2022, 13, 842008. [Google Scholar] [CrossRef] [PubMed]
- Lin, V.K.; Wang, D.; Lee, I.L.; Vasquez, D.; Fagelson, J.E.; McConnell, J.D. Myosin heavy chain gene expression in normal and hyperplastic human prostate tissue. Prostate 2000, 44, 193–203. [Google Scholar] [CrossRef]
- Yuen, S.L.; Ogut, O.; Brozovich, F.V. Nonmuscle myosin is regulated during smooth muscle contraction. Am. J. Physiol. Heart Circ. Physiol. 2009, 297, H191–H199. [Google Scholar] [CrossRef]
- Singh, K.; Kim, A.B.; Morgan, K.G. Non-muscle myosin II regulates aortic stiffness through effects on specific focal adhesion proteins and the non-muscle cortical cytoskeleton. J. Cell. Mol. Med. 2021, 25, 2471–2483. [Google Scholar] [CrossRef]
- Joseph, D.B.; Henry, G.H.; Malewska, A.; Reese, J.C.; Mauck, R.J.; Gahan, J.C.; Hutchinson, R.C.; Malladi, V.S.; Roehrborn, C.G.; Vezina, C.M.; et al. Single-cell analysis of mouse and human prostate reveals novel fibroblasts with specialized distribution and microenvironment interactions. J. Pathol. 2021, 255, 141–154. [Google Scholar] [CrossRef] [PubMed]
- Zhao, M.; Guo, J.; Gao, Q.H.; Wang, H.; Wang, F.; Wang, Z.R.; Liu, S.J.; Deng, Y.J.; Zhao, Z.W.; Zhang, Y.Y.; et al. Relationship between pyroptosis-mediated inflammation and the pathogenesis of prostate disease. Front. Med. 2023, 10, 1084129. [Google Scholar] [CrossRef] [PubMed]
- McNeal, J. Pathology of benign prostatic hyperplasia. Insight into etiology. Urol. Clin. N. Am. 1990, 17, 477–486. [Google Scholar] [CrossRef]
- Castro, P.; Giri, D.; Lamb, D.; Ittmann, M. Cellular senescence in the pathogenesis of benign prostatic hyperplasia. Prostate 2003, 55, 30–38. [Google Scholar] [CrossRef]
- Sanches, B.D.A.; Maldarine, J.S.; Vilamaior, P.S.L.; Felisbino, S.L.; Carvalho, H.F.; Taboga, S.R. Stromal cell interplay in prostate development, physiology, and pathological conditions. Prostate 2021, 81, 926–937. [Google Scholar] [CrossRef]
- Tamalunas, A.; Sauckel, C.; Ciotkowska, A.; Rutz, B.; Wang, R.; Huang, R.; Li, B.; Stief, C.G.; Gratzke, C.; Hennenberg, M. Inhibition of human prostate stromal cell growth and smooth muscle contraction by thalidomide: A novel remedy in LUTS? Prostate 2021, 81, 377–389. [Google Scholar] [CrossRef]
- Tamalunas, A.; Sauckel, C.; Ciotkowska, A.; Rutz, B.; Wang, R.; Huang, R.; Li, B.; Stief, C.G.; Gratzke, C.; Hennenberg, M. Lenalidomide and pomalidomide inhibit growth of prostate stromal cells and human prostate smooth muscle contraction. Life Sci. 2021, 281, 119771. [Google Scholar] [CrossRef]


| Target Gene | Primer | Primer Sequence | |
|---|---|---|---|
| Rat | SM-1/-2 | Forward | 5′-GCTGGAAGAGGCCGAGGAGGAATC-3′ |
| Reverse | 5′-GAACCATCTGTGTTTTCAATAA-3′ | ||
| SM-A/-B | Forward | 5′-GGCCTCTTCTGCGTGGTGGTC-3′ | |
| Reverse | 5′-TTTGCCGAATCGTGAGGAGTTGTC-3′ | ||
| MLC17a/17b | Forward | 5′-GAGAGTGGCCAAGAACAA-3′ | |
| Reverse | 5′-CAGCCATTCAGCACCATGCG-3′ | ||
| MHC | Forward | 5′-TTTGCCATTGAGGCCTTAGG-3′ | |
| Reverse | 5′-GTTCACACGGCTGAGAATCCA-3′ | ||
| NMMHC-A | Forward | 5′-CTGAACGACAACATTGCCA-3′ | |
| Reverse | 5′-GATTCGATCCACATCCTTCC-3′ | ||
| NMMHC-B | Forward | 5′-TGAGAAGCCGCCACACATC-3′ | |
| Reverse | 5′-CACCCGTGCAAAGAATCGA-3′ | ||
| NMMHC-C | Forward | 5′-ACTCTGGGCTCATTTATACCT-3′ | |
| Reverse | 5′-CCTCCGTGTAGATAGGCAG-3′ | ||
| GAPDH | Forward | 5′-AACTCCCATTCTTCCACCT-3′ | |
| Reverse | 5′-TTGTCATACCAGGAAATGAGC-3′ | ||
| Human | SM-1/-2 | Forward | 5′-GCTGGAGGAGGCAGAGGAGGAGTC-3′ |
| Reverse | 5′-GAACCATCTGCATTTTCAATAA-3′ | ||
| SM-A/-B | Forward | 5′-GGCCTCTTCTGCGTGGTGGTC-3′ | |
| Reverse | 5′-TTTGCCGAATCGTGAGGAGTTGTC-3′ | ||
| MLC17a/17b | Forward | 5′-GAGAGTGGCCAAGAACAA-3′ | |
| Reverse | 5′-CAGCCATTCAGCACCATGCG-3′ | ||
| MHC | Forward | 5′-CAGTTGTTAGCCGAGGAGAAA-3′ | |
| Reverse | 5′-GCTTTGAGCATTTTGTTGGTC-3′ | ||
| NMMHC-A | Forward | 5′-GTGCACTGGTGAATCTGGAG-3′ | |
| Reverse | 5′-TGGTCCTTCTTGCTCTTGTG-3′ | ||
| NMMHC-B | Forward | 5′-TCTTGGGATGAATGTGATGG-3′ | |
| Reverse | 5′-TATTGATGCGATGAACGAGC-3′ | ||
| NMMHC-C | Forward | 5′-CAGCCGTCAAATGCAAACC-3′ | |
| Reverse | 5′-ACCCTCCTCAGCCTCAAGGT-3′ | ||
| GAPDH | Forward | 5′-TCAAGATCATCAGCAATGCC-3′ | |
| Reverse | 5′-CGATACCAAAGTTGTCATGGA-3′ | ||
| Target Protein | Name of Antibody | Manufacturer, Catalog | Species Raised in: Monoclonal or Polyclonal | Reactivity | Dilution Used |
|---|---|---|---|---|---|
| MHC | MYH11 antibody | Santa Cruz, sc-6956 | Mouse monoclonal | Mouse, rat, human | 1:1000 (WB), 1:100 (IF) |
| NMMHC-A | Anti-non-muscle Myosin IIA antibody | Abcam, ab75590 | Rabbit polyclonal | Mouse, Rat, Human | 1:1000 (WB), 1:100 (IF) |
| NMMHC-B | Anti-non-muscle Myosin IIB antibody | Abcam, ab230823 | Rabbit monoclonal | Mouse, Rat, Human | 1:1000 (WB), 1:100 (IF) |
| NMMHC-C | Anti-Myh14 antibody | Abcam, ab232897 | Rabbit polyclonal | Rat, Human | 1:1000 (WB), 1:100 (IF) |
| KLF6 | Anti-KLF6 antibody | Abcam, ab241385 | Rabbit polyclonal | Human | 1:1000 (WB), 1:100 (IF) |
| NR4A2 | Nurr1 antibody (447C2a) | Santa Cruz, sc-81345 | Mouse monoclonal | Human | 1:1000 (WB), 1:100 (IF) |
| GAPDH | GAPDH antibody (G-9) | Santa Cruz, sc-365062 | Mouse monoclonal | Mouse, Rat, Human | 1:1000 (WB) |
| Group | Body Weight (g) | Ventral Prostate Weight (mg) | Seminal Vesicles Weight (mg) | Prostate Index | T Level (ng/mL) |
|---|---|---|---|---|---|
| Control | 429.8 (32.7) | 778.3 (135.3) | 1001.8 (288.5) | 1.8 (0.3) | 4.4 (0.4) |
| BPH | 387.2 (13.7) ** | 1231.3 (131.4) ** | 2483.9 (360.6) ** | 3.2 (0.3) ** | 6.2 (0.5) * |
| Mean yrs age (range) | 71.2 (51–84) |
| Mean mL PV (range) | 61.5 (50.5–105.4) |
| No. pathology (%) | |
| epithelial hyperplasia | 18 (60.0) |
| Stromal hyperplasia | 5 (16.7) |
| epithelial-stromal hyperplasia | 7 (23.3) |
| No. hypertension (%) | 6 (20.0) |
| No. diabetes (%) | 4 (13.3) |
| No. surgery type (%) | |
| open | 5 (16.7) |
| TURP | 16 (53.3) |
| TUVP | 9 (30.0) |
| No. AUR (%) | 7 (23.3) |
| Mean mL PVR (range) | 117.5 (0–548) |
| Mean mL/s Qmax (range) | 7.4 (2.2–13.5) |
| Mean IPSS (range) | 22.1 (12–30) |
| Factors | PVR | AUR | Qmax | IPSS | ||||
|---|---|---|---|---|---|---|---|---|
| Standardized Coefficient | Adjusted by Age, PV, Pathology, Hypertension, and Diabetes | Odds Ratio | Adjusted by Age, PV, Pathology, Hypertension, and Diabetes | Standardized Coefficient | Adjusted by Age, PV, Pathology, Hypertension, and Diabetes | Standardized Coefficient | Adjusted by Age, PV, Pathology, Hypertension, and Diabetes | |
| Age | −0.538 * | - | 1.190 | - | 0.041 | - | 0.612 ** | - |
| PV | 0.589 * | - | 1.034 | - | −0.036 | - | 0.075 | - |
| Patho EpithelialStromal | −0.076 | - | 1.923 | - | −0.289 | - | −0.236 | - |
| 0.365 | - | 0.792 | - | 0.364 | - | 0.118 | - | |
| Hypertension | −0.256 | - | 1.900 | - | −0.175 | - | 0.189 | - |
| Diabetes | −0.154 | - | 4.200 | - | 0.364 | - | 0.287 | - |
| SM-1 percent | −0.047 | 0.152 | 9.812 | 132.426 | −0.107 | −0.232 | 0.624 ** | 0.628 *** |
| SM-A percent | 0.309 | 0.379 * | 0.008 | 17.295 | −0.641 * | −0.734 * | 0.050 | 0.135 |
| MLC17b percent | 0.197 | 0.037 | 65.347 | 577.897 | −0.381 | −0.368 | 0.080 | 0.209 |
| MHC | −0.353 | −0.510 | 0.034 | 0.016 | −0.217 | −0.434 | −0.439 * | −0.604 ** |
| NMMHC-A | 0.240 | 0.082 | 0.292 | 0.325 | 0.239 | −0.010 | −0.109 | 0.310 |
| NMMHC-B | 0.580 * | 0.563 | 0.106 | 0.106 | −0.113 | −0.084 | 0.598 ** | 0.446 |
| NMMHC-C | 0.580 * | 0.542 | 0.259 | 0.350 | 0.277 | 0.202 | −0.384 | −0.168 |
Disclaimer/Publisher’s Note: The statements, opinions and data contained in all publications are solely those of the individual author(s) and contributor(s) and not of MDPI and/or the editor(s). MDPI and/or the editor(s) disclaim responsibility for any injury to people or property resulting from any ideas, methods, instructions or products referred to in the content. |
© 2024 by the authors. Licensee MDPI, Basel, Switzerland. This article is an open access article distributed under the terms and conditions of the Creative Commons Attribution (CC BY) license (https://creativecommons.org/licenses/by/4.0/).
Share and Cite
Wang, X.; He, W.; Chen, H.; Yang, R.; Su, H.; DiSanto, M.E.; Zhang, X. Alteration of the Expression and Functional Activities of Myosin II Isoforms in Enlarged Hyperplastic Prostates. J. Pers. Med. 2024, 14, 381. https://doi.org/10.3390/jpm14040381
Wang X, He W, Chen H, Yang R, Su H, DiSanto ME, Zhang X. Alteration of the Expression and Functional Activities of Myosin II Isoforms in Enlarged Hyperplastic Prostates. Journal of Personalized Medicine. 2024; 14(4):381. https://doi.org/10.3390/jpm14040381
Chicago/Turabian StyleWang, Xiao, Weixiang He, Hui Chen, Rui Yang, Hongmei Su, Michael E. DiSanto, and Xinhua Zhang. 2024. "Alteration of the Expression and Functional Activities of Myosin II Isoforms in Enlarged Hyperplastic Prostates" Journal of Personalized Medicine 14, no. 4: 381. https://doi.org/10.3390/jpm14040381
APA StyleWang, X., He, W., Chen, H., Yang, R., Su, H., DiSanto, M. E., & Zhang, X. (2024). Alteration of the Expression and Functional Activities of Myosin II Isoforms in Enlarged Hyperplastic Prostates. Journal of Personalized Medicine, 14(4), 381. https://doi.org/10.3390/jpm14040381