Abstract
Interstitial fibrosis and tubular atrophy (IF/TA) after kidney transplantation causes a chronic deterioration of graft function. IF/TA can be diagnosed by means of a graft biopsy, which is a necessity as non-invasive diagnostic methods are unavailable. In this study, we identified IF/TA-related differentially expressed genes (DEGs) through next-generation sequencing using peripheral blood mononuclear cells. Blood samples from kidney transplant recipients undergoing standard immunosuppressive therapy (tacrolimus/mycophenolate mofetil or mycophenolate sodium/steroid) and diagnosed as IF/TA (n = 41) or normal (controls; n = 41) at their one-year protocol biopsy were recruited between January of 2020 and August of 2020. DEGs were derived through mRNA sequencing and validated by means of a quantitative real-time polymerase chain reaction. We identified 34 DEGs related to IF/TA. ADAMTS2, PLIN5, CLDN9, and KCNJ15 demonstrated a log2(fold change) of >1.5 and an area under the receiver operating characteristic curve (AUC) value of >0.6, with ADAMTS2 showing the largest AUC value and expression levels, which were 3.5-fold higher in the IF/TA group relative to that observed in the control group. We identified and validated DEGs related to IF/TA progression at one-year post-transplantation. Specifically, we identified ADAMTS2 as a potential IF/TA biomarker.
1. Introduction
Organ failure is an emerging problem with the aging of society, and organ transplantation represents the optimal treatment for end-stage organ failure. Although technological developments and the use of immunosuppressive agents have decreased the incidence of acute rejection, chronic allograft nephropathy has become the primary cause of graft dysfunctions. Interstitial fibrosis and tubular atrophy (IF/TA) are collectively defined as a disease without a specific etiology [1] and are present in approximately 30% of patients one year after and in almost all patients ten years after kidney transplantation. In some patients, IF/TA develops early, possibly contributing to early graft dysfunction and serving as an indicator by which to predict allograft failure [2]. IF/TA is diagnosed through an invasive kidney biopsy after kidney transplantation. Although the biopsy performed in stable patients causes a low incidence of serious complications [3], there remains a risk of bleeding, and the process causes discomfort. Diagnosis through a biopsy also complicates an early diagnosis of IF/TA. Moreover, the mechanisms associated with IF/TA pathology have not yet been determined, resulting in a lack of effective diagnosis and treatment strategies. Therefore, identifying changes in the gene expressions associated with IF/TA onset and progression could provide a better understanding of the complex status related to IF/TA in kidney transplantation.
Altered levels of transcribed mRNA represent candidate biomarkers stemming from their ability to signal epigenetic changes based on environmental alterations, such as disease progression [4]. Numerous studies have attempted to identify mRNA biomarkers related to IF/TA after kidney transplantation.
Most previous studies have primarily focused on gene expression analysis with allograft tissue [5,6,7,8,9,10,11,12,13,14,15,16,17]. However, applying these findings to blood samples is challenging due to significant differences in gene expression profiles between biopsy tissue and blood samples [17,18,19]. Therefore, specific research targeting blood samples is necessary to identify blood biomarkers. While some gene expression studies have used blood samples [17,19,20], discrepancies in differentially expressed genes (DEGs) have been observed, and no previous study has performed whole mRNA sequencing on blood samples.
For instance, Mas et al. [17] collected peripheral blood mononuclear cells (PBMCs) from a chronic allograft nephropathy (CAN) group (n = 11) and a stable renal function group (n = 20). They used a quantitative real-time reverse transcription polymerase chain reaction (qRT-PCR) assessment to assess the expression levels of transforming growth factor β (TGF-β), the epidermal growth factor receptor (EGFR), and angiotensinogen (AGT). However, no significant differences were found in the expression levels of these genes in PBMC samples despite significant differences being observed using microarray analysis of allograft tissues. Similarly, Kurian et al. [19] collected PBMCs from kidney transplant recipients (n = 77) with different IF/TA grades (0, 1, 2, and 3). They used microarray analysis and identified 393 DEGs related to mild IF/TA and 63 DEGs related to moderate/severe IF/TA. The top network related to IF/TA was found to be associated with the immune response. Interestingly, their DEG profiles in blood samples were different from those in their earlier study [16] using allograft tissue samples. In another study, Matz et al. [20] collected whole blood samples from an IF/TA group (n = 33) and a stable graft function group (n = 40). They conducted RT-PCR analysis and found that chemokine interleukin (IL)-8 was downregulated in IF/TA patients.
Although there is strong evidence of an association between altered gene expression and IF/TA progression, their gene expression results relating to IF/TA were inconsistent. Furthermore, because these studies mainly analyzed gene expression outcomes in biopsy samples, their clinical applications are limited. On the other hand, PBMCs are widely used in both research and clinical applications. Additionally, there has been no next-generation sequencing (NGS) research analyzing the mRNA expression related to IF/TA. Unlike a microarray or a qPCR analysis, which tends to focus on specific genes, NGS allows for a broad survey of the gene-expression landscape. Therefore, in this study, we investigated possible IF/TA-related DEGs through the mRNA-sequencing of PBMCs derived from patients with and without IF/TA one year after their kidney transplant.
2. Materials and Methods
2.1. Study Population
We included 82 patients (aged: 18–70 years) who underwent a one-year protocol biopsy after receiving a kidney transplant at a tertiary teaching hospital in South Korea from 2015 to 2018. Exclusion criteria included patients who were enrolled in other clinical trials, including non-Korean individuals aged < 18 or >70, recipients of non-first kidney transplants, those with follow-up loss, patients with active infections during the one-year protocol biopsy, and patients diagnosed with malignant tumors after kidney transplantation. Additionally, patients with biopsy results differing from the one-year biopsy were excluded if additional biopsies were performed. Each diagnosis for allograft pathology was conducted according to the Banff classification [21]. Patients diagnosed as IF/TA only or IF/TA with borderline changes (suspicious acute T cell-mediated rejection) were included in the IF/TA group. Patients without any allograft rejections, including IF/TA or disease recurrence, were included in the control group. Demographic characteristics (age at transplant date, sex, body mass index [BMI] at transplant date, dialysis information, original disease, and postoperative days), kidney transplantation information (donor type and age), medication information, and biopsy information were collected. The estimated glomerular filtration rate (eGFR) using the CKD-EPI equation on the one-year protocol biopsy date and blood sampling date were collected to assess changes in kidney status between the two time points. This study was approved by the Institutional Review Board of Seoul National University Hospital (IRB No. 1904-094-1027) and conducted according to the recommendations of the Declaration of Helsinki. Informed consent was obtained from all participants.
2.2. Sample Preparation
The blood samples were collected between January 2020 and August 2020. Peripheral blood (10 mL) was collected in an EDTA tube (BD, Franklin Lakes, NJ, USA) during an outpatient visit and stored in a refrigerator. During transport, it was placed in an icebox to preserve the mRNA against heat degradation. Mononuclear cells were isolated from peripheral blood within 3 h of collection. A lymphocyte–separation medium (3 mL; MP Biomedicals, Solon, OH, USA) stored at room temperature was added to a 15-mL centrifuge tube, followed by the addition of 2 mL of phosphate-buffered saline (PBS) (Bioworld, Dublin, OH, USA) and 2 mL of blood. The tube was then centrifuged at 400× g for 30 min, after which the top layer was removed by aspiration, and the mononuclear cells were then transferred to a new 15-mL centrifuge tube. After adding 10 mL of PBS, a second tube was centrifuged at 400× g for 10 min, followed by an aspiration to remove the liquid phase. These steps were performed twice simultaneously in order to generate two pellets that were subsequently combined. The RNAlater reagent (150 µL; QIAGEN, Germantown, MD, USA) was then added to the pellet, which was stored at −70 °C. RNA was extracted from the mononuclear cells using a RiboPure-blood kit (RiboPure RNA Purification Kit, Blood, Thermo Fisher Scientific, Waltham, MA, USA). DNase (Invitrogen, Vilnius, Lithuania) was used to remove genomic DNA (gDNA).
2.3. mRNA-Sequencing
RNA purity was analyzed using a NanoDrop 8000 spectrophotometer (Thermo Fisher Scientific), and the total RNA integrity was determined according to the RNA integrity number (RIN) using a 2100 Bioanalyzer instrument (Agilent Technologies, Santa Clara, CA, USA). A RIN exceeding 7 and a 28S/18S rRNA ratio exceeding 1.5 were set as acceptable levels. Successful gDNA removal was verified using a Bioanalyzer. mRNA-sequencing libraries were prepared using the Truseq stranded mRNA library prep kit (Illumina, San Diego, CA, USA) according to the manufacturer’s instructions. mRNA was purified and fragmented from total RNA (1 μg) using Oligo(dT) magnetic beads, which were then primed and cleaved using random hexamers. RNA fragments were reverse-transcribed into first-strand cDNA using reverse transcriptase, with a single ‘A’ nucleotide added to the cDNA fragments, followed by an adaptor ligation. The fragments were amplified by PCR, and the quality of the cDNA libraries was verified by capillary electrophoresis (2100 Bioanalyzer, Agilent Technologies). Clustering was performed in a flow cell using a cBot automated cluster generation system (Illumina), after which sequencing was performed at a 2 × 100-bp read length using a Novaseq 6000 sequencing system (Illumina). mRNA-sequencing was performed at a DNA Link (Seoul, Republic of Korea). mRNA-sequencing data were submitted to NCBI’s Gene Expression Omnibus database (GSE218048).
2.4. DEG Analysis
Reads were mapped to the reference genome using Tophat (v2.0.13, RRID:SCR_013035) [22], and DEGs were derived from aligned results using Cuffdiff (v2.2.1, RRID:SCR_001647) [23,24]. A geometric method was used for library normalization, and a pooled method was utilized for dispersion estimation. Genes that only contained enough reads with a raw read count of 10 or higher levels were extracted. Genes satisfying the condition of |log2(fold change)| ≥ 1 were selected. The cut-off was set at a false discovery rate (FDR)-adjusted p-value (q-value) of <0.1. For all the genes, log2(fold change) and log10(q-value) are drawn in a volcano plot.
2.5. Ontology Analysis
For ontology analysis, genes satisfying the condition |log2(fold change)| ≥ 1 were subjected to a Database for Annotation, Visualization, and Integrated Discovery (DAVID) (RRID:SCR_001881) [25] analysis, with “disease”, “gene ontology”, and “pathway” categories selected [26]. The cut-off for the Expression Analysis Systematic Explorer (EASE) score [27] was set to 1, and functional annotations for each category were generated.
2.6. Protein–Protein Interaction (PPI) Network Analysis
The PPI network analysis for significant DEGs was conducted using the STRING database (https://string-db.org/) (accessed on 11 July 2023) [28]. The minimum required interaction score was set as 0.4.
2.7. qPCR Validation of the Gene-Expression Profiles
To validate the mRNA-sequencing results, qPCR was performed on interested genes. The primer/TaqMan probe combinations for each target sequence were purchased from Thermo Fisher Scientific (Table S1). cDNA was produced using a Superscript II RT-PCR system (Invitrogen, Karlsruhe, Germany) according to the manufacturer’s instructions. The comparative Ct method was used to calculate the relative gene expression levels with glyceraldehyde 3-phosphate dehydrogenase (GAPDH) used as endogenous control [29]. Relative gene expression levels were determined using the 2−ΔΔCt method.
2.8. Statistical Analysis
Patient demographics were presented as the frequency (%), mean ± standard deviation (SD), or median (range). For continuous variables, a t-test or the Wilcoxon rank sum test was performed depending on the degree of normality. For non-continuous variables, a chi-squared test or Fisher’s exact test was used. A paired t-test was used to assess changes in eGFR between the biopsy and blood sampling dates. In the case of multiple group comparisons, an analysis of variance (ANOVA) or the Kruskal–Wallis test with Dunn’s multiple comparisons was performed.
To evaluate the discriminatory power of DEGs as biomarkers, we calculated the area under the receiver operating characteristic curve (AUC) values. R (v4.0.3) was used for the statistical analyses, and p < 0.05 was considered statistically significant.
The association between the expression levels of the most important DEGs and patient clinicopathological factors (age, BMI, eGFR at one-year protocol biopsy, eGFR at blood sampling, sex, dialysis type, original disease, and donor type) was analyzed using a multiple linear regression model with backward elimination. Additionally, the relationship between IF/TA and the expression of the most important DEGs, along with patient clinicopathological factors, was examined using multiple logistic regression with backward elimination.
To enhance the predictability of DEGs for IF/TA, AUC was analyzed for panels of DEGs that exhibited a log2(fold change) > 1.5 and AUC values > 0.6. Moreover, the AUC for the model, including DEGs and clinicopathological factors, was calculated. Furthermore, a subgroup analysis using qPCR was conducted by dividing the patients into two groups: an early blood collection group consisting of those who were within two years of their transplant and a late blood collection group consisting of those more than two years after their transplant.
3. Results
3.1. Baseline Clinical Characteristics of Patients
Figure 1 shows the flow chart of patient enrollment. Table 1 shows the baseline characteristics of the IF/TA group (n = 41) and the control group (n = 41). The clinicopathological features for IF/TA patients and controls are given in Table S2. The median (range) ages of the IF/TA and control groups were 50 (27–67) years and 52 (20–68) years, respectively (p = 0.94), with the male proportions of each group at 51.2% and 61.0%, respectively (p = 0.50). The proportion of deceased donors was higher in the IF/TA group, although the donor type did not differ between the groups (p = 0.06). At the time of transplantation, all patients were on triple therapy with tacrolimus, mycophenolate mofetil, or mycophenolate sodium, and a steroid. Thirty-seven (90.2%) in the IF/TA group and 35 (85.4%) in the control group were maintaining triple therapy upon their one-year protocol biopsy. The mean of the differences in eGFR between the date of biopsy and blood collection was 0.09 (p = 0.92), indicating that kidney status did not change significantly between these two time points. The median time between biopsy and sampling was 597 (52–1597) days. Additionally, the distributions of BMI, dialysis type, original disease, donor type, donor age, and postoperative days did not differ between the groups.
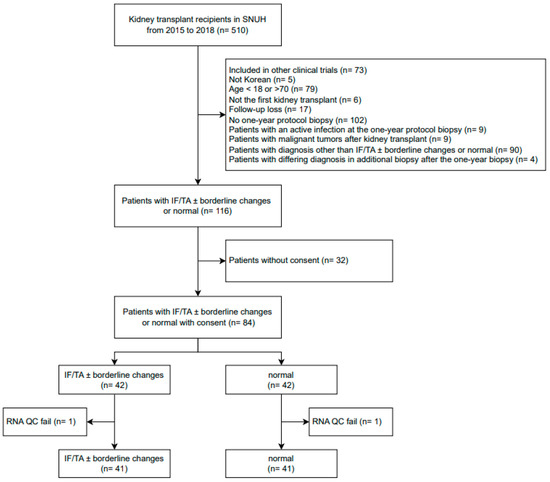
Figure 1.
Flow chart of patient enrollment. SNUH, Seoul national university hospital; IF/TA, interstitial fibrosis and tubular atrophy; QC, quality control.

Table 1.
Baseline characteristics of IF/TA patients (n = 41) and controls (n = 41) at their one-year protocol biopsy after kidney transplant.
3.2. DEGs Related to IF/TA
The mean of the total reads count was 63,480,861 (39,039,570–88,876,806), and the mean of the mapping rate to the reference genome was 94.92%. A density plot and a box plot of the FPKM distribution are shown in Figure S1, which indicates there were no batch effects or outlier samples. Figure 2 shows a volcano plot of the gene expression levels. The expression values of 34 genes differed by more than two-fold, satisfying the q-value threshold (<0.1). All DEGs showed a higher expression level in the IF/TA group relative to that in the control group (Table 2, Figure 3). Among the 34 DEGs, disintegrin and metalloproteinase with thrombospondin motifs 2 (ADAMTS2) showed the highest AUC value (AUC = 0.77; 95% confidence interval: 0.66–0.87), and the average ADAMTS2 expression was 3.5-fold higher in the IF/TA group compared to the control group. Figure S2 shows the ROC curves of all DEG which showed a log2(fold change) of >1.5 and AUC values of >0.6. In the further analysis of ADAMTS2 expression, when dividing patients by their ci and ct scores and IF/TA grades, we observed that ADAMTS2 expression levels increased as the score increased. However, these differences were not statistically significant (Figure 3c–e).
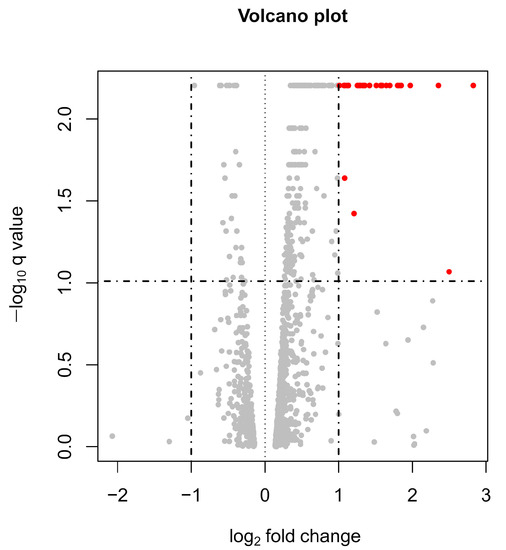
Figure 2.
Volcano plot of gene expression levels in PBMCs from IF/TA patients (n = 41) and controls (n = 41) at their one-year protocol biopsy after kidney transplant. The X-axis represents the fold change in the mRNA expression level in the IF/TA group relative to the control group, and the Y-axis represents the q-value (FDR-adjusted p-value). Each point represents a gene. The dotted line indicates the cut-off value for a determination as a DEG (|fold change| > 2 and q-value < 0.1). Red dots indicate genes that satisfy the DEG criteria.
Table 2.
DEGs identified in IF/TA patients relative to controls at one-year protocol biopsy after kidney transplantation.
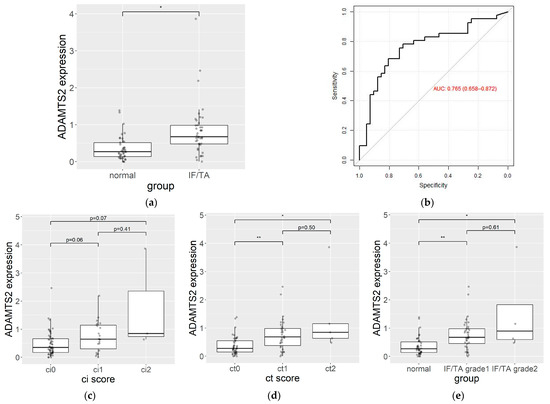
Figure 3.
(a) ADAMTS2 expression levels in PBMCs from IF/TA patients (n = 41) and controls (n = 41) at their one-year protocol biopsy after kidney transplant. Data represent the median and interquartile ranges of the log2(FPKM + 1). Dots represent individual data points. (b) ROC curve evaluating the sensitivity and specificity of ADAMTS2 as a biomarker of IF/TA. (c) ADAMTS2 expression level from ci0 (n = 57), ci1 (n = 22) and ci2 (n = 3). (d) ADAMTS2 expression level from ct0 (n = 43), ct1 (n = 34) and ct2 (n = 5). (e) ADAMTS2 expression level from normal (n = 41), IF/TA grade 1 (n = 37), and IF/TA grade 2 (n = 4). AUC, the area under the receiver operating characteristic curve; FPKM, fragments of transcript per kilobase per million reads; * p < 0.05, ** p < 0.001.
To examine the effects of patient clinicopathological factors on ADAMTS2 expression, a multiple regression analysis was conducted. After backward elimination, only recipient age showed a significant correlation with ADAMTS2 expression (coefficient = 0.02; 95% confidence interval: 0.005–0.025; p < 0.001).
To enhance the predictability of DEGs for IF/TA, we analyzed the AUC for panels of DEGs that exhibited a log2(fold change) > 1.5 and AUC values > 0.6. Additionally, a logistic regression with backward elimination was performed to adjust for clinicopathological factors. Consequently, recipient age was associated with IF/TA. We observed a slight improvement in the diagnostic performance of the ADAMTS2 and claudin 9 (CLDN9) panel, as well as the combined ADAMTS2 model with clinicopathological factors (Table 3, Figure S3).
Table 3.
AUC for panels of DEGs that exhibited a log2(fold change) > 1.5 and AUC values > 0.6 and the combined ADAMTS2 model with clinicopathological factors.
3.3. Ontology Analysis
Figure 4 shows the results of the ontology analysis. An analysis of downregulated genes revealed only one term (extracellular region), whereas an analysis of upregulated genes identified 128 terms. The term with the lowest EASE scores was termed an “anchored component of membrane”, and among the top 10 enriched ontology terms, ADAMTS2 was related to the “proteinaceous–extracellular matrix”. This pathway included alkaline phosphatase, biomineralization-associated (ALPL), matrix metalloproteinase 9 (MMP9), chitinase-3-like protein 1 (CHI3L1), and fibronectin 1 (FN1) among DEGs.
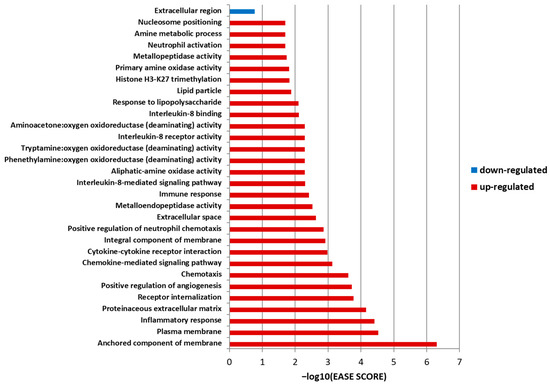
Figure 4.
Gene ontology results for IF/TA patients (n = 41) and controls (n = 41) at their one-year protocol biopsy after kidney transplantation. The X-axis represents the −log10(EASE score), and the Y-axis represents the annotation term. The Expression Analysis Systematic Explorer (EASE) score is a modified Fisher exact test in a gene ontology enrichment analysis. A blue bar indicates a term related to the downregulated genes, and red bars indicate the terms related to the upregulated genes with an EASE score of <0.02.
3.4. PPI Network Analysis
The network included 52 nodes with 147 interactions, which was significantly more interactions than expected (PPI enrichment p-value: < 1.0 × 10⁻¹⁶) (Figure 5). Some proteins had notably more interactions than others, representing key nodes. In the network, we identified FN1, C–X–C motif chemokine ligand 8 (CXCL8), CHI3L1, C-X-C motif chemokine receptor 2 (CXCR2), adrenomedullin (ADM), ITGAD, MMP9, and Fc gamma receptor IIIb (FCGR3B) as key nodes among the DEGs.
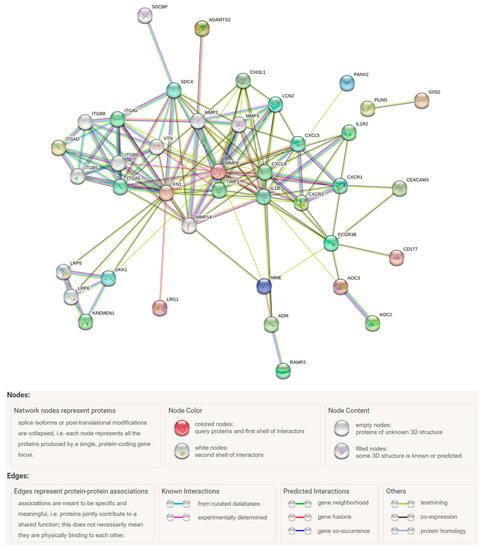
Figure 5.
PPI network analysis of IF/TA-associated DEGs (n = 34) using the STRING tool.
3.5. qPCR Analysis
The qPCR results for the interested genes, in this case, ADAMTS2, CHI3L1, CXCR2, interleukin 1 receptor type 2 (IL1R2), leucine-rich alpha-2-glycoprotein 1 (LRG1), and MMP9, showed good agreement with the mRNA-sequencing results. All genes were upregulated in the IF/TA group relative to the control group, and ADAMTS2 showed the highest fold change (2.20; p < 0.001) (Table S3).
The fold change in ADAMTS2 in the subgroup analysis performed for patients with an early blood collection within 2 years after transplantation (IF/TA [n = 15]; control [n = 10]) was 1.3 (p = 0.13), and for patients with late blood collection, more than 2 years after transplant (IF/TA [n = 26]; control [n = 31]) was 2.9 (p < 0.001).
4. Discussion
In this study, we identified 34 DEGs related to IF/TA after kidney transplantation using NGS. To the best of our knowledge, this is our first study to identify and evaluate IF/TA-related DEGs following kidney transplantation using mRNA-sequencing in PBMCs.
Previous studies investigating gene expression in relation to IF/TA in blood samples primarily utilized RT-PCR [17,20] or a microarray analysis [19] to examine specific genes, resulting in variations in the DEGs identified across these studies. Additionally, it was noted that DEGs identified in blood samples differed from those found in biopsy samples [17,19], highlighting the need for whole mRNA sequencing studies specific to blood samples.
In line with a previous study focusing on blood samples [20], IL-8 (CXCL8) was also found to be associated with IF/TA in our study. However, its direction for the regulation of CXCL8 differed between the previous study and our findings. While previous research showed the downregulation of CXCL8 in IF/TA, our study revealed the upregulation of CXCL8 in IF/TA. Matz et al. proposed that IL-8-producing cells could migrate to allograft and secreted chemokines, leading to lower expression levels in the blood. This inconsistency in the literature suggests a potential association between IF/TA and CXCL8, with its expression in blood possibly varying over time. Future research comparing expression levels at various time points after kidney transplantation in both blood and allograft tissue might be valuable. In another study using microarray analysis of allograft tissues [17], genes related to fibrosis and extracellular matrix deposition, including MMP9, were found to be up-regulated, but blood samples did not show a significant difference. However, our study demonstrated the significant up-regulation of MMP9 on PBMC. This strengthens the evidence supporting the association of MMP9 with IF/TA despite the relatively small differences in expression levels in the blood samples. Additionally, a previous study using microarray analysis of PBMC [19] identified a larger number of DEGs compared to our study, and these DEGs were different between the studies. However, the immune response pathway was consistently identified as one of the key pathways in both the previous study and our study.
Among the 34 DEGs, including ADAMTS2, perilipin 5 (PLIN5), CLDN9, and the potassium inwardly-rectifying channel, subfamily J, member 15 (KCNJ15) showed log2(fold change) values of >1.5 and an AUC value of >0.6, with ADAMTS2, demonstrating the largest AUC and suggesting its potential utility as a biomarker for IF/TA. We observed an increased tendency of the ADAMTS2 expression with IF/TA progression, although these differences were not statistically significant due to the small sample size with severe IF/TA. The AUC of ADAMTS2 in this study (0.765) might not be sufficient for a standalone diagnosis. While its standalone diagnostic utility might be limited, ADAMTS2 could potentially contribute to the development of a comprehensive diagnostic panel for the IF/TA. Currently, there is no widely used blood-based biomarker in the clinic for a diagnosis of IF/TA, as its diagnosis primarily relies on histopathology obtained through a biopsy. Based on these considerations, it is reasonable to suggest that the ADAMTS2 expression in PBMC has a clinical value as a biomarker candidate. An additional analysis using a DEG panel and an adjusted model was conducted to enhance the diagnostic performance of DEGs, but only a marginal improvement was observed. These findings suggest that ADAMTS2 was the most significant biomarker candidate for diagnosing IF/TA progression in this study.
ADAMTS2 is a procollagen N-endopeptidase that cleaves amino-propeptides and induces the formation of collagen fibrils. ADAMTS2 is mainly secreted from fibroblasts and plays important roles in fibrosis, with elevated expression levels observed in fibrotic lesions [30] and diseases such as cardiac hypertrophy [31], osteoarthritis [32], and squamous cell carcinoma [33]. Additionally, a previous study showed that elevated ADAMTS2 expression levels in biopsy samples at three months after kidney transplantation preceded a diagnosis of IF/TA at six months [11]. These findings and those of the present study suggest that an increased ADAMTS2 expression in PBMCs could represent a molecular marker of IF/TA in the transplanted kidney. PLIN5, a lipid droplet that targets proteins, is highly expressed in oxidative tissues [34] and exerts a protective effect against oxidative stress upon the upregulation of its expression [35]. Because oxidative stress is related to IF/TA progression in allograft tissue [36,37], the upregulation of PLIN5 could represent a defense mechanism against IF/TA-related oxidative stress.
CLDN9 and KCNJ15 encode proteins that are integral components of the plasma membrane. CLDN9 is a member of the claudin family and is a component in renal tight junctions [38]. Although a relationship between CLDN9 and fibrosis has not yet been determined, in the present study, we found that CLDN9 expression was elevated in samples from the IF/TA group, suggesting its possible involvement in IF/TA progression after transplantation. KCNJ15 is expressed in cells of various organs, including the kidney, and is involved in regulating the acid–base balance of the kidney [39]. Additionally, KCNJ15 overexpression is associated with type 2 diabetes [40]. Given the role of acidosis and diabetes in renal fibrosis [41,42], it is possible that KCNJ15 is related to IF/TA progression according to its role in these areas.
Among the other genes showing either a log2(fold change) of >1.5 or an AUC > 0.6, MMP9 and FN1 encode proteins that are associated with the extracellular matrix [43,44], and play an important role in renal interstitial fibrosis [45]. MMP9 is a metalloenzyme that breaks down collagen, and FN1 is a glycoprotein involved in extracellular matrix formation. Previous studies have identified MMP9 as a DEG in IF/TA patients [12,17], and Fn1 was identified as a DEG in a study employing an animal model of renal atrophy or allograft damage [46]. The remaining genes in this category have been reported to be associated with inflammatory or immune response pathways [47,48,49,50,51], which are important pathways linked to IF/TA progression [10]. Amine oxidase copper-containing 3 (AOC3), previously identified as an IF/TA-related DEG [12,17], and carcinoembryonic antigen-related cell adhesion molecule 3 (CEACAM3) expression were reportedly upregulated in PBMCs from idiopathic pulmonary fibrosis patients [52].
Other DEGs that were significantly upregulated in IF/TA patients but showed a log2(fold change) of <1.5 and an AUC of <0.6 included several genes associated with renal or fibrotic diseases. Specifically, previous studies identified CXCL8 as a DEG in IF/TA patients [14,20] and Chi3l1 was upregulated in a mouse model of renal atrophy [53]. Additionally, previous studies have reported ADM upregulation in human proximal tubular epithelial cells cultured under hypoxic conditions [54], including maltase–glucoamylase (MGAM) upregulation in idiopathic interstitial pneumonia patients [55] and vanin 3 (VNN3) upregulation in clear-cell renal cell carcinoma patients [56]. Collectively, these findings support an association between the DEGs identified in the present study and IF/TA. Although some genes have not been identified as being directly related to IF/TA, they reportedly play roles in fibrosis, inflammation, and/or renal diseases, suggesting their potential value as IF/TA biomarkers.
We conducted a PPI network analysis using the SPRING database and identified significant interactions among the DEGs. The network based on DEGs revealed the presence of multiple MMP gene families, and ADAMTS2 was found to have interactions with these genes. The most significantly identified gene in our study was ADAMTS2, which was found to be associated with the ontology term “extracellular matrix”, which emerged as an important term in the analysis. Previous studies have also consistently reported an association between genes related to the extracellular matrix and IF/TA [10,11,12,14,17]. This suggests that genes associated with the extracellular matrix have the potential to be biomarkers for IF/TA progression and candidates for further studies as potential drug targets.
This study has several limitations. First, the timing of the biopsy and blood sampling differed, ranging from 52 to 1597 days, meaning that subclinical fibrosis could be present after the biopsy. This limitation is inevitable in a retrospective case–control study. However, because IF/TA progression is irreversible [12], this likely did not significantly affect the study results. In order to address this limitation, a subgroup analysis was conducted by dividing the patients into an early blood collection group consisting of those who were within two years of their transplant and a late blood collection group consisting of those more than two years after their transplant. Although there was no significant difference in the ADAMTS2 expression level in the early blood collection group, the consistent direction of the fold changes between the two subgroup analyses could help compensate for the limitations arising from the different sampling timing. A further prospective study with a long study period during which blood samples were collected immediately after the one-year protocol biopsy should be conducted to collect samples with similar characteristics. Second, causal relationships between gene expression and IF/TA onset/progression could not be established in this study. Gene expression can be altered as a compensatory mechanism in relation to the occurrence of IF/TA. This is a common problem in retrospective gene expression studies; therefore, these considerations should be taken into account when interpreting the results of this study. When using DEGs as biomarkers, only associations between gene expression and IF/TA progression are required. However, care should be taken when using DEGs as therapeutic targets, as some DEGs might exert protective effects against IF/TA. Therefore, further studies that analyze gene expression levels at multiple time points, including expression data prior to the biopsy, should be undertaken in order to more precisely elucidate the mechanisms associated with IF/TA progression. Third, no external validation was performed in this study; accordingly, further evaluations are needed to replicate these results.
This study has the following strength. Unlike previous studies [5,6,7,8,9,10,11,12,17,19,20] that have evaluated gene-expression profiles mainly via biopsy samples with microarrays, the present study used PBMCs, which are more feasible for use in clinical settings. Furthermore, the present study analyzed the expression levels of all genes using NGS, allowing a broader evaluation of the overall gene-expression profiles in the IF/TA and control groups [57].
5. Conclusions
In summary, this study identified 34 IF/TA-related DEGs in PBMCs. Among them, ADAMTS2 demonstrated the highest differential gene expression level between IF/TA patients and the controls, suggesting that it can serve as a potential biomarker for IF/TA diagnosis.
Supplementary Materials
The following supporting information can be downloaded at: https://www.mdpi.com/article/10.3390/jpm13081242/s1, Table S1: qPCR probe information; Table S2: Clinicopathological features for IF/TA patients and controls at one-year protocol biopsy after kidney transplantation; Table S3: qPCR validation of mRNA-sequencing data for IF/TA patients and controls at one-year protocol biopsy after kidney transplantation; Figure S1: (a) A density plot of FPKM distribution of all samples. A color code represents distinct samples. Each line in the density plot corresponds to distinct samples. FPKM, fragments of transcript per kilobase per million reads; I, IF/TA; C, Control (b) A box plot of FPKM distribution of all samples. The line in the box plot represents the median value, the box represents the interquartile range, and the whisker represents the highest and lowest values; Figure S2: ROC curves evaluating the sensitivity and specificity of the DEG, which showed a log2(fold change) of >1.5 and AUC values of >0.6 as a biomarker of IF/TA. AUC, area under the receiver operating characteristic curve; Figure S3: ROC curves evaluating the sensitivity and specificity of DEG panels with log2(fold change) >1.5 and AUC values >0.6 as biomarkers for IF/TA. The adjusted model represents a model according to ADAMTS2 expression adjusted for recipient age. AUC, area under the receiver operating characteristic curve; A, ADAMTS2; P, PLIN5; C, CLDN9; K, KCNJ15.
Author Contributions
Conceptualization, J.M.O., I.-W.K. and N.H.; acquisition and interpretation of data, H.K.L., Y.S.K., H.L., J.Y. and S.S.H.; formal analysis, H.K.L., N.H.J. and D.E.L.; writing—original draft preparation, H.K.L.; writing—review and editing, J.M.O., I.-W.K., S.S.H. and N.H.; visualization, H.K.L.; supervision, J.M.O. and I.-W.K.; funding acquisition, J.M.O. All authors have read and agreed to the published version of the manuscript.
Funding
This research was funded by the National Research Foundation of Korea, grant number NRF-2019R1A2C1005211.
Institutional Review Board Statement
The study was conducted in accordance with the Declaration of Helsinki and approved by the Institutional Review Board of Seoul National University Hospital (IRB No. 1904-094-1027, June 2019).
Informed Consent Statement
Informed consent was obtained from all subjects involved in this study.
Data Availability Statement
Data are available upon reasonable request to the corresponding author.
Acknowledgments
The authors would like to thank all patients that participated in this study. Additionally, we thank Chae Jeong Kim and Min Ju Kang for sample and data collection.
Conflicts of Interest
The authors declare no conflict of interest.
References
- Solez, K.; Colvin, R.B.; Racusen, L.C.; Sis, B.; Halloran, P.F.; Birk, P.E.; Campbell, P.M.; Cascalho, M.; Collins, A.B.; Demetris, A.J.; et al. Banff ‘05 Meeting Report: Differential Diagnosis of Chronic Allograft Injury and Elimination of Chronic Allograft Nephropathy. Am. J. Transplant. 2007, 7, 518–526. [Google Scholar] [CrossRef]
- Nankivell, B.J.; Shingde, M.; Keung, K.L.; Fung, C.L.; Borrows, R.J.; O’Connell, P.J.; Chapman, J.R. The causes, significance and consequences of inflammatory fibrosis in kidney transplantation: The Banff i-IFTA lesion. Am. J. Transplant. 2018, 18, 364–376. [Google Scholar] [CrossRef] [PubMed]
- Furness, P.N.; Philpott, C.M.; Chorbadjian, M.T.; Nicholson, M.L.; Bosmans, J.L.; Corthouts, B.L.; Bogers, J.J.; Schwarz, A.; Gwinner, W.; Haller, H.; et al. Protocol biopsy of the stable renal transplant: A multicenter study of methods and complication rates. Transplantation 2003, 76, 969–973. [Google Scholar] [CrossRef] [PubMed]
- Byron, S.A.; Van Keuren-Jensen, K.R.; Engelthaler, D.M.; Carpten, J.D.; Craig, D.W. Translating RNA sequencing into clinical diagnostics: Opportunities and challenges. Nat. Rev. Genet. 2016, 17, 257–271. [Google Scholar] [CrossRef] [PubMed]
- Kemmner, S.; Bachmann, Q.; Steiger, S.; Lorenz, G.; Honarpisheh, M.; Foresto-Neto, O.; Wang, S.; Carbajo-Lozoya, J.; Alt, V.; Schulte, C.; et al. STAT1 regulates macrophage number and phenotype and prevents renal fibrosis after ischemia-reperfusion injury. Am. J. Physiol.-Ren. Physiol. 2019, 316, F277–F291. [Google Scholar] [CrossRef]
- Heylen, L.; Thienpont, B.; Naesens, M.; Busschaert, P.; Depreeuw, J.; Smeets, D.; Jochmans, I.; Monbaliu, D.; Pirenne, J.; Lerut, E.; et al. Ischemia-Induced DNA Hypermethylation during Kidney Transplant Predicts Chronic Allograft Injury. J. Am. Soc. Nephrol. 2018, 29, 1566–1576. [Google Scholar] [CrossRef]
- Bontha, S.; Maluf, D.; Archer, K.; Dumur, C.; Dozmorov, M.; King, A.; Akalin, E.; Mueller, T.; Gallon, L.; Mas, V. Effects of DNA Methylation on Progression to Interstitial Fibrosis and Tubular Atrophy in Renal Allograft Biopsies: A Multi-Omics Approach. Am. J. Transplant. 2017, 17, 3060–3075. [Google Scholar] [CrossRef] [PubMed]
- Modena, B.D.; Kurian, S.M.; Gaber, L.W.; Waalen, J.; Su, A.I.; Gelbart, T.; Mondala, T.S.; Head, S.R.; Papp, S.; Heilman, R.; et al. Gene Expression in Biopsies of Acute Rejection and Interstitial Fibrosis/Tubular Atrophy Reveals Highly Shared Mechanisms That Correlate with Worse Long-Term Outcomes. Am. J. Transplant. 2016, 16, 1982–1998. [Google Scholar] [CrossRef]
- Scian, M.J.; Maluf, D.G.; Archer, K.J.; Suh, J.L.; Massey, D.; Fassnacht, R.C.; Whitehill, B.; Sharma, A.; King, A.; Gehr, T.; et al. Gene Expression Changes Are Associated With Loss of Kidney Graft Function and Interstitial Fibrosis and Tubular Atrophy: Diagnosis Versus Prediction. Transplantation 2011, 91, 657–665. [Google Scholar] [CrossRef]
- Park, W.D.; Griffin, M.D.; Cornell, L.D.; Cosio, F.G.; Stegall, M.D. Fibrosis with Inflammation at One Year Predicts Transplant Functional Decline. J. Am. Soc. Nephrol. 2010, 21, 1987–1997. [Google Scholar] [CrossRef]
- Scherer, A.; Gwinner, W.; Mengel, M.; Kirsch, T.; Raulf, F.; Szustakowski, J.D.; Hartmann, N.; Staedtler, F.; Engel, G.; Klupp, J.; et al. Transcriptome Changes in Renal Allograft Protocol Biopsies at 3 Months Precede the Onset of Interstitial Fibrosis/Tubular Atrophy (IF/TA) at 6 Months. Nephrol. Dial. Transplant. 2009, 24, 2567–2575. [Google Scholar] [CrossRef]
- Rödder, S.; Scherer, A.; Raulf, F.; Berthier, C.C.; Hertig, A.; Couzi, L.; Durrbach, A.; Rondeau, E.; Marti, H.-P. Renal Allografts with IF/TA Display Distinct Expression Profiles of Metzincins and Related Genes. Am. J. Transplant. 2009, 9, 517–526. [Google Scholar] [CrossRef] [PubMed]
- Nogare, A.L.; Veronese, F.V.; Carpio, V.N.; Montenegro, R.M.; Pedroso, J.A.; Pegas, K.L.; Gonçalves, L.F.; Manfro, R.C. Kidney injury molecule-1 expression in human kidney transplants with interstitial fibrosis and tubular atrophy. BMC Nephrol. 2015, 16, 19. [Google Scholar] [CrossRef] [PubMed]
- Maluf, D.G.; Mas, V.R.; Archer, K.J.; Yanek, K.; Gibney, E.M.; King, A.L.; Cotterell, A.; Fisher, R.A.; Posner, M.P. Molecular pathways involved in loss of kidney graft function with tubular atrophy and interstitial fibrosis. Mol. Med. 2008, 14, 276–285. [Google Scholar] [CrossRef] [PubMed]
- Nakorchevsky, A.; Hewel, J.A.; Kurian, S.M.; Mondala, T.S.; Campbell, D.; Head, S.R.; Marsh, C.L.; Yates, J.R., 3rd; Salomon, D.R. Molecular mechanisms of chronic kidney transplant rejection via large-scale proteogenomic analysis of tissue biopsies. J. Am. Soc. Nephrol. 2010, 21, 362–373. [Google Scholar] [CrossRef]
- Flechner, S.M.; Kurian, S.M.; Solez, K.; Cook, D.J.; Burke, J.T.; Rollin, H.; Hammond, J.A.; Whisenant, T.; Lanigan, C.M.; Head, S.R.; et al. De novo kidney transplantation without use of calcineurin inhibitors preserves renal structure and function at two years. Am. J. Transplant. 2004, 4, 1776–1785. [Google Scholar] [CrossRef] [PubMed]
- Mas, V.; Maluf, D.; Archer, K.; Yanek, K.; Mas, L.; King, A.; Gibney, E.; Massey, D.; Cotterell, A.; Fisher, R.; et al. Establishing the molecular pathways involved in chronic allograft nephropathy for testing new noninvasive diagnostic markers. Transplantation 2007, 83, 448–457. [Google Scholar] [CrossRef] [PubMed]
- Ventura, C.G.; Whisenant, T.; Gelbart, T.; David, D.S.R.; Agena, F.; Salomon, D.R.; David-Neto, E.; Kurian, S.M. Discovery and cross-validation of peripheral blood and renal biopsy gene expression signatures from ethnically diverse kidney transplant populations. Am. J. Transplant. 2019, 19, 3356–3366. [Google Scholar] [CrossRef]
- Kurian, S.M.; Heilman, R.; Mondala, T.S.; Nakorchevsky, A.; Hewel, J.A.; Campbell, D.; Robison, E.H.; Wang, L.; Lin, W.; Gaber, L.; et al. Biomarkers for Early and Late Stage Chronic Allograft Nephropathy by Proteogenomic Profiling of Peripheral Blood. PLoS ONE 2009, 4, e6212. [Google Scholar] [CrossRef]
- Matz, M.; Lorkowski, C.; Fabritius, K.; Wu, K.; Rudolph, B.; Frischbutter, S.; Brakemeier, S.; Gaedeke, J.; Neumayer, H.-H.; Mashreghi, M.-F.; et al. The selective biomarker IL-8 identifies IFTA after kidney transplantation in blood cells. Transpl. Immunol. 2016, 39, 18–24. [Google Scholar] [CrossRef]
- Roufosse, C.; Simmonds, N.; Clahsen-van Groningen, M.; Haas, M.; Henriksen, K.J.; Horsfield, C.; Loupy, A.; Mengel, M.; Perkowska-Ptasińska, A.; Rabant, M.; et al. A 2018 Reference Guide to the Banff Classification of Renal Allograft Pathology. Transplantation 2018, 102, 1795–1814. [Google Scholar] [CrossRef]
- Tophat. Available online: http://ccb.jhu.edu/software/tophat/index.shtml (accessed on 28 September 2020).
- Trapnell, C.; Roberts, A.; Goff, L.; Pertea, G.; Kim, D.; Kelley, D.R.; Pimentel, H.; Salzberg, S.L.; Rinn, J.L.; Pachter, L. Differential gene and transcript expression analysis of RNA-seq experiments with TopHat and Cufflinks. Nat. Protoc. 2012, 7, 562–578. [Google Scholar] [CrossRef] [PubMed]
- Cuffdiff. Available online: http://cole-trapnell-lab.github.io/cufflinks/cuffdiff/ (accessed on 28 September 2020).
- DAVID. Available online: https://david.ncifcrf.gov/ (accessed on 28 September 2020).
- Huang, D.W.; Sherman, B.T.; Lempicki, R.A. Systematic and integrative analysis of large gene lists using DAVID bioinformatics resources. Nat. Protoc. 2009, 4, 44–57. [Google Scholar] [CrossRef] [PubMed]
- Hosack, D.A.; Dennis, G.; Sherman, B.T.; Lane, H.C.; Lempicki, R.A. Identifying biological themes within lists of genes with EASE. Genome Biol. 2003, 4, R70. [Google Scholar] [CrossRef] [PubMed]
- Szklarczyk, D.; Gable, A.L.; Nastou, K.C.; Lyon, D.; Kirsch, R.; Pyysalo, S.; Doncheva, N.T.; Legeay, M.; Fang, T.; Bork, P.; et al. The STRING database in 2021: Customizable protein-protein networks, and functional characterization of user-uploaded gene/measurement sets. Nucleic Acids Res. 2021, 49, D605–D612. [Google Scholar] [CrossRef]
- Schmittgen, T.D.; Livak, K.J. Analyzing real-time PCR data by the comparative CT method. Nat. Protoc. 2008, 3, 1101–1108. [Google Scholar] [CrossRef]
- Bekhouche, M.; Colige, A. The procollagen N-proteinases ADAMTS2, 3 and 14 in pathophysiology. Matrix Biol. 2015, 44–46, 46–53. [Google Scholar] [CrossRef]
- Wang, X.; Chen, W.; Zhang, J.; Khan, A.; Li, L.; Huang, F.; Qiu, Z.; Wang, L.; Chen, X. Critical Role of ADAMTS2 (A Disintegrin and Metalloproteinase With Thrombospondin Motifs 2) in Cardiac Hypertrophy Induced by Pressure Overload. Hypertension 2017, 69, 1060–1069. [Google Scholar] [CrossRef]
- Yang, C.Y.; Chanalaris, A.; Troeberg, L. ADAMTS and ADAM metalloproteinases in osteoarthritis—Looking beyond the ‘usual suspects’. Osteoarthr. Cartil. 2017, 25, 1000–1009. [Google Scholar] [CrossRef]
- Li, G.; Li, X.; Yang, M.; Xu, L.; Deng, S.; Ran, L. Prediction of biomarkers of oral squamous cell carcinoma using microarray technology. Sci. Rep. 2017, 7, 42105. [Google Scholar] [CrossRef]
- Kimmel, A.R.; Sztalryd, C. Perilipin 5, a lipid droplet protein adapted to mitochondrial energy utilization. Curr. Opin. Lipidol. 2014, 25, 110–117. [Google Scholar] [CrossRef] [PubMed]
- Tan, Y.; Jin, Y.; Wang, Q.; Huang, J.; Wu, X.; Ren, Z. Perilipin 5 Protects against Cellular Oxidative Stress by Enhancing Mitochondrial Function in HepG2 Cells. Cells 2019, 8, 1241. [Google Scholar] [CrossRef] [PubMed]
- Li, X.; Zhuang, S. Recent advances in renal interstitial fibrosis and tubular atrophy after kidney transplantation. Fibrogenesis Tissue Repair 2014, 7, 15. [Google Scholar] [CrossRef]
- Djamali, A. Oxidative stress as a common pathway to chronic tubulointerstitial injury in kidney allografts. Am. J. Physiol. Renal. Physiol. 2007, 293, F445–F455. [Google Scholar] [CrossRef]
- Abuazza, G.; Becker, A.; Williams, S.S.; Chakravarty, S.; Truong, H.-T.; Lin, F.; Baum, M. Claudins 6, 9, and 13 are developmentally expressed renal tight junction proteins. Am. J. Physiol.-Ren. Physiol. 2006, 291, F1132–F1141. [Google Scholar] [CrossRef]
- Schlingmann, K.P.; Renigunta, A.; Hoorn, E.J.; Forst, A.-L.; Renigunta, V.; Atanasov, V.; Mahendran, S.; Barakat, T.S.; Gillion, V.; Godefroid, N.; et al. Defects in KCNJ16 Cause a Novel Tubulopathy with Hypokalemia, Salt Wasting, Disturbed Acid-Base Homeostasis, and Sensorineural Deafness. J. Am. Soc. Nephrol. 2021, 32, 1498–1512. [Google Scholar] [CrossRef] [PubMed]
- Okamoto, K.; Iwasaki, N.; Doi, K.; Noiri, E.; Iwamoto, Y.; Uchigata, Y.; Fujita, T.; Tokunaga, K. Inhibition of Glucose-Stimulated Insulin Secretion by KCNJ15, a Newly Identified Susceptibility Gene for Type 2 Diabetes. Diabetes 2012, 61, 1734–1741. [Google Scholar] [CrossRef]
- Kanasaki, K.; Taduri, G.; Koya, D. Diabetic nephropathy: The role of inflammation in fibroblast activation and kidney fibrosis. Front. Endocrinol. Lausanne 2013, 4, 7. [Google Scholar] [CrossRef]
- Wesson, D.E.; Buysse, J.M.; Bushinsky, D.A. Mechanisms of Metabolic Acidosis–Induced Kidney Injury in Chronic Kidney Disease. J. Am. Soc. Nephrol. 2020, 31, 469–482. [Google Scholar] [CrossRef]
- Mondal, S.; Adhikari, N.; Banerjee, S.; Amin, S.A.; Jha, T. Matrix metalloproteinase-9 (MMP-9) and its inhibitors in cancer: A minireview. Eur. J. Med. Chem. 2020, 194, 112260. [Google Scholar] [CrossRef]
- Žlajpah, M.; Hauptman, N.; Boštjančič, E.; Zidar, N. Differential expression of extracellular matrix-related genes DCN, EPHA4, FN1, SPARC, SPON2 and SPP1 in colorectal carcinogenesis. Oncol. Rep. 2019, 42, 1539–1548. [Google Scholar] [CrossRef]
- Liu, Y. Cellular and molecular mechanisms of renal fibrosis. Nat. Rev. Nephrol. 2011, 7, 684–696. [Google Scholar] [CrossRef] [PubMed]
- Von Toerne, C.; Schmidt, C.; Adams, J.; Kiss, E.; Bedke, J.; Porubsky, S.; Gretz, N.; Lindenmeyer, M.T.; Cohen, C.D.; Gröne, H.-J.; et al. Wnt Pathway Regulation in Chronic Renal Allograft Damage. Am. J. Transplant. 2009, 9, 2223–2239. [Google Scholar] [CrossRef] [PubMed]
- Wang, L.; Zhang, Y.-L.; Lin, Q.-Y.; Liu, Y.; Guan, X.-M.; Ma, X.-L.; Cao, H.-J.; Liu, Y.; Bai, J.; Xia, Y.-L.; et al. CXCL1–CXCR2 axis mediates angiotensin II-induced cardiac hypertrophy and remodelling through regulation of monocyte infiltration. Eur. Heart J. 2018, 39, 1818–1831. [Google Scholar] [CrossRef] [PubMed]
- Thézénas, M.-L.; De Leo, B.; Laux-Biehlmann, A.; Bafligil, C.; Elger, B.; Tapmeier, T.; Morten, K.; Rahmioglu, N.; Dakin, S.G.; Charles, P.; et al. Amine oxidase 3 is a novel pro-inflammatory marker of oxidative stress in peritoneal endometriosis lesions. Sci. Rep. 2020, 10, 1495. [Google Scholar] [CrossRef] [PubMed]
- Willcocks, L.C.; Lyons, P.A.; Clatworthy, M.R.; Robinson, J.I.; Yang, W.; Newland, S.A.; Plagnol, V.; McGovern, N.N.; Condliffe, A.M.; Chilvers, E.R.; et al. Copy number of FCGR3B, which is associated with systemic lupus erythematosus, correlates with protein expression and immune complex uptake. J. Exp. Med. 2008, 205, 1573–1582. [Google Scholar] [CrossRef]
- Peters, V.A.; Joesting, J.J.; Freund, G.G. IL-1 receptor 2 (IL-1R2) and its role in immune regulation. Brain Behav. Immun. 2013, 32, 1–8. [Google Scholar] [CrossRef]
- Bonsignore, P.; Kuiper, J.W.P.; Adrian, J.; Goob, G.; Hauck, C.R. CEACAM3—A Prim(at)e Invention for Opsonin-Independent Phagocytosis of Bacteria. Front. Immunol. 2020, 10, 3160. [Google Scholar] [CrossRef]
- Desai, B.; Mattson, J.; Paintal, H.; Nathan, M.; Shen, F.; Beaumont, M.; Malinao, M.-C.; Li, Y.; Canfield, J.; Basham, B.; et al. Differential expression of monocyte/macrophage-selective markers in human idiopathic pulmonary fibrosis. Exp. Lung Res. 2011, 37, 227–238. [Google Scholar] [CrossRef]
- Puthumana, J.; Thiessen-Philbrook, H.; Xu, L.; Coca, S.G.; Garg, A.X.; Himmelfarb, J.; Bhatraju, P.K.; Ikizler, T.A.; Siew, E.D.; Ware, L.B.; et al. Biomarkers of inflammation and repair in kidney disease progression. J. Clin. Investig. 2021, 131, e139927. [Google Scholar] [CrossRef]
- Zhu, T.; Yang, J.; Liu, X.; Zhang, L.; Zhang, J.; Wang, Y.; Ma, H.; Ren, Z. Hypoxia-Inducible Adrenomedullin Ameliorates the Epithelial-To-Mesenchymal Transition in Human Proximal Tubular Epithelial Cells. Mol. Med. Rep. 2015, 11, 3760–3766. [Google Scholar] [CrossRef] [PubMed][Green Version]
- Chen, H.; Fang, X.; Zhu, H.; Li, S.; He, J.; Gu, P.; Fan, D.; Han, F.; Zeng, Y.; Yu, X.; et al. Gene expression profile analysis for different idiopathic interstitial pneumonias subtypes. Exp. Lung Res. 2014, 40, 367–379. [Google Scholar] [CrossRef] [PubMed]
- Ha, M.; Jeong, H.; Roh, J.S.; Lee, B.; Lee, D.; Han, M.-E.; Oh, S.-O.; Sohn, D.H.; Kim, Y.H. VNN3 is a potential novel biomarker for predicting prognosis in clear cell renal cell carcinoma. Anim. Cells Syst. 2019, 23, 112–117. [Google Scholar] [CrossRef] [PubMed]
- Garber, M.; Grabherr, M.G.; Guttman, M.; Trapnell, C. Computational methods for transcriptome annotation and quantification using RNA-seq. Nat. Methods 2011, 8, 469–477. [Google Scholar] [CrossRef] [PubMed]


Disclaimer/Publisher’s Note: The statements, opinions and data contained in all publications are solely those of the individual author(s) and contributor(s) and not of MDPI and/or the editor(s). MDPI and/or the editor(s) disclaim responsibility for any injury to people or property resulting from any ideas, methods, instructions or products referred to in the content. |
© 2023 by the authors. Licensee MDPI, Basel, Switzerland. This article is an open access article distributed under the terms and conditions of the Creative Commons Attribution (CC BY) license (https://creativecommons.org/licenses/by/4.0/).