
Multidimensional Machine Learning Model to Calculate a COVID-19 Vulnerability Index

 , , , , and
Abstract
:1. Introduction
2. Materials and Methods
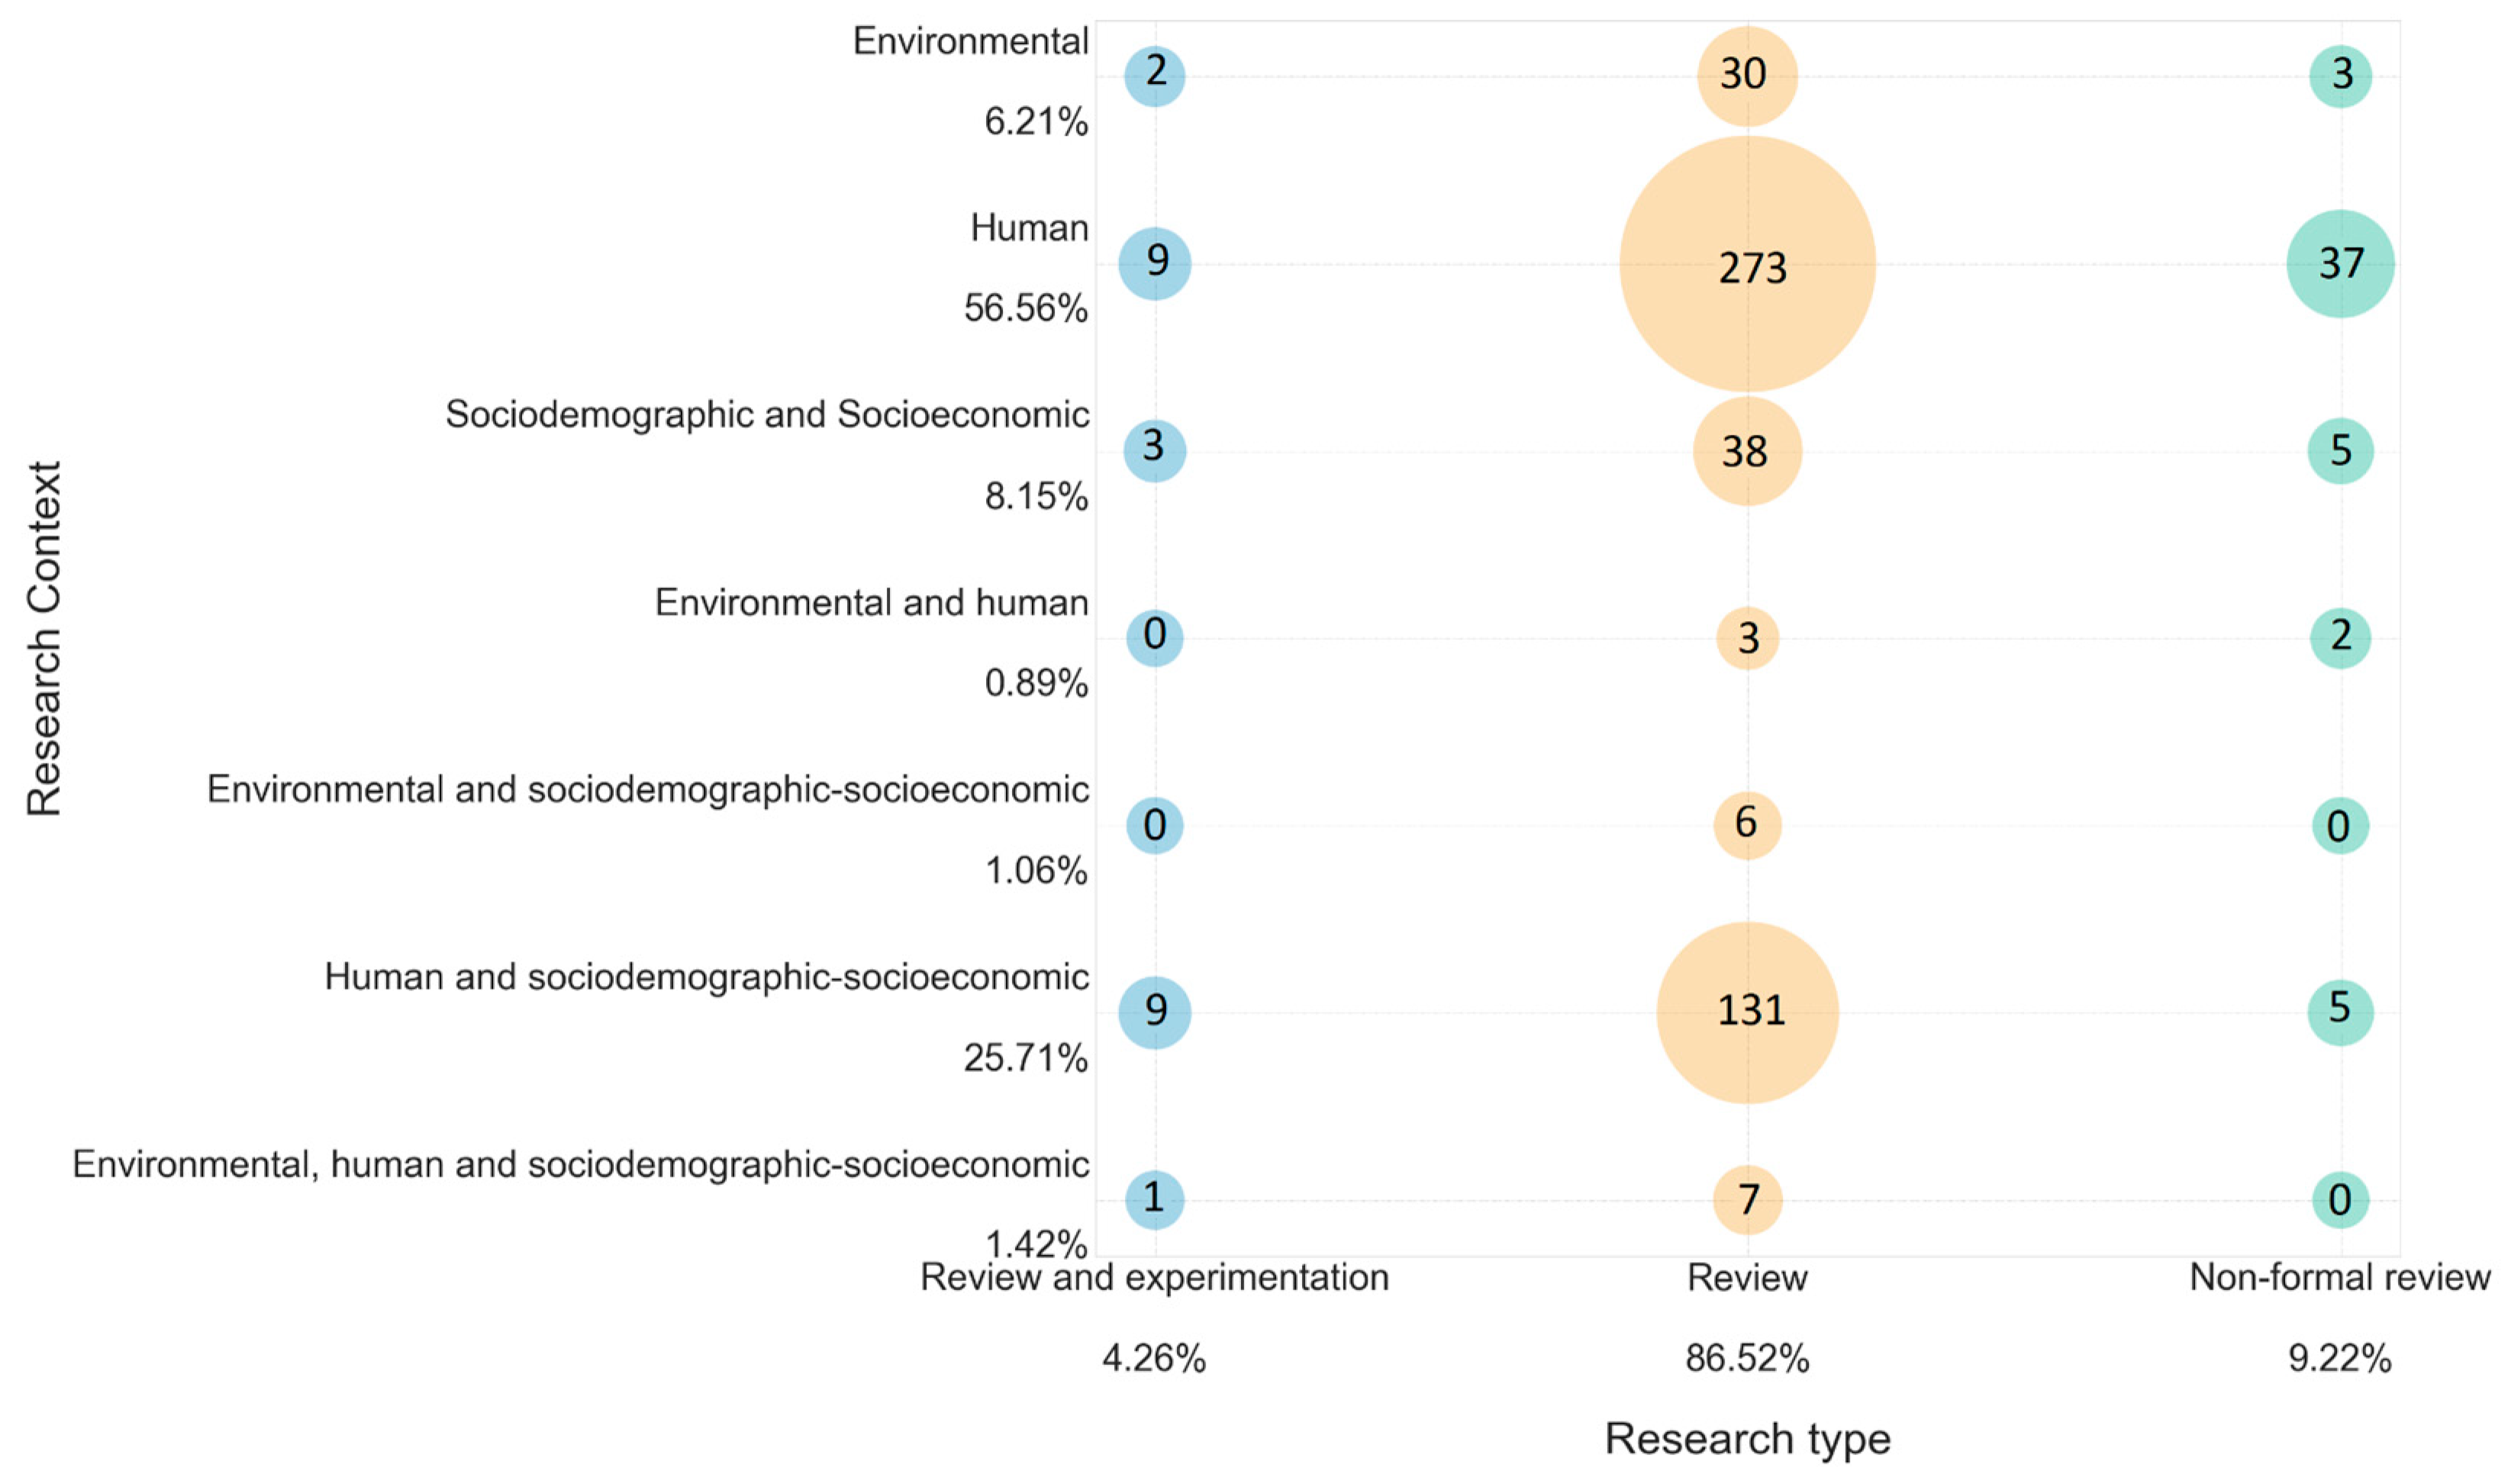
2.1. Identification of Relevant Risk Factors of COVID-19
- Human risk factors. They refer to people’s health conditions.
- Sociodemographic and socioeconomic risk factors. These indicate the characteristics of the population.
- Environmental factors. These factors include environmental variables.
- Sociodemographic and socioeconomic risk factors, and human factors.
- Sociodemographic and socioeconomic risk factors, and environmental risk factors.
- Sociodemographic and socioeconomic risk factors, environmental, and human risk factors.
- C19VI vulnerability index [9]. This index was developed in the United States by the Center for Disease Control and Prevention (CDC), considering the following variables to calculate the index: socioeconomic status, household composition, disability, minority status and language, type of housing and transportation, and epidemiological and health system factors.
- As a result, a vulnerability map was obtained in which each city was identified with a color according to the level of vulnerability found.
- Vulnerability index of Colombia (DANE) [3]. DANE provided a COVID-19 vulnerability index with a geographic disaggregation level by blocks. The study’s objective was to categorize which people, according to the block where they live, have a higher probability of complications in case of infection by COVID-19. For this purpose, demographic characteristics and health conditions were considered. The variables used to calculate the DANE vulnerability index are presented below:
- o
- Comorbidities: hypertension, diabetes, ischemic heart disease, chronic pulmonary disease, and cancer.
- o
- Demographic characteristics: identification of people over 60, households in overcrowded rooms and bedrooms, and households at high and medium intergenerational risk per block.
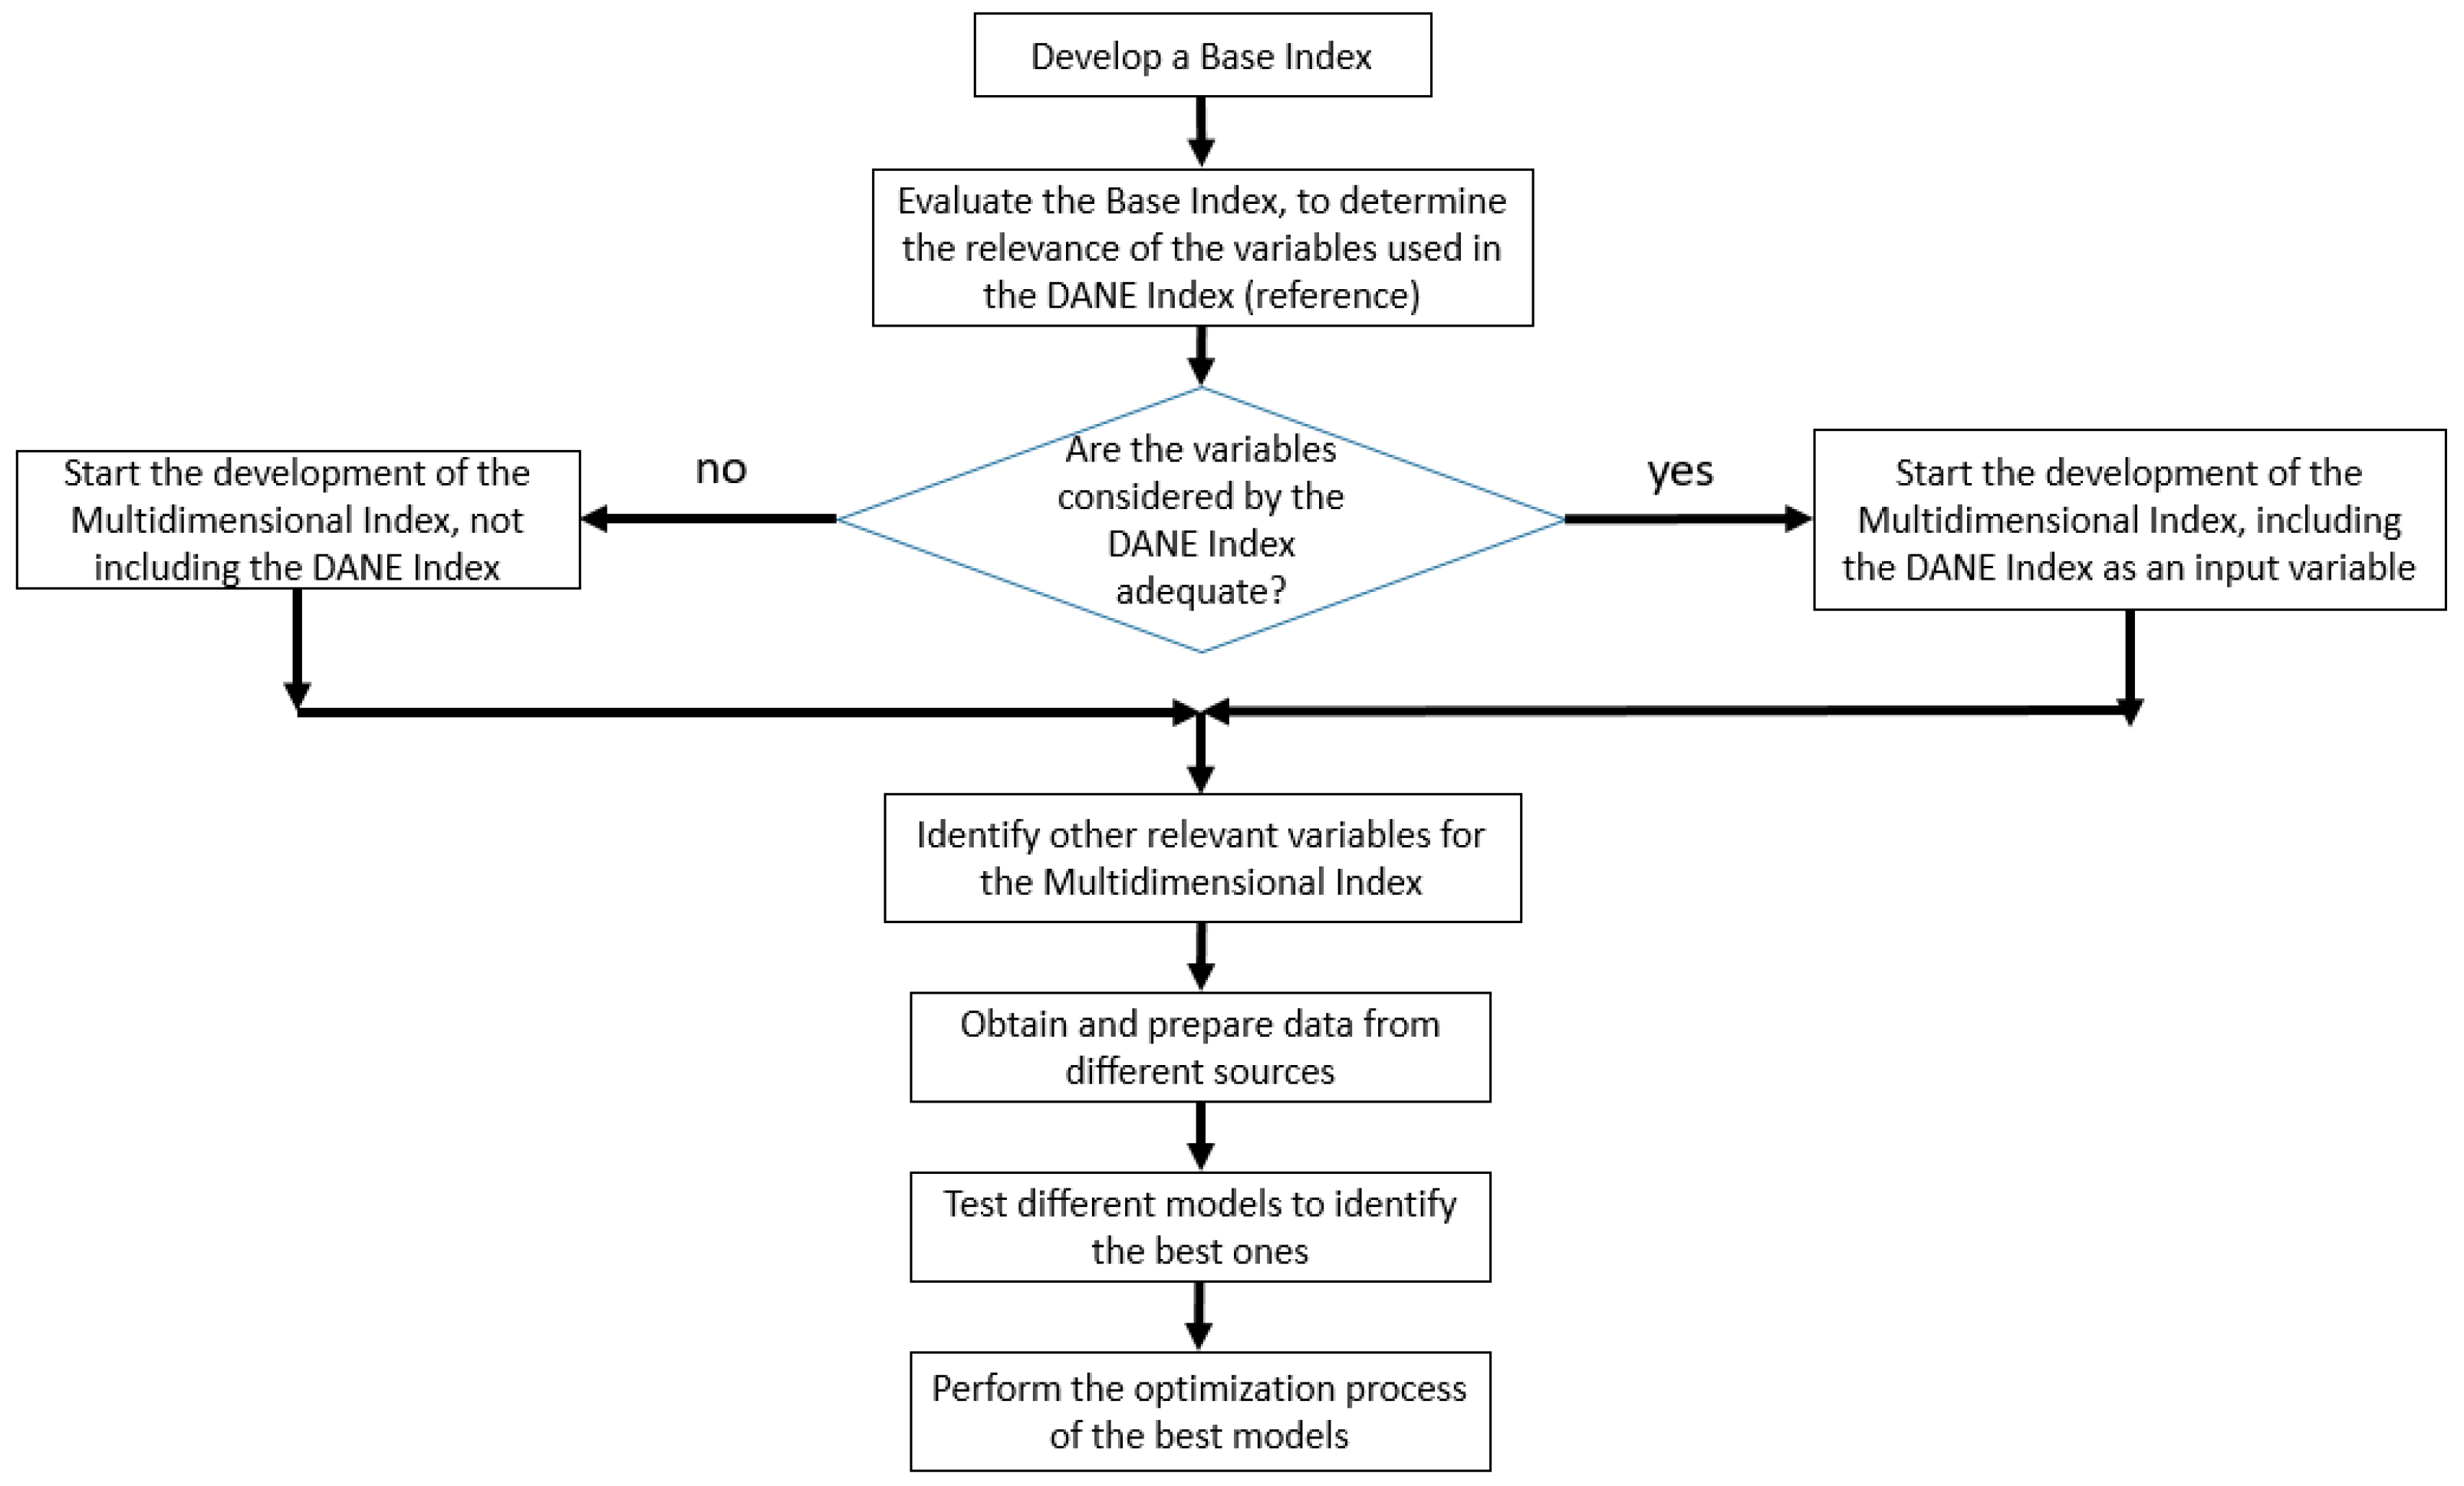
2.2. Base Model
2.3. Multidimensional Index
- Gross domestic product (GDP). GDP is the standard value-added of producing a country’s goods and services during a period [17]. This dataset provides a broader visibility of what each region (department) contributes to the country yearly. Considering the relevant period of the COVID-19 pandemic, data for 2020 and 2021 were considered. This research used GDP at constant prices with an annual periodicity.
- Climatological data. This type of data has been identified as a factor that increases the risk of COVID-19. For this reason, temperature and precipitation data were sought through Google Earth Engine. This platform allows access to these data for all the principal municipalities in Colombia [18] daily.
- Vaccination percentage. For the vaccination data, the information provided by the Ministry of Health was taken into account, which presents a report made in Power BI [19] in which the vaccination percentage curve by the municipality can be visualized.
- Unemployment rate. This dataset was collected from the information published by the Great Integrated Household Survey (named GEIH) conducted by DANE. The survey information is presented for the capitals of 24 departments (out of 32 and one special district) and published quarterly [20].
- Mobility data. This dataset was collected from reports published by Google. These reports allow tracing movement trends over time in different categories of places: grocery and pharmacy, parks, transit stations, retail and recreation, workplace, and residential, taking as a reference the mobility of the 5 weeks between January 3 and February 6, 2020. The increase or decrease percentages of mobility-specific areas were calculated [21].
- COVID-19 vulnerability. Same as the previous index, it contains the COVID-19 vulnerability data published by DANE. Including these data allows having a representative value of the variables already measured with the national index, therefore reflecting data on comorbidities, information on older adults in households, and overcrowding places data.
- COVID-19 case data. This is the output variable, considering that the evaluation of the model was performed using multiple machine learning models to predict the incidence of COVID-19 cases in the main cities of Colombia. Data were obtained from information published by the Ministry of Health, where daily data reported in each of the municipalities of Colombia can be found in the CSV format [22].
2.4. Evaluation of the Multidimensional Index for Predicting the Incidence of COVID-19
3. Results
3.1. Confusion Matrixes for the Multidimensional Index
3.2. Base Model Evaluation
3.3. Multidimensional Index Evaluation
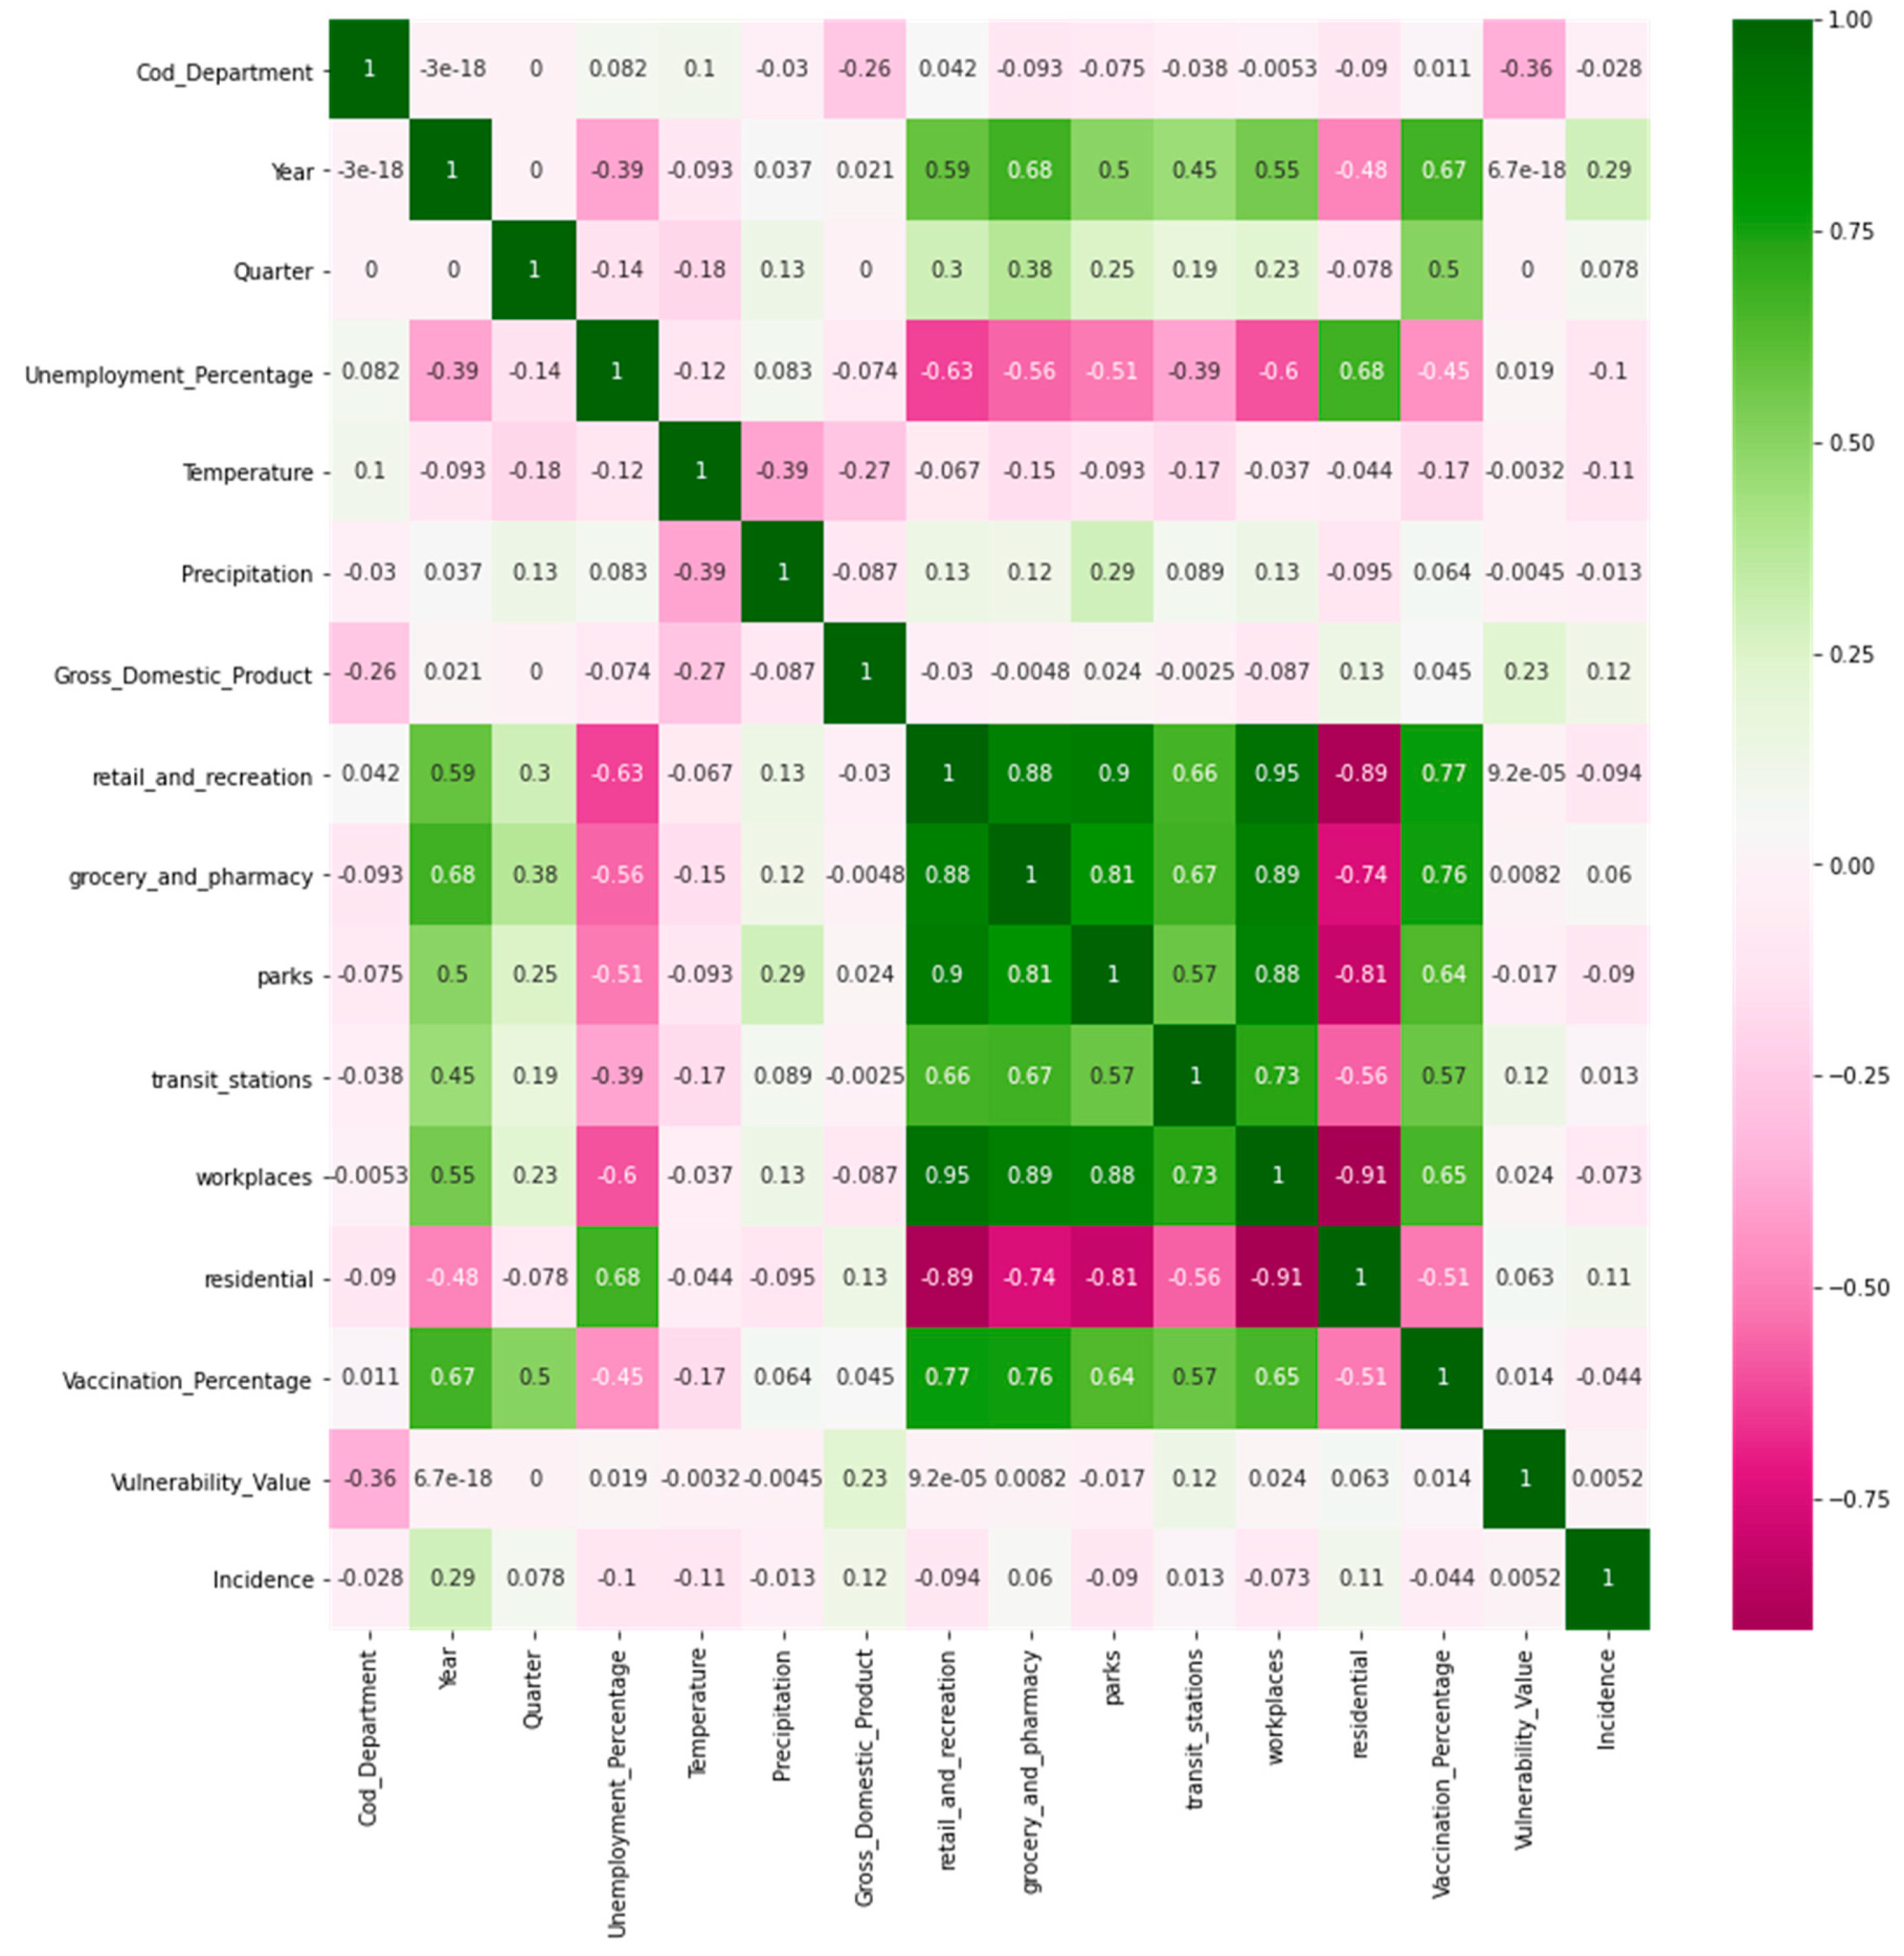
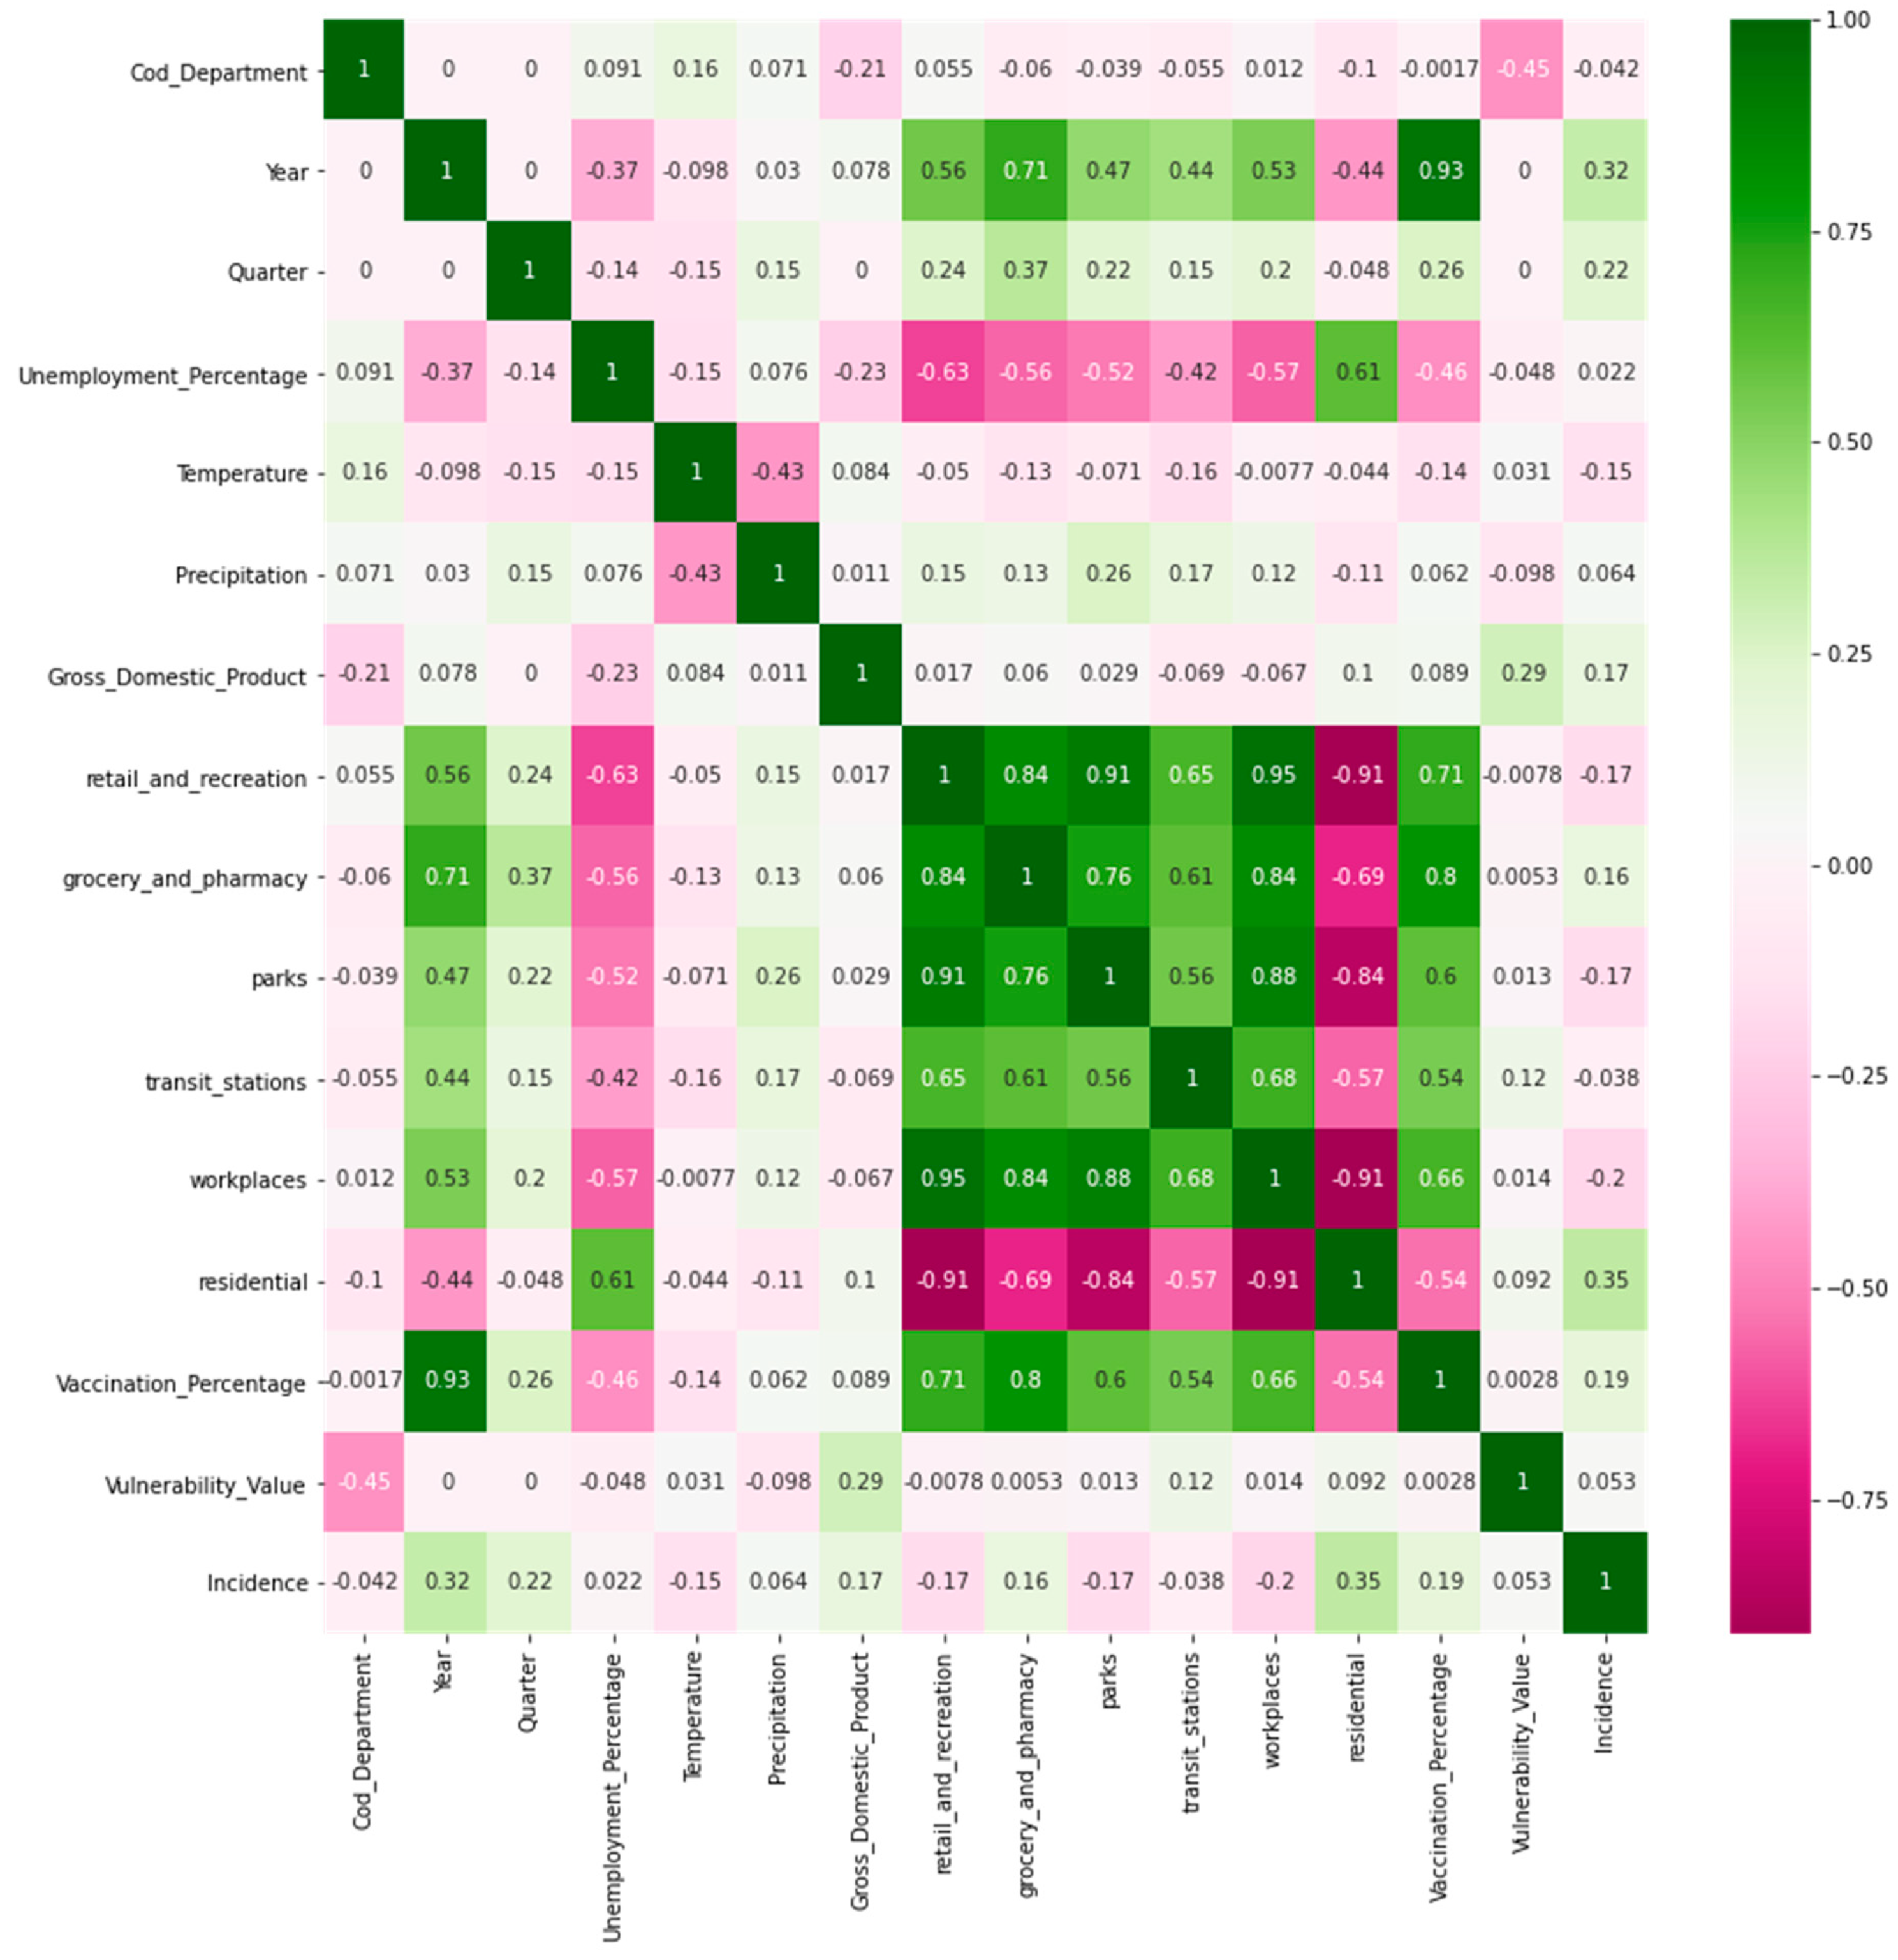
- Gross domestic product (GDP);
- Temperature;
- Precipitation;
- Vaccination percentage;
- Unemployment rate;
- Mobility in grocery and pharmacy;
- Mobility in parks;
- Mobility in transit stations;
- Mobility in retail and recreation;
- Mobility in workplace;
- Mobility in residential;
- COVID-19 vulnerability;
- COVID-19 case data as the output variable.
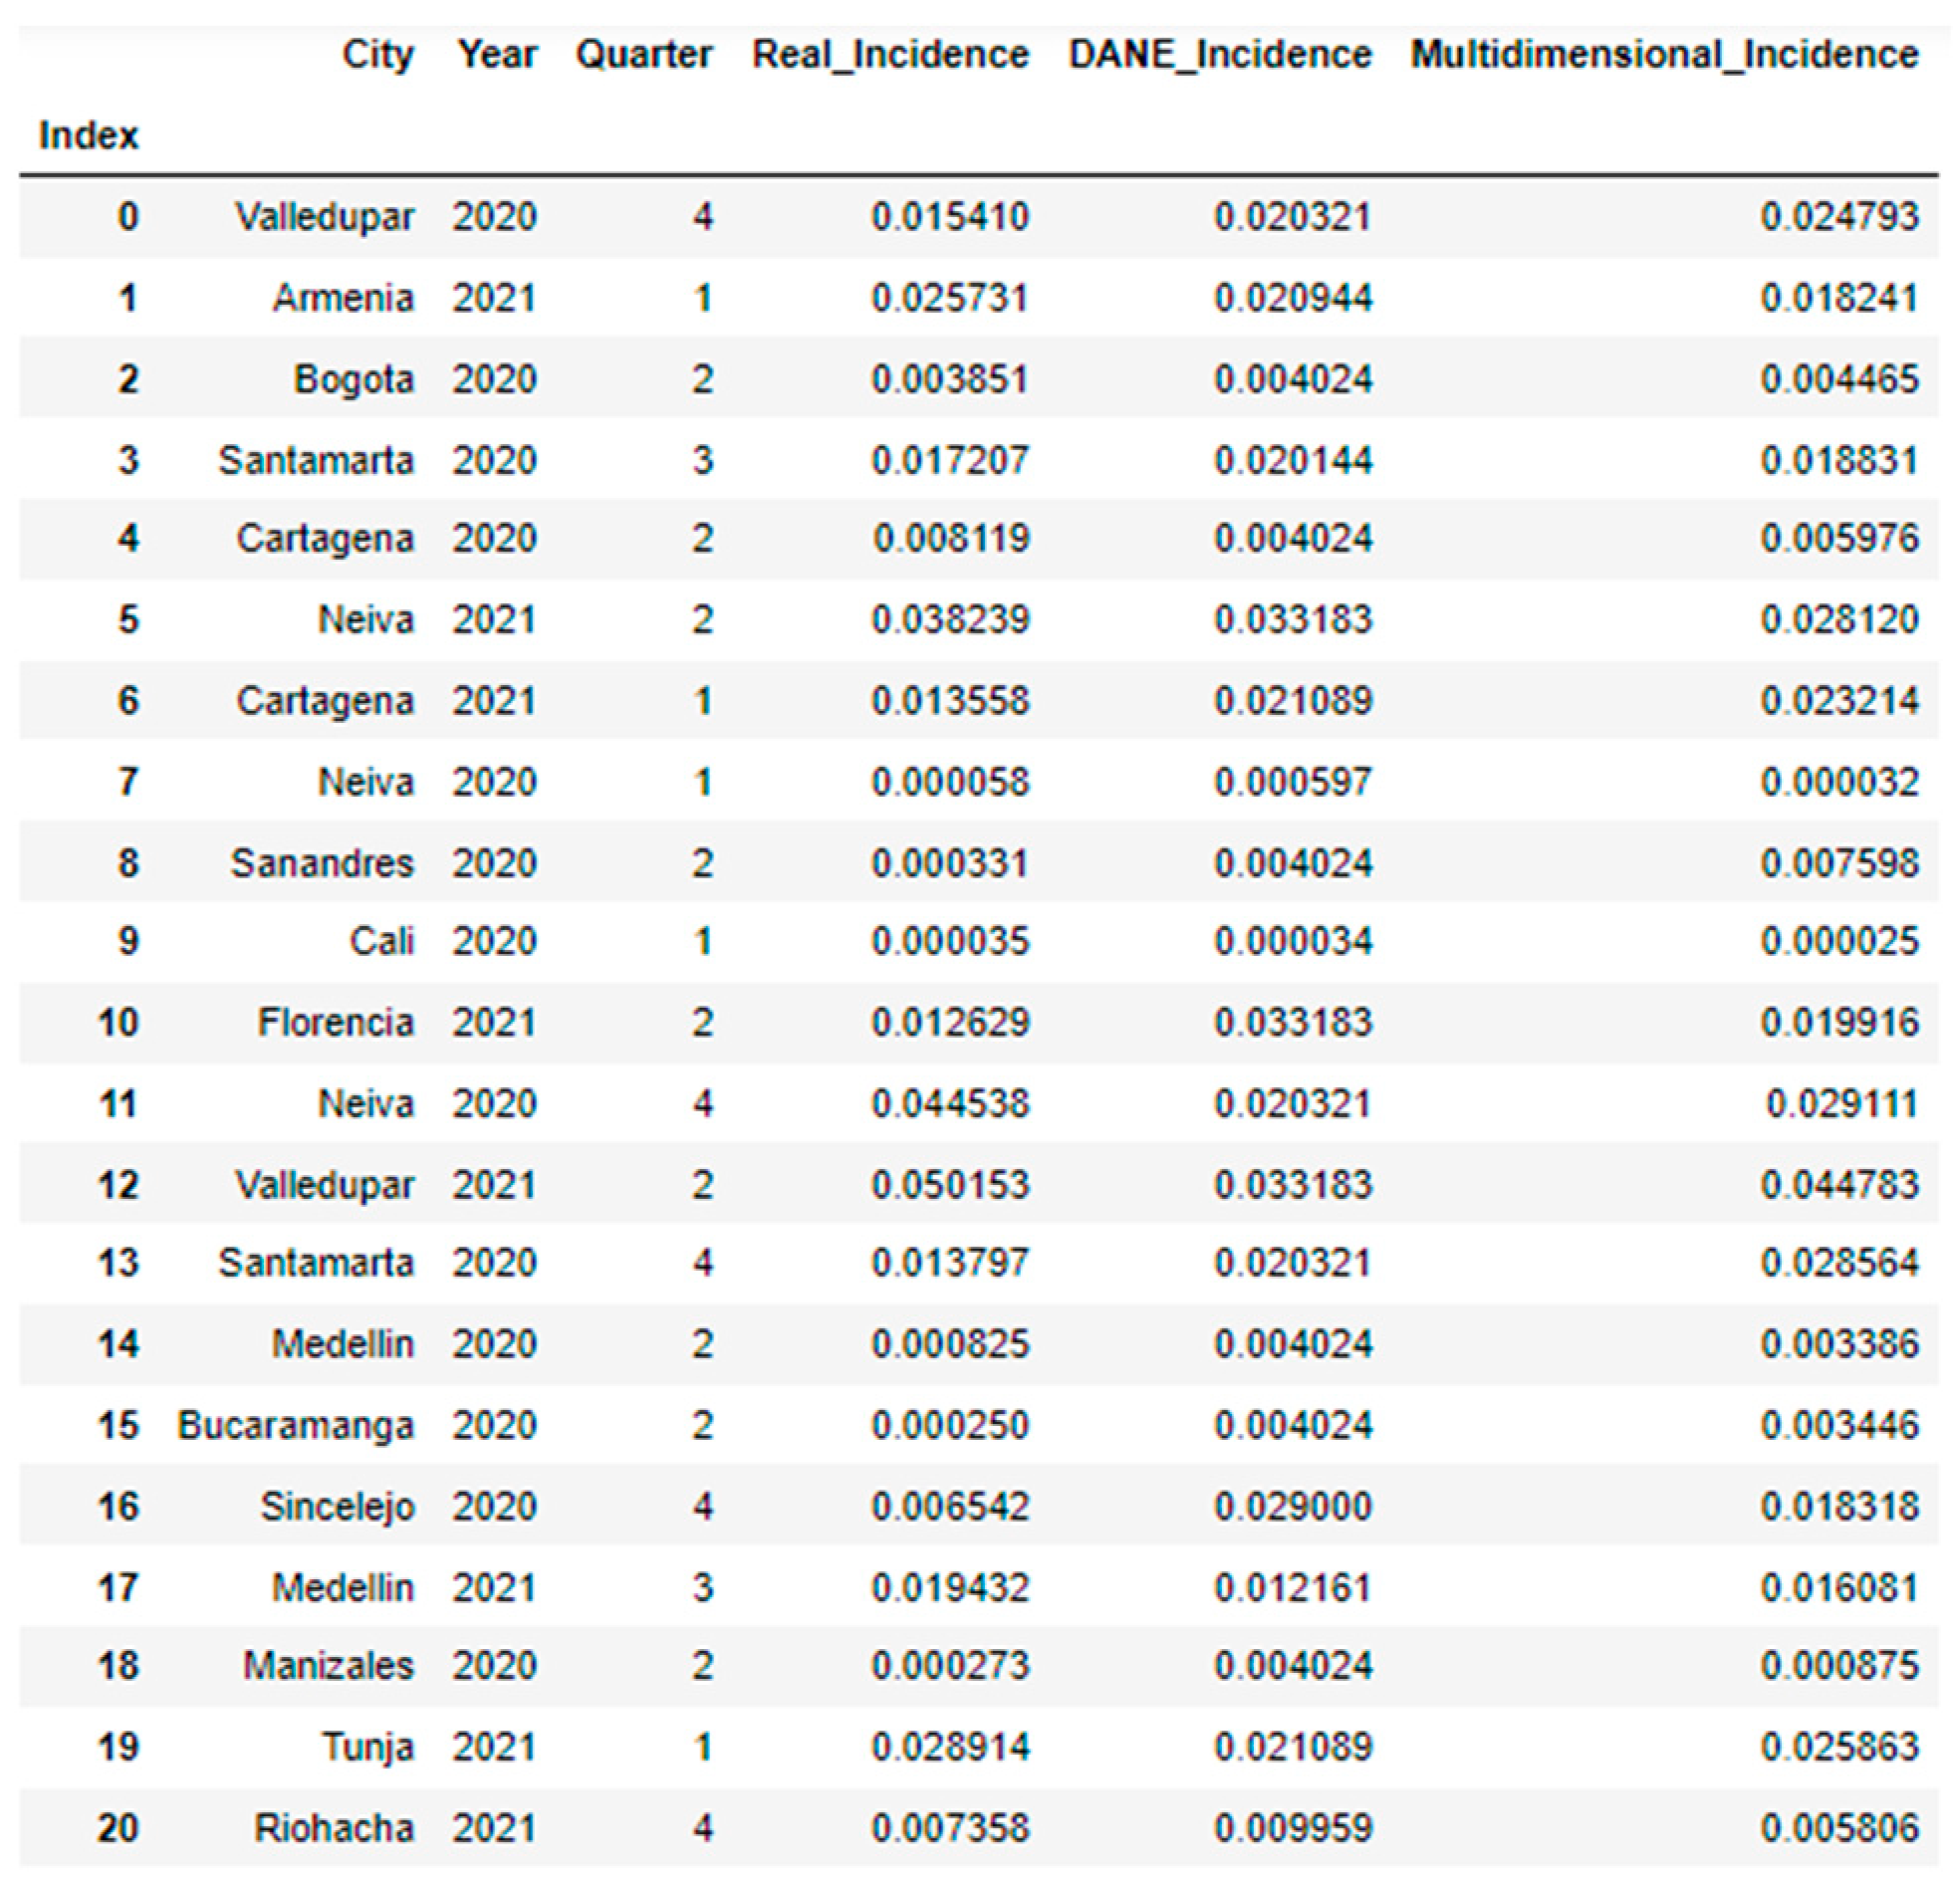
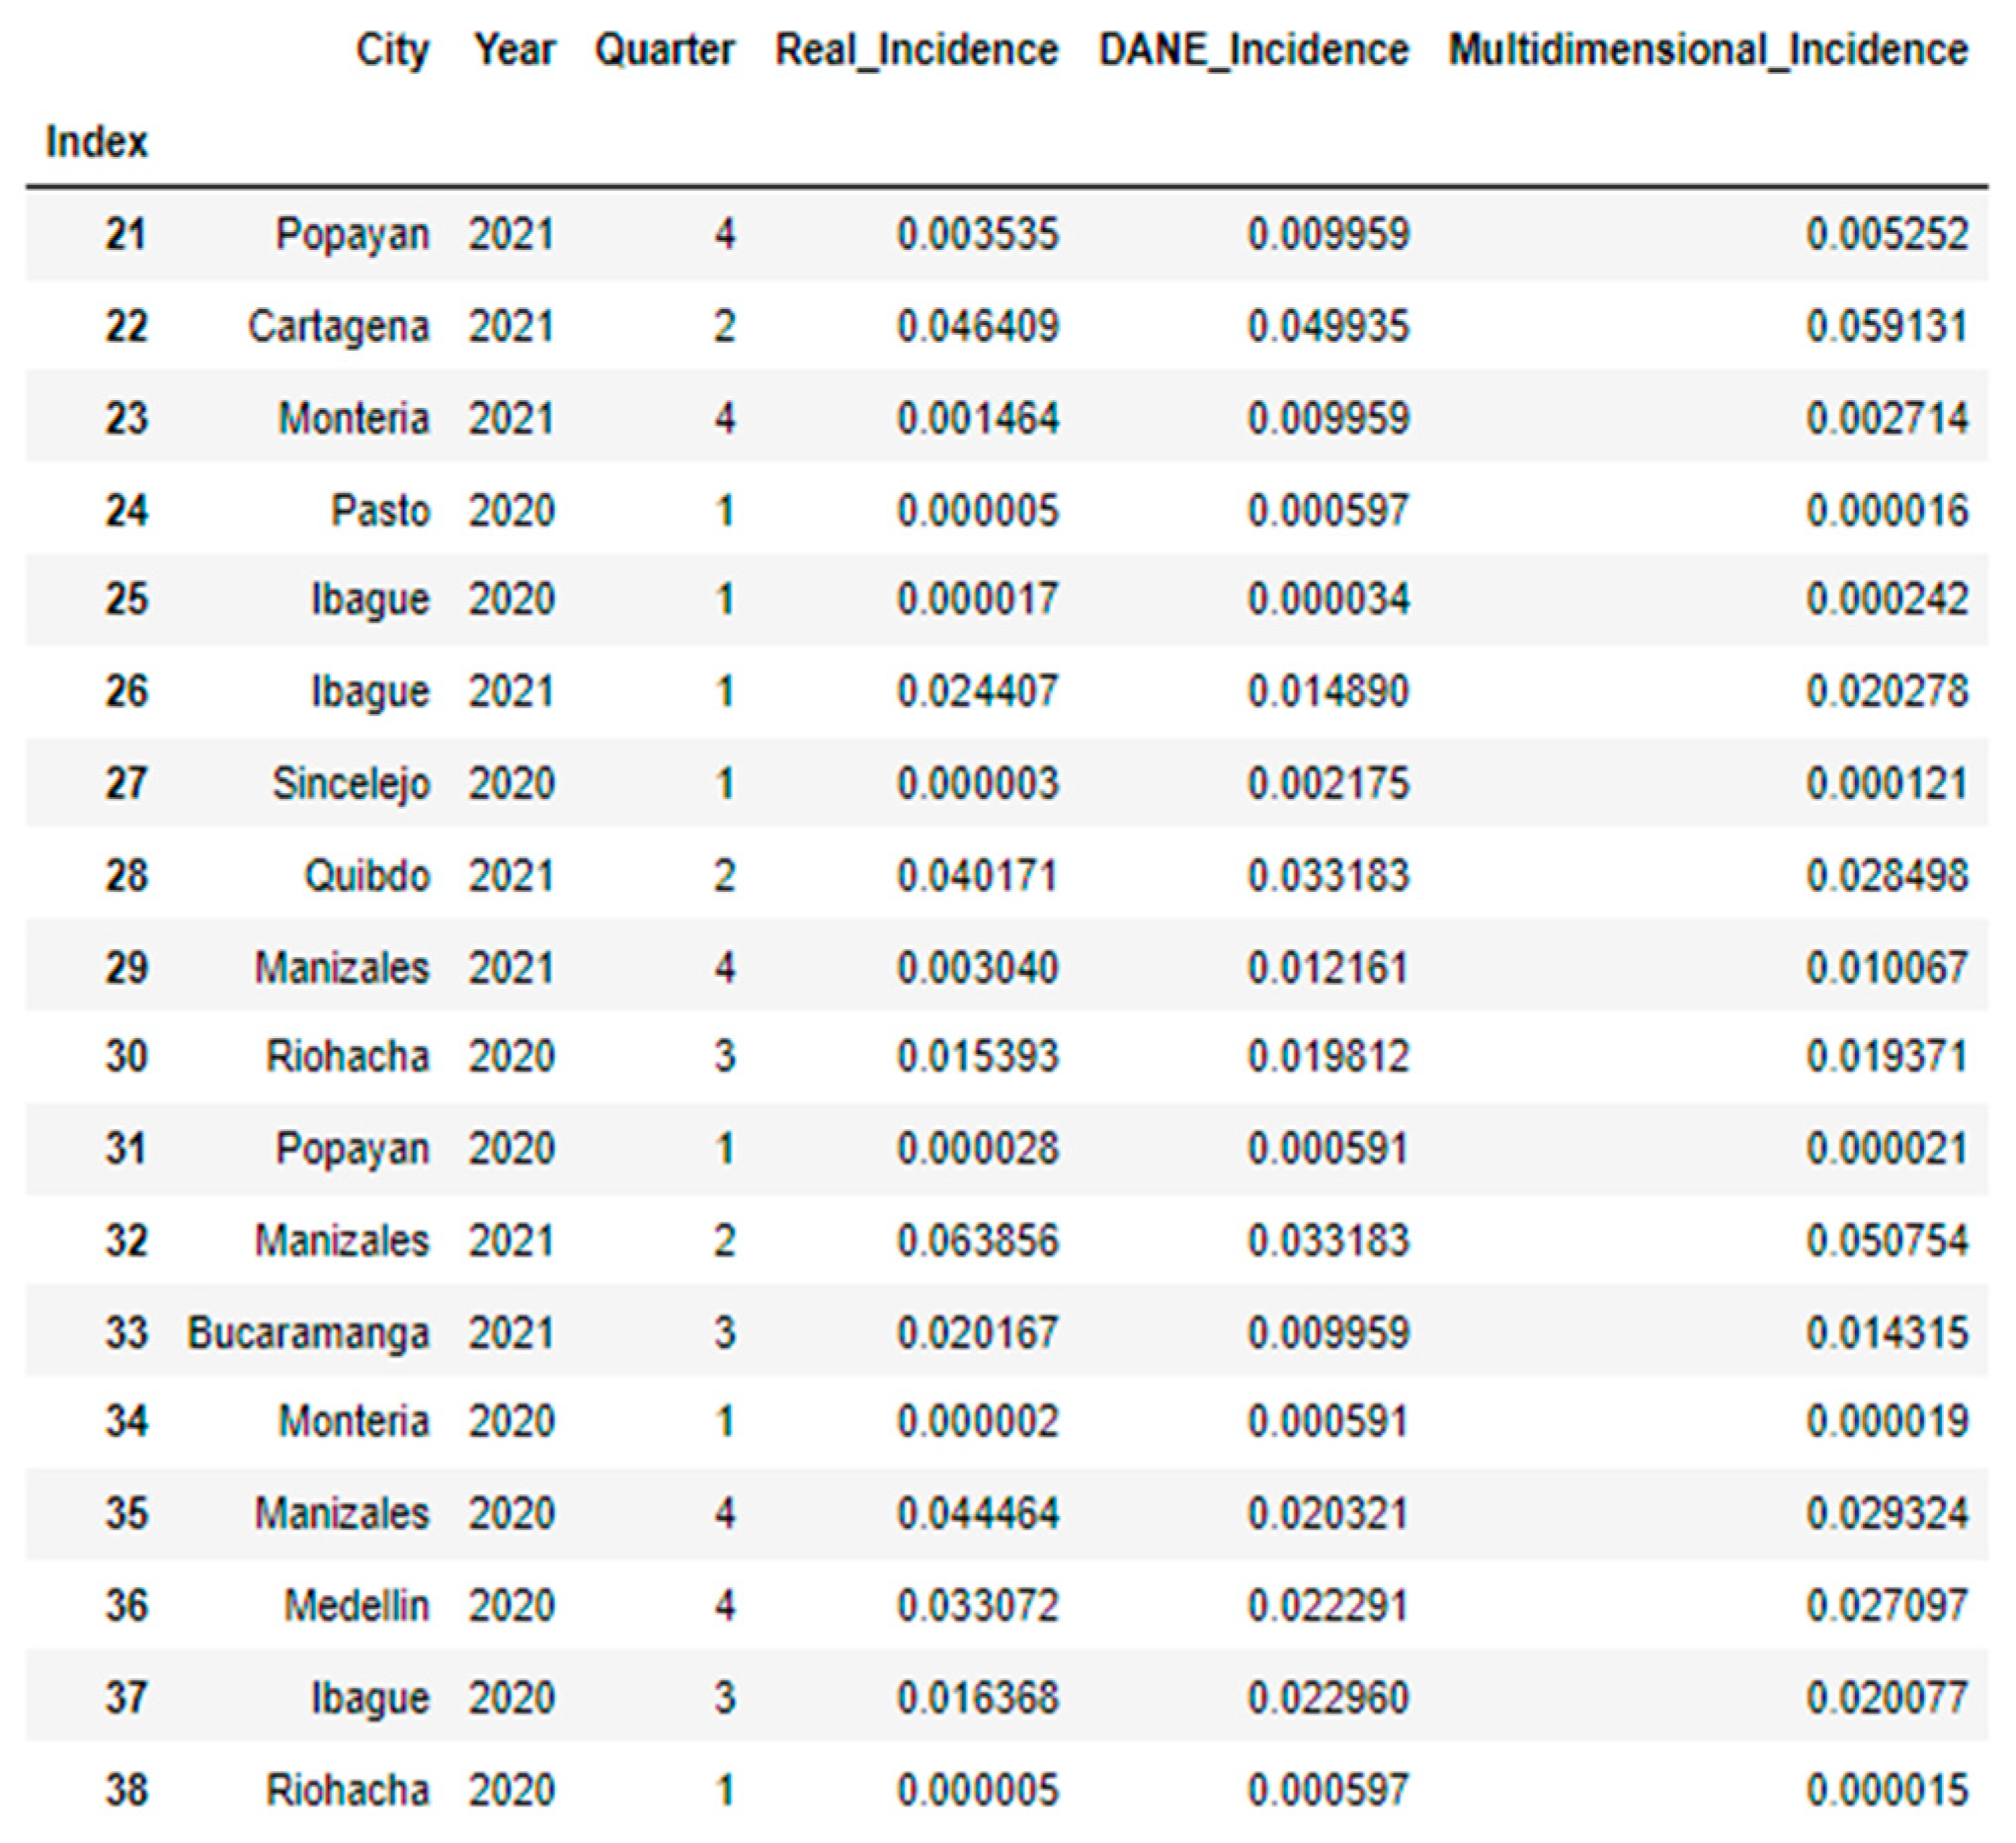
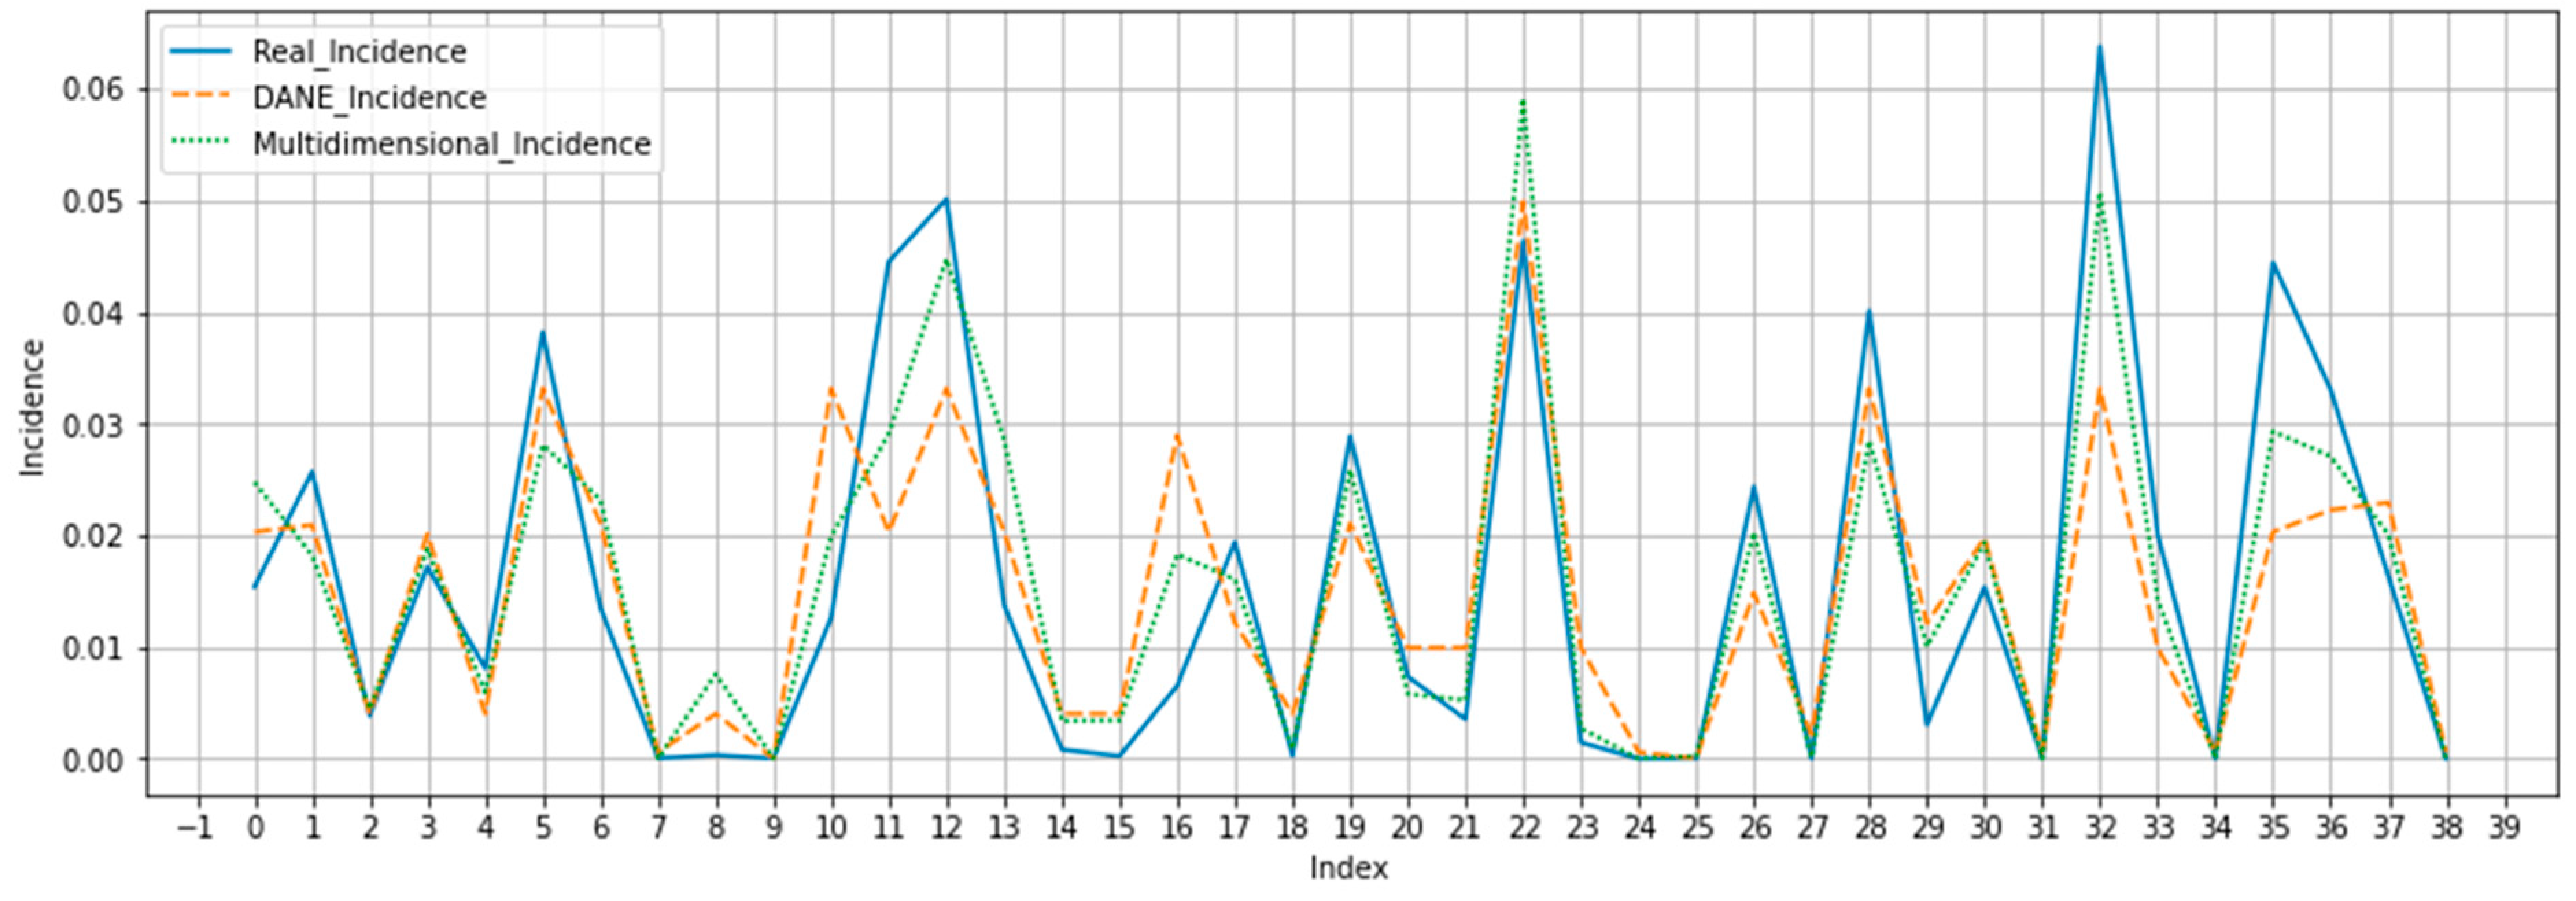
3.4. Results of the Multidimensional Index for Predicting Incidence of COVID-19
4. Discussion
- Vulnerability variable. The variable of this dataset is human and sociodemographic type because it includes vulnerability data already calculated from comorbidities and characteristics of people such as age and overcrowding in homes.
- GDP. The variables of this dataset are sociodemographic and socioeconomic risk factors.
- Percentage of unemployment. The variables of this dataset are sociodemographic and socioeconomic risk factors.
- Vaccination percentage. The variables of this dataset are human risk factors.
- Mobility data. The variables of this dataset are sociodemographic and socioeconomic risk factors.
- Temperature and precipitation. The variables of this dataset are environmental risk factors.
5. Conclusions
Author Contributions
Funding
Institutional Review Board Statement
Informed Consent Statement
Data Availability Statement
Acknowledgments
Conflicts of Interest
Appendix A


References
- Información Basíca Sobre la COVID-19. Available online: https://www.who.int/es/news-room/q-a-detail/coronavirus-disease-covid-19 (accessed on 12 September 2021).
- El Coronavirus en Colombia. Available online: https://coronaviruscolombia.gov.co/Covid19/ (accessed on 22 September 2021).
- Available online: https://www.dane.gov.co/files/comunicados/Nota_metodologica_indice_de_vulnerabilidad.pdf (accessed on 13 June 2023).
- Pastor-Sierra, K.S.; Peñata-Taborda, A.; Coneo-Pretelt, A.; Jiménez-Vidal, L.; Arteaga-Arroyo, G.; Caldera, D.R.; Salcedo-Arteaga, S.; Galeano-Páez, C.; Espitia-Pérez, P.; Espitia-Pérez, L. Factores ambientales en la transmisión del SARS-CoV-2/COVID 19: Panorama mundial y colombiano. Salud UIS 2021, 53, 15. [Google Scholar] [CrossRef] [PubMed]
- Lo Que Debes Saber Sobre Las Vacunas Contra la COVID-19. Available online: https://www.unicef.org/es/coronavirus/lo-que-debes-saber-sobre-vacuna-covid19 (accessed on 26 February 2023).
- En Colombia, No Vacunados Tienen de 4 a 9 Veces Más Riesgo de Morir Por COVID-19. Available online: https://www.minsalud.gov.co/Paginas/En-Colombia-no-vacunados-tienen-de-4-a-9-veces-mas-riesgo-de-morir-por-covid-19-.aspx (accessed on 26 February 2023).
- Economic Commission for Latin America and the Caribbean. La Prolongación de la Crisis Sanitaria y su Impacto en la Salud, la economía y el Desarrollo Social; Informes COVID-19 de la CEPAL; United Nations: San Francisco, CA, USA, 2021; ISBN 978-92-1-001637-7. [Google Scholar]
- Rosero, P.A.; Realpe, J.S.; Farinango, C.D.; Restrepo, D.S.; Salazar-Cabrera, R.; Lopez, D.M. Risk Factors for COVID-19: A Systematic Mapping Study. In PHealth 2022: Proceedings of the 19th International Conference on Wearable Micro and Nano Technologies for Personalized Health; IOS Press: Amsterdam, The Netherlands, 2022; pp. 63–74. [Google Scholar] [CrossRef]
- Tiwari, A.; Dadhania, A.V.; Ragunathrao, V.A.B.; Oliveira, E.R.A. Using Machine Learning to Develop a Novel COVID-19 Vulnerability Index (C19VI). Sci. Total Environ. 2021, 773, 145650. [Google Scholar] [CrossRef] [PubMed]
- IBM Docs. Available online: https://prod.ibmdocs-production-dal-6099123ce774e592a519d7c33db8265e-0000.us-south.containers.appdomain.cloud/docs/es/spss-modeler/SaaS?topic=dm-crisp-help-overview (accessed on 23 September 2021).
- COLOMBIA—Censo Nacional de Población y Vivienda—CNPV—2018—Data Dictionary. Available online: http://microdatos.dane.gov.co/index.php/catalog/643/data_dictionary#page=F9&tab=data-dictionary (accessed on 10 November 2022).
- Base COVID-19 Dataset. Available online: https://www.kaggle.com/datasets/sebastianrgonzalez/base-dane-covid19-dataset (accessed on 26 February 2023).
- Una Comparación de los Métodos de Correlación de Pearson y Spearman. Available online: https://support.minitab.com/es-mx/minitab/20/help-and-how-to/statistics/basic-statistics/supporting-topics/correlation-and-covariance/a-comparison-of-the-pearson-and-spearman-correlation-methods/ (accessed on 26 February 2023).
- Spearman’s Rank Correlation: The Definitive Guide to Understand|Simplilearn. Available online: https://www.simplilearn.com/tutorials/statistics-tutorial/spearmans-rank-correlation (accessed on 9 November 2022).
- Una Guía Para Principiantes Sobre La Regresión Lineal En Python Con Scikit-Learn. Available online: https://www.datasource.ai/es/data-science-articles/view-source:https://www.datasource.ai/es/data-science-articles/una-guia-para-principiantes-sobre-la-regresion-lineal-en-python-con-scikit-learn (accessed on 26 February 2023).
- Evaluando El Error En Los Modelos de Clasificación—Aprende IA. Available online: https://aprendeia.com/evaluando-el-error-en-los-modelos-de-clasificacion-machine-learning/ (accessed on 13 January 2023).
- Producto Interno Bruto (PIB)|Banco de La República. Available online: https://www.banrep.gov.co/es/glosario/producto-interno-bruto-pib (accessed on 18 November 2022).
- Google Earth Engine. Available online: https://earthengine.google.com (accessed on 3 February 2023).
- Microsoft Power BI. Available online: https://app.powerbi.com/view?r=eyJrIjoiNThmZTJmZWYtOWFhMy00OGE1LWFiNDAtMTJmYjM0NDA5NGY2IiwidCI6ImJmYjdlMTNhLTdmYjctNDAxNi04MzBjLWQzNzE2ZThkZDhiOCJ9 (accessed on 4 February 2023).
- Empleo y Desempleo. Available online: https://www.dane.gov.co/index.php/estadisticas-por-tema/mercado-laboral/empleo-y-desempleo (accessed on 18 November 2022).
- COVID-19 Community Mobility Report. Available online: https://www.google.com/covid19/mobility?hl=en (accessed on 18 November 2022).
- Casos Positivos de COVID-19 en Colombia | Datos Abiertos Colombia. Available online: https://www.datos.gov.co/Salud-y-Protecci-n-Social/Casos-positivos-de-COVID-19-en-Colombia/gt2j-8ykr (accessed on 1 December 2022).
- Multidimensional Index of COVID-19 Colombia. Available online: https://www.kaggle.com/datasets/sebastianrgonzalez/covid19-colombia (accessed on 26 February 2023).
- Sambangi, S.; Gondi, L. A Machine Learning Approach for DDoS (Distributed Denial of Service) Attack Detection Using Multiple Linear Regression. Proceedings 2020, 63, 51. [Google Scholar] [CrossRef]
- Zach RMSE vs. R-Squared: Which Metric Should You Use? Statology. 2021. Available online: https://www.statology.org/rmse-vs-r-squared/ (accessed on 26 February 2023).
- Explaining Negative R-Squared. Available online: https://towardsdatascience.com/explaining-negative-r-squared-17894ca26321 (accessed on 30 June 2023).
- John, V.; Liu, Z.; Guo, C.; Mita, S.; Kidono, K. Real-time lane estimation Using Deep features and extra trees regression. In Lecture Notes in Computer Science (Including Subseries Lecture Notes in Artificial Intelligence and Lecture Notes in Bioinformatics); Springer: Berlin/Heidelberg, Germany, 2016; Volume 9431, pp. 721–733. [Google Scholar] [CrossRef]
- Blobel, B.; Oemig, F.; Ruotsalainen, P.; Lopez, D.M. Transformation of Health and Social Care Systems—An Interdisciplinary Approach Toward a Foundational Architecture. Front. Med. 2022, 9, 802487. [Google Scholar] [CrossRef]
- Post Pruning Decision Trees with Cost Complexity Pruning. Available online: https://scikit-learn/stable/auto_examples/tree/plot_cost_complexity_pruning.html (accessed on 14 December 2022).
- sklearn.model_selection.GridSearchCV. Available online: https://scikit-learn/stable/modules/generated/sklearn.model_selection.GridSearchCV.html (accessed on 6 January 2023).
- Random Forest Python. Available online: https://www.cienciadedatos.net/documentos/py08_random_forest_python.html (accessed on 14 January 2023).
- Gradient Boosting Con Python. Available online: https://www.cienciadedatos.net/documentos/py09_gradient_boosting_python.html (accessed on 16 January 2023).
- sklearn.ensemble.ExtraTreesRegressor. Available online: https://scikit-learn/stable/modules/generated/sklearn.ensemble.ExtraTreesRegressor.html (accessed on 13 January 2023).
- sklearn.ensemble.AdaBoostRegressor. Available online: https://scikit-learn/stable/modules/generated/sklearn.ensemble.AdaBoostRegressor.html (accessed on 13 January 2023).

| Model | F1 Score | Precision | Recall | Accuracy |
|---|---|---|---|---|
| LinearDiscriminantAnalysis | 0.239 | 0.226 | 0.259 | 0.897 |
| QuadraticDiscriminantAnalysis | 0.192 | 0.185 | 0.2 | 0.927 |
| KNeighborsClassifier | 0.192 | 0.185 | 0.2 | 0.927 |
| DecisionTreeClassifier | 0.429 | 0.427 | 0.432 | 0.873 |
| GaussianNaiveBayes | 0.141 | 0.231 | 0.504 | 0.184 |
| SupportVectorMachine | 0.192 | 0.185 | 0.2 | 0.927 |
| Model | RMSE | R-Squared |
|---|---|---|
| Linear Regression | 0.013 | 0.358 |
| Decision Tree Regressor | 0.010 | 0.611 |
| K-Nearest Neighbor | 0.019 | −0.207 |
| Support Vector Machine | 0.033 | −2.697 |
| Random Forest Regressor | 0.007 | 0.790 |
| Gradient Boosting Regressor | 0.008 | 0.758 |
| Extra Trees Regressor | 0.007 | 0.828 |
| AdaBoost Regressor | 0.008 | 0.761 |
| Model | RMSE | R-Squared |
|---|---|---|
| Linear Regression | 0.013 | 0.319 |
| Decision Tree Regressor | 0.012 | 0.469 |
| K-Nearest Neighbor | 0.019 | −0.335 |
| Support Vector Machine | 0.030 | −2.496 |
| Random Forest Regressor | 0.008 | 0.720 |
| Gradient Boosting Regressor | 0.009 | 0.637 |
| Extra Trees Regressor | 0.009 | 0.700 |
| AdaBoost Regressor | 0.009 | 0.683 |
| Model | Hyper-Parameters | Base R-Squared | Base RMSE | R-Squared of the Optimized Model | RMSE of the Optimized Model |
|---|---|---|---|---|---|
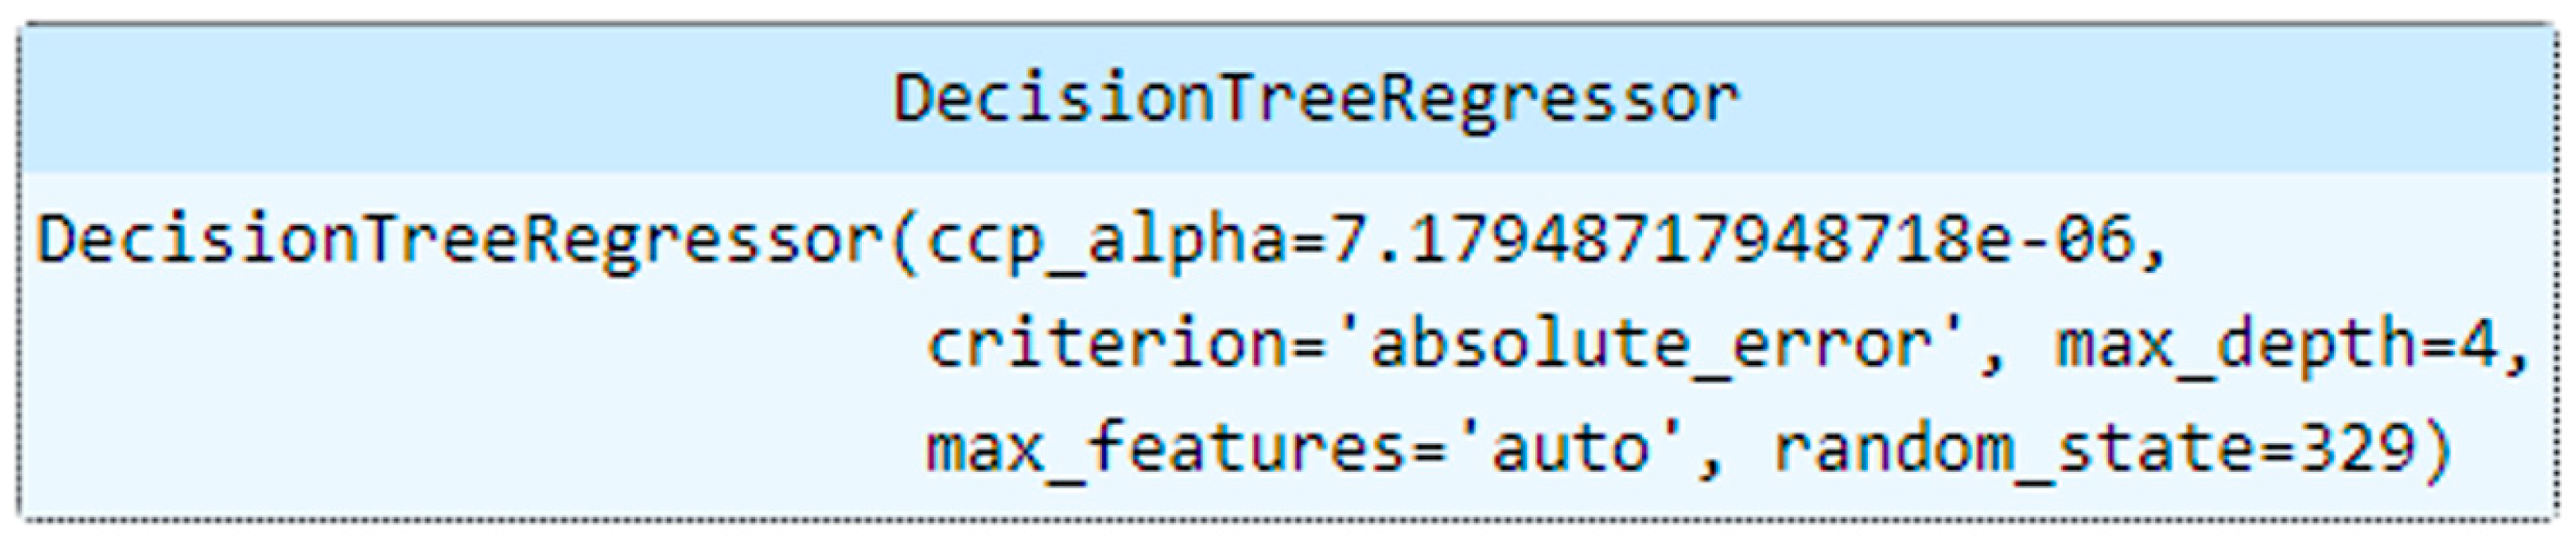
| Decision Tree Regressor | criterion = ‘absolute_error’ max_depth = 4 max_features = ‘auto’ random_state = 329 ccp_alpha = 7.179 × 10⁻⁶ | 0.611 | 0.010 | 0.708 | 0.009 |
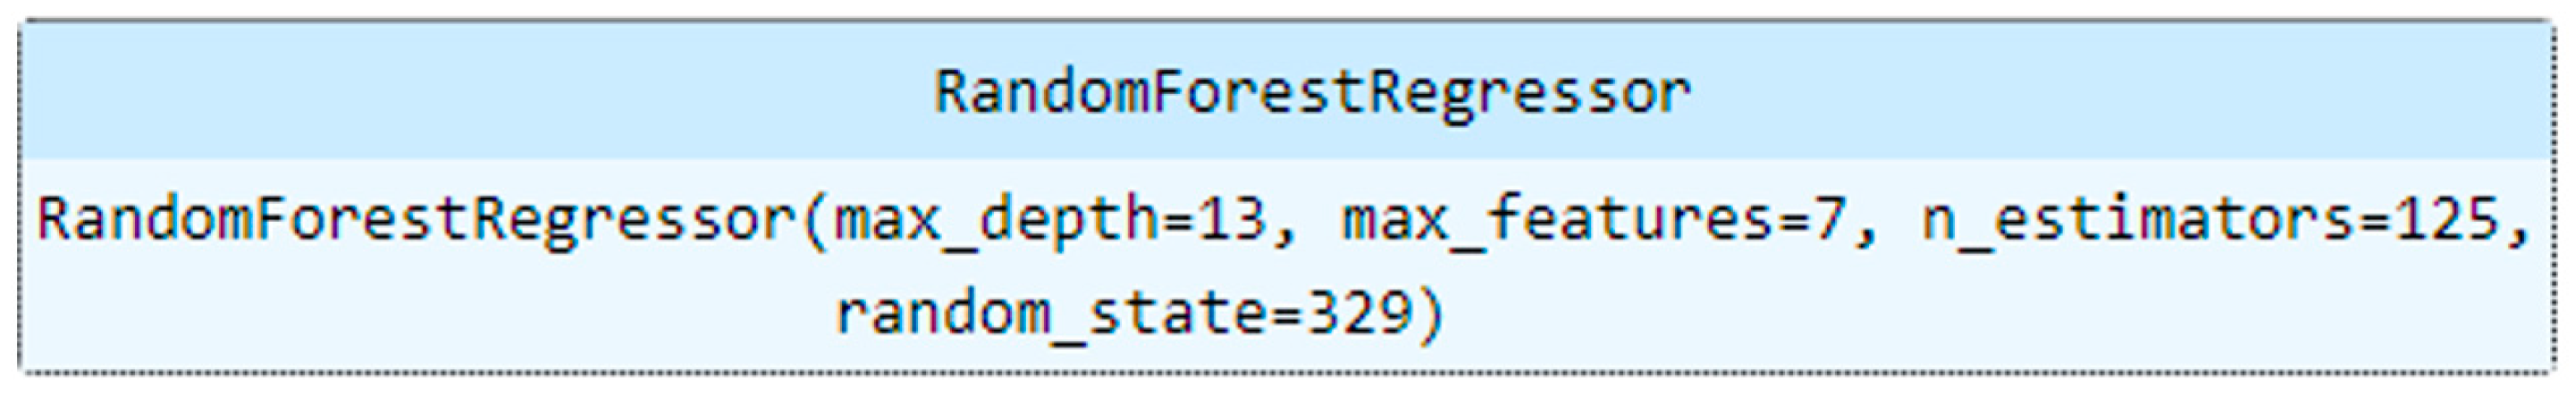
| Random Forest Regressor | max_depth = 13 max_features = 7 n_estimators = 125 random_state = 329 | 0.790 | 0.007 | 0.802 | 0.007 |
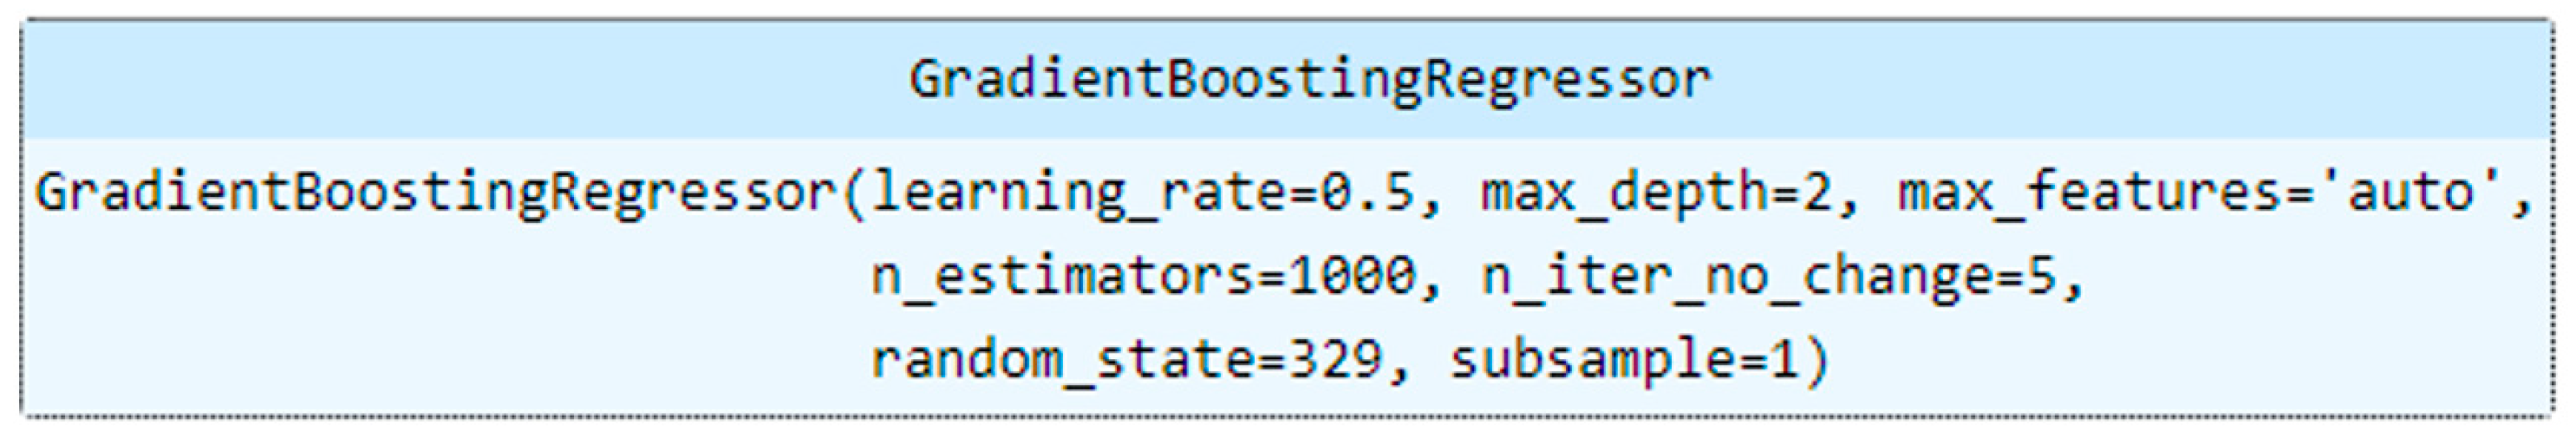
| Gradient Boosting Regressor | learning_rate = 0.5 max_depth = 2 max_features = ‘auto’ n_estimators = 1000 n_iter_no_change = 5 random_state = 329 subsample = 1 | 0.758 | 0.008 | 0.765 | 0.008 |
| Hist Gradient Regressor | learning_rate = 0.5 max_depth = 3 | Does not apply | Does not apply | 0.810 | 0.007 |
| Extra Trees Regressor | n_estimators = 97 max_features = None random_state = 329 | 0.828 | 0.007 | 0.829 | 0.007 |
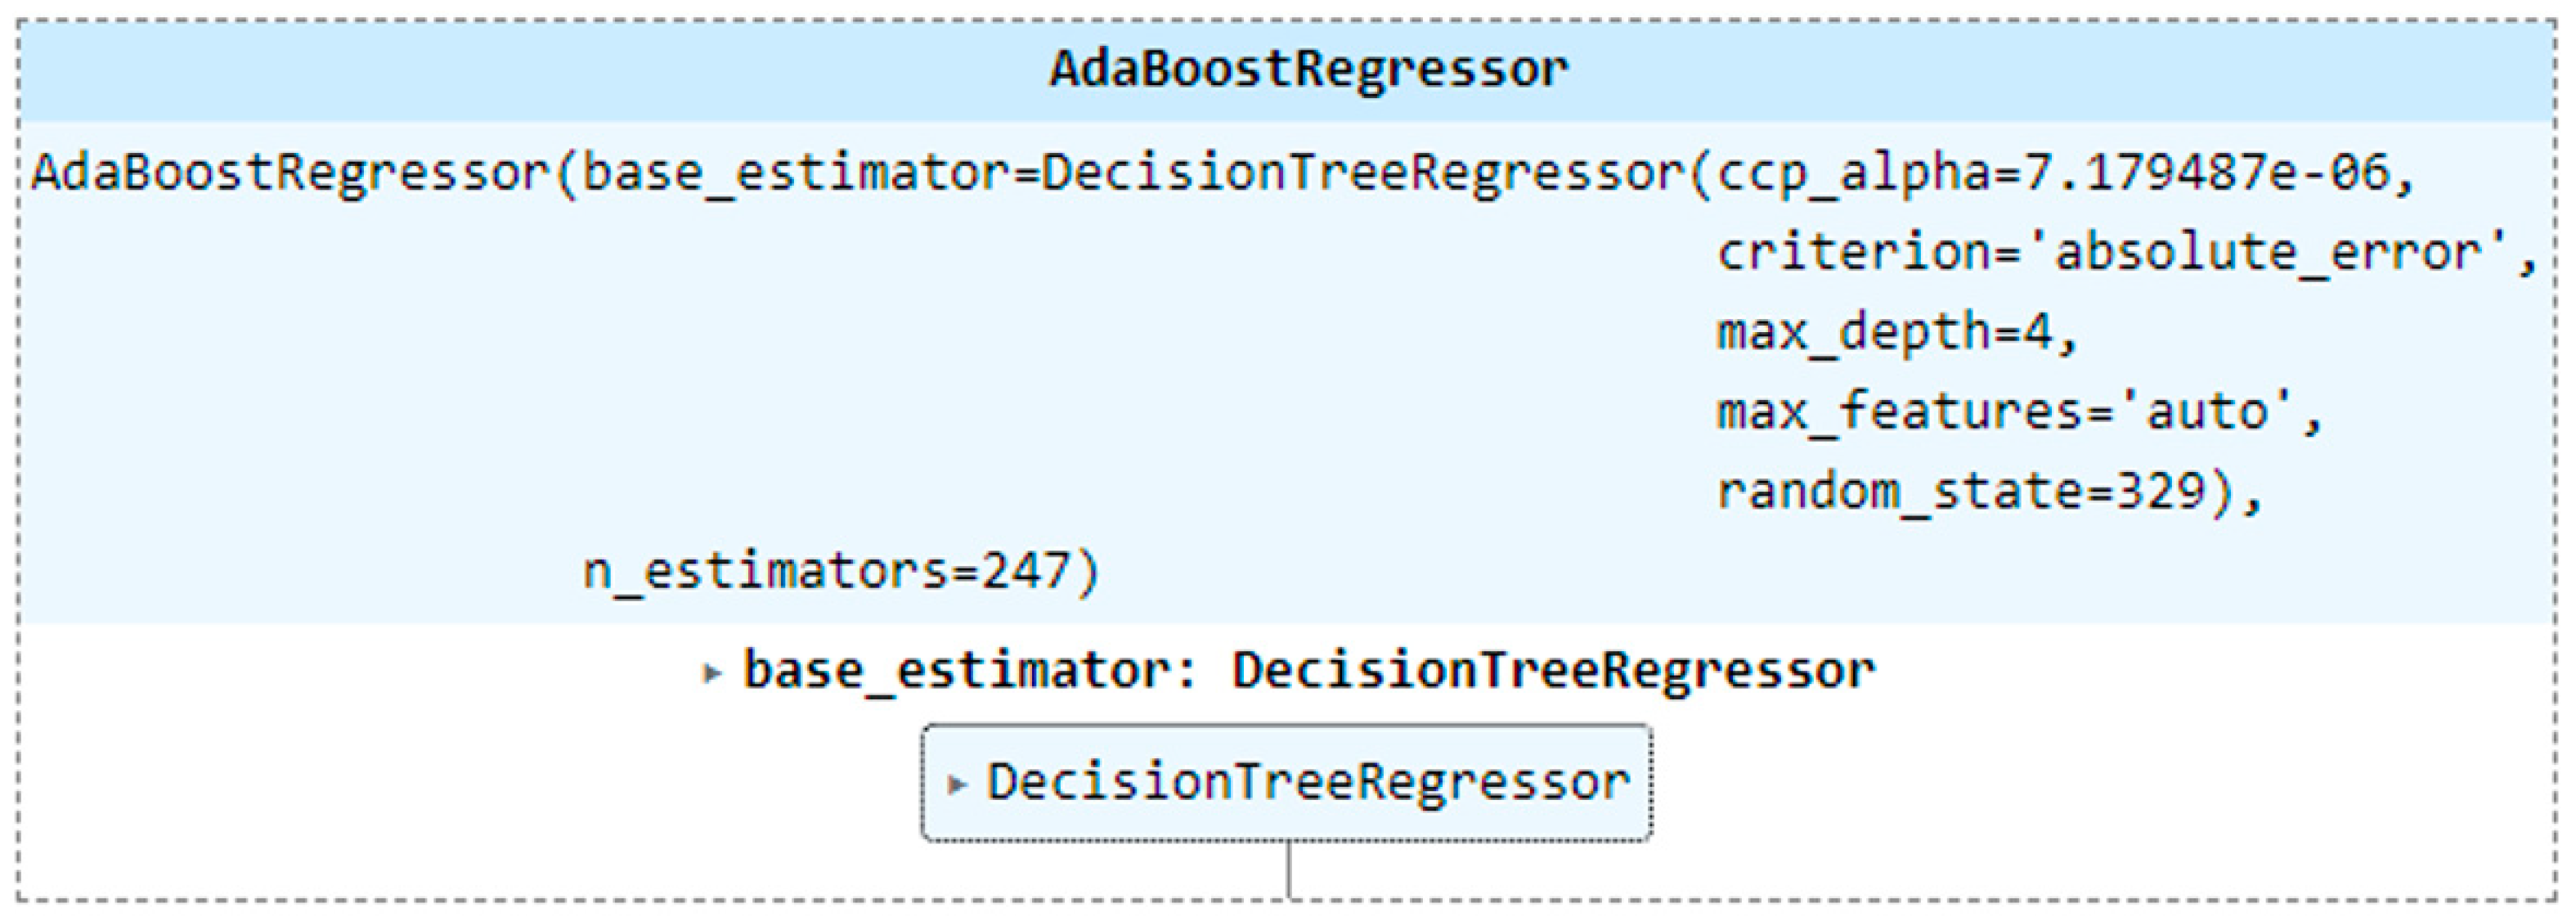
| AdaBoost Regressor * | n_estimators = 247 | 0.761 | 0.008 | 0.811 | 0.007 |
| Model | RMSE | R-Squared |
|---|---|---|
| Linear Regression | 0.016 | 0.090 |
| Decision Tree Regressor | 0.012 | 0.517 |
| K-Nearest Neighbor | 0.019 | −0.287 |
| Support Vector Machine | 0.033 | −2.697 |
| Random Forest Regressor | 0.010 | 0.608 |
| Gradient Boosting Regressor | 0.011 | 0.546 |
| Extra Trees Regressor | 0.011 | 0.561 |
| AdaBoost Regressor | 0.013 | 0.395 |
| Model | RMSE | R-Squared |
|---|---|---|
| Linear Regression | 0.016 | 0.033 |
| Decision Tree Regressor | 0.011 | 0.474 |
| K-Nearest Neighbor | 0.018 | −0.220 |
| Support Vector Machine | 0.030 | −2.496 |
| Random Forest Regressor | 0.010 | 0.596 |
| Gradient Boosting Regressor | 0.011 | 0.480 |
| Extra Trees Regressor | 0.011 | 0.535 |
| AdaBoost Regressor | 0.010 | 0.610 |
| Model | RMSE of Reference Predictor | RMSE of Multidimensional Index | R-Squared of Multidimensional Index | R-Squared of Reference Predictor |
|---|---|---|---|---|
| Decision Tree Regressor | 0.012 | 0.009 | 0.708 | 0.517 |
| Random Forest Regressor | 0.010 | 0.007 | 0.802 | 0.608 |
| Gradient Boosting Regressor | 0.011 | 0.008 | 0.765 | 0.546 |
| Extra Trees Regressor | 0.011 | 0.007 | 0.829 | 0.561 |
| AdaBoost Regressor | 0.013 | 0.007 | 0.811 | 0.395 |
Disclaimer/Publisher’s Note: The statements, opinions and data contained in all publications are solely those of the individual author(s) and contributor(s) and not of MDPI and/or the editor(s). MDPI and/or the editor(s) disclaim responsibility for any injury to people or property resulting from any ideas, methods, instructions or products referred to in the content. |
© 2023 by the authors. Licensee MDPI, Basel, Switzerland. This article is an open access article distributed under the terms and conditions of the Creative Commons Attribution (CC BY) license (https://creativecommons.org/licenses/by/4.0/).
Share and Cite
Rosero Perez, P.A.; Realpe Gonzalez, J.S.; Salazar-Cabrera, R.; Restrepo, D.; López, D.M.; Blobel, B. Multidimensional Machine Learning Model to Calculate a COVID-19 Vulnerability Index. J. Pers. Med. 2023, 13, 1141. https://doi.org/10.3390/jpm13071141
Rosero Perez PA, Realpe Gonzalez JS, Salazar-Cabrera R, Restrepo D, López DM, Blobel B. Multidimensional Machine Learning Model to Calculate a COVID-19 Vulnerability Index. Journal of Personalized Medicine. 2023; 13(7):1141. https://doi.org/10.3390/jpm13071141
Chicago/Turabian StyleRosero Perez, Paula Andrea, Juan Sebastián Realpe Gonzalez, Ricardo Salazar-Cabrera, David Restrepo, Diego M. López, and Bernd Blobel. 2023. "Multidimensional Machine Learning Model to Calculate a COVID-19 Vulnerability Index" Journal of Personalized Medicine 13, no. 7: 1141. https://doi.org/10.3390/jpm13071141
APA StyleRosero Perez, P. A., Realpe Gonzalez, J. S., Salazar-Cabrera, R., Restrepo, D., López, D. M., & Blobel, B. (2023). Multidimensional Machine Learning Model to Calculate a COVID-19 Vulnerability Index. Journal of Personalized Medicine, 13(7), 1141. https://doi.org/10.3390/jpm13071141