

Airborne Particulate Matter Size and Chronic Obstructive Pulmonary Disease Exacerbations: A Prospective, Risk-Factor Analysis Comparing Global Initiative for Obstructive Lung Disease 3 and 4 Categories

 ,
,  , ,
, ,  and
and
Abstract
:1. Introduction
2. Materials and Methods
2.1. Study Design and Ethics
2.2. Inclusion and Exclusion Criteria
2.3. Data Collection, Definitions, and Procedures
2.4. Study Variables
2.5. Statistical Analysis
3. Results
4. Discussion
4.1. Literature Findings
4.2. Study Limitations
5. Conclusions
Author Contributions
Funding
Institutional Review Board Statement
Informed Consent Statement
Data Availability Statement
Conflicts of Interest
References
- Devine, J.F. Chronic obstructive pulmonary disease: An overview. Am. Health Drug Benefits 2008, 1, 34–42. [Google Scholar]
- Barata, P.I.; Crisan, A.F.; Maritescu, A.; Negrean, R.A.; Rosca, O.; Bratosin, F.; Citu, C.; Oancea, C. Evaluating Virtual and Inpatient Pulmonary Rehabilitation Programs for Patients with COPD. J. Pers. Med. 2022, 12, 1764. [Google Scholar] [CrossRef]
- Alobaidi, N.Y.; Stockley, J.A.; Stockley, R.A.; Sapey, E. An overview of exacerbations of chronic obstructive pulmonary disease: Can tests of small airways’ function guide diagnosis and management? Ann. Thorac. Med. 2020, 15, 54–63. [Google Scholar] [CrossRef]
- Mathioudakis, A.G.; Janssens, W.; Sivapalan, P.; Singanayagam, A.; Dransfield, M.T.; Jensen, J.S.; Vestbo, J. Acute exacerbations of chronic obstructive pulmonary disease: In search of diagnostic biomarkers and treatable traits. Thorax 2020, 75, 520–527. [Google Scholar] [CrossRef]
- Pescaru, C.C.; Crisan, A.F.; Marc, M.; Trusculescu, A.A.; Maritescu, A.; Pescaru, A.; Sumenkova, A.; Bratosin, F.; Oancea, C.; Vastag, E. A Systematic Review of Telemedicine-Driven Pulmonary Rehabilitation after the Acute Phase of COVID-19. J. Clin. Med. 2023, 12, 4854. [Google Scholar] [CrossRef]
- Xing, Y.F.; Xu, Y.H.; Shi, M.H.; Lian, Y.X. The impact of PM2.5 on the human respiratory system. J. Thorac. Dis. 2016, 8, E69–E74. [Google Scholar] [CrossRef] [PubMed]
- Were, F.H.; Wafula, G.A.; Lukorito, C.B.; Kamanu, T.K.K. Levels of PM10 and PM2.5 and Respiratory Health Impacts on School-Going Children in Kenya. J. Health Pollut. 2020, 10, 200912. [Google Scholar] [CrossRef] [PubMed]
- Patel, A.R.; Patel, A.R.; Singh, S.; Singh, S.; Khawaja, I. Global Initiative for Chronic Obstructive Lung Disease: The Changes Made. Cureus 2019, 11, e4985. [Google Scholar] [CrossRef] [PubMed]
- Yawn, B.P.; Mintz, M.L.; Doherty, D.E. GOLD in Practice: Chronic Obstructive Pulmonary Disease Treatment and Management in the Primary Care Setting. Int. J. Chron. Obstr. Pulm. Dis. 2021, 16, 289–299. [Google Scholar] [CrossRef] [PubMed]
- Karloh, M.; Fleig Mayer, A.; Maurici, R.; Pizzichini, M.M.M.; Jones, P.W.; Pizzichini, E. The COPD Assessment Test: What Do We Know So Far? A Systematic Review and Meta-Analysis About Clinical Outcomes Prediction and Classification of Patients into GOLD Stages. Chest 2016, 149, 413–425. [Google Scholar] [CrossRef] [PubMed]
- Cheng, S.L.; Lin, C.H.; Wang, C.C.; Chan, M.C.; Hsu, J.Y.; Hang, L.W.; Perng, D.W.; Yu, C.J.; Wang, H.C. Taiwan Clinical Trial Consortium for Respiratory Disease (TCORE). Comparison between COPD Assessment Test (CAT) and modified Medical Research Council (mMRC) dyspnea scores for evaluation of clinical symptoms, comorbidities and medical resources utilization in COPD patients. J. Formos. Med. Assoc. 2019, 118 Pt 3, 429–435. [Google Scholar] [CrossRef]
- Voica, A.S.; Oancea, C.; Tudorache, E.; Crisan, A.F.; Fira-Mladinescu, O.; Tudorache, V.; Timar, B. Chronic obstructive pulmonary disease phenotypes and balance impairment. Int. J. Chron. Obstr. Pulm. Dis. 2016, 11, 919–925. [Google Scholar] [CrossRef]
- Kim, S.; Oh, J.; Kim, Y.I.; Ban, H.J.; Kwon, Y.S.; Oh, I.J.; Kim, K.S.; Kim, Y.C.; Lim, S.C. Differences in classification of COPD group using COPD assessment test (CAT) or modified Medical Research Council (mMRC) dyspnea scores: A cross-sectional analyses. BMC Pulm. Med. 2013, 13, 35. [Google Scholar] [CrossRef] [PubMed]
- Crişan, A.F.; Oancea, C.; Timar, B.; Fira-Mladinescu, O.; Tudorache, V. Balance impairment in patients with COPD. PLoS ONE 2015, 10, e0120573. [Google Scholar] [CrossRef]
- Natori, H.; Kawayama, T.; Suetomo, M.; Kinoshita, T.; Matsuoka, M.; Matsunaga, K.; Okamoto, M.; Hoshino, T. Evaluation of the Modified Medical Research Council Dyspnea Scale for Predicting Hospitalization and Exacerbation in Japanese Patients with Chronic Obstructive Pulmonary Disease. Intern. Med. 2016, 55, 15–24. [Google Scholar] [CrossRef]
- Schraufnagel, D.E. The health effects of ultrafine particles. Exp. Mol. Med. 2020, 52, 311–317. [Google Scholar] [CrossRef] [PubMed]
- Dondi, A.; Carbone, C.; Manieri, E.; Zama, D.; Del Bono, C.; Betti, L.; Biagi, C.; Lanari, M. Outdoor Air Pollution and Childhood Respiratory Disease: The Role of Oxidative Stress. Int. J. Mol. Sci. 2023, 24, 4345. [Google Scholar] [CrossRef]
- Mukherjee, S.; Dasgupta, S.; Mishra, P.K.; Chaudhury, K. Air pollution-induced epigenetic changes: Disease development and a possible link with hypersensitivity pneumonitis. Environ. Sci. Pollut. Res. Int. 2021, 28, 55981–56002. [Google Scholar] [CrossRef]
- Mack, S.M.; Madl, A.K.; Pinkerton, K.E. Respiratory Health Effects of Exposure to Ambient Particulate Matter and Bioaerosols. Compr. Physiol. 2019, 10, 1–20. [Google Scholar] [CrossRef]
- Crişan, A.F.; Oancea, C.; Timar, B.; Fira-Mladinescu, O.; Crişan, A.; Tudorache, V. Cognitive impairment in chronic obstructive pulmonary disease. PLoS ONE 2014, 9, e102468. [Google Scholar] [CrossRef]
- Burkes, R.M.; Gassett, A.J.; Ceppe, A.S.; Anderson, W.; O’Neal, W.K.; Woodruff, P.G.; Krishnan, J.A.; Barr, R.G.; Han, M.K.; Martinez, F.J.; et al. Current and former investigators of the SPIROMICS sites and reading centers. Rural Residence and Chronic Obstructive Pulmonary Disease Exacerbations. Analysis of the SPIROMICS Cohort. Ann. Am. Thorac. Soc. 2018, 15, 808–816. [Google Scholar] [CrossRef] [PubMed]
- Barata, P.I.; Marc, M.S.; Tudorache, E.; Frandes, M.; Crisan, A.F.; Olar, D.C.; Oancea, C. Self-reported sleep disturbance and mild cognitive impairment in COPD patients with severe airflow limitation. Clin. Respir. J. 2021, 15, 808–814. [Google Scholar] [CrossRef]
- Vimercati, L. Traffic related air pollution and respiratory morbidity. Lung India 2011, 28, 238. [Google Scholar] [CrossRef] [PubMed]
- Hogea, P.; Tudorache, E.; Fira-Mladinescu, O.; Marc, M.; Velescu, D.; Manolescu, D.; Bratosin, F.; Rosca, O.; Mavrea, A.; Oancea, C. Serum and Bronchoalveolar Lavage Fluid Levels of Cytokines in Patients with Lung Cancer and Chronic Lung Disease: A Prospective Comparative Study. J. Pers. Med. 2023, 13, 998. [Google Scholar] [CrossRef] [PubMed]
- Pacurari, A.C.; Bhattarai, S.; Muhammad, A.; Avram, C.; Mederle, A.O.; Rosca, O.; Bratosin, F.; Bogdan, I.; Fericean, R.M.; Biris, M.; et al. Diagnostic Accuracy of Machine Learning AI Architectures in Detection and Classification of Lung Cancer: A Systematic Review. Diagnostics 2023, 13, 2145. [Google Scholar] [CrossRef]
- Jiao, Y.; Gong, C.; Wang, S.; Duan, Y.; Zhang, Y. The Influence of Air Pollution on Pulmonary Disease Incidence Analyzed Based on Grey Correlation Analysis. Contrast Media Mol. Imaging 2022, 2022, 4764720. [Google Scholar] [CrossRef] [PubMed]
- Jiang, X.Q.; Mei, X.D.; Feng, D. Air pollution and chronic airway diseases: What should people know and do? J. Thorac. Dis. 2016, 8, E31–E40. [Google Scholar] [CrossRef]
- Nazar, W.; Niedoszytko, M. Air Pollution in Poland: A 2022 Narrative Review with Focus on Respiratory Diseases. Int. J. Environ. Res. Public Health 2022, 19, 895. [Google Scholar] [CrossRef]
- Güder, G.; Brenner, S.; Angermann, C.E.; Ertl, G.; Held, M.; Sachs, A.P.; Lammers, J.W.; Zanen, P.; Hoes, A.W.; Störk, S.; et al. GOLD or lower limit of normal definition? A comparison with expert-based diagnosis of chronic obstructive pulmonary disease in a prospective cohort-study. Respir. Res. 2012, 13, 13. [Google Scholar] [CrossRef]
- Velea, L.; Udriștioiu, M.T.; Puiu, S.; Motișan, R.; Amarie, D. A Community-Based Sensor Network for Monitoring the Air Quality in Urban Romania. Atmosphere 2023, 14, 840. [Google Scholar] [CrossRef]
- Gil, H.I.; Zo, S.; Jones, P.W.; Kim, B.G.; Kang, N.; Choi, Y.; Cho, H.K.; Kang, D.; Cho, J.; Park, H.Y.; et al. Clinical Characteristics of COPD Patients According to COPD Assessment Test (CAT) Score Level: Cross-Sectional Study. Int. J. Chron. Obstr. Pulm. Dis. 2021, 16, 1509–1517. [Google Scholar] [CrossRef]
- Pisi, R.; Aiello, M.; Calzetta, L.; Frizzelli, A.; Tzani, P.; Bertorelli, G.; Chetta, A. The COPD assessment test and the modified Medical Research Council scale are not equivalent when related to the maximal exercise capacity in COPD patients. Pulmonology 2023, 29, 194–199. [Google Scholar] [CrossRef] [PubMed]
- Atkinson, R.W.; Carey, I.M.; Kent, A.J.; Van Staa, T.P.; Anderson, H.R.; Cook, D.G. Long-term exposure to outdoor air pollution and the incidence of chronic obstructive pulmonary disease in a national English cohort. Occup. Environ. Med. 2015, 72, 42–48. [Google Scholar] [CrossRef] [PubMed]
- Schikowski, T.; Sugiri, D.; Ranft, U.; Gehring, U.; Heinrich, J.; Wichmann, H.; Krämer, U. Long-term air pollution exposure and living close to busy roads are associated with COPD in women. Respir. Res. 2005, 6, 152. [Google Scholar] [CrossRef]
- Liu, S.; Zhou, Y.; Liu, S.; Chen, X.; Zou, W.; Zhao, D.; Li, X.; Pu, J.; Huang, L.; Chen, J.; et al. Association between exposure to ambient particulate matter and chronic obstructive pulmonary disease: Results from a cross-sectional study in China. Thorax 2017, 72, 788–795. [Google Scholar] [CrossRef]
- Ko, F.W.; Hui, D.S. Air pollution and chronic obstructive pulmonary disease. Respirology 2012, 17, 395–401. [Google Scholar] [CrossRef] [PubMed]
- Rice, M.B.; Ljungman, P.L.; Wilker, E.H.; Dorans, K.S.; Gold, D.R.; Schwartz, J.; Koutrakis, P.; Washko, G.R.; O’Connor, G.T.; Mittleman, M.A. Long-term exposure to traffic emissions and fine particulate matter and lung function decline in the Framingham Heart Study. Am. J. Respir. Crit. Care Med. 2015, 191, 656–664. [Google Scholar] [CrossRef] [PubMed]
- Rice, M.B.; Rifas-Shiman, S.M.; Litonjua, A.A.; Oken, E.; Gillman, M.W.; Kloog, I.; Luttmann-Gibson, H.; Zanobetti, A.; Coull, B.A.; Schwartz, J.; et al. Lifetime exposure to ambient pollution and lung function in children. Am. J. Respir. Crit. Care Med. 2015, 193, 881–888. [Google Scholar] [CrossRef]
- Kariisa, M.; Foraker, R.; Pennell, M.; Buckley, T.; Diaz, P.; Criner, G.J.; Wilkins, J.R., III. Short- and long-term effects of ambient ozone and fine particulate matter on the respiratory health of chronic obstructive pulmonary disease subjects. Arch. Environ. Occup. Health 2015, 70, 56–62. [Google Scholar] [CrossRef]
- Lepeule, J.; Litonjua, A.A.; Coull, B.; Koutrakis, P.; Sparrow, D.; Vokonas, P.S.; Schwartz, J. Long-term effects of traffic particles on lung function decline in the elderly. Am. J. Respir. Crit. Care Med. 2014, 190, 542–548. [Google Scholar] [CrossRef]
- Schikowski, T.; Adam, M.; Marcon, A.; Cai, Y.; Vierkötter, A.; Carsin, A.E.; Jacquemin, B.; Al Kanani, Z.; Beelen, R.; Birk, M.; et al. Association of ambient air pollution with the prevalence and incidence of COPD. Eur. Respir. J. 2014, 44, 614–626. [Google Scholar] [CrossRef] [PubMed]
- Saha, L.; Kumar, A.; Kumar, S.; Korstad, J.; Srivastava, S.; Bauddh, K. The impact of the COVID-19 lockdown on global air quality: A review. Environ. Sustain. 2022, 5, 5–23. [Google Scholar] [CrossRef] [PubMed]


| Variables * | GOLD 3 (n = 47) | GOLD 4 (n = 32) | p-Value |
|---|---|---|---|
| Age (mean ± SD) | 66.5 ± 9.1 | 62.6 ± 9.4 | 0.068 |
| Sex (male) | 34 (72.3%) | 27 (84.4%) | 0.210 |
| Education | 0.342 | ||
| Elementary school | 12 (25.5%) | 13 (40.6%) | |
| Junior and high school | 28 (59.6%) | 16 (50.0%) | |
| University degree | 7 (14.9%) | 3 (9.4%) | |
| Smoking status | 0.561 | ||
| Active smoker | 13 (27.7%) | 12 (37.5%) | |
| Former smoker | 32 (68.1%) | 18 (56.3%) | |
| Never smoker | 2 (4.3%) | n (6.3%) | |
| Secondhand smoker | 22 (46.8%) | 15 (46.9%) | 0.995 |
| Pack years (mean ± SD) | 39.7 ± 17.3 | 37.9 ± 17.1 | 0.649 |
| Level of daily activity | 0.301 | ||
| <30 min | 17 (36.2%) | 17 (53.1%) | |
| 30–60 min | 16 (34.0%) | 9 (28.1%) | |
| >60 min | 14 (29.8%) | 6 (18.8%) | |
| Signs and symptoms | |||
| Cough | 38 (80.9%) | 23 (71.9%) | 0.350 |
| Phlegm | 30 (63.8%) | 19 (59.4%) | 0.689 |
| Dyspnea | 32 (68.1%) | 27 (84.4%) | 0.102 |
| Wheezing | 20 (42.6%) | 10 (31.3%) | 0.309 |
| Chest constriction | 14 (29.8%) | 10 (31.3%) | 0.889 |
| Number of COPD exacerbations (mean ± SD) | 5.2 ± 2.1 | 7.4 ± 2.3 | <0.001 |
| BMI (kg/m2) | 0.018 | ||
| <18.5 | 2 (4.3%) | 4 (12.5%) | |
| 18.5–25 | 13 (27.7%) | 16 (50.0%) | |
| 25–30 | 13 (27.7%) | 7 (21.9%) | |
| >30 | 19 (40.4%) | 5 (15.6%) | |
| Comorbidities | |||
| Cardiovascular | 44 (93.6%) | 25 (78.1%) | 0.042 |
| Pulmonary ** | 13 (27.7%) | 19 (59.4%) | 0.004 |
| Diabetes mellitus | 8 (17.0%) | 2 (6.3%) | 0.157 |
| Cerebrovascular | 3 (6.4%) | 2 (6.3%) | 0.980 |
| Renal disease | 2 (4.3%) | 2 (6.3%) | 0.691 |
| Variables | GOLD 3 (n = 47) | GOLD 4 (n = 32) | p-Value |
|---|---|---|---|
| Place of residence (urban) | 39 (83.0%) | 22 (68.8%) | 0.138 |
| Living area size (mean ± SD) | 79.1 ± 42.4 | 61.3 ± 30.4 | 0.044 |
| Living area | 0.017 | ||
| <30 m2 | 3 (6.4%) | 7 (21.9%) | |
| 30–60 m2 | 17 (36.2%) | 16 (50.0%) | |
| >60 m2 | 27 (57.4%) | 9 (28.1%) | |
| Distance to main road | 0.215 | ||
| <50 m | 19 (40.4%) | 7 (21.9%) | |
| 50–200 m | 10 (21.3%) | 10 (31.3%) | |
| >200 m | 18 (38.3%) | 15 (46.9%) | |
| Distance to main road, meters (mean ± SD) | 3823.4 ± 1517.2 | 800.2 ± 209.5 | <0.001 |
| Building height (mean ± SD) | 10.6 ± 4.9 | 10.1 ± 2.6 | 0.598 |
| Cooking source | |||
| Gas | 45 (95.7%) | 30 (85.7%) | 0.107 |
| Electric | 2 (4.3%) | 1 (2.9%) | 0.738 |
| Biomass | 2 (4.3%) | 4 (11.4%) | 0.217 |
| Type of heating | |||
| Gas | 39 (83.0%) | 20 (42.6%) | 0.009 |
| Electric | 2 (4.3%) | 4 (11.4%) | 0.217 |
| Biomass | 8 (17.0%) | 11 (31.4%) | 0.126 |
| Variables * | GOLD 3 (n = 47) | GOLD 4 (n = 32) | p-Value |
|---|---|---|---|
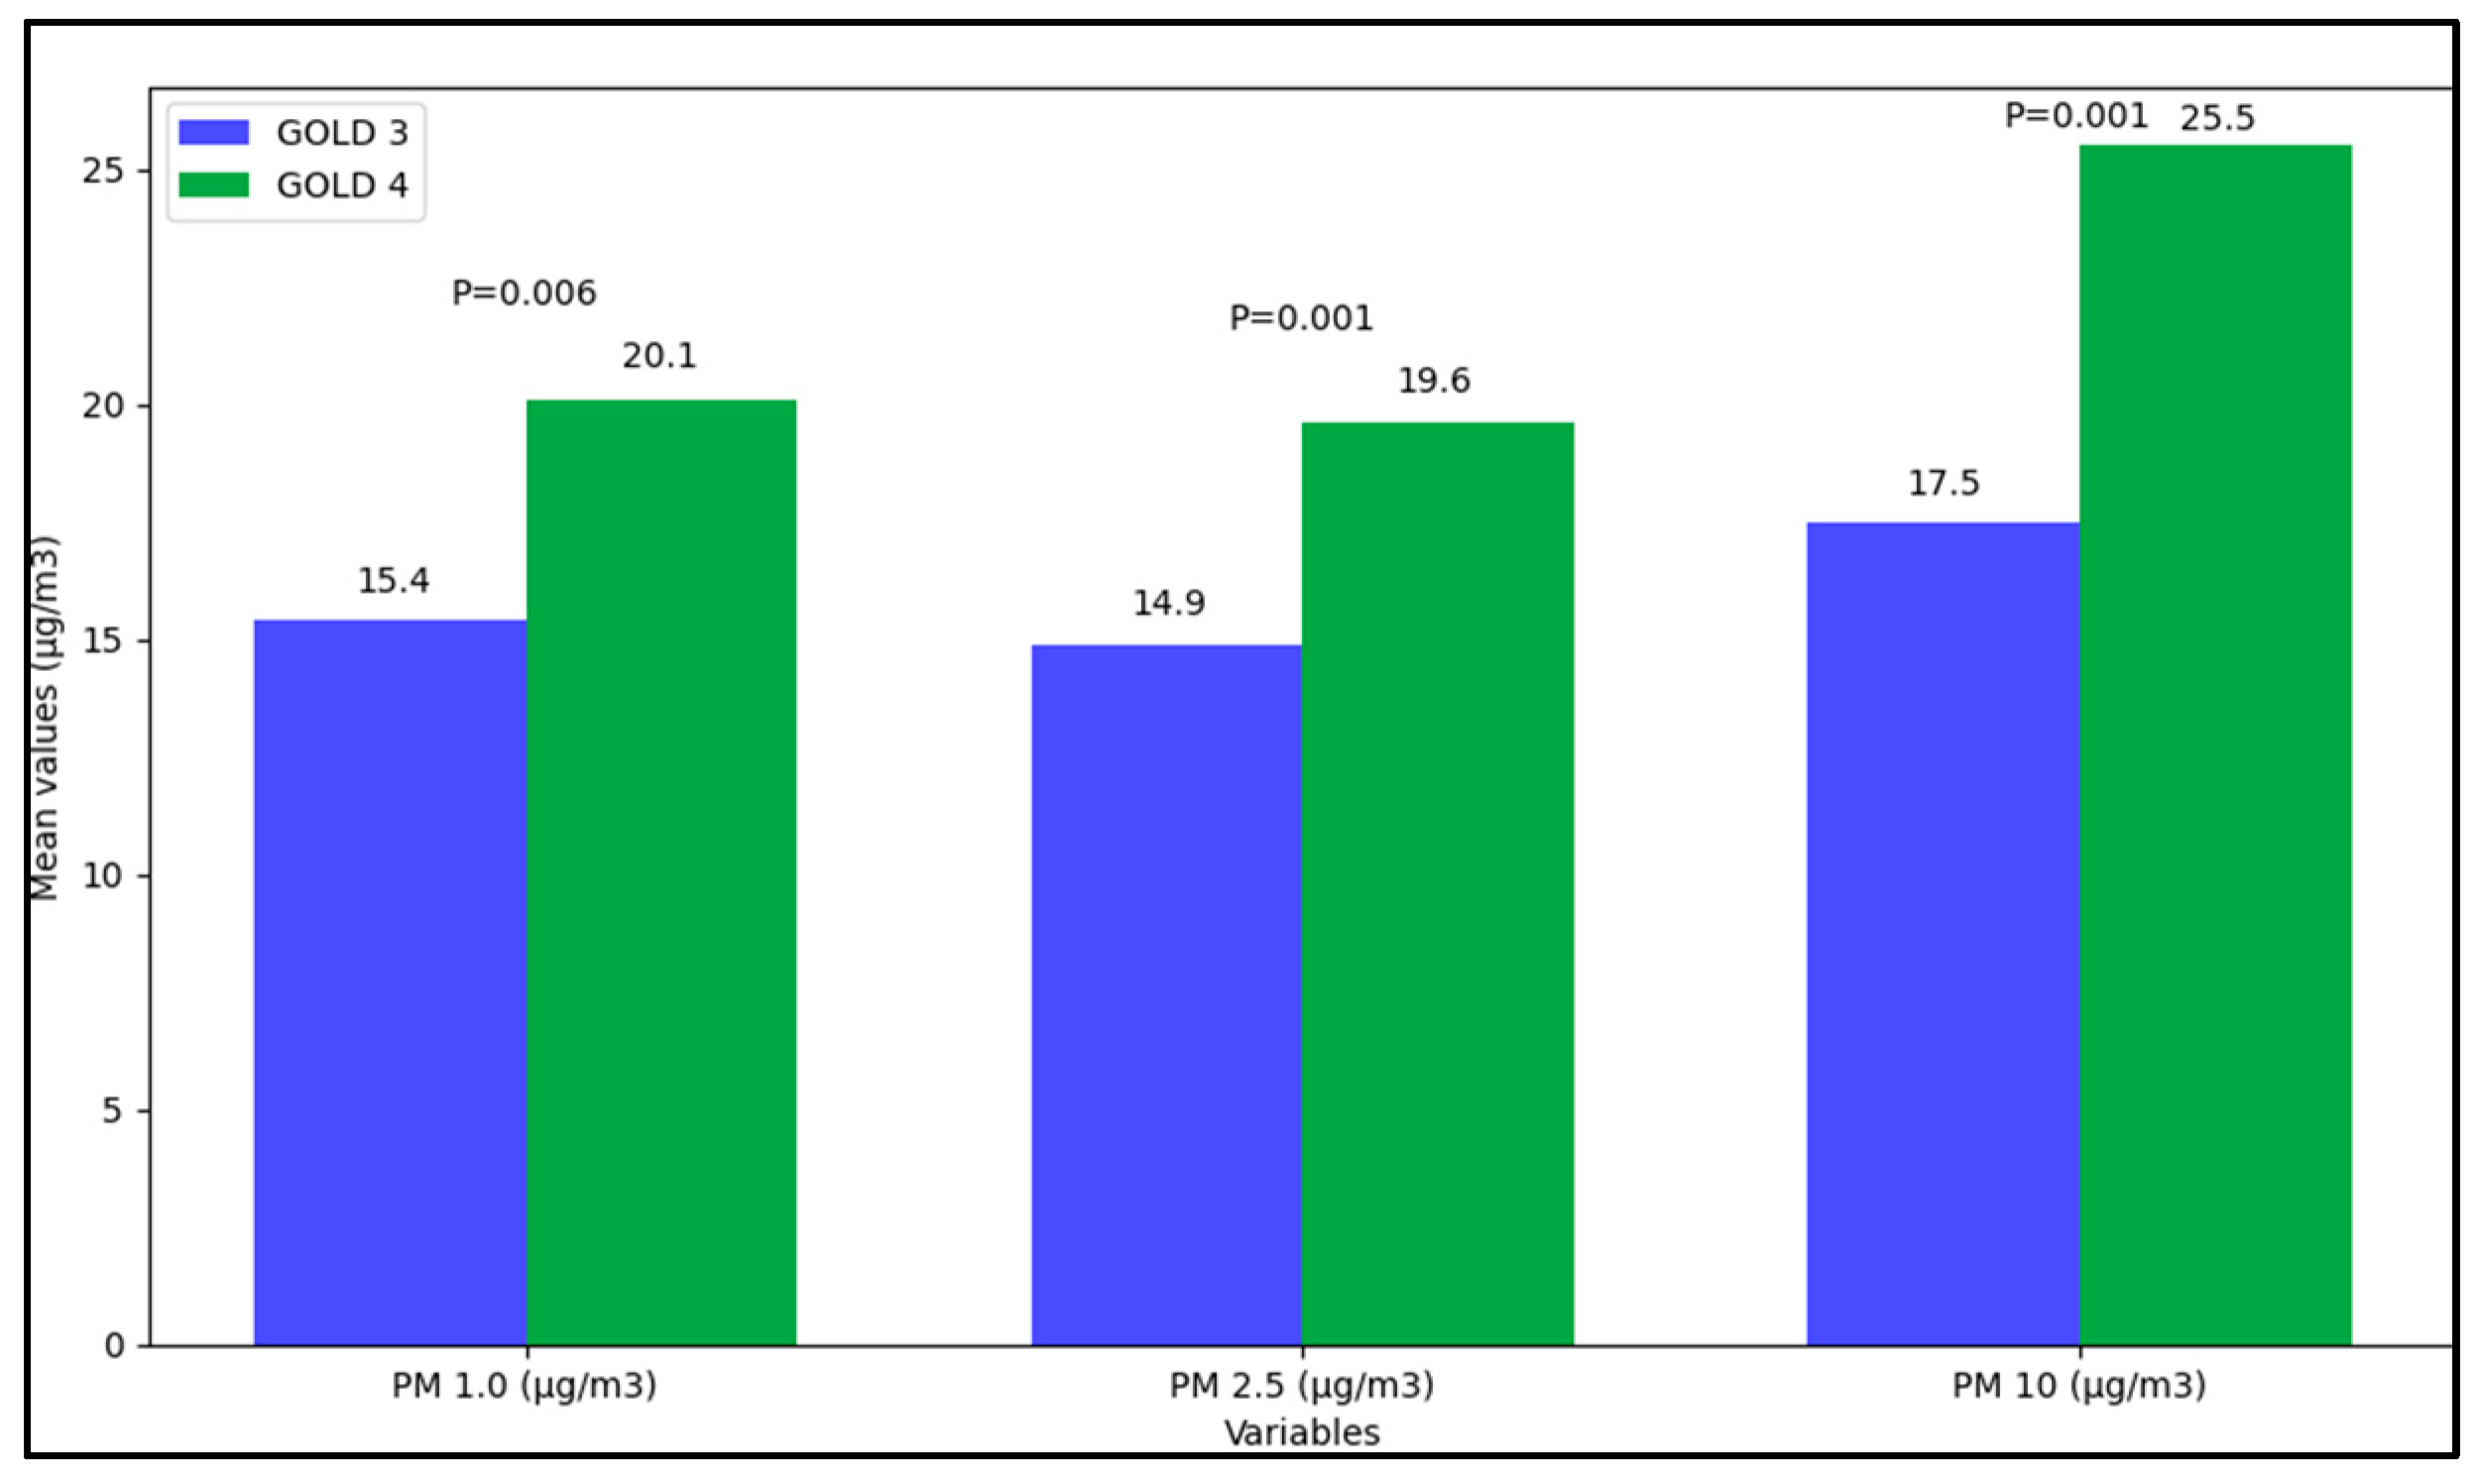
| PM 1.0 (µg/m3) | |||
| Minimum values | 3.2 (6.0) | 1.3 (5.1) | 0.146 |
| Maximum values | 105.5 (243.5) | 156.7 (273.1) | <0.001 |
| Mean values | 15.4 (71.4) | 20.1 (30.6) | 0.006 |
| PM 2.5 (µg/m3) | |||
| Minimum values | 1.9 (5.8) | 3.6 (6.9) | 0.168 |
| Maximum values | 147.9 (402.1) | 140.1 (428.8) | 0.493 |
| Mean values | 14.9 (38.9) | 19.6 (77.2) | 0.001 |
| PM 10 (µg/m3) | |||
| Minimum values | 1.6 (6.3) | 3.7 (7.3) | 0.227 |
| Maximum values | 123.8 (350.2) | 199.4 (568.2) | <0.001 |
| Mean values | 17.5 (38.0) | 25.5 (63.4) | <0.001 |
| Temperature (°C) | |||
| Minimum values | 18.8 (8.2) | 21.9 (7.6) | 0.116 |
| Maximum values | 28.3 (4.1) | 29.2 (6.3) | 0.304 |
| Mean values | 24.6 (5.3) | 26.9 (7.6) | 0.660 |
| Humidity (%) | |||
| Minimum values | 39.5 (5.8) | 38.5 (7.2) | 0.538 |
| Maximum values | 56.5 (8.9) | 53.5 (9.3) | 0.092 |
| Mean values | 45.4 (5.8) | 43.9 (8.7) | 0.274 |
| Pressure (atm) | |||
| Minimum values | 1007.9 (13.1) | 1003.7 (11.6) | 0.319 |
| Maximum values | 1016.4 (10.3) | 1014.9 (8.3) | 0.563 |
| Mean values | 1011.6 (13.8) | 1008.9 (9.0) | 0.183 |
| Variables * | GOLD 3 (n = 47) | GOLD 4 (n = 32) | p-Value |
|---|---|---|---|
| Frequent exacerbations, n (%) | 18 (38.3%) | 20 (57.1%) | 0.090 |
| Oxygen supplementation at home, n (%) | 27 (57.4%) | 22 (62.9%) | 0.621 |
| Spirometry | |||
| FEV1 (%) | 40.0 (8.9) | 23.5 (7.2) | <0.001 |
| FEV1 (L) | 1.04 (0.40) | 0.65 (0.28) | <0.001 |
| FVC (%) | 58.6 (10.5) | 40.1 (12.5) | <0.001 |
| FVC (L) | 1.91 (0.69) | 1.38 (0.49) | <0.001 |
| FEV1/FVC (%) | 55.1 (10.8) | 44.9 (11.1) | <0.001 |
| FEF 25–75 (L) | 0.50 (0.26) | 0.31 (0.16) | <0.001 |
| FEF 25–75 (%) | 18.3 (10.0) | 10.2 (4.3) | <0.001 |
| COPD assessment | |||
| CAT | 22.9 ± 6.5 | 25.5 ± 7.4 | 0.103 |
| mMRC | 2.9 ± 0.7 | 3.2 ± 0.7 | 0.065 |
| Other studies | |||
| Systolic BP (mean ± SD) | 130.2 ± 18.9 | 132.9 ± 16.2 | 0.512 |
| Diastolic BP (mean ± SD) | 79.9 ± 10.4 | 78.6 ± 10.1 | 0.582 |
| Creatinine (mean ± SD) | 0.8 ± 0.2 | 0.9 ± 0.3 | 0.079 |
| BUN (mean ± SD) | 41.8 ± 19.2 | 32.9 ± 12.9 | 0.024 |
| Glucose (mean ± SD) | 114.8 ± 40.4 | 105.5 ± 35.8 | 0.297 |
| Variables | β | SE | OR | 95% CI | p-Value |
|---|---|---|---|---|---|
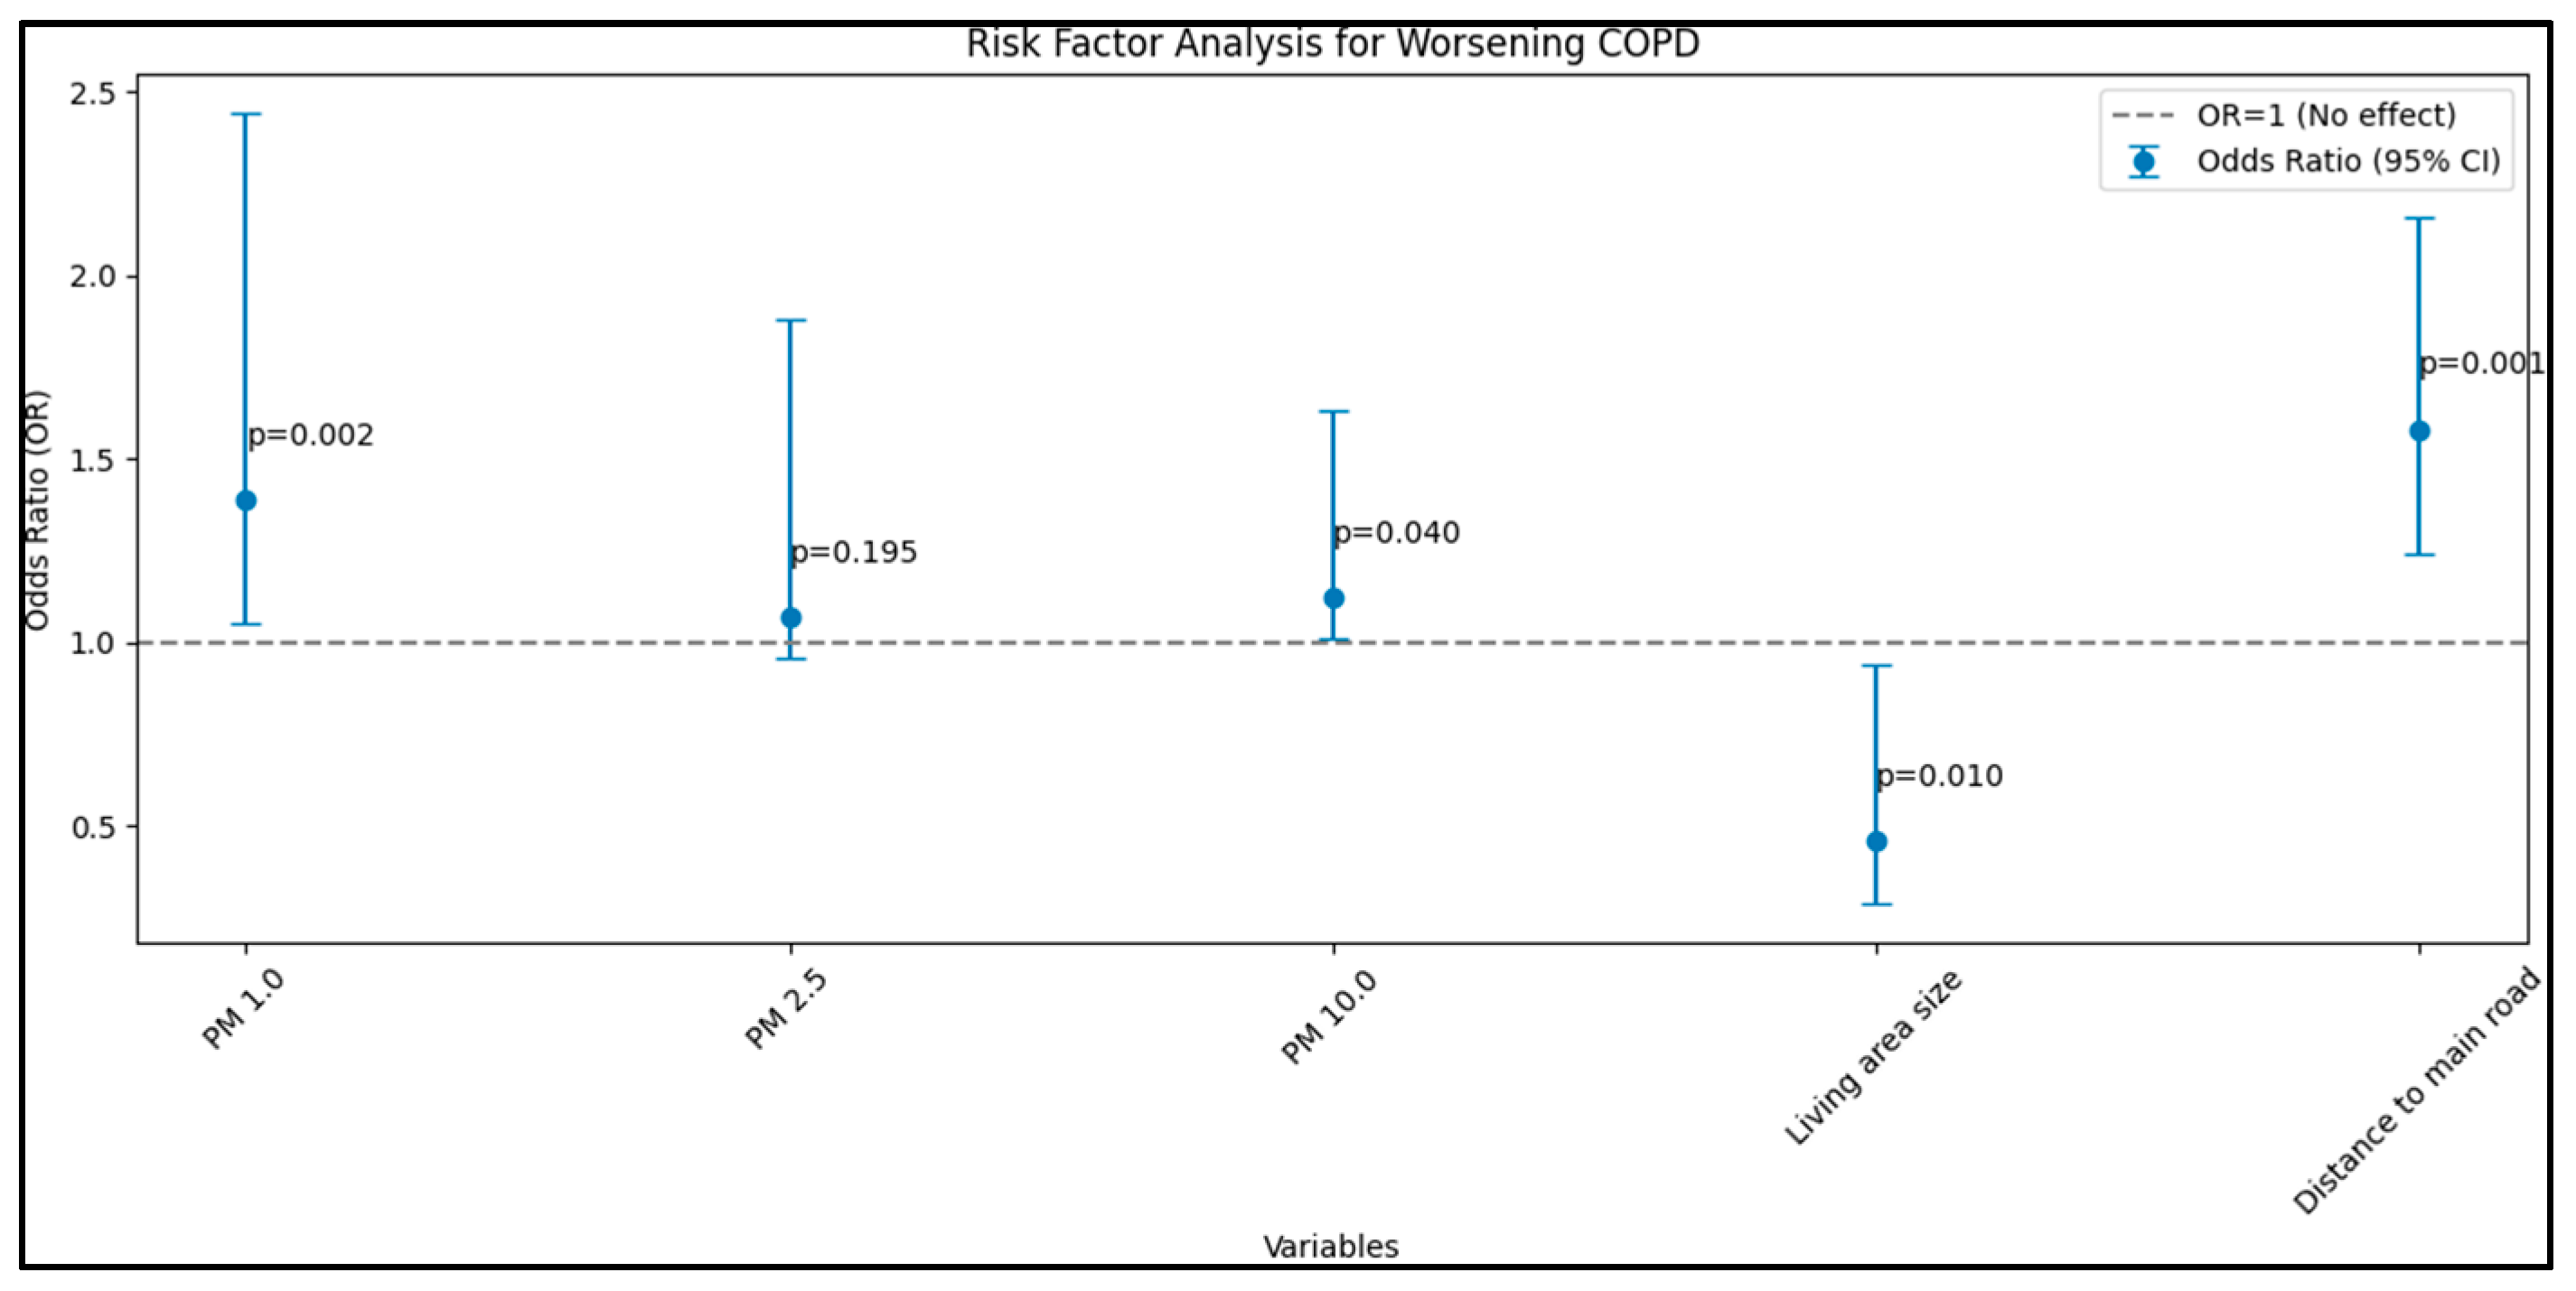
| GOLD (dependent) | |||||
| PM 1.0 (µg/m3) | 0.025 | 0.005 | 1.39 | 1.05–2.44 | 0.002 |
| PM 2.5 (µg/m3) | 0.009 | 0.005 | 1.07 | 0.96–1.88 | 0.195 |
| PM 10.0 (µg/m3) | 0.016 | 0.007 | 1.12 | 1.01–1.63 | 0.040 |
| Living area size | 0.010 | 0.006 | 0.46 | 0.29–0.94 | 0.010 |
| Distance to main road | 0.033 | 0.004 | 1.58 | 1.24–2.16 | <0.001 |
| CAT (dependent) | |||||
| PM 1.0 (µg/m3) | 0.012 | 0.007 | 1.06 | 1.01–1.43 | 0.038 |
| PM 2.5 (µg/m3) | 0.004 | 0.004 | 1.01 | 0.87–1.29 | 0.206 |
| PM 10.0 (µg/m3) | 0.008 | 0.004 | 1.13 | 1.06–1.76 | 0.009 |
| Living area size | 0.013 | 0.008 | 0.51 | 0.26–0.92 | <0.001 |
| Distance to main road | 0.021 | 0.007 | 1.30 | 1.10–1.85 | <0.001 |
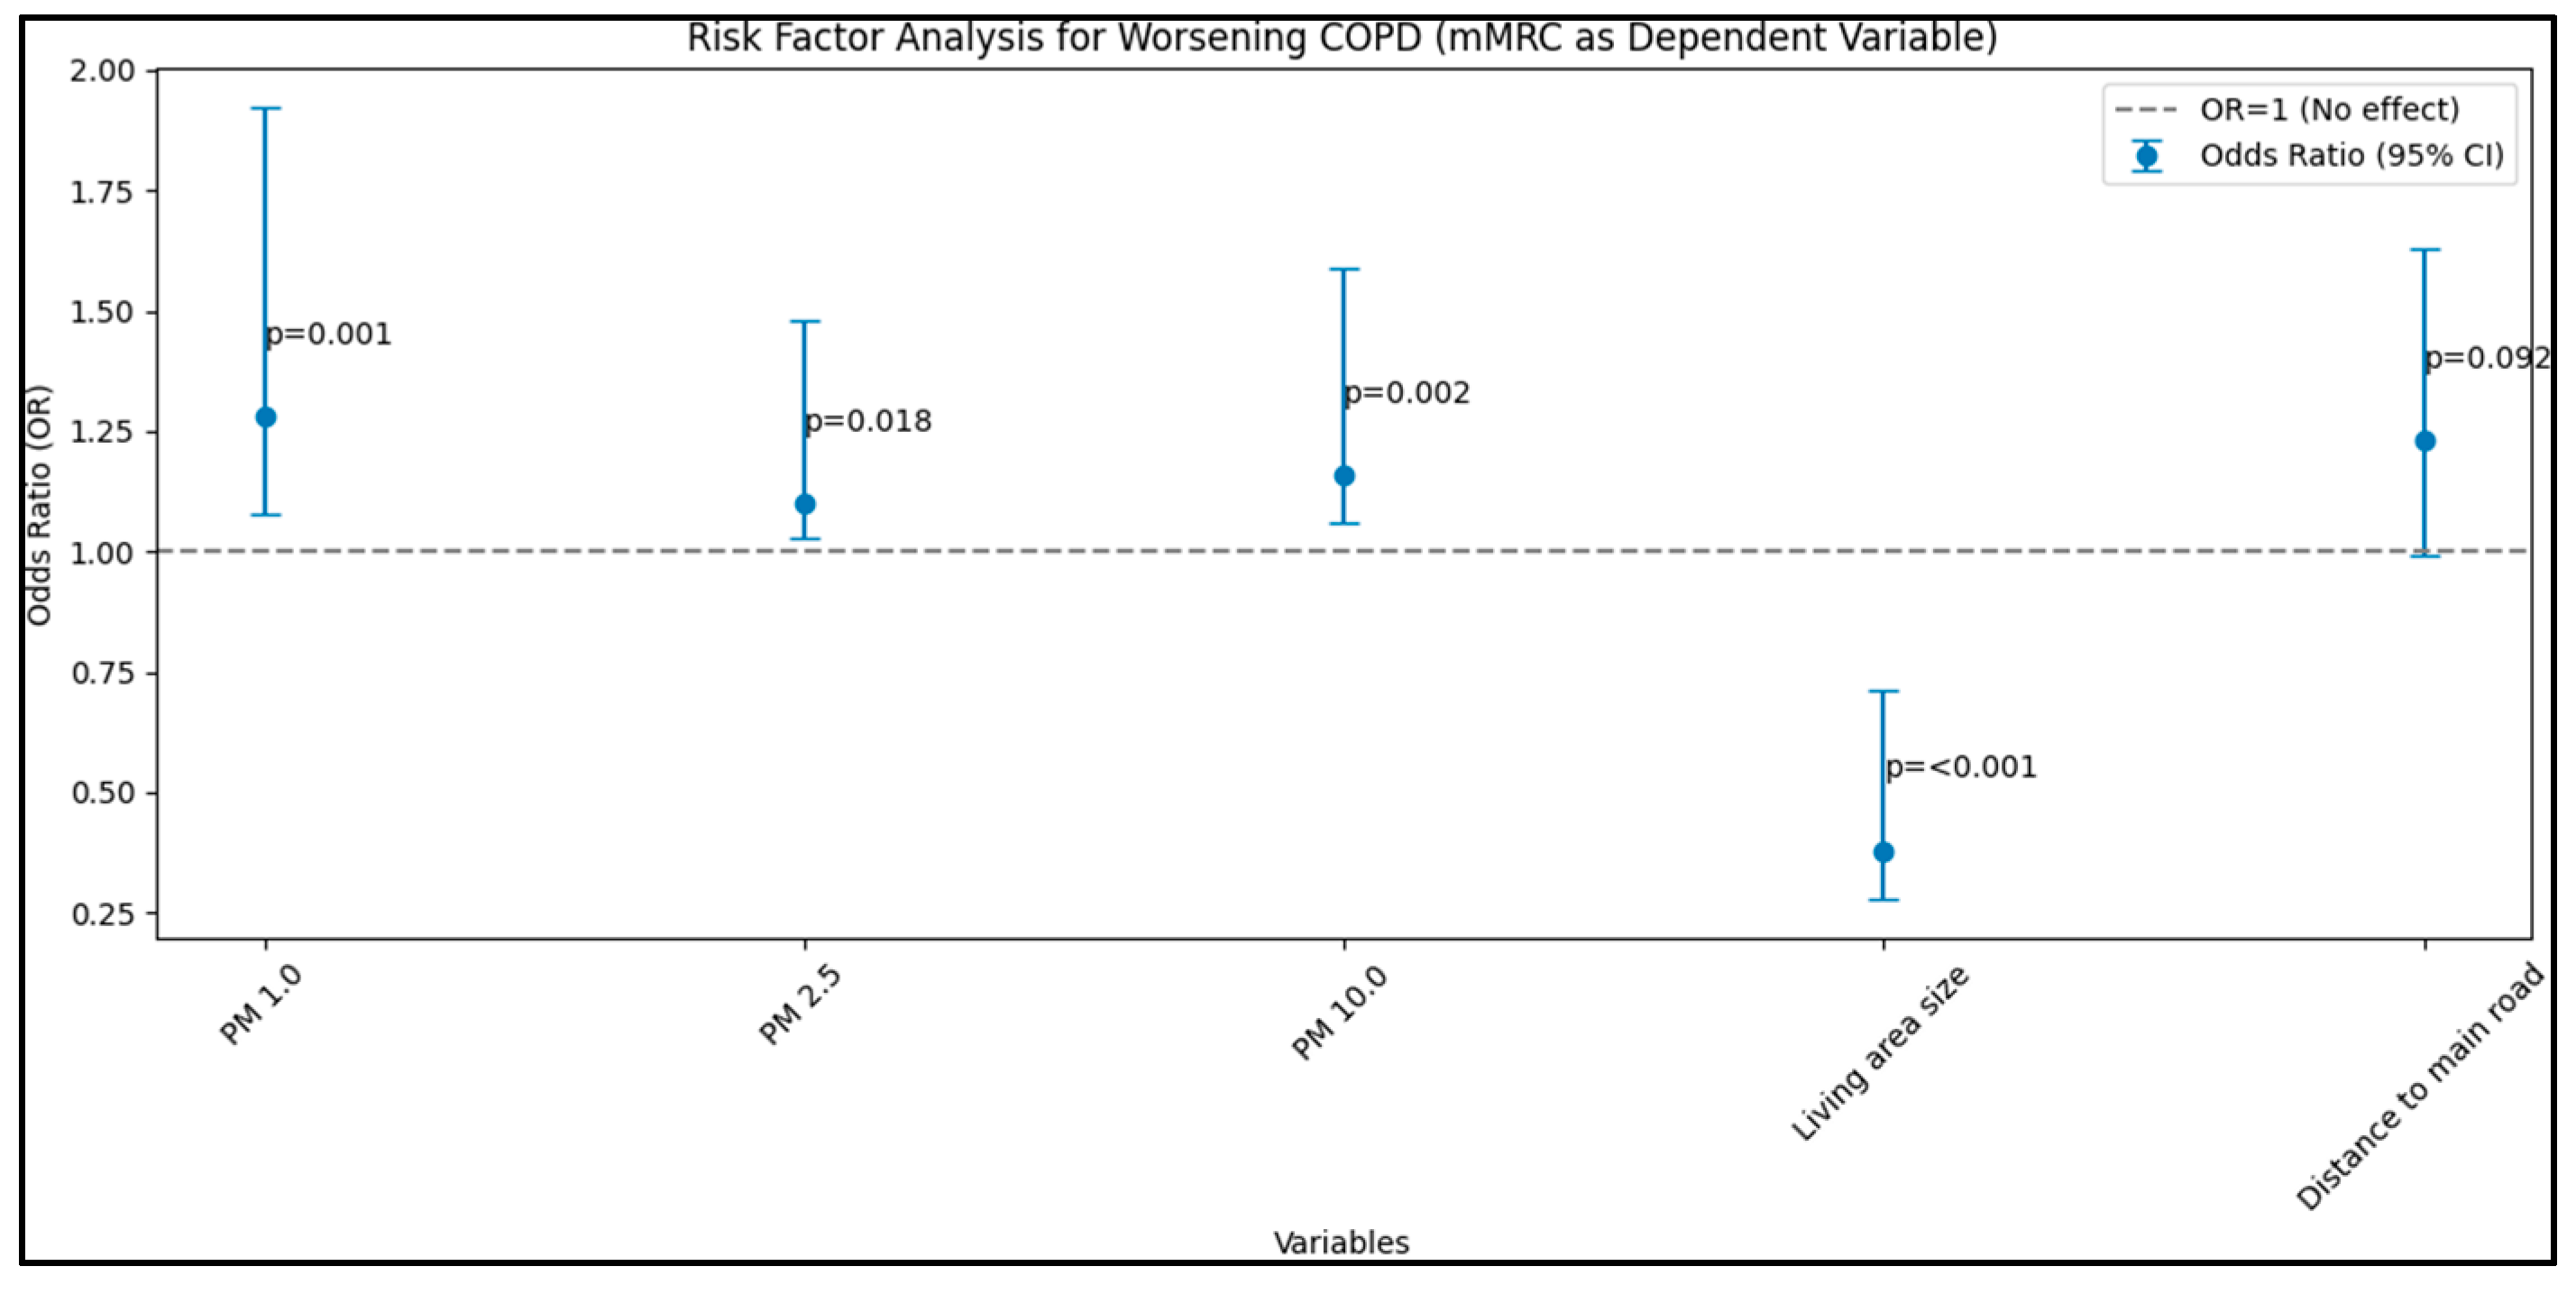
| mMRC (dependent) | |||||
| PM 1.0 (µg/m3) | 0.016 | 0.006 | 1.28 | 1.08–1.92 | 0.001 |
| PM 2.5 (µg/m3) | 0.010 | 0.004 | 1.10 | 1.03–1.48 | 0.018 |
| PM 10.0 (µg/m3) | 0.008 | 0.005 | 1.16 | 1.06–1.59 | 0.002 |
| Living area size | 0.015 | 0.007 | 0.38 | 0.28–0.71 | <0.001 |
| Distance to main road | 0.019 | 0.009 | 1.23 | 0.99–1.63 | 0.092 |
Disclaimer/Publisher’s Note: The statements, opinions and data contained in all publications are solely those of the individual author(s) and contributor(s) and not of MDPI and/or the editor(s). MDPI and/or the editor(s) disclaim responsibility for any injury to people or property resulting from any ideas, methods, instructions or products referred to in the content. |
© 2023 by the authors. Licensee MDPI, Basel, Switzerland. This article is an open access article distributed under the terms and conditions of the Creative Commons Attribution (CC BY) license (https://creativecommons.org/licenses/by/4.0/).
Share and Cite
Bălă, G.-P.; Rosca, O.; Bratosin, F.; Shetty, U.S.A.; Vutukuru, S.D.; Sanda, I.-I.; Marc, M.; Fira-Mladinescu, O.; Oancea, C. Airborne Particulate Matter Size and Chronic Obstructive Pulmonary Disease Exacerbations: A Prospective, Risk-Factor Analysis Comparing Global Initiative for Obstructive Lung Disease 3 and 4 Categories. J. Pers. Med. 2023, 13, 1505. https://doi.org/10.3390/jpm13101505
Bălă G-P, Rosca O, Bratosin F, Shetty USA, Vutukuru SD, Sanda I-I, Marc M, Fira-Mladinescu O, Oancea C. Airborne Particulate Matter Size and Chronic Obstructive Pulmonary Disease Exacerbations: A Prospective, Risk-Factor Analysis Comparing Global Initiative for Obstructive Lung Disease 3 and 4 Categories. Journal of Personalized Medicine. 2023; 13(10):1505. https://doi.org/10.3390/jpm13101505
Chicago/Turabian StyleBălă, Gabriel-Petrică, Ovidiu Rosca, Felix Bratosin, Uday Shree Akkala Shetty, Sai Diksha Vutukuru, Isabella-Ionela Sanda, Monica Marc, Ovidiu Fira-Mladinescu, and Cristian Oancea. 2023. "Airborne Particulate Matter Size and Chronic Obstructive Pulmonary Disease Exacerbations: A Prospective, Risk-Factor Analysis Comparing Global Initiative for Obstructive Lung Disease 3 and 4 Categories" Journal of Personalized Medicine 13, no. 10: 1505. https://doi.org/10.3390/jpm13101505
APA StyleBălă, G.-P., Rosca, O., Bratosin, F., Shetty, U. S. A., Vutukuru, S. D., Sanda, I.-I., Marc, M., Fira-Mladinescu, O., & Oancea, C. (2023). Airborne Particulate Matter Size and Chronic Obstructive Pulmonary Disease Exacerbations: A Prospective, Risk-Factor Analysis Comparing Global Initiative for Obstructive Lung Disease 3 and 4 Categories. Journal of Personalized Medicine, 13(10), 1505. https://doi.org/10.3390/jpm13101505