
Optimization of Preoperative Lymph Node Staging in Patients with Muscle-Invasive Bladder Cancer Using Radiomics on Computed Tomography

 , , , , , , , , and
  add
Show full author list
add
Show full author list
Abstract
:
1. Introduction
2. Materials and Methods
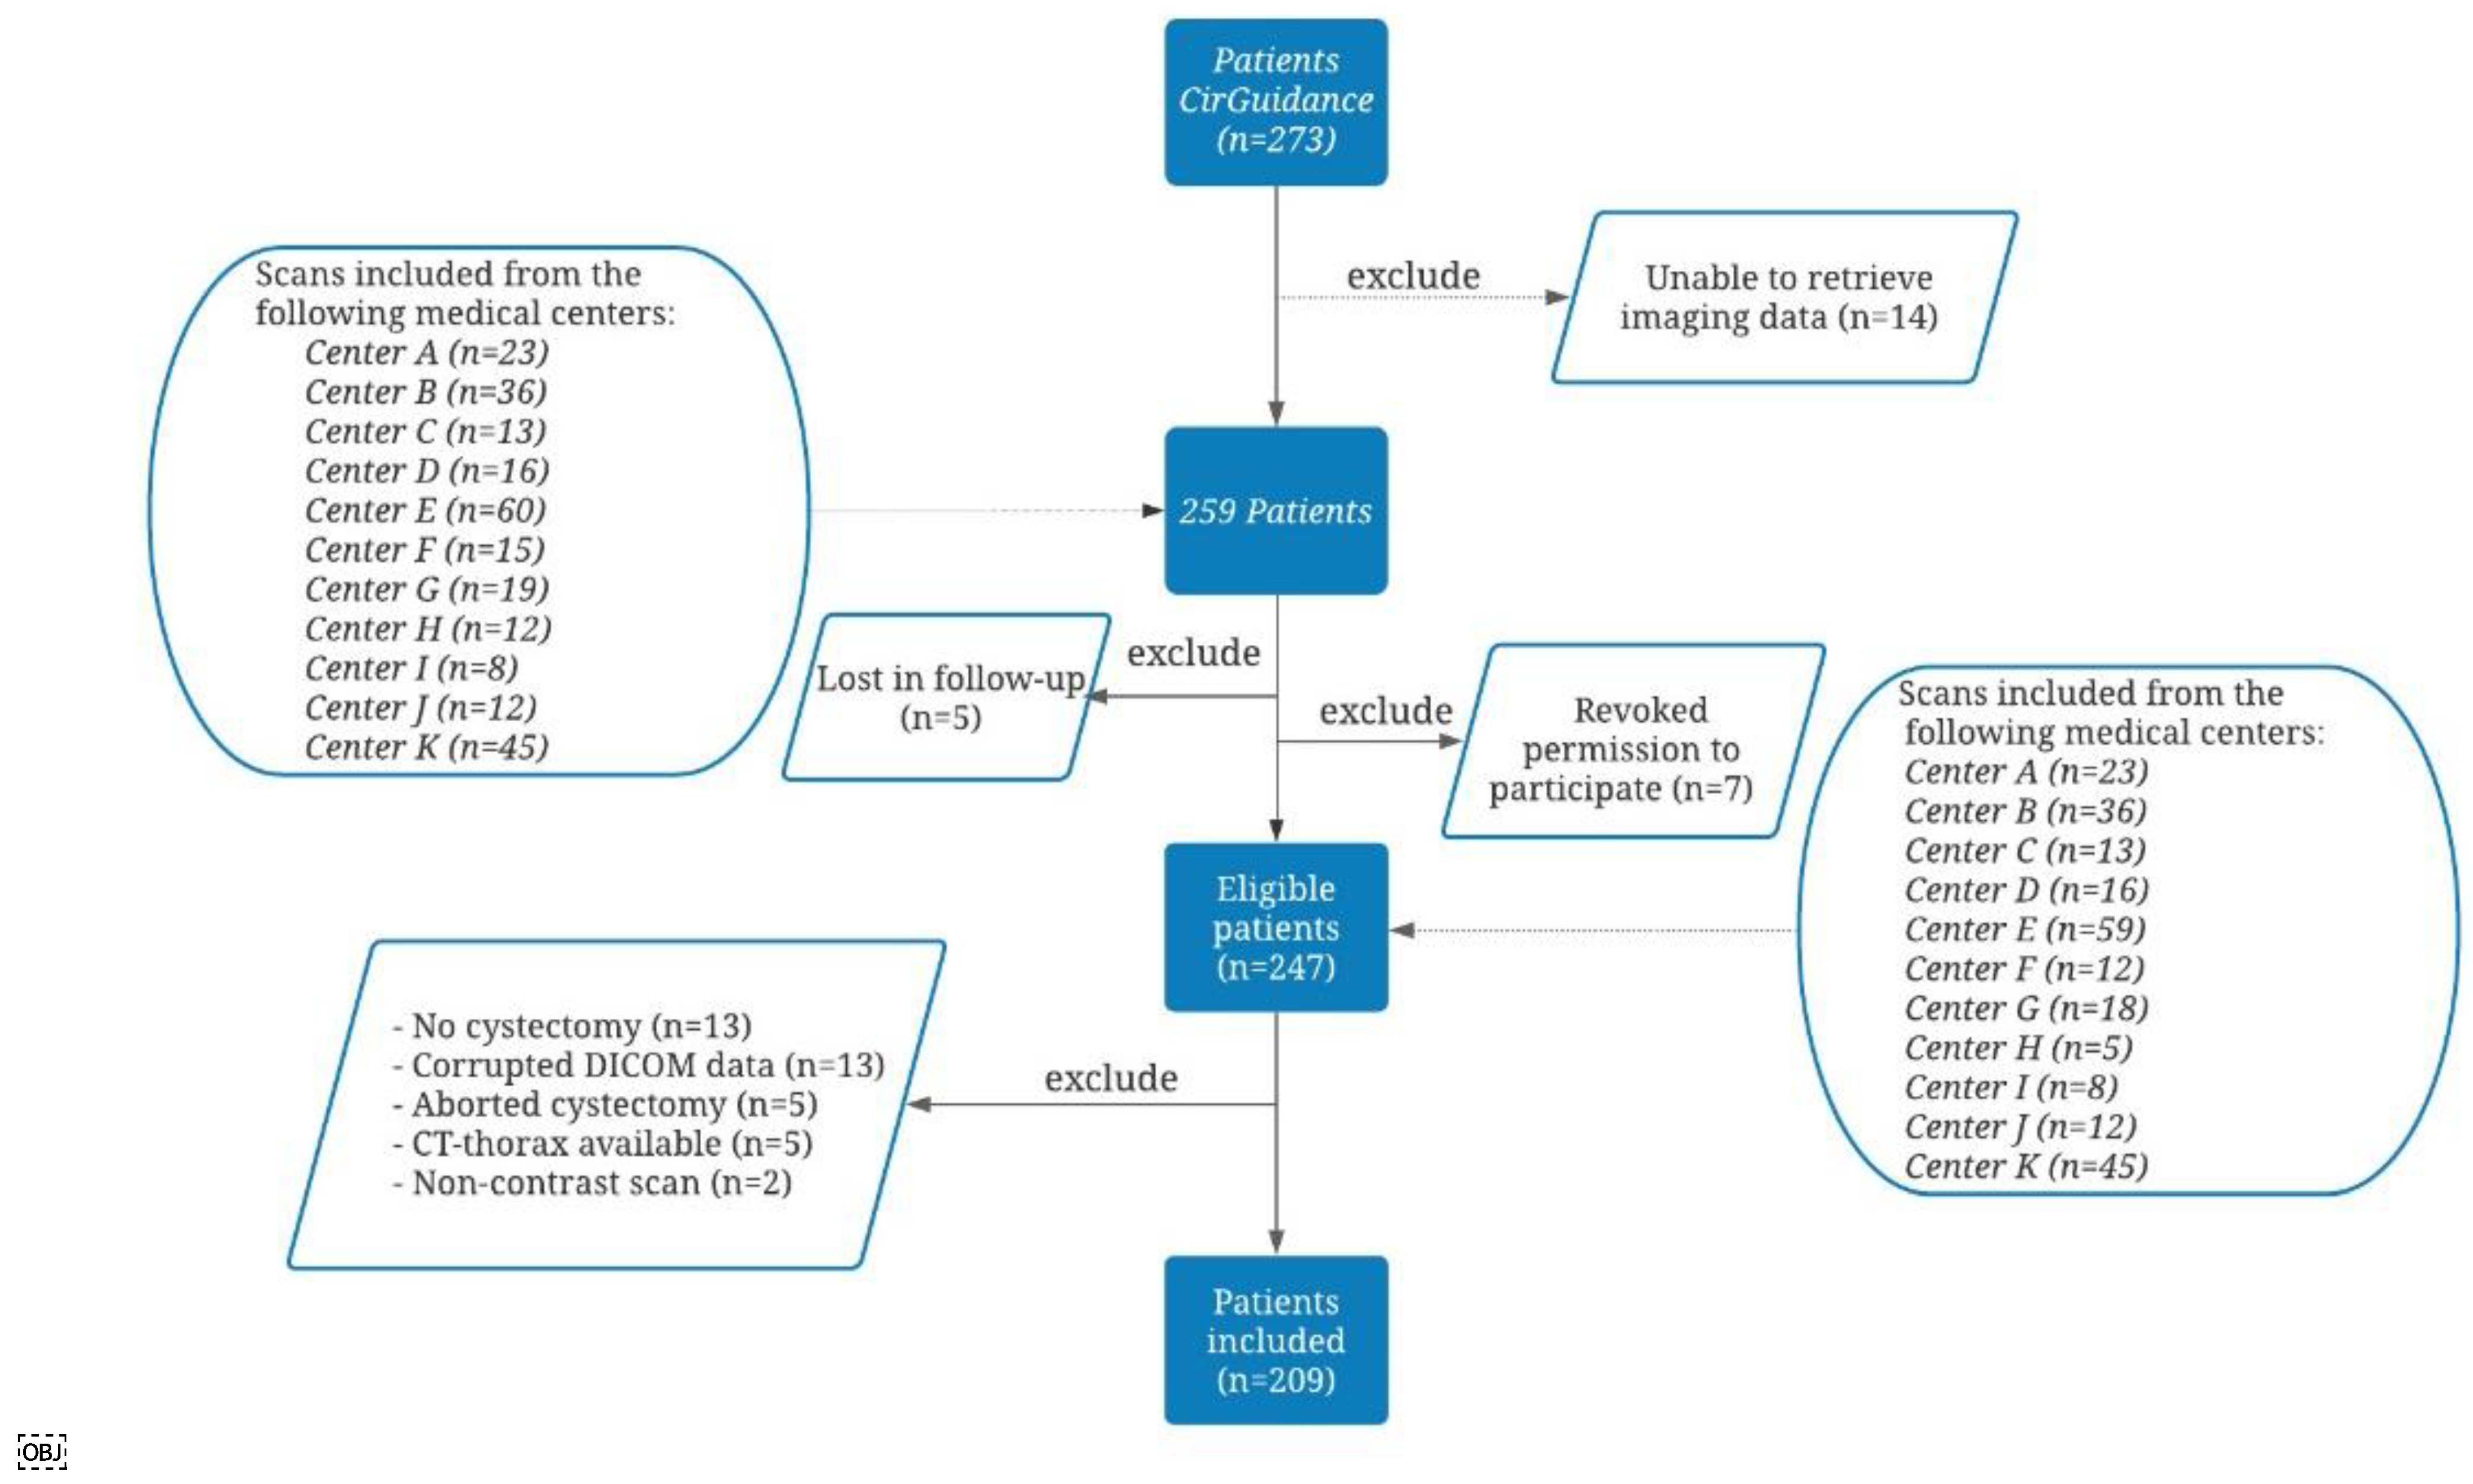
2.1. Inclusion and Exclusion Criteria of the CirGuidance Trial
2.2. Study Design of the Post Hoc Analysis
2.3. Data Collection
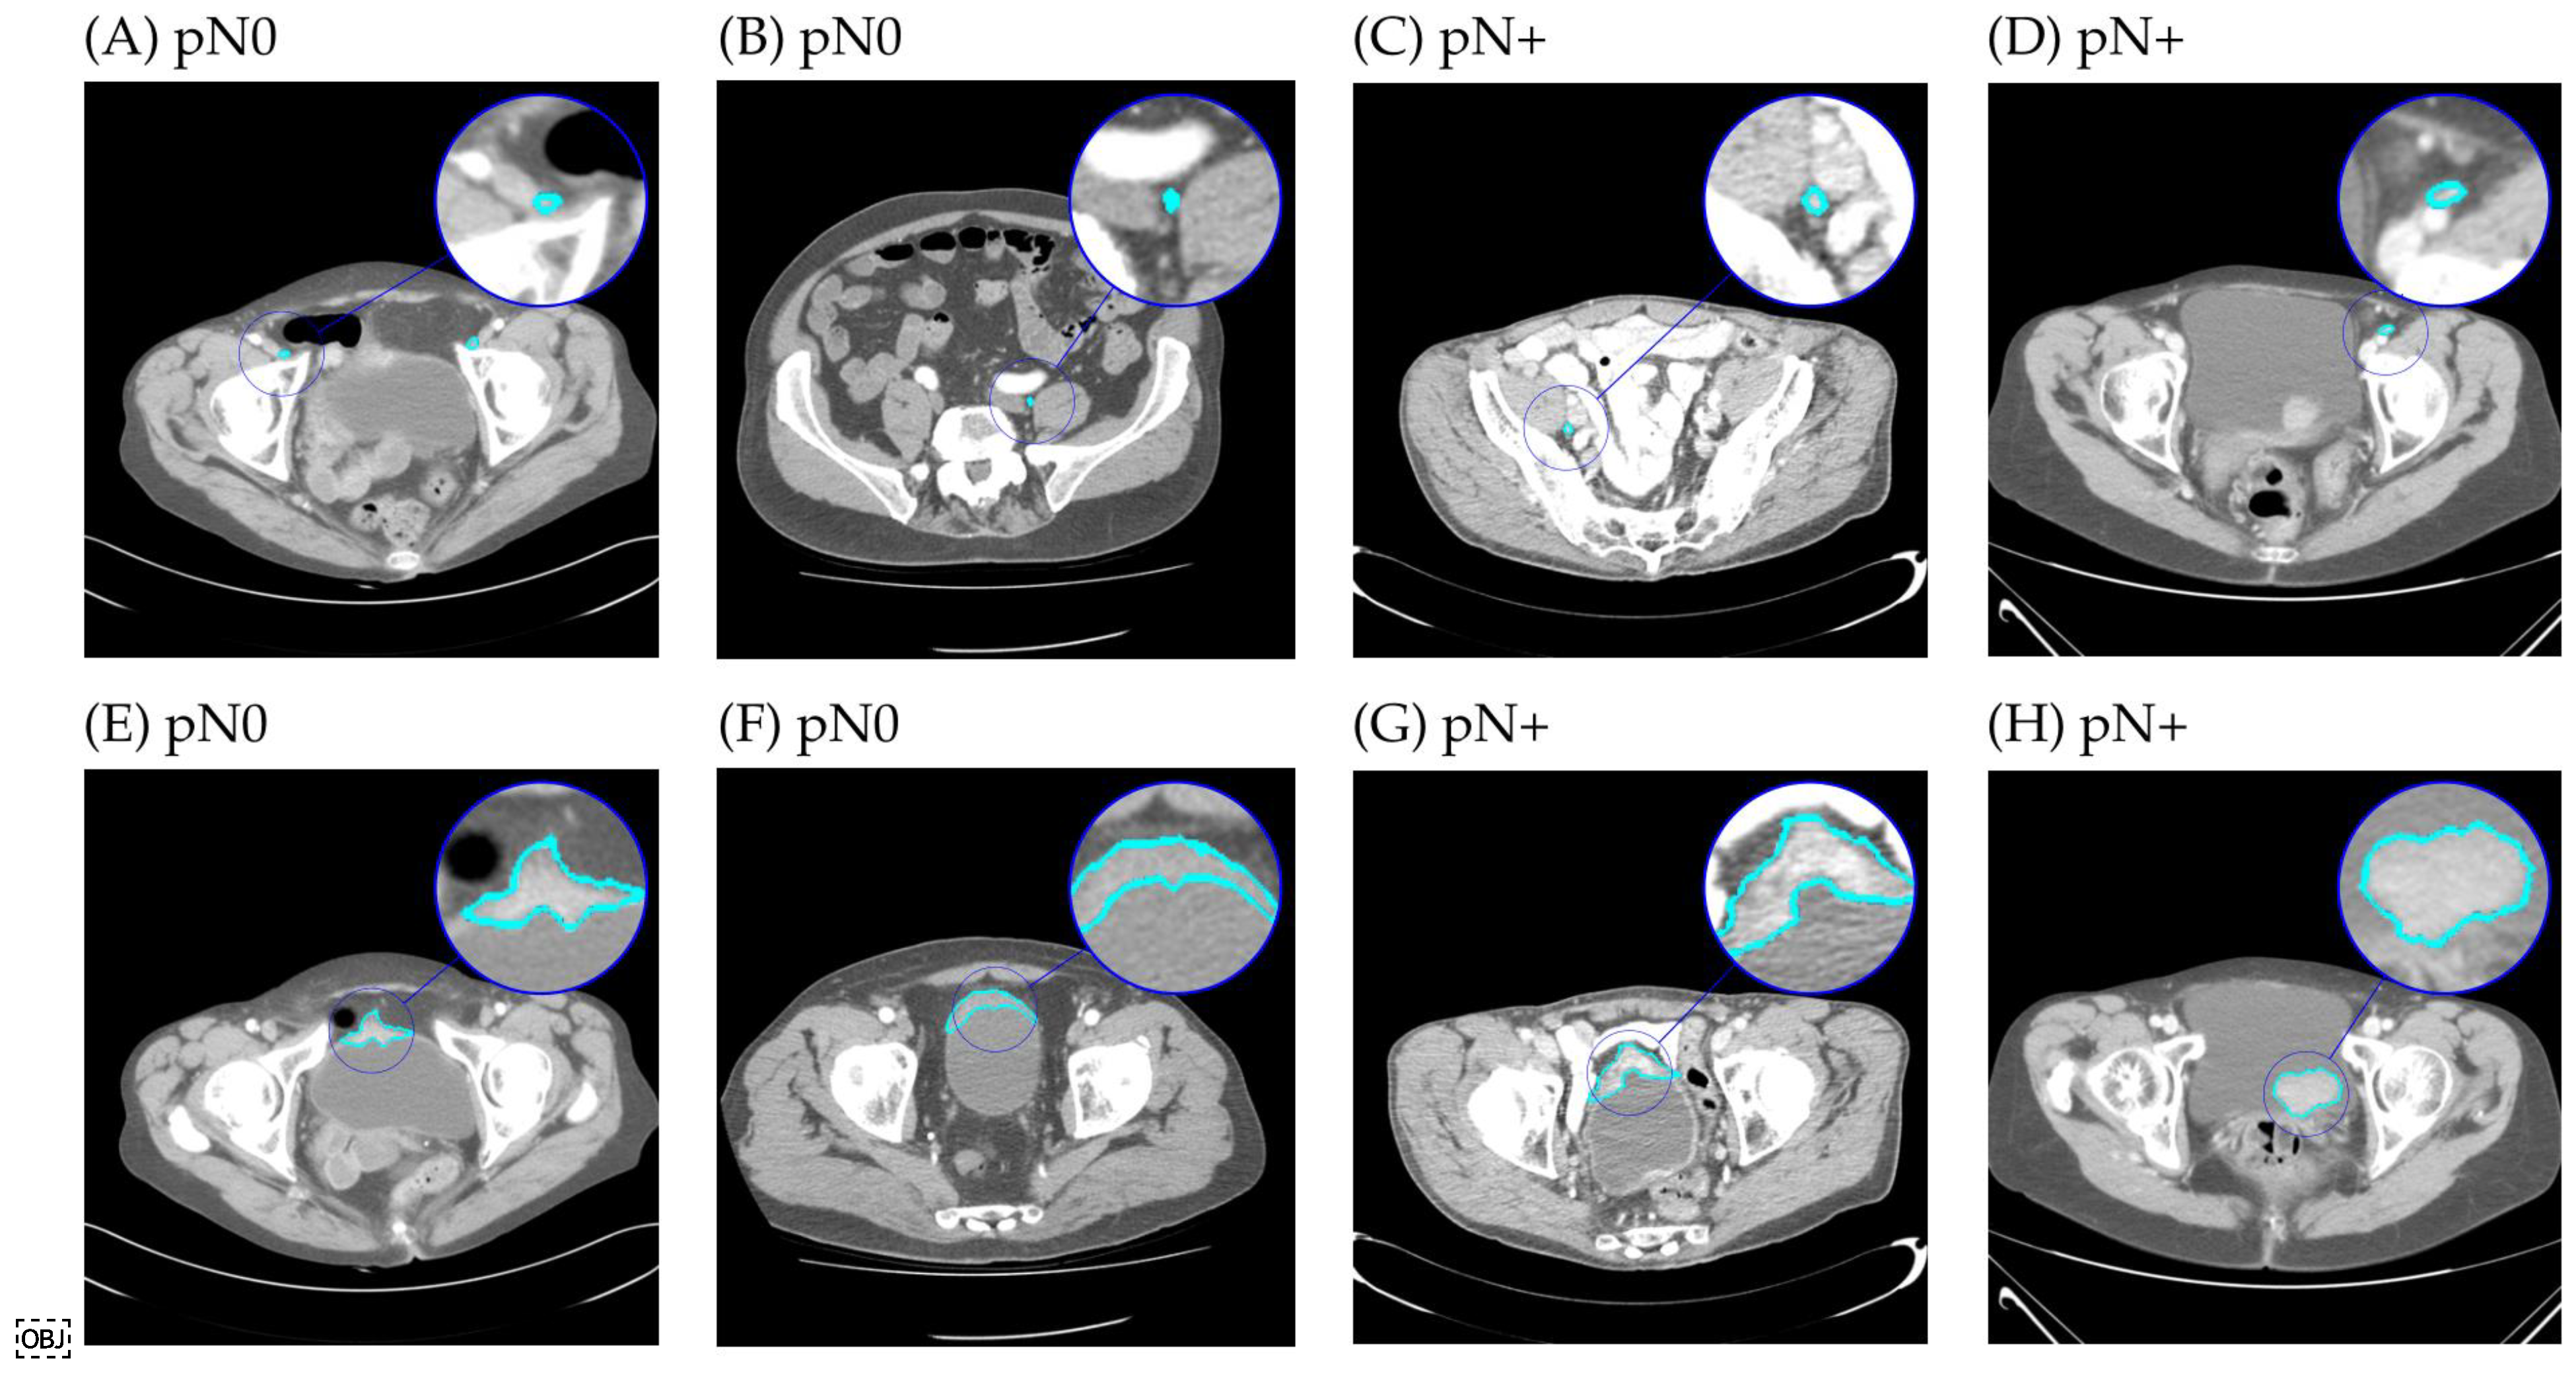
2.4. Segmentation
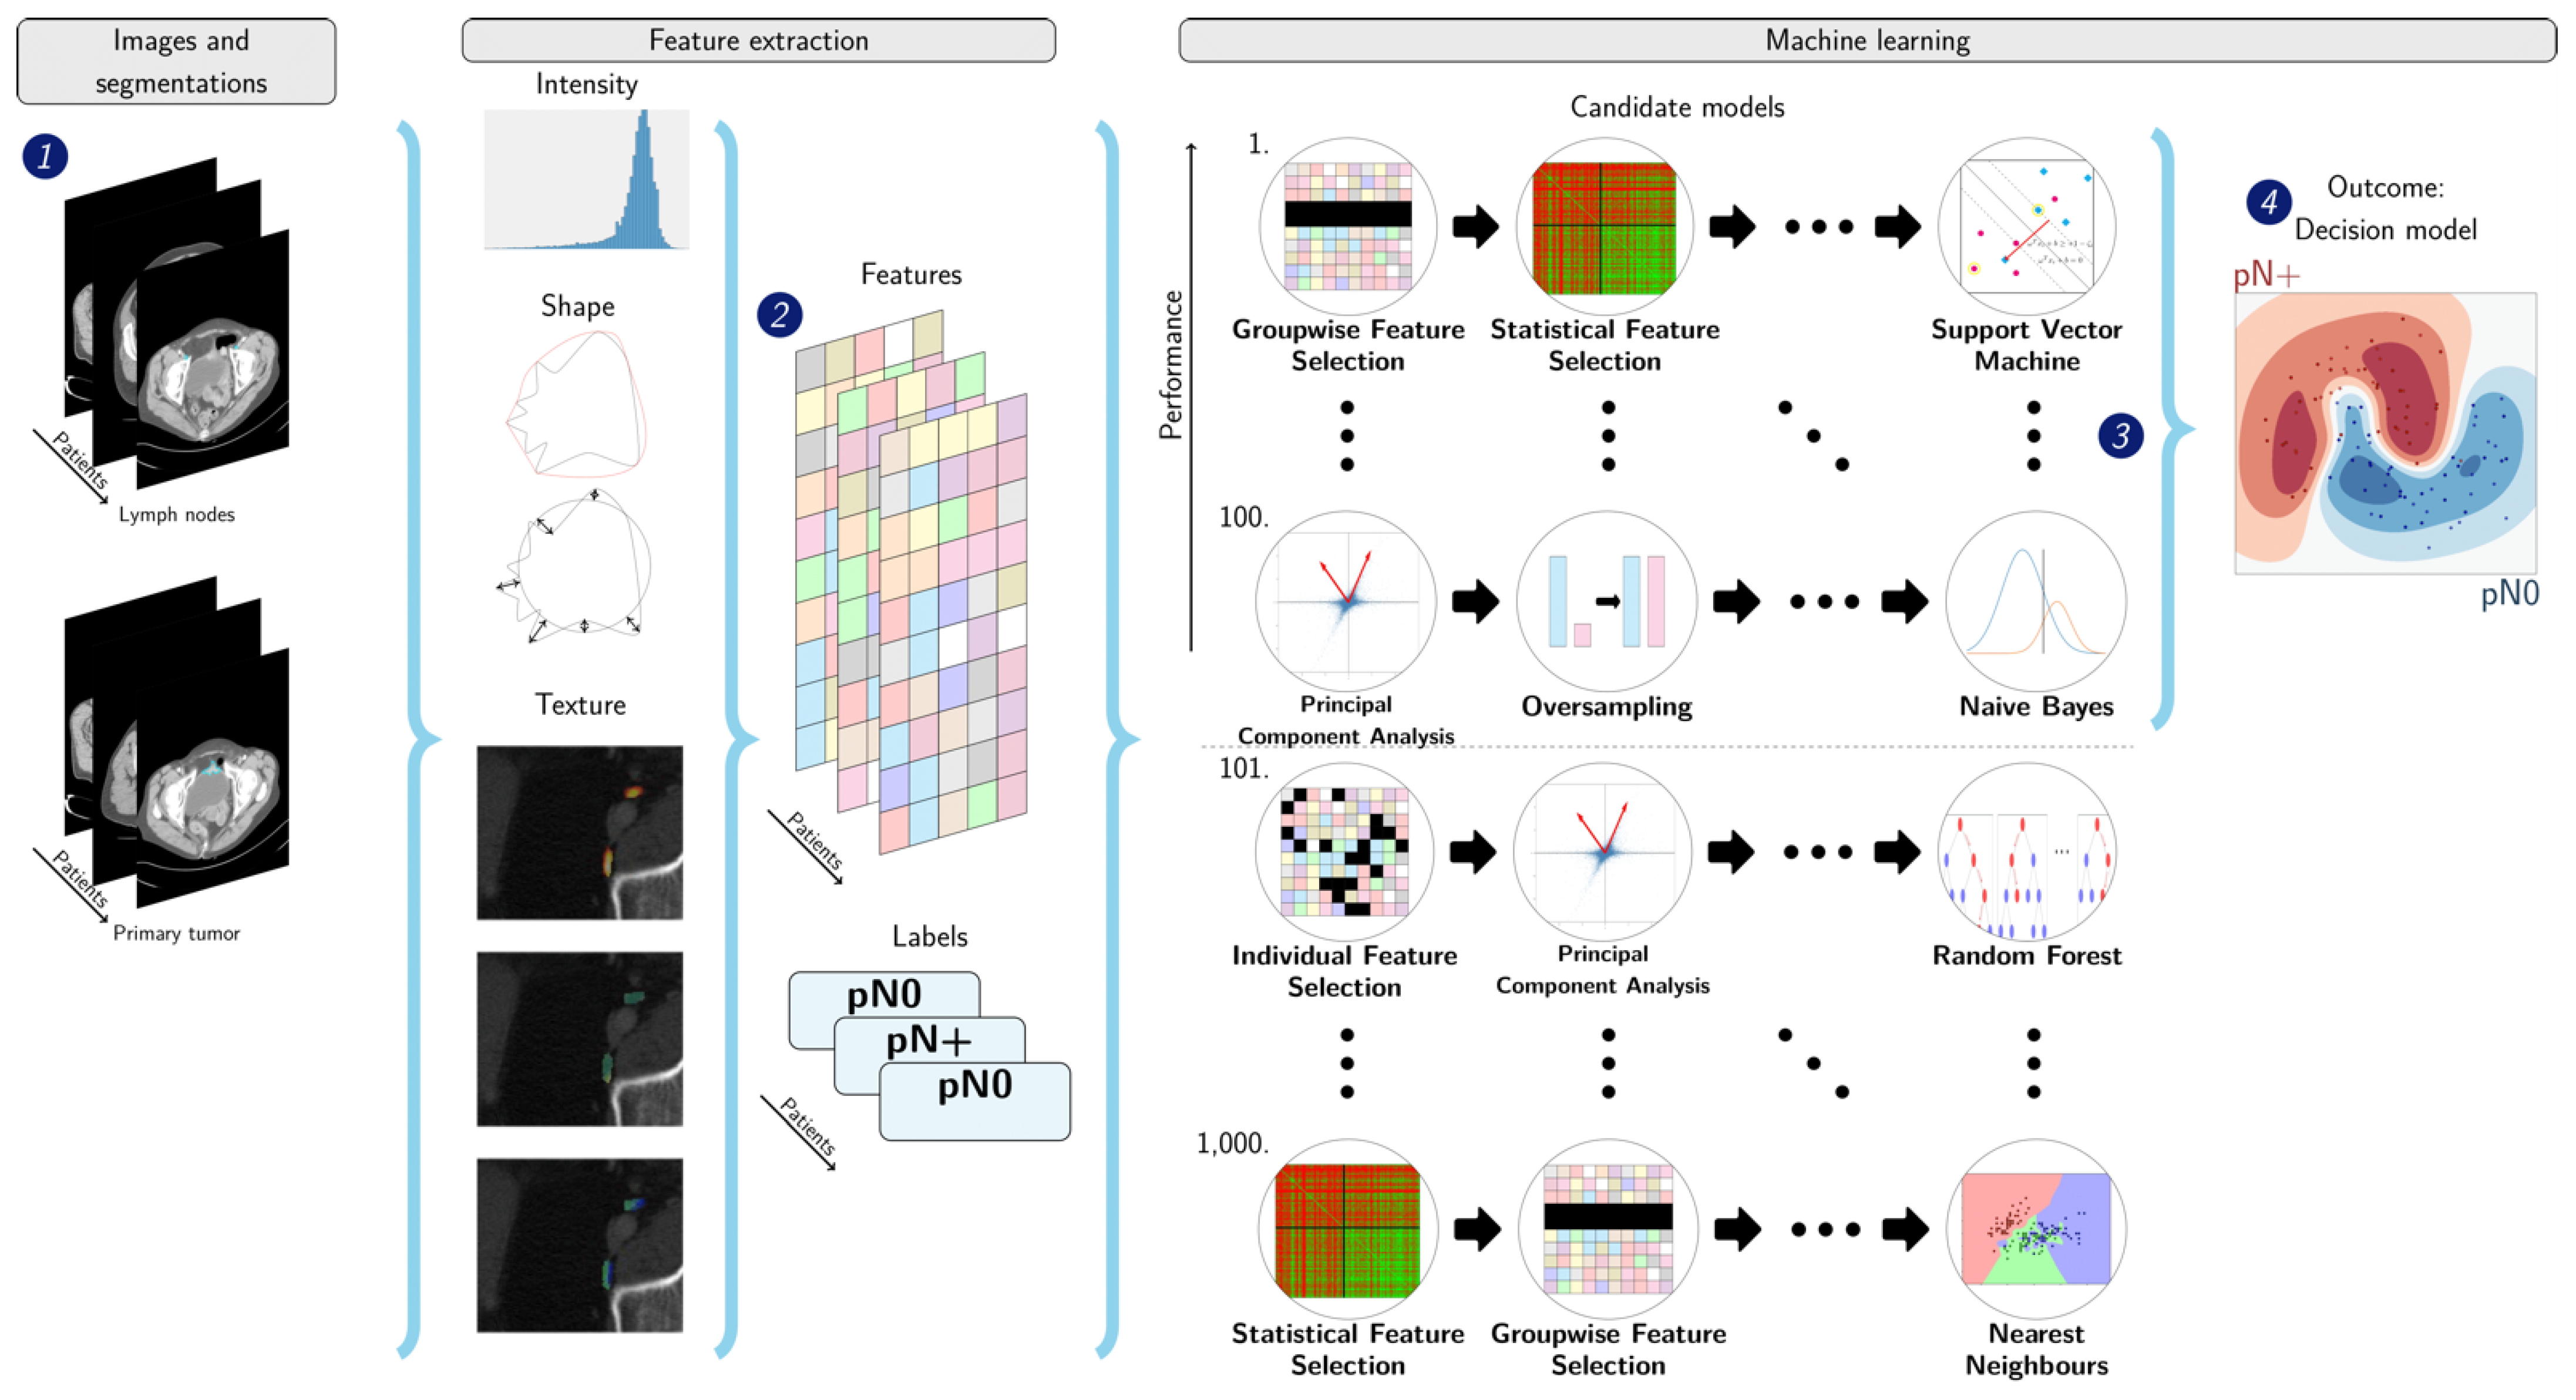
2.5. Radiomics
2.6. Experimental Setup
2.7. Statistics
3. Results
3.1. Patient Characteristics
3.2. Radiomics
4. Discussion
5. Conclusions
Supplementary Materials
Author Contributions
Funding
Institutional Review Board Statement
Informed Consent Statement
Data Availability Statement
Conflicts of Interest
References
- Witjes, J.A.; Bruins, H.M.; Cathomas, R.; Compérat, E.M.; Cowan, N.C.; Gakis, G.; Hernández, V.; Linares Espinós, E.; Lorch, A.; Neuzillet, Y.; et al. European Association of Urology Guidelines on Muscle-invasive and Metastatic Bladder Cancer: Summary of the 2020 Guidelines. Eur. Urol. 2021, 79, 82–104. [Google Scholar] [CrossRef] [PubMed]
- Ghoneim, M.A.; Abdel-Latif, M.; El-Mekresh, M.; Abol-Enein, H.; Mosbah, A.; Ashamallah, A.; El-Baz, M.A. Radical Cystectomy for Carcinoma of the Bladder: 2720 Consecutive Cases 5 Years Later. J. Urol. 2008, 180, 121–127. [Google Scholar] [CrossRef] [PubMed]
- Stein, J.P.; Lieskovsky, G.; Raghavan, D.; Skinner, D.G.; Cote, R.; Groshen, S.; Feng, A.; Boyd, S.; Skinner, E.; Bochner, B.; et al. Radical Cystectomy in the Treatment of Invasive Bladder Cancer: Long-Term Results in 1,054 Patients. J. Clin. Oncol. 2001, 19, 666–675. [Google Scholar] [CrossRef] [PubMed]
- Griffiths, G.; Hall, R.; Sylvester, R.; Raghavan, D.; Parmar, M.K.B. International Phase III Trial Assessing Neoadjuvant Cisplatin, Methotrexate, and Vinblastine Chemotherapy for Muscle-Invasive Bladder Cancer: Long-Term Results of the BA06 30894 Trial. J. Clin. Oncol. 2011, 29, 2171–2177. [Google Scholar] [CrossRef] [Green Version]
- Sternberg, C.N.; Yagoda, A.; Scher, H.I.; Watson, R.C.; Geller, N.; Herr, H.W.; Morse, M.J.; Sogani, P.C.; Vaughan, E.D.; Bander, N.; et al. Methotrexate, vinblastine, doxorubicin, and cisplatin for advanced transitional cell carcinoma of the urothelium. Efficacy and patterns of response and relapse. Cancer 1989, 64, 2448–2458. [Google Scholar] [CrossRef]
- Loehrer, P.J.; Einhorn, L.H.; Elson, P.J.; Crawford, E.D.; Kuebler, P.; Tannock, I.; Raghavan, D.; Stuart-Harris, R.; Sarosdy, M.F.; Lowe, B.A. A randomized comparison of cisplatin alone or in combination with methotrexate, vinblastine, and doxorubicin in patients with metastatic urothelial carcinoma: A cooperative group study. J. Clin. Oncol. 1992, 10, 1066–1073. [Google Scholar] [CrossRef] [PubMed]
- Pfister, C.; Gravis, G.; Fléchon, A.; Soulié, M.; Guy, L.; Laguerre, B.; Mottet, N.; Joly, F.; Allory, Y.; Harter, V.; et al. Randomized Phase III Trial of Dose-dense Methotrexate, Vinblastine, Doxorubicin, and Cisplatin, or Gemcitabine and Cisplatin as Perioperative Chemotherapy for Patients with Muscle-invasive Bladder Cancer. Analysis of the GETUG/AFU V05 VESPER Trial Secondary Endpoints: Chemotherapy Toxicity and Pathological Responses. Eur. Urol. 2021, 79, 214–221. [Google Scholar] [CrossRef]
- Burger, M.; Mulders, P.; Witjes, W. Use of Neoadjuvant Chemotherapy for Muscle-Invasive Bladder Cancer Is Low Among Major European Centres: Results of a Feasibility Questionnaire. Eur. Urol. 2012, 61, 1070–1071. [Google Scholar] [CrossRef]
- Raj, G.V.; Karavadia, S.; Schlomer, B.; Arriaga, Y.; Lotan, Y.; Sagalowsky, A.; Frenkel, E. Contemporary use of perioperative cisplatin-based chemotherapy in patients with muscle-invasive bladder cancer. Cancer 2011, 117, 276–282. [Google Scholar] [CrossRef]
- David, K.A.; Milowsky, M.I.; Ritchey, J.; Carroll, P.R.; Nanus, D.M. Low Incidence of Perioperative Chemotherapy for Stage III Bladder Cancer 1998 to 2003: A Report From the National Cancer Data Base. J. Urol. 2007, 178, 451–454. [Google Scholar] [CrossRef]
- Sargos, P.; Baumann, B.C.; Eapen, L.; Christodouleas, J.; Bahl, A.; Murthy, V.; Efstathiou, J.; Fonteyne, V.; Ballas, L.; Zaghloul, M.; et al. Risk factors for loco-regional recurrence after radical cystectomy of muscle-invasive bladder cancer: A systematic-review and framework for adjuvant radiotherapy. Cancer Treat. Rev. 2018, 70, 88–97. [Google Scholar] [CrossRef] [PubMed]
- Hautmann, R.E.; de Petriconi, R.C.; Pfeiffer, C.; Volkmer, B.G. Radical Cystectomy for Urothelial Carcinoma of the Bladder Without Neoadjuvant or Adjuvant Therapy: Long-Term Results in 1100 Patients. Eur. Urol. 2012, 61, 1039–1047. [Google Scholar] [CrossRef] [PubMed]
- Fass, L. Imaging and cancer: A review. Mol. Oncol. 2008, 2, 115–152. [Google Scholar] [CrossRef]
- Eisenhauer, E.A.; Therasse, P.; Bogaerts, J.; Schwartz, L.H.; Sargent, D.; Ford, R.; Dancey, J.; Arbuck, S.; Gwyther, S.; Mooney, M.; et al. New response evaluation criteria in solid tumours: Revised RECIST guideline (version 1.1). Eur. J. Cancer 2008, 45, 228–247. [Google Scholar] [CrossRef] [PubMed]
- Van der Pol, C.B.; Sahni, V.A.; Eberhardt, S.C.; Oto, A.; Akin, O.; Alexander, L.F.; Allen, B.C.; Coakley, F.V.; Froemming, A.T. ACR Appropriateness Criteria® Pretreatment Staging of Muscle-Invasive Bladder Cancer. J. Am. Coll. Radiol. 2018, 15, S150–S159. [Google Scholar] [CrossRef] [Green Version]
- McKibben, M.; Woods, M. Preoperative Imaging for Staging Bladder Cancer. Curr. Urol. Rep. 2015, 16, 22. [Google Scholar] [CrossRef] [PubMed]
- Fabel, M.; Wulff, A.; Heckel, F.; Bornemann, L.; Freitag-Wolf, S.; Heller, M.; Biederer, J.; Bolte, H. Clinical lymph node staging—Influence of slice thickness and reconstruction kernel on volumetry and RECIST measurements. Eur. J. Radiol. 2012, 81, 3124–3130. [Google Scholar] [CrossRef]
- Onuma, Y.; Tsuruta, C.; Okita, K.; Hamabe, A.; Ogura, K.; Takemasa, I.; Hatakenaka, M. CT reconstruction with thick slices not only underestimates lymph node size but also reduces data reproducibility in colorectal cancer. Acta Radiol. 2021, 62, 1275–1282. [Google Scholar] [CrossRef]
- Amin, M.B.; Edge, S.; Greene, F.; Byrd, D.R.; Brookland, R.K.; Washington, M.K.; Gershenwald, J.E.; Compton, C.C.; Hess, K.R.; Sullivan, D.D.; et al. AJCC Cancer Staging Manual, 8th ed.; Springer: Cham, Switzerland, 2017. [Google Scholar]
- Macvicar, A.D. Bladder cancer staging. BJU Int. 2000, 86, 111–122. [Google Scholar] [CrossRef] [Green Version]
- McMahon, C.J.; Rofsky, N.M.; Pedrosa, I. Lymphatic Metastases from Pelvic Tumors: Anatomic Classification, Characterization, and Staging. Radiology 2010, 254, 31–46. [Google Scholar] [CrossRef]
- Paño, B.; Sebastià, C.; Buñesch, L.; Mestres, J.; Salvador, R.; Macías, N.G.; Nicolau, C. Pathways of lymphatic spread in male urogenital pelvic malignancies. Radiographics 2011, 31, 135–160. [Google Scholar] [CrossRef] [PubMed]
- Roth, B.; Wissmeyer, M.P.; Zehnder, P.; Birkhäuser, F.D.; Thalmann, G.N.; Krause, T.M.; Studer, U.E. A New Multimodality Technique Accurately Maps the Primary Lymphatic Landing Sites of the Bladder. Eur. Urol. 2009, 57, 205–211. [Google Scholar] [CrossRef] [PubMed]
- Shankar, P.R.; Barkmeier, D.; Hadjiiski, L.; Cohan, R.H. A pictorial review of bladder cancer nodal metastases. Transl. Androl. Urol. 2018, 7, 804–813. [Google Scholar] [CrossRef] [PubMed]
- Fukuya, T.; Honda, H.; Hayashi, T.; Kaneko, K.; Tateshi, Y.; Ro, T.; Maehara, Y.; Tanaka, M.; Tsuneyoshi, M.; Masuda, K. Lymph-node metastases: Efficacy for detection with helical CT in patients with gastric cancer. Radiology 1995, 197, 705–711. [Google Scholar] [CrossRef] [PubMed]
- Rollvén, E.; Blomqvist, L.; Öistämö, E.; Hjern, F.; Csanaky, G.; Abraham-Nordling, M. Morphological predictors for lymph node metastases on computed tomography in colon cancer. Abdom. Radiol. 2019, 44, 1712–1721. [Google Scholar] [CrossRef] [Green Version]
- Paik, M.L.; Scolieri, M.J.; Brown, S.L.; Spirnak, J.P.; Resnick, M.I. Limitations of computerized tomography in staging invasive bladder cancer before radical cystectomy. J. Urol. 2000, 163, 1693–1696. [Google Scholar] [CrossRef]
- Ficarra, V.; Dalpiaz, O.; Alrabi, N.; Novara, G.; Galfano, A.; Artibani, W. Correlation between clinical and pathological staging in a series of radical cystectomies for bladder carcinoma. BJU Int. 2005, 95, 786–790. [Google Scholar] [CrossRef]
- Tritschler, S.; Mosler, C.; Straub, J.; Buchner, A.; Karl, A.; Graser, A.; Stief, C.; Tilki, D. Staging of muscle-invasive bladder cancer: Can computerized tomography help us to decide on local treatment? World J. Urol. 2012, 30, 827–831. [Google Scholar] [CrossRef]
- Gillies, R.J.; Kinahan, P.E.; Hricak, H. Radiomics: Images Are More than Pictures, They Are Data. Radiology 2016, 278, 563–577. [Google Scholar] [CrossRef] [Green Version]
- Wu, S.; Zheng, J.; Li, Y.; Yu, H.; Shi, S.; Xie, W.; Liu, H.; Su, Y.; Huang, J.; Lin, T. A Radiomics Nomogram for the Preoperative Prediction of Lymph Node Metastasis in Bladder Cancer. Clin. Cancer Res. 2017, 23, 6904–6911. [Google Scholar] [CrossRef] [Green Version]
- Kundra, V.; Silverman, P.M. Imaging in oncology from the University of Texas MD Anderson Cancer Center. Imaging in the diagnosis, staging, and follow-up of cancer of the urinary bladder. Am. J. Roentgenol. 2003, 180, 1045–1054. [Google Scholar] [CrossRef] [PubMed]
- Beije, N.; de Kruijff, I.E.; de Jong, J.J.; Klaver, S.O.; de Vries, P.; Jacobs, R.A.L.; Somford, D.M.; te Slaa, E.; van der Heijden, A.G.; Alfred Witjes, J.; et al. Circulating tumour cells to drive the use of neoadjuvant chemotherapy in patients with muscle-invasive bladder cancer. ESMO Open 2022, 7, 100416. [Google Scholar] [CrossRef] [PubMed]
- Starmans, M.P.A.; Miclea, R.L.; van der Voort, S.R.; Niessen, W.J.; Thomeer, M.G.; Klein, S. Classification of malignant and benign liver tumors using a radiomics approach. In Medical Imaging 2018: Image Processing; SPIE: Bellingham, WA, USA, 2018. [Google Scholar] [CrossRef] [Green Version]
- Starmans, M.P.A.; Van der Voort, S.R.; Phil, T.; Klein, S. Workflow for Optimal Radiomics Classification (WORC). Available online: https://github.com/MStarmans91/WORC (accessed on 24 November 2021). [CrossRef]
- Starmans, M.P.A.; van der Voort, S.R.; Phil, T.; Timbergen, M.J.M.; Vos, M.; Padmos, G.A.; Kessels, W.; Hanff, D.; Grunhagen, D.J.; Verhoef, C.; et al. Reproducible radiomics through automated machine learning validated on twelve clinical applications. arXiv 2021, arXiv:2108.08618. Available online: https://arxiv.org/abs/2108.08618 (accessed on 31 March 2022).
- Lemaitre, G.; Nogueira, F.; Aridas, C.K. Imbalanced-learn: A Python Toolbox to Tackle the Curse of Imbalanced Datasets in Machine Learning. arXiv 2016, arXiv:1609.06570. Available online: https://arxiv.org/abs/1609.06570 (accessed on 31 March 2022).
- Starmans, M.P.A.; CirGuidanceRadiomics. Zenodo. Available online: https://github.com/MStarmans91/CirGuidanceRadiomics (accessed on 31 March 2022). [CrossRef]
- Vos, M.; Starmans, M.P.A.; Timbergen, M.; Van Der Voort, S.; Padmos, A.; Kessels, W.; Niessen, W.; Leenders, G.; Grunhagen, D.J.; Sleijfer, S.; et al. Radiomics approach to distinguish between well differentiated liposarcomas and lipomas on MRI. Br. J. Surg. 2019, 106, 1800–1809. [Google Scholar] [CrossRef] [Green Version]
- Nadeau, C.; Bengio, Y. Inference for the Generalization Error. Mach. Learn. 2003, 52, 239–281. [Google Scholar] [CrossRef] [Green Version]
- Picard, R.R.; Cook, R.D. Cross-Validation of Regression Models. J. Am. Stat. Assoc. 1984, 79, 575–583. [Google Scholar] [CrossRef]
- Tharwat, A. Classification assessment methods. Appl. Comput. Inform. 2021, 17, 168–192. [Google Scholar] [CrossRef]
- Macskassy, S.; Provost, F.; Rosset, S. ROC Confidence Bands. In Proceedings of the 22nd International Conference on Machine Learning, Bonn, Germany, 7–11 August 2005. [Google Scholar] [CrossRef]
- Starmans, M.P.A.; Timbergen, M.J.M.; Vos, M.; Renckens, M.; Grünhagen, D.J.; van Leenders, G.J.L.H.; Dwarkasing, R.S.; Willemssen, F.E.J.A.; Niessen, W.J.; Verhoef, C.; et al. Differential diagnosis and molecular stratification of gastrointestinal stromal tumors on CT images using a radiomics approach. J. Digit. Imaging 2022, 35, 127–136. [Google Scholar] [CrossRef]
- Blazevic, A.; Starmans, M.P.A.; Brabander, T.; Dwarkasing, R.S.; van Gils, R.A.H.; Hofland, J.; Franssen, G.J.H.; Feelders, R.A.; Niessen, W.J.; Klein, S.; et al. Predicting symptomatic mesenteric mass in small intestinal neuroendocrine tumors using radiomics. Endocr. Relat. Cancer 2021, 28, 529–539. [Google Scholar] [CrossRef]
- Starmans, M.P.A.; Buisman, F.E.; Renckens, M.; Willemssen, F.E.J.A.; van der Voort, S.R.; Koerkamp, B.G.; Grünhagen, D.J.; Niessen, W.J.; Vermeulen, P.B.; Verhoef, C.; et al. Distinguishing pure histopathological growth patterns of colorectal liver metastases on CT using deep learning and radiomics: A pilot study. Clin. Exp. Metastasis 2021, 38, 483–494. [Google Scholar] [CrossRef] [PubMed]
- Sung, H.; Ferlay, J.; Siegel, R.L.; Laversanne, M.; Soerjomataram, I.; Jemal, A.; Bray, F. Global Cancer Statistics 2020: GLOBOCAN Estimates of Incidence and Mortality Worldwide for 36 Cancers in 185 Countries. CA A Cancer J. Clin. 2021, 71, 209–249. [Google Scholar] [CrossRef] [PubMed]
- Horstmann, M.; Witthuhn, R.; Falk, M.; Stenzl, A. Gender-specific differences in bladder cancer: A retrospective analysis. Gend. Med. 2008, 5, 385–394. [Google Scholar] [CrossRef]
- Ploussard, G.; Pradere, B.; Beauval, J.; Chevreau, C.; Almeras, C.; Suc, E.; Gautier, J.; Laurenty, A.; Roumiguié, M.; Loison, G.; et al. Survival Outcomes of Patients with Pathologically Proven Positive Lymph Nodes at Time of Radical Cystectomy with or without Neoadjuvant Chemotherapy. J. Clin. Med. 2020, 9, 1962. [Google Scholar] [CrossRef] [PubMed]
- Herr, H.W. Superiority of Ratio Based Lymph Node Staging for Bladder Cancer. J. Urol. 2003, 169, 943–945. [Google Scholar] [CrossRef] [PubMed]
- Aljabery, F.; Lindblom, G.; Skoog, S.; Shabo, I.; Olsson, H.; Rosell, J.; Jahnson, S. PET/CT versus conventional CT for detection of lymph node metastases in patients with locally advanced bladder cancer. BMC Urol. 2015, 15, 87. [Google Scholar] [CrossRef] [PubMed] [Green Version]
- Bruins, H.M.; Aben, K.K.H.; Arends, T.J.; van der Heijden, A.G.; Witjes, A.J. The effect of the time interval between diagnosis of muscle-invasive bladder cancer and radical cystectomy on staging and survival: A Netherlands Cancer Registry analysis. Urol. Oncol. 2016, 34, 166.e1–166.e6. [Google Scholar] [CrossRef] [PubMed]
- Herr, H.; Lee, C.; Chang, S.; Lerner, S. Standardization of Radical Cystectomy and Pelvic Lymph Node Dissection for Bladder Cancer: A Collaborative Group Report. J. Urol. 2004, 171, 1823–1828. [Google Scholar] [CrossRef]
- Maurer, T.; Souvatzoglou, M.; Kübler, H.; Opercan, K.; Schmidt, S.; Herrmann, K.; Stollfuss, J.; Weirich, G.; Haller, B.; Gschwend, J.E.; et al. Diagnostic efficacy of [11C]choline positron emission tomography/computed tomography compared with conventional computed tomography in lymph node staging of patients with bladder cancer prior to radical cystectomy. Eur. Urol. 2012, 61, 1031–1038. [Google Scholar] [CrossRef]
- Jeong, I.G.; Hong, S.; You, D.; Hong, J.H.; Ahn, H.; Kim, C. FDG PET-CT for lymph node staging of bladder cancer: A prospective study of patients with extended pelvic lymphadenectomy. Ann. Surg. Oncol. 2015, 22, 3150–3156. [Google Scholar] [CrossRef]
- Swinnen, G.; Maes, A.; Pottel, H.; Vanneste, A.; Billiet, I.; Lesage, K.; Werbrouck, P. FDG-PET/CT for the Preoperative Lymph Node Staging of Invasive Bladder Cancer. Eur. Urol. 2010, 57, 641–647. [Google Scholar] [CrossRef] [PubMed]
- Bouchelouche, K.; Turkbey, B.; Choyke, P.L. PET/CT and MRI in Bladder Cancer. J. Cancer Sci. Ther. 2012, S14, 7692. [Google Scholar] [CrossRef] [PubMed] [Green Version]
- Vind-Kezunovic, S.; Bouchelouche, K.; Ipsen, P.; Høyer, S.; Bell, C.; Jensen, J.B. Detection of Lymph Node Metastasis in Patients with Bladder Cancer using Maximum Standardised Uptake Value and 18F-fluorodeoxyglucose Positron Emission Tomography/Computed Tomography: Results from a High-volume Centre Including Long-term Follow-up. Eur. Urol. Focus 2019, 5, 90–96. [Google Scholar] [CrossRef] [PubMed]
- Thoeny, H.C.; Froehlich, J.M.; Triantafyllou, M.; Huesler, J.; Bains, L.J.; Vermathen, P.; Fleischmann, A.; Studer, U.E. Metastases in normal-sized pelvic lymph nodes: Detection with diffusion-weighted MR imaging. Radiology 2014, 273, 125–135. [Google Scholar] [CrossRef] [PubMed]
- Alberda, W. The Multimodality Treatment of Locally Advanced and Locally Recurrent Rectal Cancer; Erasmus University: Rotterdam, The Netherlands, 2018. [Google Scholar]
- Brown, G.; Richards, C.J.; Bourne, M.W.; Newcombe, R.G.; Radcliffe, A.C.; Dallimore, N.S.; Williams, G.T. Morphologic Predictors of Lymph Node Status in Rectal Cancer with Use of High-Spatial-Resolution MR Imaging with Histopathologic Comparison. Radiology 2003, 227, 371–377. [Google Scholar] [CrossRef]
- Abouelkheir, R.T.; Abdelhamid, A.; El-Ghar, M.A.; El-Diasty, T. Imaging of Bladder Cancer: Standard Applications and Future Trends. Medicina 2021, 57, 220. [Google Scholar] [CrossRef]
- Kamecki, H.; Kamecka, A.; Sosnowski, R.; Sklinda, K.; Czarniecki, M.; Królicki, L.; Walecki, J. Evaluation of lymph node status in patients with urothelial carcinoma-still in search of the perfect imaging modality: A systematic review. Transl. Androl. Urol. 2018, 7, 783–803. [Google Scholar] [CrossRef]


| pN0 (n = 159) | pN+ (n = 50) | p-Value | |
|---|---|---|---|
| Sex | 0.013 | ||
| Female N (%) | 38 (24%) | 21 (42%) | |
| Male N (%) | 121 (76%) | 29 (58%) | |
| Age (years)† | 69 [62–74] | 70 [61–76] | 0.639 |
| Clinical N status | 0.394 | ||
| cN0 | 156 | 48 | |
| cN+ | 3 | 2 | |
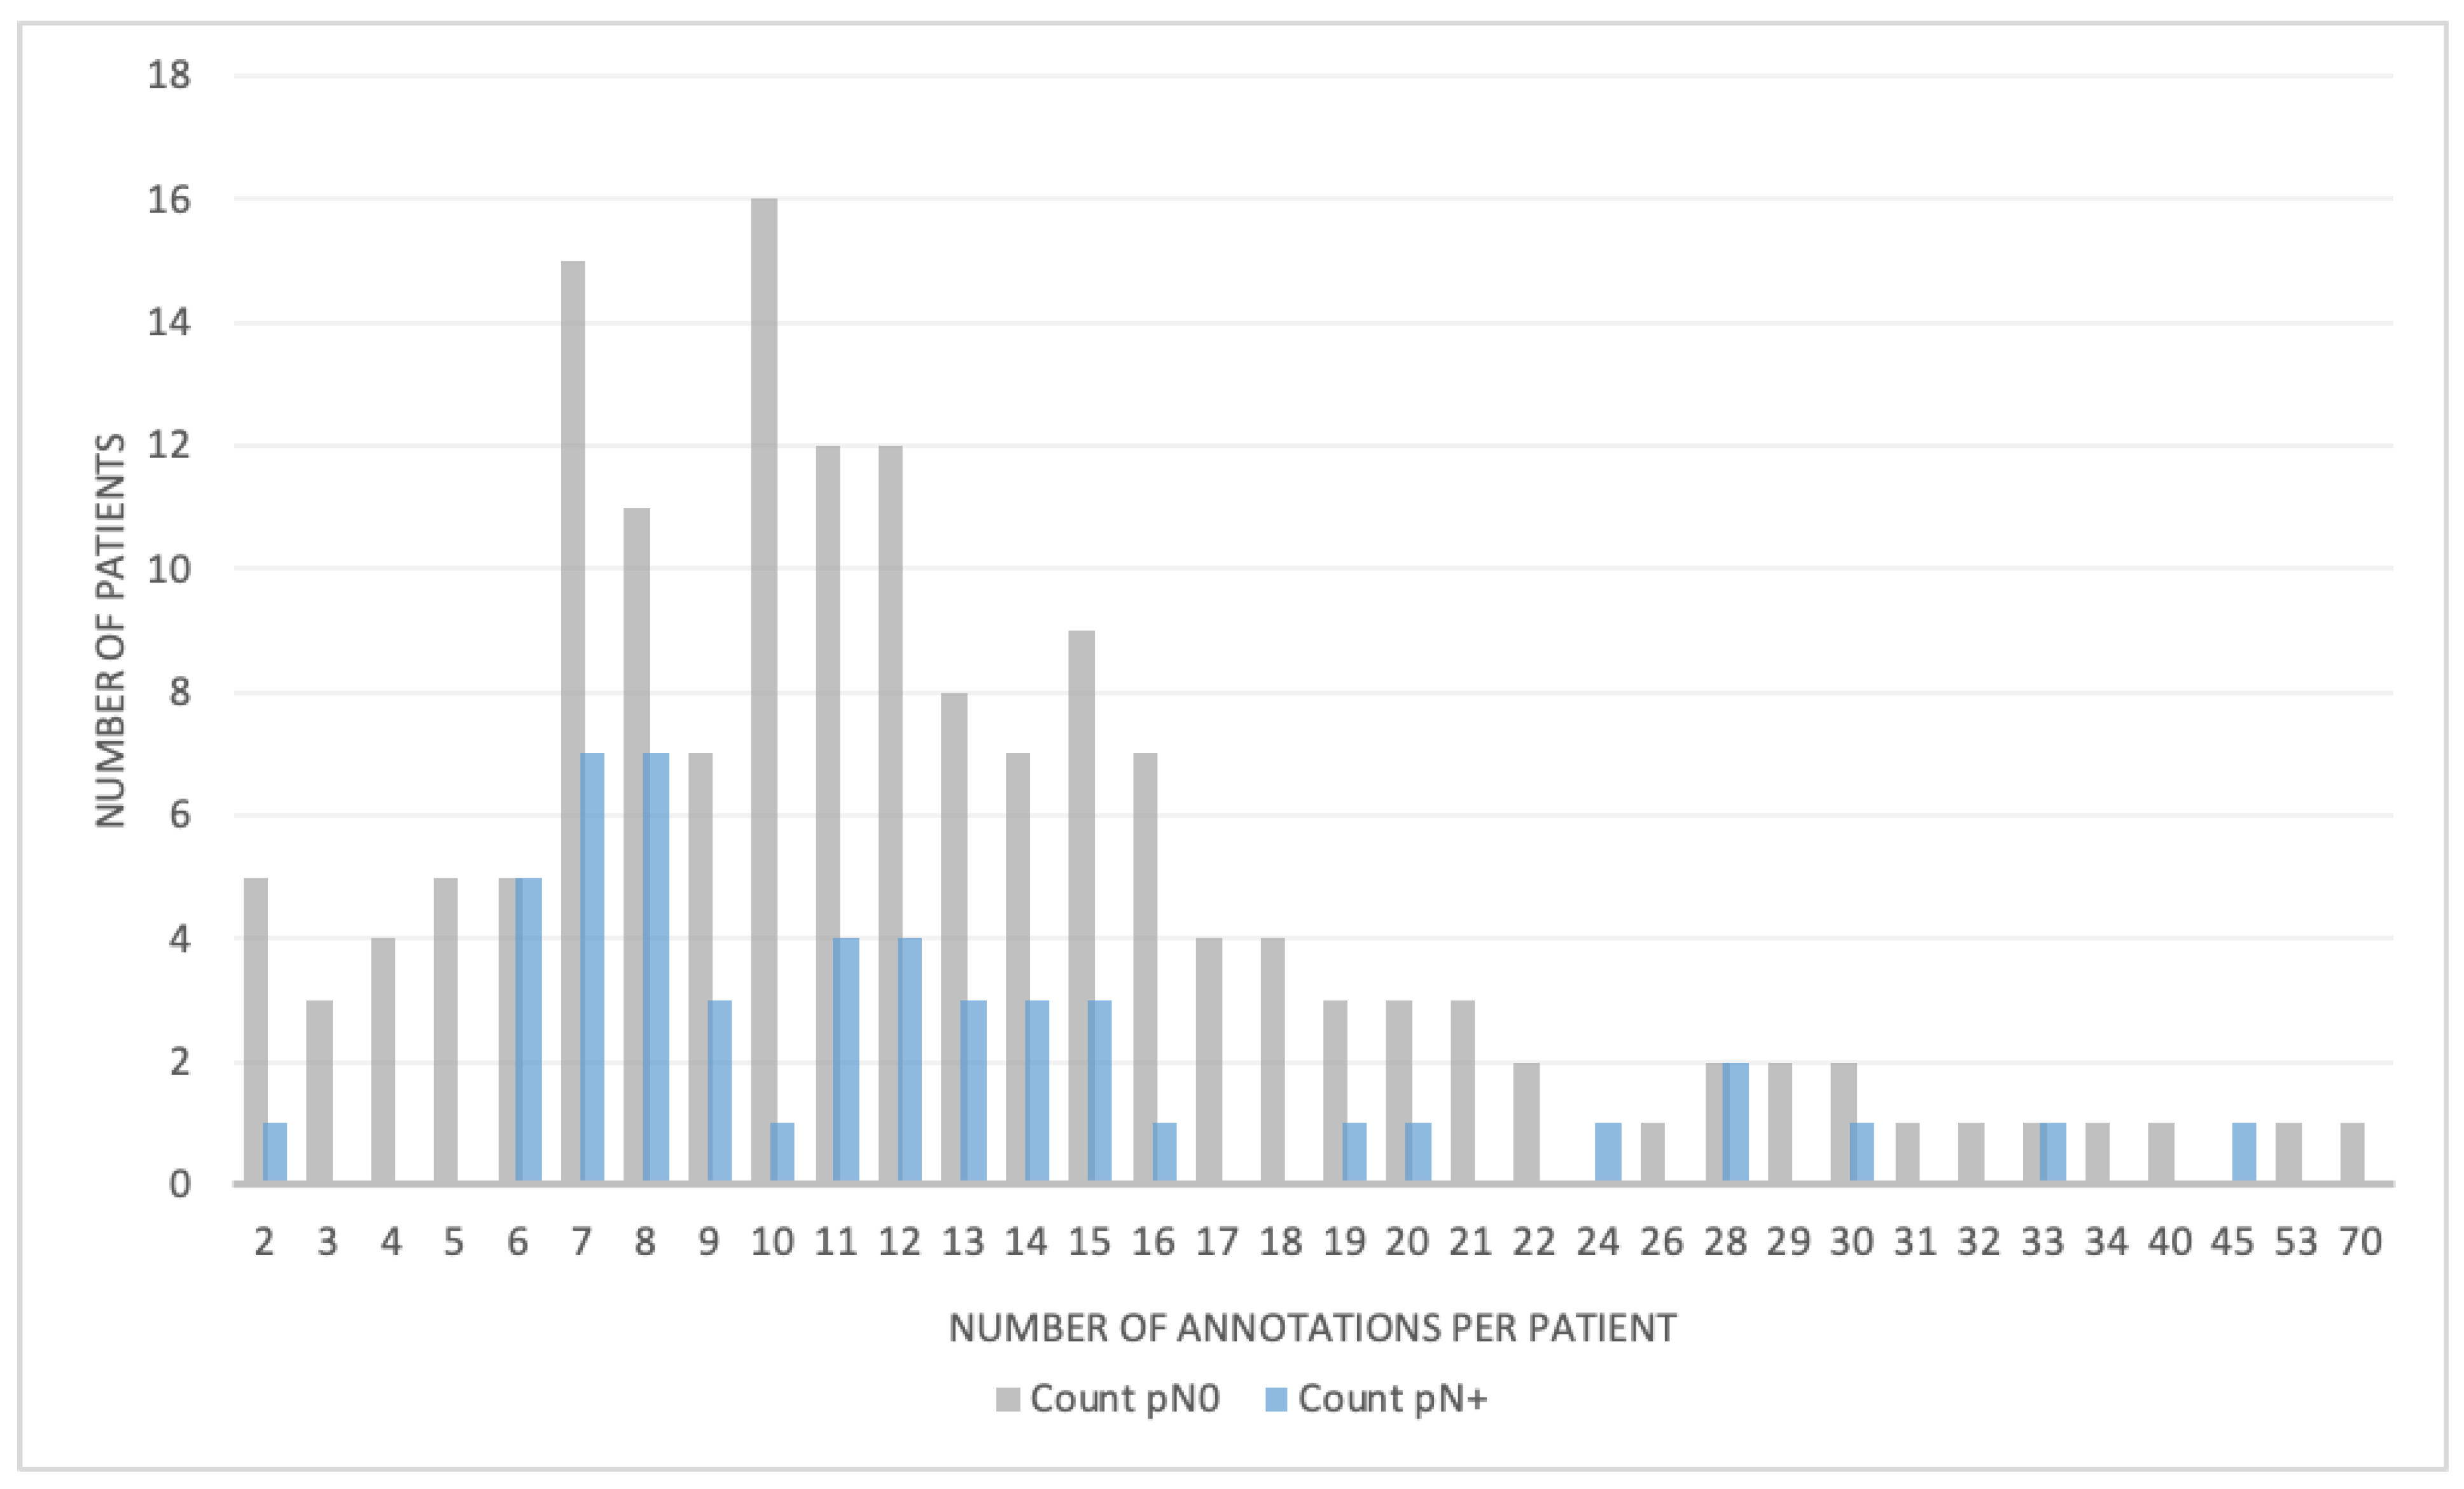
| LN segmentations, mean number per patient (±SD) | 13.13 (±8.9) | 12.7 (±8.2) | 0.534 |
| LN volume (cl), mean (±SD) | 0.030 (±0.062) | 0.031 (±0.070) | 0.264 |
| LN maximum diameter (mm), mean (±SD) | 13.81 (±9.19) | 13.96 (±9.44) | 0.396 |
| LN removed N† | 16 [13–23] | 18 [14–25] | 0.106 |
| Pathological LN yield (%) † | 9 [6–17] | ||
| Time between scan and surgery date (months)† | 2 [2–3] | 2 [2–3] | 0.993 |
| Imaging | |||
| Slice thickness (mm) † | 5.0 [3.0–5.0] | 5.0 [3.0–5.0] | 0.127 |
| Pixel spacing (mm) † | 0.77 [0.71–0.80] | 0.75 [0.70–0.81] | 0.151 |
| Tube current (mA) † | 237.0 [159.0–350.0] | 191.5 [147.0–318.0] | 0.073 |
| Peak kilovoltage † | 120 [100–120] | 100 [100–120] | 0.040 |
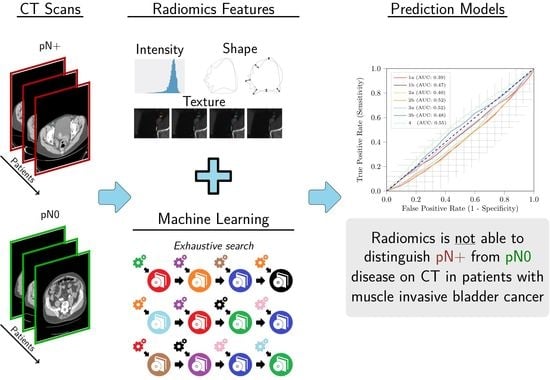
| Model 1a | Model 1b | Model 2a | Model 2b | |
|---|---|---|---|---|
| Included LNs | All | All | MSAD > 15 mm | MSAD > 15 mm |
| Feature extraction | All LNs as one ROI | Per LN and averaged | All LNs as one ROI | Per LN and averaged |
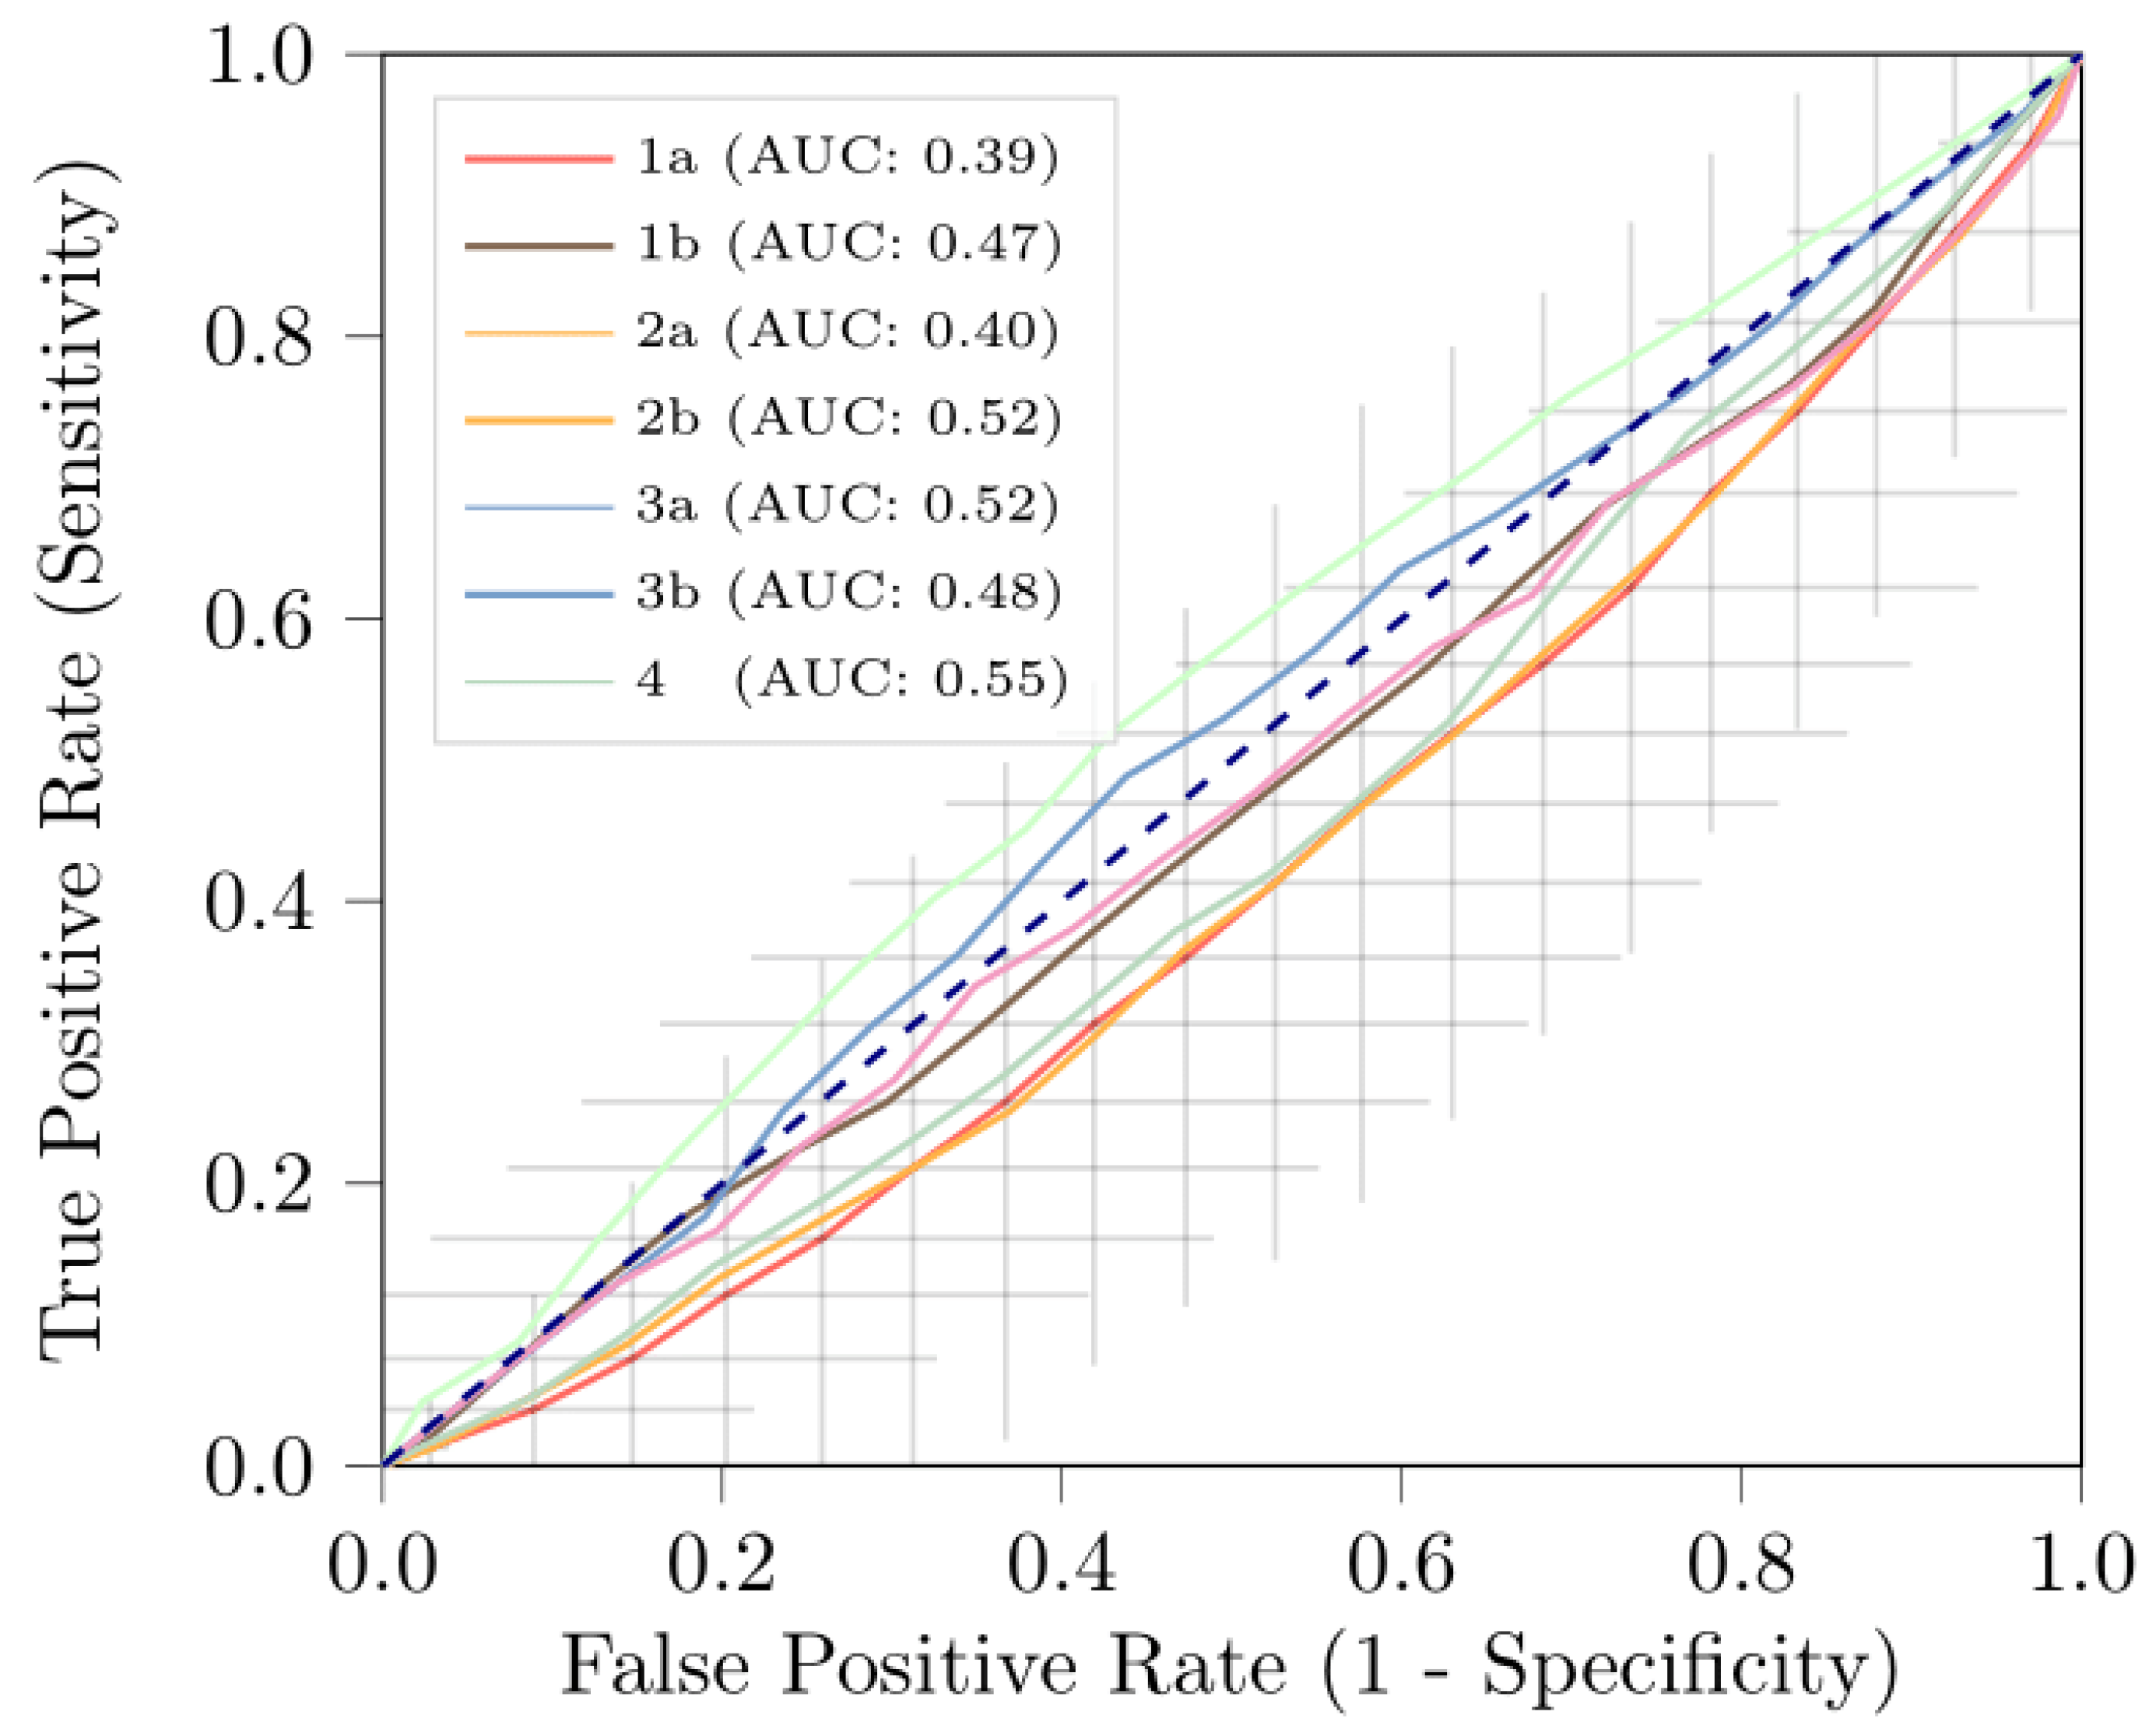
| AUC | 0.39 [0.30, 0.48] | 0.47 [0.38, 0.57] | 0.40 [0.33, 0.47] | 0.52 [0.42, 0.62] |
| BCA | 0.50 [0.50, 0.50] | 0.50 [0.50, 0.50] | 0.50 [0.49, 0.50] | 0.50 [0.48, 0.52] |
| Sensitivity | 0.00 [0.00, 0.00] | 0.00 [0.00, 0.00] | 0.00 [0.00, 0.00] | 0.01 [0.00, 0.04] |
| Specificity | 1.00 [0.99, 1.00] | 1.00 [0.99, 1.00] | 1.00 [0.99, 1.00] | 0.99 [0.97, 1.00] |
| Model 3a | Model 3b | Model 4 | ||
| Included LNs | Largest 5 LNs | Largest 5 LNs | Primary Tumor | |
| Feature extraction | All LNs as one ROI | Per LN and averaged | Primary Tumor | |
| AUC | 0.42 [0.33, 0.51] | 0.48 [0.37, 0.55] | 0.55 [0.46, 0.65] | |
| BCA | 0.50 [0.49, 0.50] | 0.50 [0.48, 0.51] | 0.50 [0.46, 0.54] | |
| Sensitivity | 0.00 [0.00, 0.00] | 0.09 [0.00, 0.25] | 0.06 [0.00, 0.15] | |
| Specificity | 1.00 [0.99, 1.00] | 0.92 [0.81, 1.00] | 0.94 [0.87, 1.00] |
Publisher’s Note: MDPI stays neutral with regard to jurisdictional claims in published maps and institutional affiliations. |
© 2022 by the authors. Licensee MDPI, Basel, Switzerland. This article is an open access article distributed under the terms and conditions of the Creative Commons Attribution (CC BY) license (https://creativecommons.org/licenses/by/4.0/).
Share and Cite
Starmans, M.P.A.; Ho, L.S.; Smits, F.; Beije, N.; de Kruijff, I.; de Jong, J.J.; Somford, D.M.; Boevé, E.R.; te Slaa, E.; Cauberg, E.C.C.; et al. Optimization of Preoperative Lymph Node Staging in Patients with Muscle-Invasive Bladder Cancer Using Radiomics on Computed Tomography. J. Pers. Med. 2022, 12, 726. https://doi.org/10.3390/jpm12050726
Starmans MPA, Ho LS, Smits F, Beije N, de Kruijff I, de Jong JJ, Somford DM, Boevé ER, te Slaa E, Cauberg ECC, et al. Optimization of Preoperative Lymph Node Staging in Patients with Muscle-Invasive Bladder Cancer Using Radiomics on Computed Tomography. Journal of Personalized Medicine. 2022; 12(5):726. https://doi.org/10.3390/jpm12050726
Chicago/Turabian StyleStarmans, Martijn P. A., Li Shen Ho, Fokko Smits, Nick Beije, Inge de Kruijff, Joep J. de Jong, Diederik M. Somford, Egbert R. Boevé, Ed te Slaa, Evelyne C. C. Cauberg, and et al. 2022. "Optimization of Preoperative Lymph Node Staging in Patients with Muscle-Invasive Bladder Cancer Using Radiomics on Computed Tomography" Journal of Personalized Medicine 12, no. 5: 726. https://doi.org/10.3390/jpm12050726
APA StyleStarmans, M. P. A., Ho, L. S., Smits, F., Beije, N., de Kruijff, I., de Jong, J. J., Somford, D. M., Boevé, E. R., te Slaa, E., Cauberg, E. C. C., Klaver, S., van der Heijden, A. G., Wijburg, C. J., van de Luijtgaarden, A. C. M., van Melick, H. H. E., Cauffman, E., de Vries, P., Jacobs, R., Niessen, W. J., ... van der Veldt, A. A. M. (2022). Optimization of Preoperative Lymph Node Staging in Patients with Muscle-Invasive Bladder Cancer Using Radiomics on Computed Tomography. Journal of Personalized Medicine, 12(5), 726. https://doi.org/10.3390/jpm12050726