
Nonlinear Machine Learning in Warfarin Dose Prediction: Insights from Contemporary Modelling Studies

 ,
, 
Abstract
1. Introduction
2. Methods
2.1. Search Strategy and Selection Criteria
2.2. Study Selection and Extraction of Data
2.3. Risk of Bias
2.4. Data Synthesis
3. Results
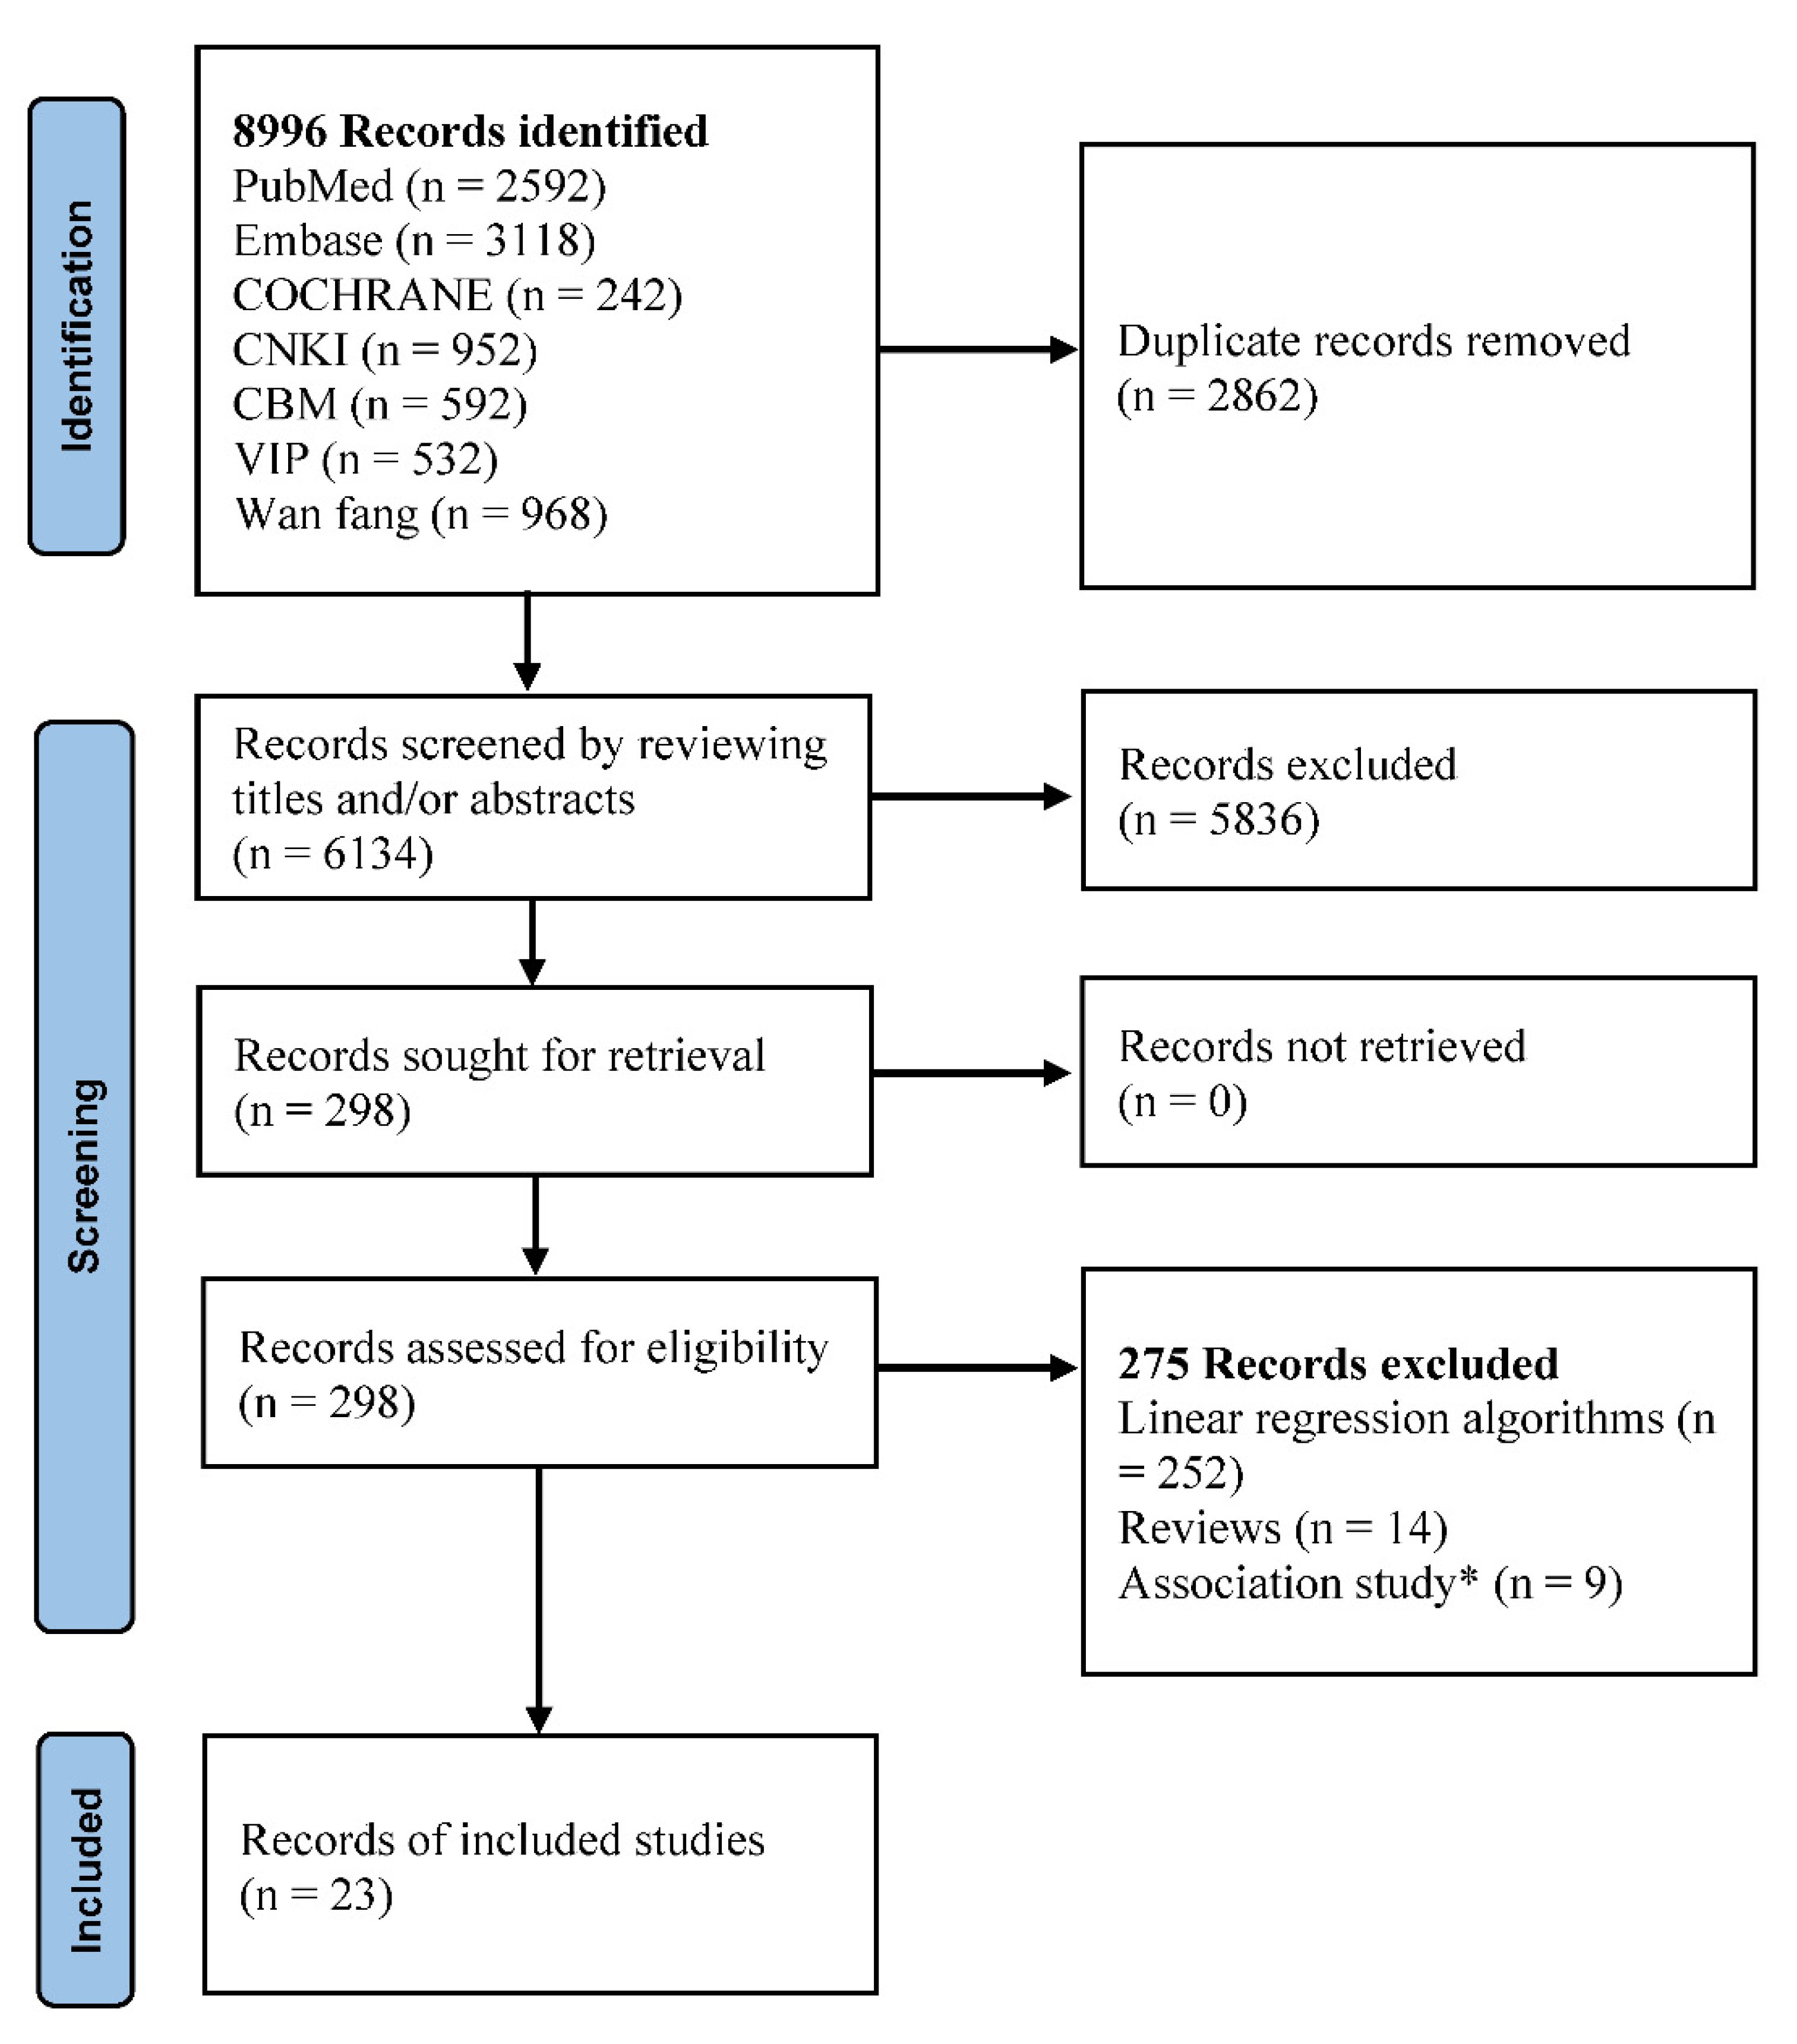
3.1. Study Selection
3.2. General Characteristics
3.2.1. Participants
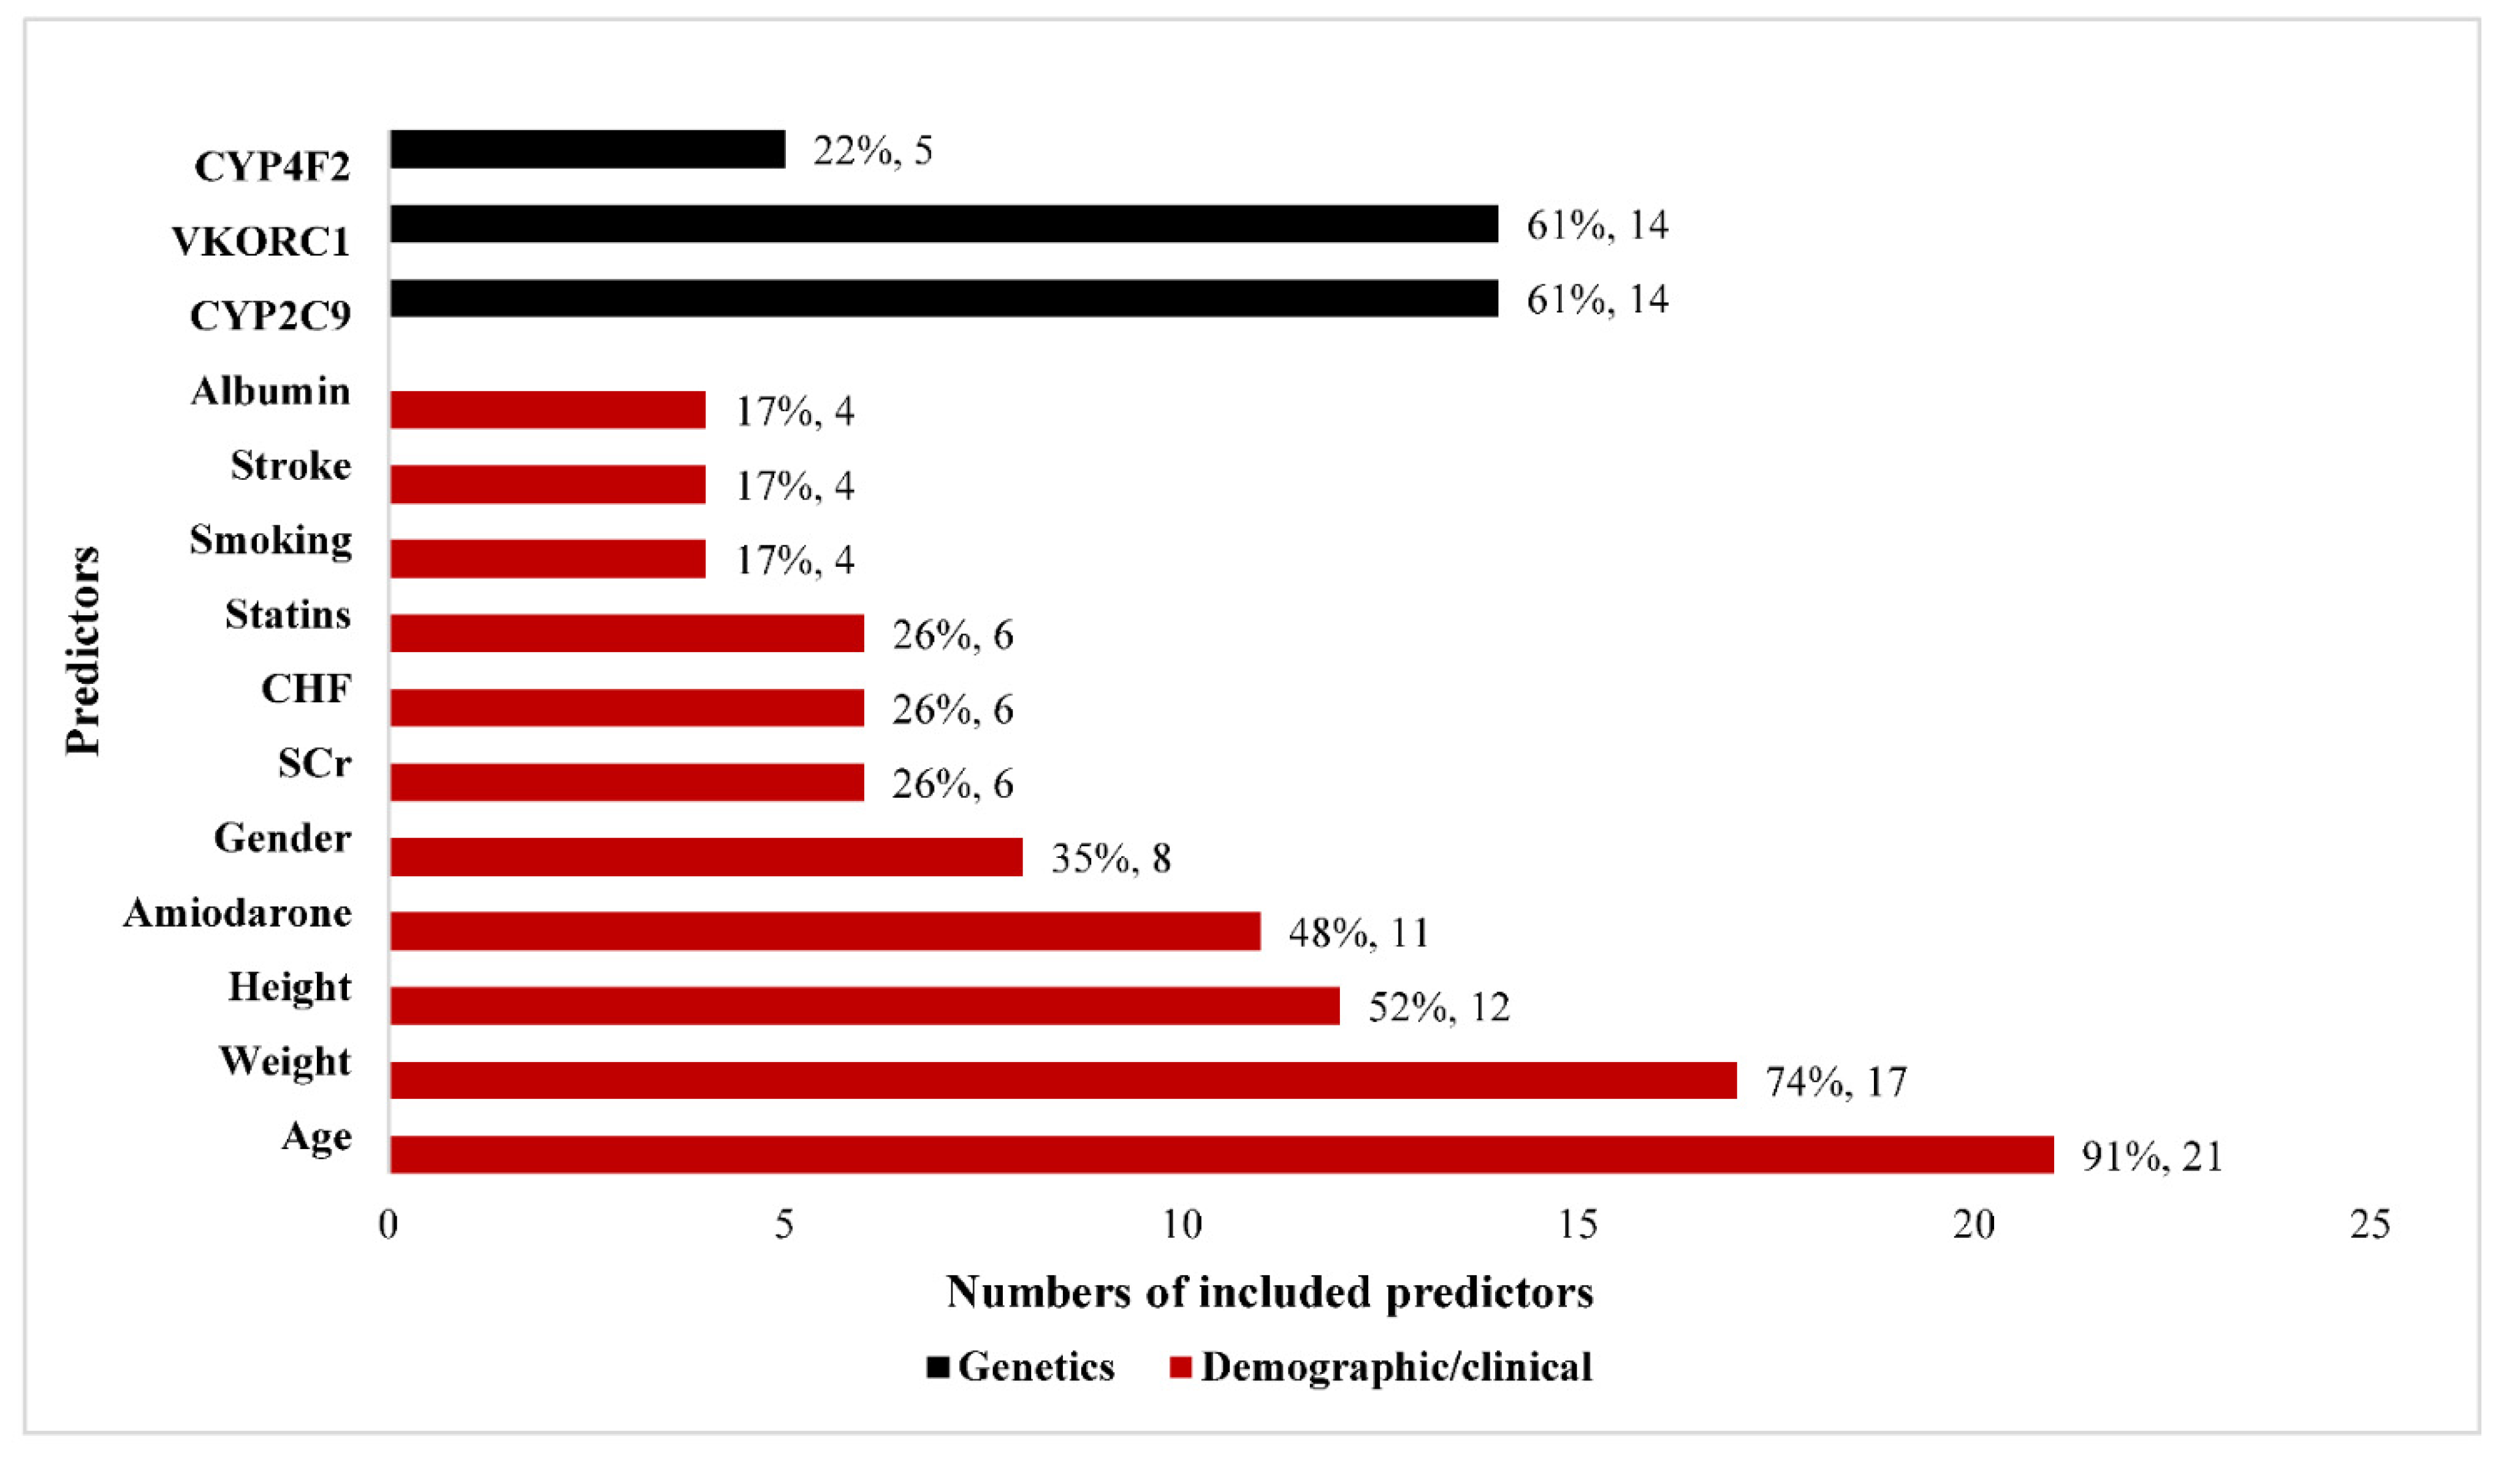
3.2.2. Predictors
3.2.3. Model Development
3.2.4. Model Evaluation
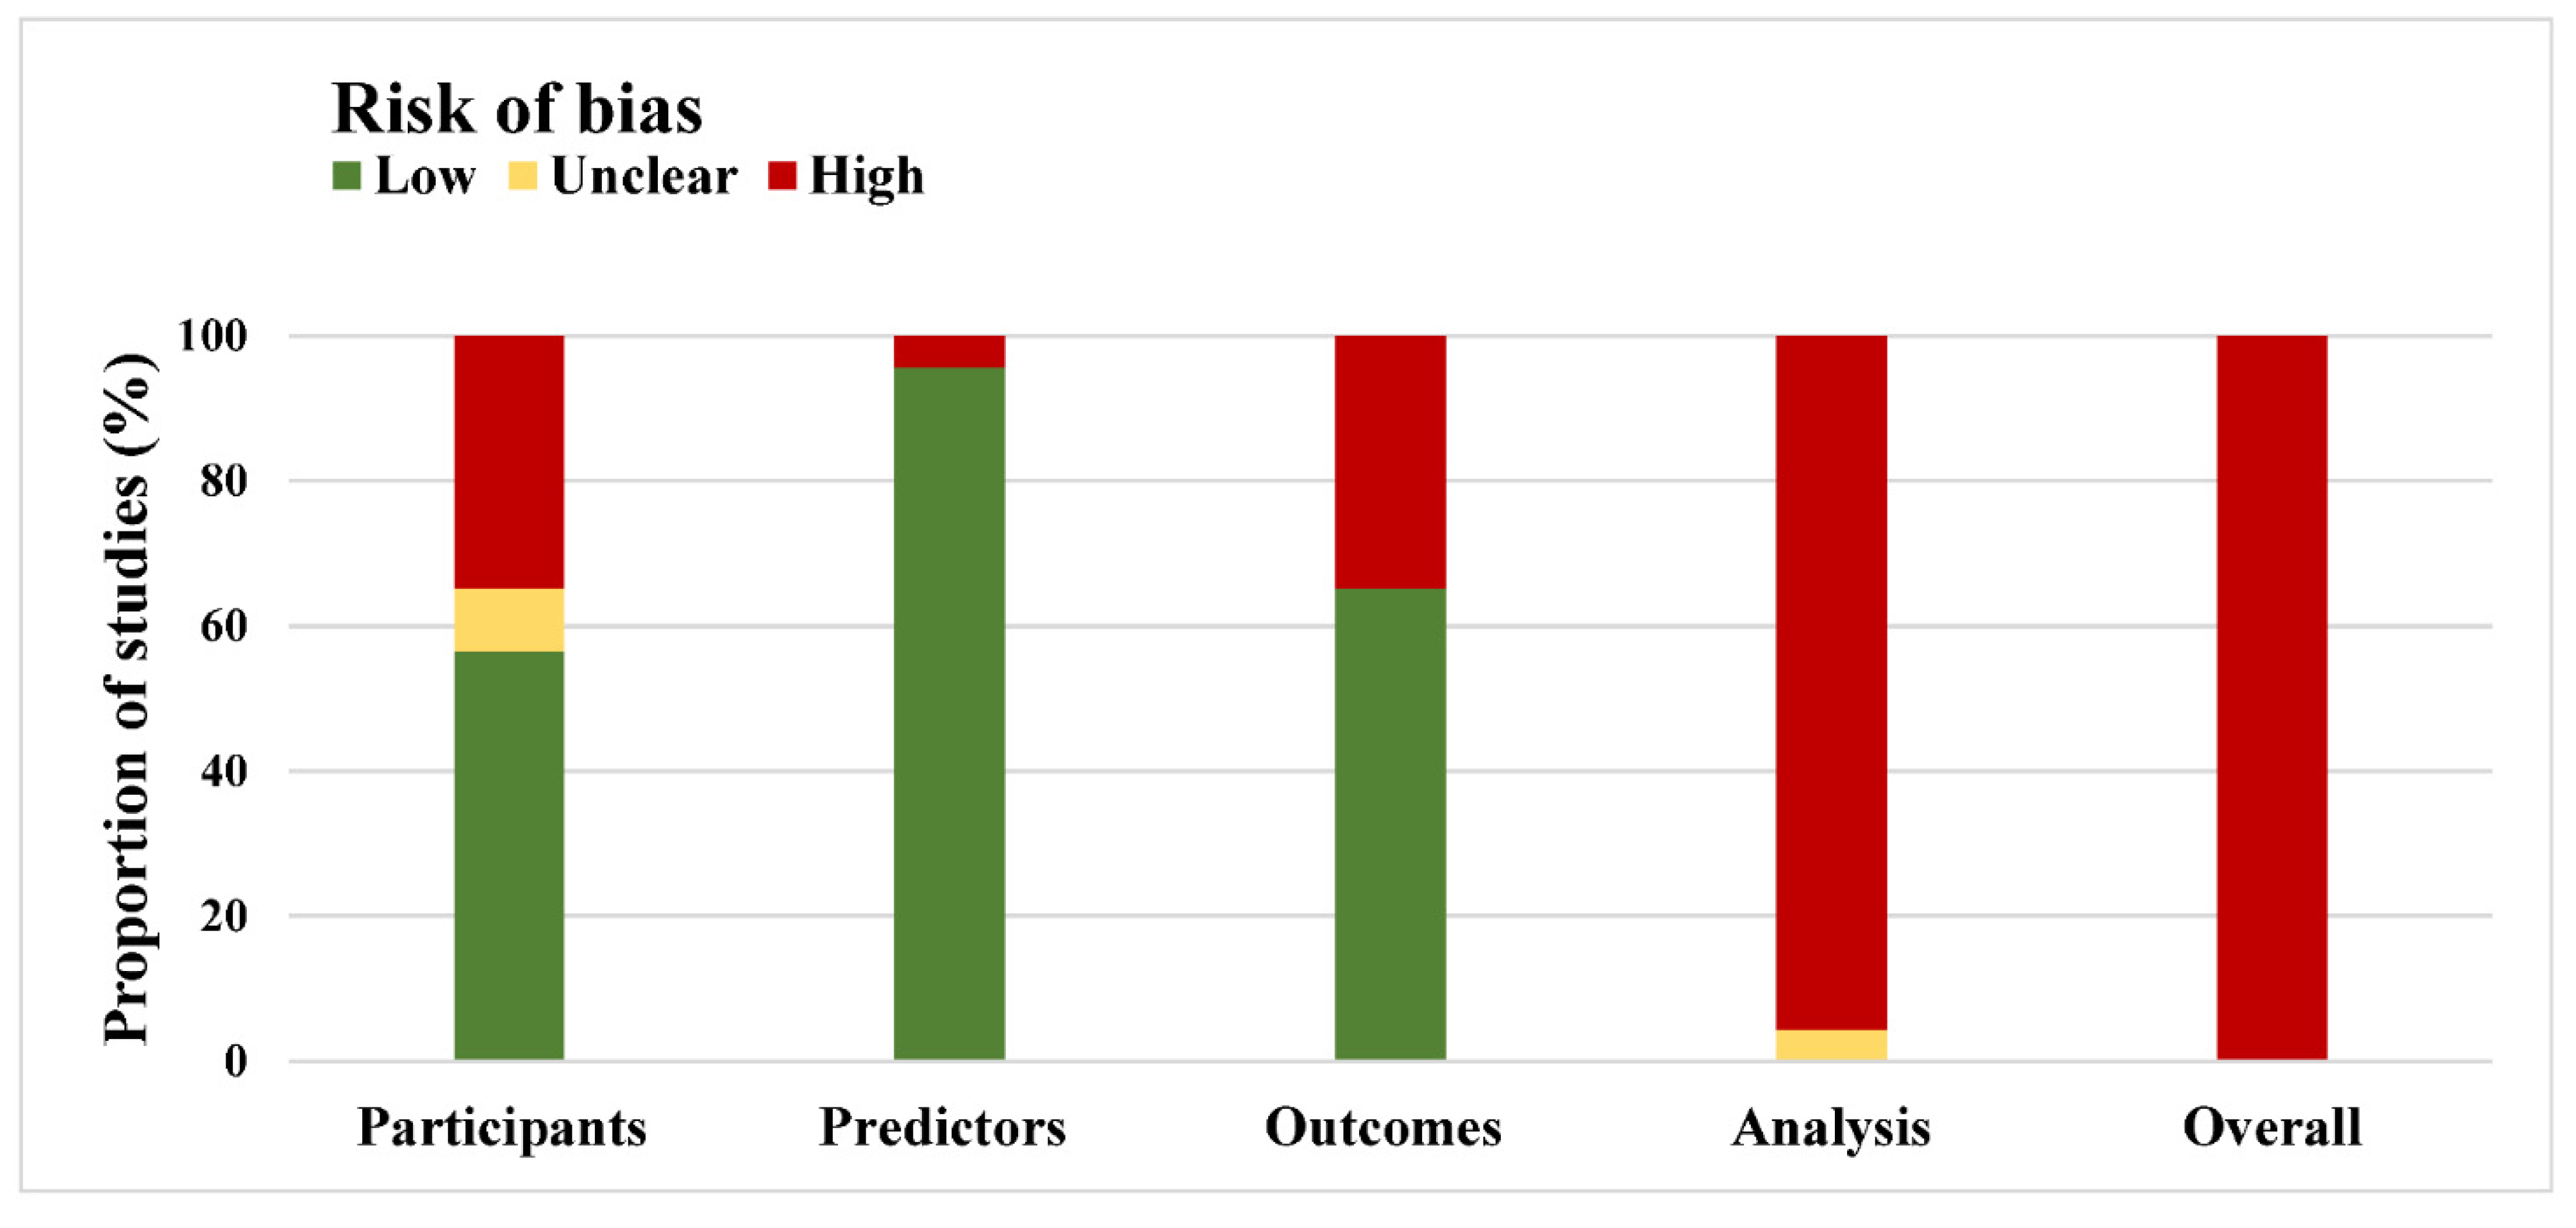
3.3. Methods and Risk of Bias
4. Discussion
4.1. Major Finding
4.2. Risk of Bias
4.3. Performance Measures
4.4. Linear Regression vs. Nonlinear ML in Warfarin
4.5. Clinical Relevance
4.6. Study Limitations
4.7. Future Research
5. Conclusions
Supplementary Materials
Author Contributions
Funding
Institutional Review Board Statement
Informed Consent Statement
Data Availability Statement
Conflicts of Interest
References
- Nishimura, R.A.; Otto, C.M.; Bonow, R.O.; Carabello, B.A.; Erwin, J.P.; Fleisher, L.A.; Jneid, H.; Mack, M.J.; McLeod, C.J.; O’Gara, P.T.; et al. 2017 AHA/ACC Focused Update of the 2014 AHA/ACC Guideline for the Management of Patients With Valvular Heart Disease: A Report of the American College of Cardiology/American Heart Association Task Force on Clinical Practice Guidelines. Circulation 2017, 135, e1159–e1195. [Google Scholar] [CrossRef] [PubMed]
- Witt, D.M.; Clark, N.P.; Kaatz, S.; Schnurr, T.; Ansell, J.E. Guidance for the practical management of warfarin therapy in the treatment of venous thromboembolism. J. Thromb. Thrombolysis 2016, 41, 187–205. [Google Scholar] [CrossRef] [PubMed]
- Loebstein, R.; Yonath, H.; Peleg, D.; Almog, S.; Rotenberg, M.; Lubetsky, A.; Roitelman, J.; Harats, D.; Halkin, H.; Ezra, D. Interindividual variability in sensitivity to warfarin-Nature or nurture? Clin. Pharmacol. Ther. 2001, 70, 159–164. [Google Scholar] [CrossRef] [PubMed]
- Klein, T.E.; Altman, R.B.; Eriksson, N.; Gage, B.F.; Kimmel, S.E.; Lee, M.T.M.; Limdi, N.A.; Page, D.; Roden, D.M.; Wagner, M.J.; et al. Estimation of the warfarin dose with clinical and pharmacogenetic data. N. Engl. J. Med. 2009, 360, 753–764. [Google Scholar] [CrossRef] [PubMed]
- Bourgeois, S.; Jorgensen, A.; Zhang, E.J.; Hanson, A.; Gillman, M.S.; Bumpstead, S.; Toh, C.H.; Williamson, P.; Daly, A.K.; Kamali, F.; et al. A multi-factorial analysis of response to warfarin in a UK prospective cohort. Genome Med. 2016, 8, 2. [Google Scholar] [CrossRef]
- Spina, E.; Barbieri, M.A.; Cicala, G.; Bruno, A.; de Leon, J. Clinically relevant drug interactions between newer antidepressants and oral anticoagulants. Expert Opin. Drug Metab. Toxicol. 2020, 16, 31–44. [Google Scholar] [CrossRef]
- Wang, M.; Zeraatkar, D.; Obeda, M.; Lee, M.; Garcia, C.; Nguyen, L.; Agarwal, A.; Al-Shalabi, F.; Benipal, H.; Ahmad, A.; et al. Drug-drug interactions with warfarin: A systematic review and meta-analysis. Br. J. Clin. Pharmacol. 2021, 87, 4051–4100. [Google Scholar] [CrossRef]
- Sager, J.E.; Yu, J.; Ragueneau-Majlessi, I.; Isoherranen, N. Physiologically Based Pharmacokinetic (PBPK) Modeling and Simulation Approaches: A Systematic Review of Published Models, Applications, and Model Verification. Drug Metab. Dispos. 2015, 43, 1823–1837. [Google Scholar] [CrossRef]
- Zhu, Y.-B.; Hong, X.-H.; Wei, M.; Hu, J.; Chen, X.; Wang, S.-K.; Zhu, J.-R.; Yu, F.; Sun, J.-G. Development of a novel individualized warfarin dose algorithm based on a population pharmacokinetic model with improved prediction accuracy for Chinese patients after heart valve replacement. Acta Pharmacol. Sin. 2017, 38, 434–442. [Google Scholar] [CrossRef][Green Version]
- Arwood, M.J.; Deng, J.; Drozda, K.; Pugach, O.; Nutescu, E.A.; Schmidt, S.; Duarte, J.D.; Cavallari, L.H. Anticoagulation endpoints with clinical implementation of warfarin pharmacogenetic dosing in a real-world setting: A proposal for a new pharmacogenetic dosing approach. Clin. Pharmacol. Ther. 2017, 101, 675–683. [Google Scholar] [CrossRef]
- Lu, Y.; Yang, J.; Zhang, H.; Yang, J. Prediction of warfarin maintenance dose in Han Chinese patients using a mechanistic model based on genetic and non-genetic factors. Clin. Pharmacokinet. 2013, 52, 567–581. [Google Scholar] [CrossRef] [PubMed]
- DeGregory, K.W.; Kuiper, P.; DeSilvio, T.; Pleuss, J.D.; Miller, R.; Roginski, J.W.; Fisher, C.B.; Harness, D.; Viswanath, S.; Heymsfield, S.B.; et al. A review of machine learning in obesity. Obes. Rev. 2018, 19, 668–685. [Google Scholar] [CrossRef] [PubMed]
- Asiimwe, I.G.; Zhang, E.J.; Osanlou, R.; Jorgensen, A.L.; Pirmohamed, M. Warfarin dosing algorithms: A systematic review. Br. J. Clin. Pharmacol. 2021, 87, 1717–1729. [Google Scholar] [CrossRef] [PubMed]
- Schalekamp, T.; Brassé, B.; Roijers, J.; van Meegen, E.; van der Meer, F.; van Wijk, E.; Egberts, A.; de Boer, A. VKORC1 and CYP2C9 genotypes and phenprocoumon anticoagulation status: Interaction between both genotypes affects dose requirement. Clin. Pharmacol. Ther. 2007, 81, 185–193. [Google Scholar] [CrossRef] [PubMed]
- Li, X.; Liu, R.; Yan, H.; Tang, J.; Yin, J.; Mao, X.; Yang, F.; Luo, Z.; Tan, S.; He, H.; et al. Effect of CYP2C9-VKORC1 interaction on warfarin stable dosage and its predictive algorithm. J. Clin. Pharmacol. 2015, 55, 251–257. [Google Scholar] [CrossRef] [PubMed]
- Moons, K.; de Groot, J.; Bouwmeester, W.; Vergouwe, Y.; Mallett, S.; Altman, D.; Reitsma, J.; Collins, G. Critical appraisal and data extraction for systematic reviews of prediction modelling studies: The CHARMS checklist. PLoS Med. 2014, 11, e1001744. [Google Scholar] [CrossRef]
- Wolff, R.; Moons, K.; Riley, R.; Whiting, P.; Westwood, M.; Collins, G.; Reitsma, J.; Kleijnen, J.; Mallett, S. PROBAST: A Tool to Assess the Risk of Bias and Applicability of Prediction Model Studies. Ann. Intern. Med. 2019, 170, 51–58. [Google Scholar] [CrossRef]
- Andaur Navarro, C.L.; Damen, J.A.A.G.; Takada, T.; Nijman, S.W.J.; Dhiman, P.; Ma, J.; Collins, G.S.; Bajpai, R.; Riley, R.D.; Moons, K.G.; et al. Protocol for a systematic review on the methodological and reporting quality of prediction model studies using machine learning techniques. BMJ Open 2020, 10, e038832. [Google Scholar] [CrossRef]
- Nagendran, M.; Chen, Y.; Lovejoy, C.A.; Gordon, A.C.; Komorowski, M.; Harvey, H.; Topol, E.J.; Ioannidis, J.P.A.; Collins, G.S.; Maruthappu, M. Artificial intelligence versus clinicians: Systematic review of design, reporting standards, and claims of deep learning studies. BMJ 2020, 368, m689. [Google Scholar] [CrossRef]
- Kennedy, E.E.; Bowles, K.H.; Aryal, S. Systematic review of prediction models for postacute care destination decision-making. J. Am. Med. Inform. Assoc. 2021, 29, 176–186. [Google Scholar] [CrossRef]
- van de Sande, D.; van Genderen, M.E.; Huiskens, J.; Gommers, D.; van Bommel, J. Moving from bytes to bedside: A systematic review on the use of artificial intelligence in the intensive care unit. Intensiv. Care Med. 2021, 47, 750–760. [Google Scholar] [CrossRef] [PubMed]
- Solomon, I.; Maharshak, N.; Chechik, G.; Leibovici, L.; Lubetsky, A.; Halkin, H.; Ezra, D.; Ash, N. Applying an artificial neural network to warfarin maintenance dose prediction. Isr. Med. Assoc. J. 2004, 6, 732–735. [Google Scholar] [PubMed]
- Cosgun, E.; Limdi, N.A.; Duarte, C.W. High-dimensional pharmacogenetic prediction of a continuous trait using machine learning techniques with application to warfarin dose prediction in African Americans. Bioinformatics 2011, 27, 1384–1389. [Google Scholar] [CrossRef] [PubMed]
- Hu, Y.H.; Wu, F.; Lo, C.L.; Tai, C.T. Predicting warfarin dosage from clinical data: A supervised learning approach. Artif. Intell. Med. 2012, 56, 27–34. [Google Scholar] [CrossRef]
- Grossi, E.; Podda, G.M.; Pugliano, M.; Gabba, S.; Verri, A.; Carpani, G.; Buscema, M.; Casazza, G.; Cattaneo, M. Prediction of optimal warfarin maintenance dose using advanced artificial neural networks. Pharmacogenomics 2014, 15, 29–37. [Google Scholar] [CrossRef]
- Saleh, M.I.; Alzubiedi, S. Dosage individualization of warfarin using artificial neural networks. Mol. Diagn. Ther. 2014, 18, 371–379. [Google Scholar] [CrossRef]
- Zhou, Q.; Kwong, J.; Chen, J.; Qin, W.; Chen, J.; Dong, L. Use of artificial neural network to predict warfarin individualized dosage regime in Chinese patients receiving low-intensity anticoagulation after heart valve replacement. Int. J. Cardiol. 2014, 176, 1462–1464. [Google Scholar] [CrossRef]
- Li, X.; Liu, R.; Luo, Z.Y.; Yan, H.; Huang, W.H.; Yin, J.Y.; Mao, X.Y.; Chen, X.P.; Liu, Z.Q.; Zhou, H.H.; et al. Comparison of the predictive abilities of pharmacogenetics-based warfarin dosing algorithms using seven mathematical models in Chinese patients. Pharmacogenomics 2015, 16, 583–590. [Google Scholar] [CrossRef]
- Liu, R.; Li, X.; Zhang, W.; Zhou, H.H. Comparison of Nine Statistical Model Based Warfarin Pharmacogenetic Dosing Algorithms Using the Racially Diverse International Warfarin Pharmacogenetic Consortium Cohort Database. PLoS ONE 2015, 10, e0135784. [Google Scholar] [CrossRef]
- Alzubiedi, S.; Saleh, M.I. Pharmacogenetic-guided Warfarin Dosing Algorithm in African-Americans. J. Cardiovasc. Pharmacol. 2016, 67, 86–92. [Google Scholar] [CrossRef]
- Pavani, A.; Naushad, S.M.; Kumar, R.M.; Srinath, M.; Malempati, A.R.; Kutala, V.K. Artificial neural network-based pharmacogenomic algorithm for warfarin dose optimization. Pharmacogenomics 2016, 17, 121–131. [Google Scholar] [CrossRef] [PubMed]
- Li, Q.; Tao, H.; Wang, J.; Zhou, Q.; Chen, J.; Qin, W.Z.; Dong, L.; Fu, B.; Hou, J.L.; Chen, J.; et al. Warfarin maintenance dose Prediction for Patients undergoing heart valve replacement- a hybrid model with genetic algorithm and Back-Propagation neural network. Sci. Rep. 2018, 8, 9712. [Google Scholar] [CrossRef] [PubMed]
- Ma, Z.; Wang, P.; Gao, Z.; Wang, R.; Khalighi, K. Ensemble of machine learning algorithms using the stacked generalization approach to estimate the warfarin dose. PLoS ONE 2018, 13, e0205872. [Google Scholar] [CrossRef] [PubMed]
- Tao, H.; Li, Q.; Zhou, Q.; Chen, J.; Fu, B.; Wang, J.; Qin, W.; Hou, J.; Chen, J. A prediction study of warfarin individual stable dose after mechanical heart valve replacement: Adaptive neural-fuzzy inference system prediction. PLoS ONE 2018, 18, 10. [Google Scholar] [CrossRef] [PubMed]
- Li, Q.; Wang, J.; Tao, H.; Zhou, Q.; Chen, J.; Fu, B.; Qin, W.Z.; Li, D.; Hou, J.L.; Chen, J.; et al. The Prediction Model of Warfarin Individual Maintenance Dose for Patients Undergoing Heart Valve Replacement, Based on the Back Propagation Neural Network. Clin. Drug Investig. 2019, 40, 41–53. [Google Scholar] [CrossRef]
- Tao, Y.; Chen, Y.J.; Fu, X.; Jiang, B.; Zhang, Y. Evolutionary Ensemble Learning Algorithm to Modeling of Warfarin Dose Prediction for Chinese. IEEE J. Biomed. Health Inform. 2019, 23, 395–406. [Google Scholar] [CrossRef]
- Tao, Y.; Chen, Y.J.; Xue, L.; Xie, C.; Jiang, B.; Zhang, Y. An Ensemble Model With Clustering Assumption for Warfarin Dose Prediction in Chinese Patients. Pharm. J. 2019, 23, 2642–2654. [Google Scholar] [CrossRef]
- Roche-Lima, A.; Roman-Santiago, A.; Feliu-Maldonado, R.; Rodriguez-Maldonado, J.; Nieves-Rodriguez, B.G.; Carrasquillo-Carrion, K.; Ramos, C.M.; Da Luz Sant’Ana, I.; Massey, S.E.; Duconge, J. Machine learning algorithm for predicting warfarin dose in caribbean hispanics using pharmacogenetic data. Front. Pharmacol. 2020, 10, 1550. [Google Scholar] [CrossRef]
- Asiimwe, I.G.; Blockman, M.; Cohen, K.; Cupido, C.; Hutchinson, C.; Jacobson, B.; Lamorde, M.; Morgan, J.; Mouton, J.P.; Nakagaayi, D.; et al. Stable warfarin dose prediction in sub-Saharan African patients: A machine-learning approach and external validation of a clinical dose-initiation algorithm. CPT Pharmacomet. Syst. Pharmacol. 2021, 11, 20–29. [Google Scholar] [CrossRef]
- Gu, Z.C.; Huang, S.R.; Dong, L.; Zhou, Q.; Wang, J.; Fu, B.; Chen, J. An Adapted Neural-Fuzzy Inference System Model Using Preprocessed Balance Data to Improve the Predictive Accuracy of Warfarin Maintenance Dosing in Patients After Heart Valve Replacement. Cardiovasc. Drugs Ther. 2021. [Google Scholar] [CrossRef]
- Liu, Y.; Chen, J.; You, Y.; Xu, A.; Li, P.; Wang, Y.; Sun, J.; Yu, Z.; Gao, F.; Zhang, J. An ensemble learning based framework to estimate warfarin maintenance dose with cross-over variables exploration on incomplete data set. Comput. Biol. Med. 2021, 131, 104242. [Google Scholar] [CrossRef] [PubMed]
- Ma, W.; Li, H.; Dong, L.; Zhou, Q.; Fu, B.; Hou, J.-L.; Wang, J.; Qin, W.; Chen, J. Warfarin maintenance dose prediction for Chinese after heart valve replacement by a feedforward neural network with equal stratified sampling. Sci. Rep. 2021, 11, 13778. [Google Scholar] [CrossRef] [PubMed]
- Nguyen, V.L.; Nguyen, H.D.; Cho, Y.S.; Kim, H.S.; Han, I.Y.; Kim, D.K.; Ahn, S. Comparison of multivariate linear regression and a machine learning algorithm developed for prediction of precision warfarin dosing in a Korean population. J. Thromb. Haemost. 2021, 19, 1676–1686. [Google Scholar] [CrossRef] [PubMed]
- Steiner, H.E.; Giles, J.B.; Patterson, H.K.; Feng, J.; El Rouby, N.; Claudio, K.; Marcatto, L.R.; Tavares, L.C.; Galvez, J.M.; Calderon-Ospina, C.-A.; et al. Machine Learning for Prediction of Stable Warfarin Dose in US Latinos and Latin Americans. Front. Pharmacol. 2021, 12, 749786. [Google Scholar] [CrossRef] [PubMed]
- Ioannidis, J.P.A.; Greenland, S.; Hlatky, M.A.; Khoury, M.J.; Macleod, M.R.; Moher, D.; Schulz, K.F.; Tibshirani, R. Increasing value and reducing waste in research design, conduct, and analysis. Lancet 2014, 383, 166–175. [Google Scholar] [CrossRef]
- van der Ploeg, T.; Austin, P.C.; Steyerberg, E.W. Modern modelling techniques are data hungry: A simulation study for predicting dichotomous endpoints. BMC Med. Res. Methodol. 2014, 14, 137. [Google Scholar] [CrossRef] [PubMed]
- Riley, R.D.; Ensor, J.; Snell, K.I.E.; Harrell, F.E., Jr.; Martin, G.P.; Reitsma, J.B.; Moons, K.G.M.; Collins, G.; van Smeden, M. Calculating the sample size required for developing a clinical prediction model. BMJ 2020, 368, m441. [Google Scholar] [CrossRef]
- Sun, G.W.; Shook, T.L.; Kay, G.L. Inappropriate use of bivariable analysis to screen risk factors for use in multivariable analysis. J. Clin. Epidemiol. 1996, 49, 907–916. [Google Scholar] [CrossRef]
- Rosthøj, S.; Keiding, N. Explained variation and predictive accuracy in general parametric statistical models: The role of model misspecification. Lifetime Data Anal. 2004, 10, 461–472. [Google Scholar] [CrossRef]
- Sheiner, L.B.; Beal, S.L. Some suggestions for measuring predictive performance. J. Pharmacokinet. Biopharm. 1981, 9, 503–512. [Google Scholar] [CrossRef]
- Gage, B.F.; Eby, C.; Johnson, J.A.; Deych, E.; Rieder, M.J.; Ridker, P.M.; Milligan, P.E.; Grice, G.; Lenzini, P.; Rettie, A.E.; et al. Use of pharmacogenetic and clinical factors to predict the therapeutic dose of warfarin. Clin. Pharmacol. Ther. 2008, 84, 326–331. [Google Scholar] [CrossRef] [PubMed]
- James, A.H.; Britt, R.P. Prospective comparative study of computer programs used for management of warfarin. J. Clin. Pathol. 1993, 46, 781. [Google Scholar] [CrossRef] [PubMed]
- Ageno, W.; Johnson, J.; Nowacki, B.; Turpie, A. A computer generated induction system for hospitalized patients starting on oral anticoagulant therapy. Thromb. Haemost. 2000, 83, 849–852. [Google Scholar] [PubMed]
- Obermeyer, Z.; Emanuel, E.J. Predicting the Future—Big Data, Machine Learning, and Clinical Medicine. N. Engl. J. Med. 2016, 375, 1216–1219. [Google Scholar] [CrossRef] [PubMed]
- Verhoef, T.I.; Redekop, W.K.; Daly, A.K.; van Schie, R.M.F.; de Boer, A.; Maitland-van der Zee, A.-H. Pharmacogenetic-guided dosing of coumarin anticoagulants: Algorithms for warfarin, acenocoumarol and phenprocoumon. Br. J. Clin. Pharmacol. 2014, 77, 626–641. [Google Scholar] [CrossRef] [PubMed]
- Flaker, G.; Lopes, R.D.; Hylek, E.; Wojdyla, D.M.; Thomas, L.; Al-Khatib, S.M.; Sullivan, R.M.; Hohnloser, S.H.; Garcia, D.; Hanna, M.; et al. Amiodarone, anticoagulation, and clinical events in patients with atrial fibrillation: Insights from the ARISTOTLE trial. J. Am. Coll. Cardiol. 2014, 64, 1541–1550. [Google Scholar] [CrossRef] [PubMed]
- Collins, G.S.; Reitsma, J.B.; Altman, D.G.; Moons, K.G.M. Transparent Reporting of a multivariable prediction model for Individual Prognosis Or Diagnosis (TRIPOD): The TRIPOD Statement. Br. J. Surg. 2015, 102, 148–158. [Google Scholar] [CrossRef]


| Study | Year | Study Type | Participants | Predictors | Model Development | Model Evaluation | ||||||
|---|---|---|---|---|---|---|---|---|---|---|---|---|
| Source | Patients | Indication | Target INR * | Features | Features Selection | Missing Data Handling | Model Type | Machine Learning Algorithms # | Performance Measures | |||
| Solomon [22] | 2004 | Retrospective | Israel | 148 | NA | NA | clinical | Univariate analysis | NA | Development | NNM | r |
| Cosgun [23] | 2011 | Retrospective | USA | 290 | NA | 2.0–3.0 | clinical + genetic | Univariate analysis | single imputation | Development | DT, SV, Ensemble learning | R2 |
| Hu [24] | 2012 | Retrospective | China | 587 | NA | 1.0–3.0 | clinical | Expert opinion and literature review | NA | Development | DT, SV, KNN, Ensemble learning | MAE |
| Grossi [25] | 2014 | Retrospective | Italy | 377 | PE, DVT, AF, AHV, CM, Stroke, Others | 2.0–4.0 | clinical + genetic | Machine learning algorithm (TWIST system) | NA | Development | NNM | R2, MAE, ideal dose |
| Saleh [26] | 2014 | Retrospective | IWPC sites | 4271 | PE, DVT, AF, AHV, CM, Stroke, Others | 2.0–3.0 | clinical + genetic | Backward Variable Selection | Excluded | Development | NNM | R2, MAE, ideal dose |
| Zhou [27] | 2014 | Retrospective | China | 1093 | HVR | 1.5–2.5 | clinical | Univariate analysis, Stepwise regression | NA | Development | NNM | MAE, ideal dose |
| Li [28] | 2015 | Retrospective | China; IWPC sites | 1511 | HVR | 1.7–3.0; 2.0–3.0 | clinical + genetic | Stepwise regression | Excluded | External validation | DT, SV, NNM, Ensemble learning, Other | MAE, ideal dose |
| Liu [29] | 2015 | Retrospective | IWPC sites | 4797 | PE, DVT, AF, AHV, CM, Stroke, Others | 2.0–3.0 | clinical + genetic | Stepwise regression | Excluded | Development | DT, SV, NNM, Ensemble learning, Other | MAE, ideal dose |
| Alzubiedi [30] | 2016 | Retrospective | IWPC sites | 163 | PE, DVT, AF, Stroke, Others | 2.0–3.0 | clinical + genetic | Backward Variable Selection | NA | Development | NNM | R2, MAE, ideal dose |
| Pavani [31] | 2016 | NR | India | 240 | PE, AF, HVR | No limitation | clinical + genetic | NA | NA | Development | NNM | R2, MAE |
| Li [32] | 2018 | Retrospective | China | 15,694 | HVR | 1.5–2.5 | clinical | Covariance analysis, expert opinion, and literature review | NA | Development with external validation (same data) | NNM | MAE, RMSE, ideal dose |
| Ma [33] | 2018 | Retrospective | IWPC sites | 5743 | PE, DVT, AF, AHV, CM, Stroke, Others | 1.7–3.3 | clinical + genetic | Expert opinion and literature review | single imputation | Development | SV, NNM, Ensemble learning, KNN | MAE, ideal dose |
| Tao [34] | 2018 | Retrospective | China | 13,639 | HVR | 1.5–2.5 | clinical | Univariate analysis | NA | Development with external validation (same data) | NNM | MAE, MSE, ideal dose |
| Li [35] | 2019 | Retrospective | China | 13,639 | HVR | 1.5–2.5 | clinical | Univariate analysis | NA | Development with external validation (same data) | NNM | MAE, MSE, RMSE, ideal dose |
| Tao [36] | 2019 | Retrospective | China | 289 | NR | 2.0–3.0 | clinical + genetic | NA | NA | Development | NNM, SV, GP, Ensemble learning | R2, MAE, MSE, ideal dose |
| Tao [37] | 2019 | Retrospective | China; IWPC sites | 617 | PE, DVT, AF, VR, ICT, EVE, stroke | 2.0–3.0; 2.0–2.5 | clinical + genetic | Expert opinion and literature review | NA | Development | DT, SV, Ensemble learning | R2, MAE, MSE, ideal dose |
| Roche-Lima [38] | 2020 | Retrospective | USA | 190 | PE, DVT, AF, VR, DM2, CHF, Stroke, Others | 2.0–3.0 | clinical + genetic | NA | Excluded | Development | DT, SV, NNM, KNN, Ensemble learning, Other | MAE, ideal dose |
| Asiimwe [39] | 2021 | Retrospective | Uganda, South Africa | 634 | AF, VT, VHT | 2.5–3.5; 2.0–3.0 | clinical | Expert opinion and literature review | multivariate imputation | Development with external validation (another data) | DT, SV, KNN, NNM, Ensemble learning, Other | MAE, MAPE, ideal dose |
| Gu [40] | 2021 | Retrospective | China | 15,108 | HVR | 1.5–2.5 | clinical | Univariate analysis | Excluded | Development with external validation (same data) | NNM | MAE, MSE, ideal dose |
| Liu [41] | 2021 | Retrospective | China | 377 | PE, DVT, AF, HF, PAH, Stroke | 1.5–3.0 | clinical + genetic | Univariate analysis | Not imputed | Development | Ensemble learning | R2, MAE, MSE, RMSE, ideal dose |
| Ma [42] | 2021 | Retrospective | China | 19,060 | HVR | 1.5–2.5 | clinical | Univariate analysis | NA | Development with external validation (same data) | NNM | MAE, MSE, ideal dose |
| Nguyen [43] | 2021 | Retrospective | Korean | 650 | PE, DVT, HVR, VHD, Stroke, Arrhythmia, others | 1.5–3.0 | clinical + genetic | Recursive feature elimination | Single imputation | Development | Ensemble learning | r, MAE, RMSE, ideal dose |
| Steiner [44] | 2021 | Retrospective | IWPC sites, North and South America | 7030 | PE, DVT, TIA, Others | 2.0–3.0; No limitation | clinical + genetic | NA | multivariate imputation | Development | DT, SV, Other | MAE, ideal dose |
| Studies | NO. Models | Models | NO. Patients | NO. Features | MAE (mg/Week) |
|---|---|---|---|---|---|
| Development | |||||
| Solomon 2004 | 1 | NNM | 148 | 3 | NR |
| Cosgun 2011 | 3 | DT, SV, Ensemble learning | 290 | 11 | NR |
| Hu 2012 | 9 | DT, SV, KNN, Ensemble learning | 587 | 7 | (1.47, 1.55) |
| Grossi 2014 | 1 | NNM | 377 | 14 | 5.72 |
| Saleh 2014 | 1 | NNM | 4271 | 9 | 9 |
| Zhou 2014 | 1 | NNM | 1093 | 11 | 0.08 * |
| Liu 2015 | 7 | DT, SV, NNM, Ensemble learning, Other | 4797 | 9 | (8.84, 9.82) |
| Alzubiedi 2016 | 1 | NNM | 163 | 7 | 11.2 |
| Pavani 2016 | 1 | NNM | 240 | 9 | −1.97 * |
| Ma 2018 | 8 | SV, NNM, KNN, Ensemble learning | 5743 | 13 | (8.31, 10.86) |
| Tao 2019 | 6 | NNM, SV, GP, Ensemble learning | 289 | 7 | NR |
| Tao 2019 | 4 | DT, SV, Ensemble learning | 617 | 11 | (4.73,5.36) |
| Roche-Lima 2020 | 9 | DT, SV, NNM, KNN, Ensemble learning, Other | 190 | 24 | (4.73, 9.87) |
| Liu 2021 | 3 | Ensemble learning | 377 | 11 | (2.98, 4.54) |
| Nguyen 2021 | 1 | Ensemble learning | 650 | 17 | 4.48 |
| Steiner 2021 | 3 | DT, SV, Other | 7030 | 13 | (8.11, 8.18) |
| Development with external validation (same data) | |||||
| Li 2018 IV | 1 | NNM | 15,694 | 12 | 2.59 |
| Li 2018 EV | 1 | NNM | 15,694 | 12 | 2.68 |
| Tao 2018 IV | 1 | NNM | 13,639 | 9 | 4.07 |
| Tao 2018 EV | 1 | NNM | 13,639 | 9 | 4.22 |
| Li 2019 IV | 1 | NNM | 13,639 | 10 | 4.82 |
| Li 2019 EV | 1 | NNM | 13,639 | 10 | 5.18 |
| Gu 2021 IV | 1 | NNM | 15,108 | 8 | 2.58 |
| Gu 2021 EV | 1 | NNM | 15,108 | 8 | 2.59 |
| Ma 2021 IV | 2 | NNM | 19,060 | 8 | (2.28, 3.04) |
| Ma 2021 EV | 2 | NNM | 19,060 | 8 | (2.42, 2.88) |
| Development with external validation (another data) | |||||
| Asiimwe 2021 | 13 | DT, SV, KNN, NNM, Ensemble learning, Other | 270 | 7 | (12.07, 17.59) |
| External validation | |||||
| Li 2015 | 6 | DT, SV, NNM, Ensemble learning, Other | 1295 | 10 | (4.41, 4.76) |
| Li 2015 | 6 | DT, SV, NNM, Ensemble learning, Other | 216 | 10 | (4.40, 4.84) |
| Signaling Question No. | Signaling Question | Included Studies (n = 23) | ||
|---|---|---|---|---|
| Yes or Probably Yes | No or Probably No | No Information | ||
| Participant domain | number (percentage, 95% confidence interval) | |||
| 1.1 | Were appropriate data sources used, e.g., cohort, RCT, or nested case–control study data? | 23 (100, 100 to 100) | 0 | 0 |
| 1.2 | Were all inclusions and exclusions of participants appropriate? | 13 (57, 36 to 77) | 8 (35, 15 to 54) | 2 (8, 3 to 20) |
| Predictor domain | ||||
| 2.1 | Were predictors defined and assessed in a similar way for all participants? | 23 (100, 100 to 100) | 0 | 0 |
| 2.2 | Were predictor assessments made without knowledge of outcome data? | 22 (96, 87 to 100) | 1 (4, 4 to 13) | 0 |
| 2.3 | Are all predictors available at the time the model is intended to be used? | 22 (96, 87 to 100) | 1 (4, 4 to 13) | 0 |
| Outcome domain | ||||
| 3.1 | Was the outcome determined appropriately? | 16 (70, 51 to 89) | 7 (30, 12 to 49) | 0 |
| 3.3 | Were predictors excluded from the outcome definition? | 22 (96, 87 to 100) | 1 (4, 4 to 13) | 0 |
| 3.4 | Was the outcome defined and determined in a similar way for all participants? | 21 (91, 80 to 100) | 0 | 2 (9, 3 to 20) |
| 3.5 | Was the outcome determined without knowledge of predictor information? | 22 (96, 87 to 100) | 1 (4, 4 to 13) | 0 |
| 3.6 | Was the time interval between predictor assessment and outcome determination? | 23 (100, 100 to 100) | 0 | 0 |
| Analysis domain | ||||
| 4.1 | Were there a reasonable number of participants with the outcome? | 8 (35, 15 to 54) | 12 (52, 32 to 73) | 3 (13, 1 to 27) |
| 4.3 | Were all enrolled participants included in the analysis? | 23 (100, 100 to 100) | 0 | 0 |
| 4.4 | Were participants with missing data handled appropriately? | 3 (13, 1 to 27) | 20 (87, 73 to 100) | 0 |
| 4.5 | Was selection of predictors based on univariable analysis avoided? | 11 (48, 27 to 68) | 8 (35, 15 to 54) | 4 (17, 2 to 33) |
| 4.7 | Were relevant model performance measures evaluated appropriately? | 21 (91, 80 to 100) | 2 (9, 3 to 20) | 0 |
| 4.8 | Were model overfitting and optimism in model performance accounted for? | 19 (90, 78 to 100) | 2 (10, 3 to 22) | 0 |
Publisher’s Note: MDPI stays neutral with regard to jurisdictional claims in published maps and institutional affiliations. |
© 2022 by the authors. Licensee MDPI, Basel, Switzerland. This article is an open access article distributed under the terms and conditions of the Creative Commons Attribution (CC BY) license (https://creativecommons.org/licenses/by/4.0/).
Share and Cite
Zhang, F.; Liu, Y.; Ma, W.; Zhao, S.; Chen, J.; Gu, Z. Nonlinear Machine Learning in Warfarin Dose Prediction: Insights from Contemporary Modelling Studies. J. Pers. Med. 2022, 12, 717. https://doi.org/10.3390/jpm12050717
Zhang F, Liu Y, Ma W, Zhao S, Chen J, Gu Z. Nonlinear Machine Learning in Warfarin Dose Prediction: Insights from Contemporary Modelling Studies. Journal of Personalized Medicine. 2022; 12(5):717. https://doi.org/10.3390/jpm12050717
Chicago/Turabian StyleZhang, Fengying, Yan Liu, Weijie Ma, Shengming Zhao, Jin Chen, and Zhichun Gu. 2022. "Nonlinear Machine Learning in Warfarin Dose Prediction: Insights from Contemporary Modelling Studies" Journal of Personalized Medicine 12, no. 5: 717. https://doi.org/10.3390/jpm12050717
APA StyleZhang, F., Liu, Y., Ma, W., Zhao, S., Chen, J., & Gu, Z. (2022). Nonlinear Machine Learning in Warfarin Dose Prediction: Insights from Contemporary Modelling Studies. Journal of Personalized Medicine, 12(5), 717. https://doi.org/10.3390/jpm12050717