
Causal Effect of the Tokyo 2020 Olympic and Paralympic Games on the Number of COVID-19 Cases under COVID-19 Pandemic: An Ecological Study Using the Synthetic Control Method


Abstract
:1. Introduction
2. Materials and Methods
2.1. Situation in Japan before the Tokyo 2020 Games
2.2. Situation during the Tokyo 2020 Games
2.3. Study Period
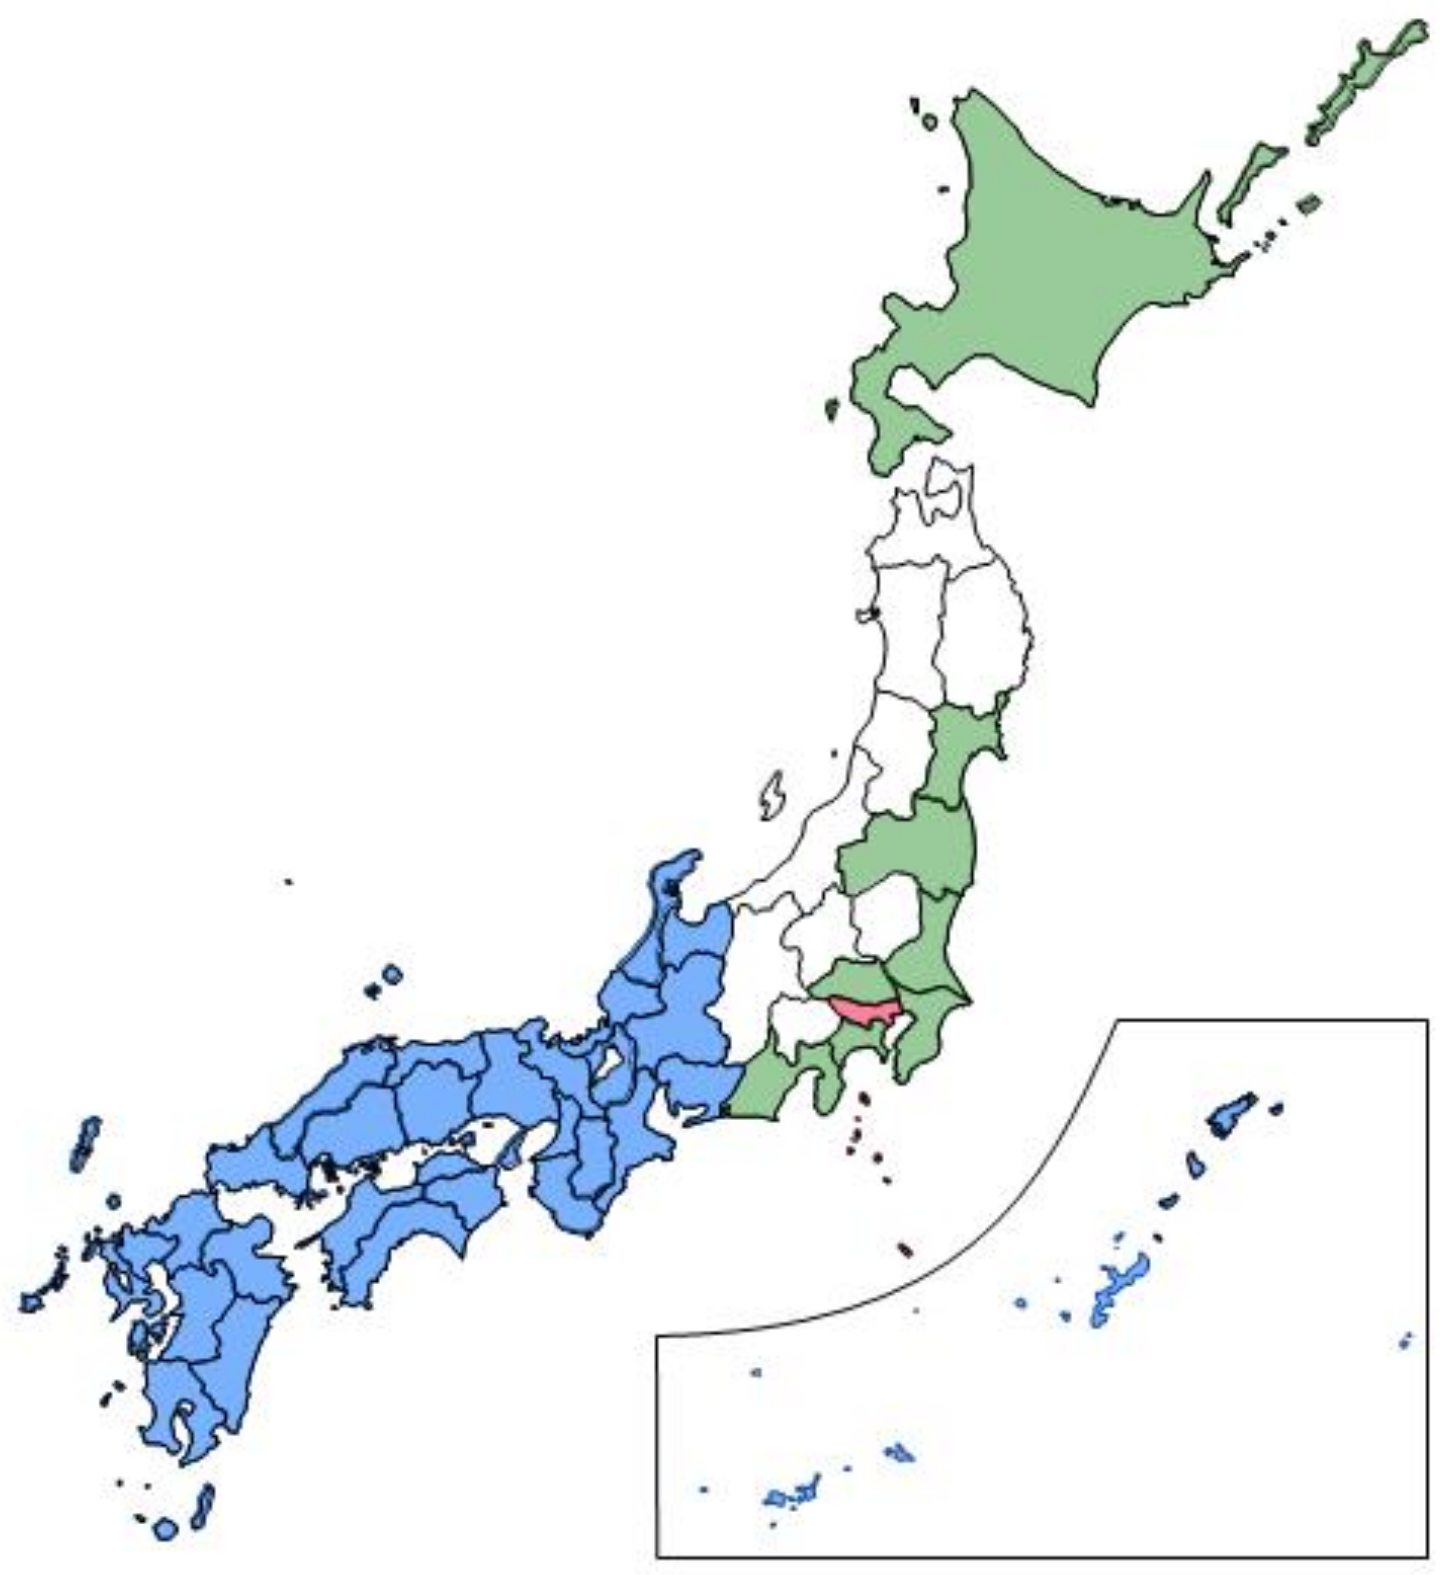
2.4. The Donor Pool
2.5. Outcomes
2.6. Variables
2.7. Statistical Analysis
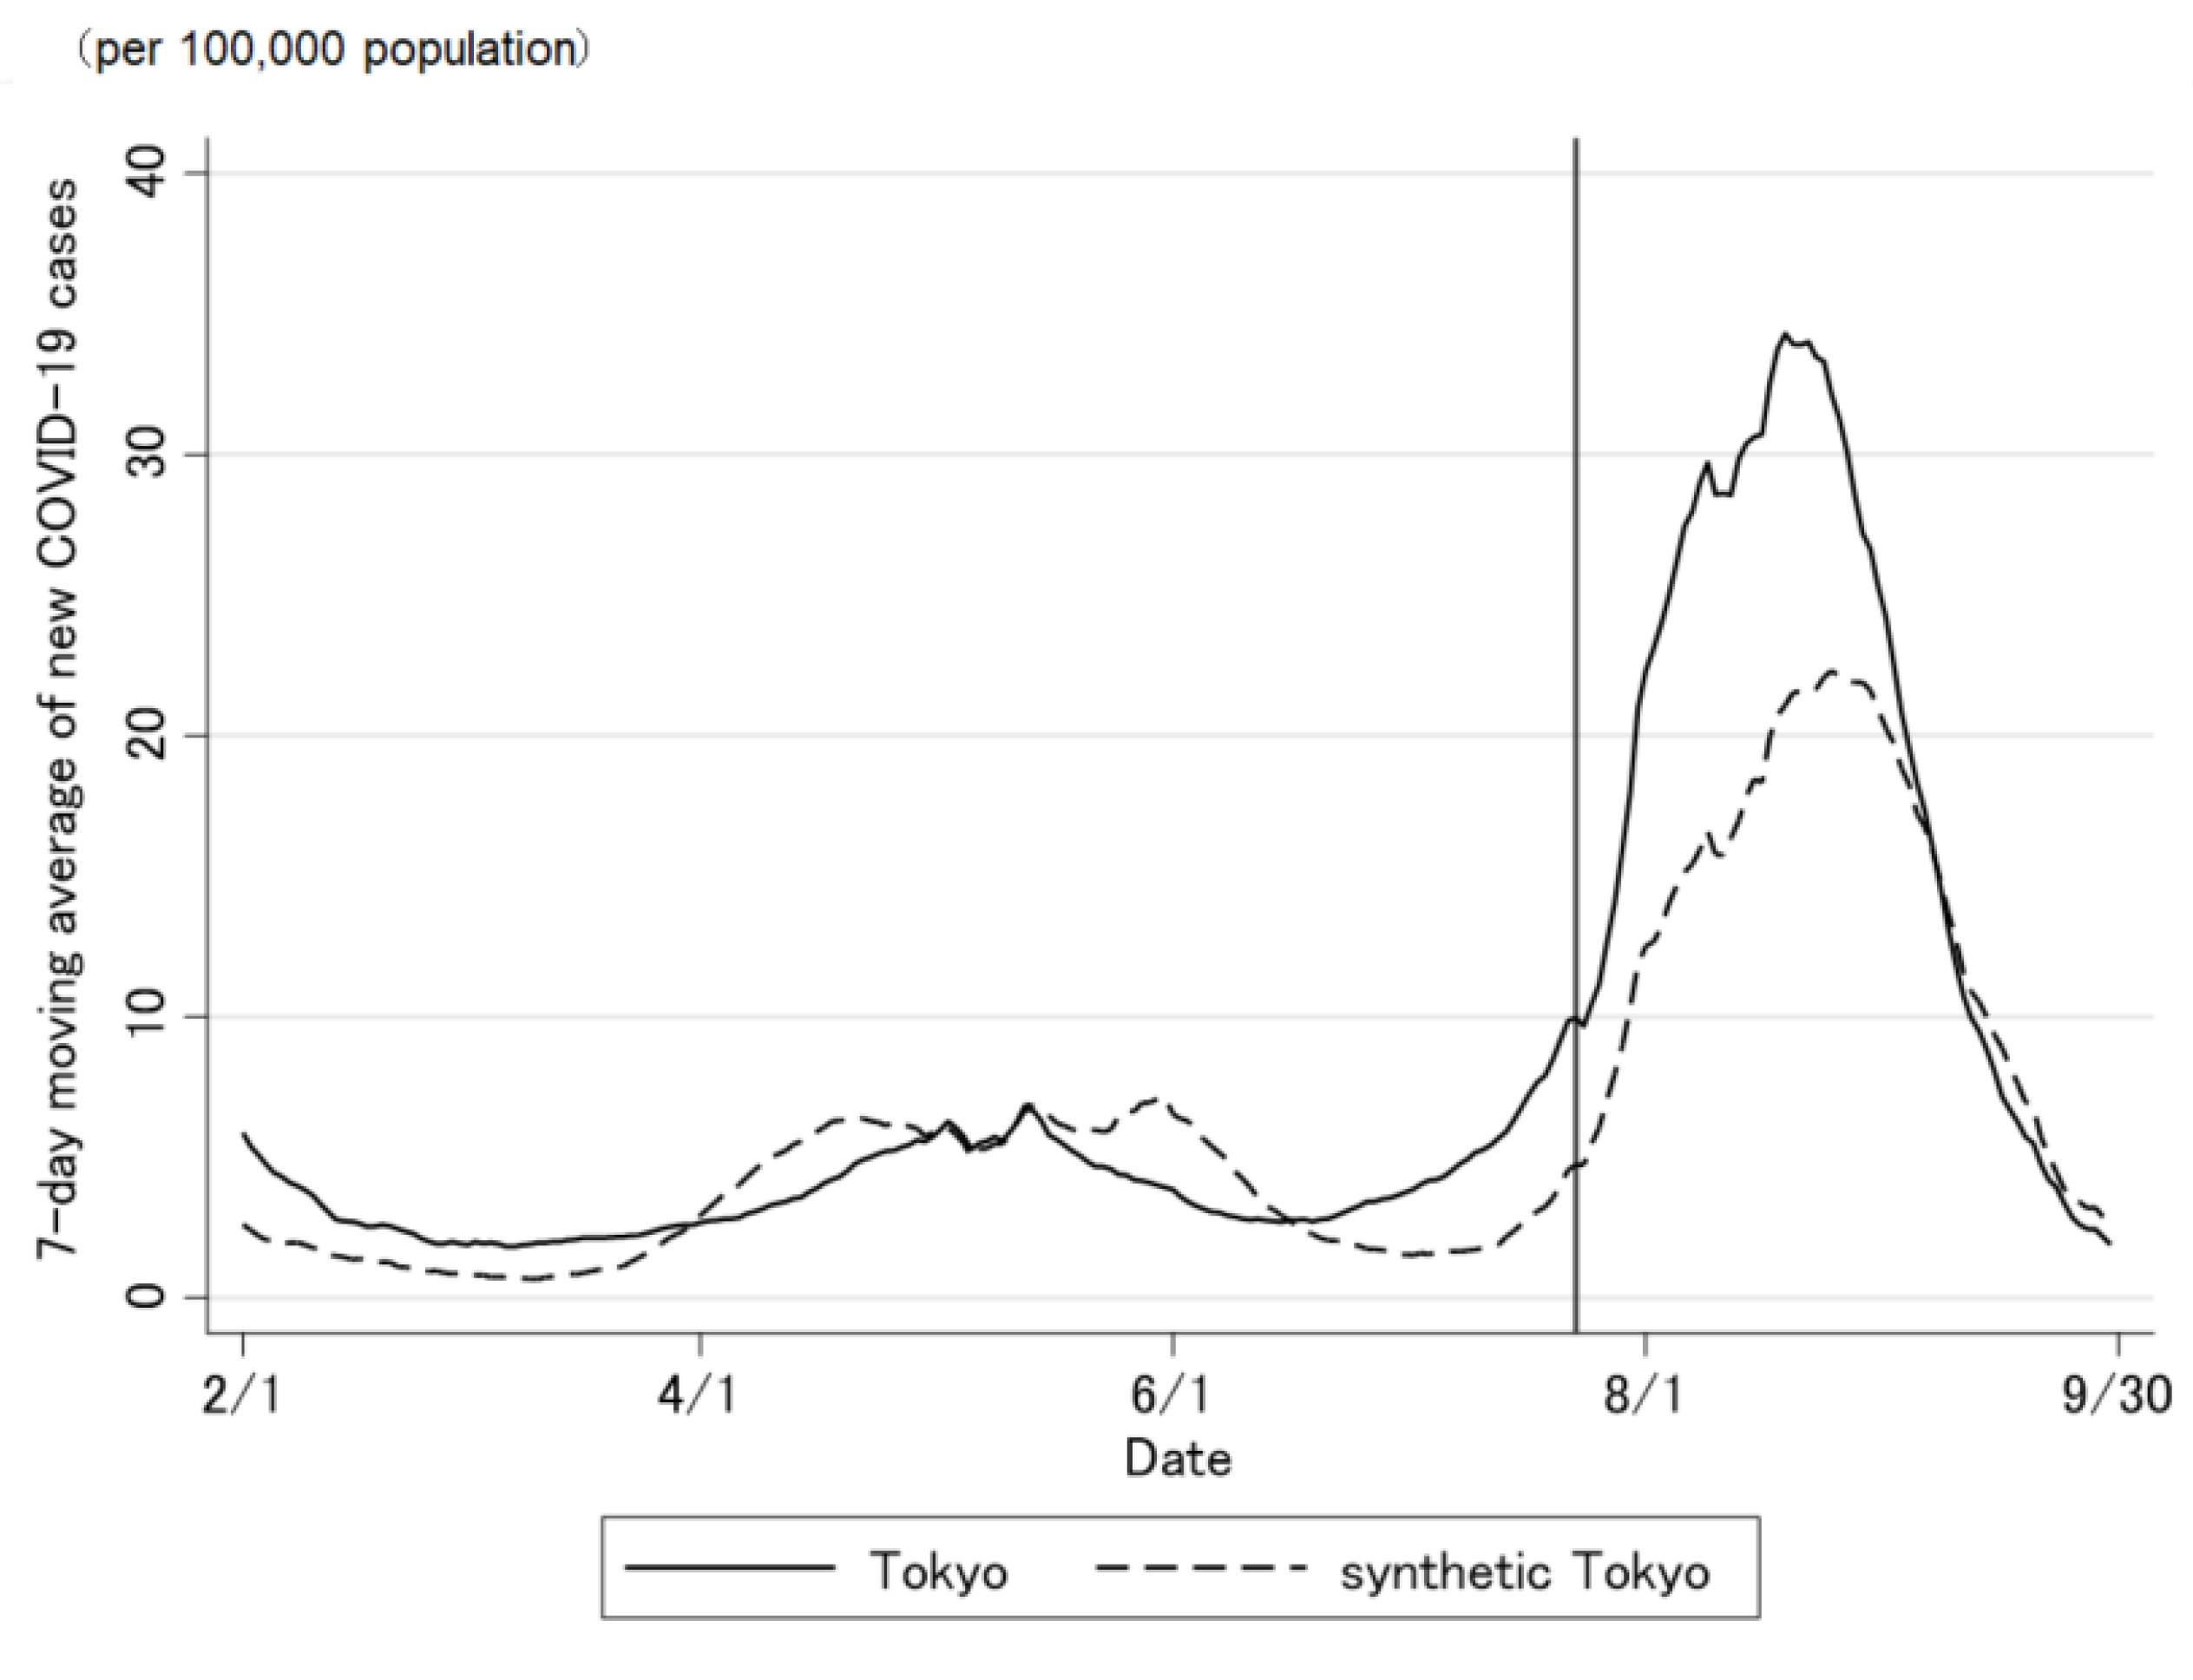
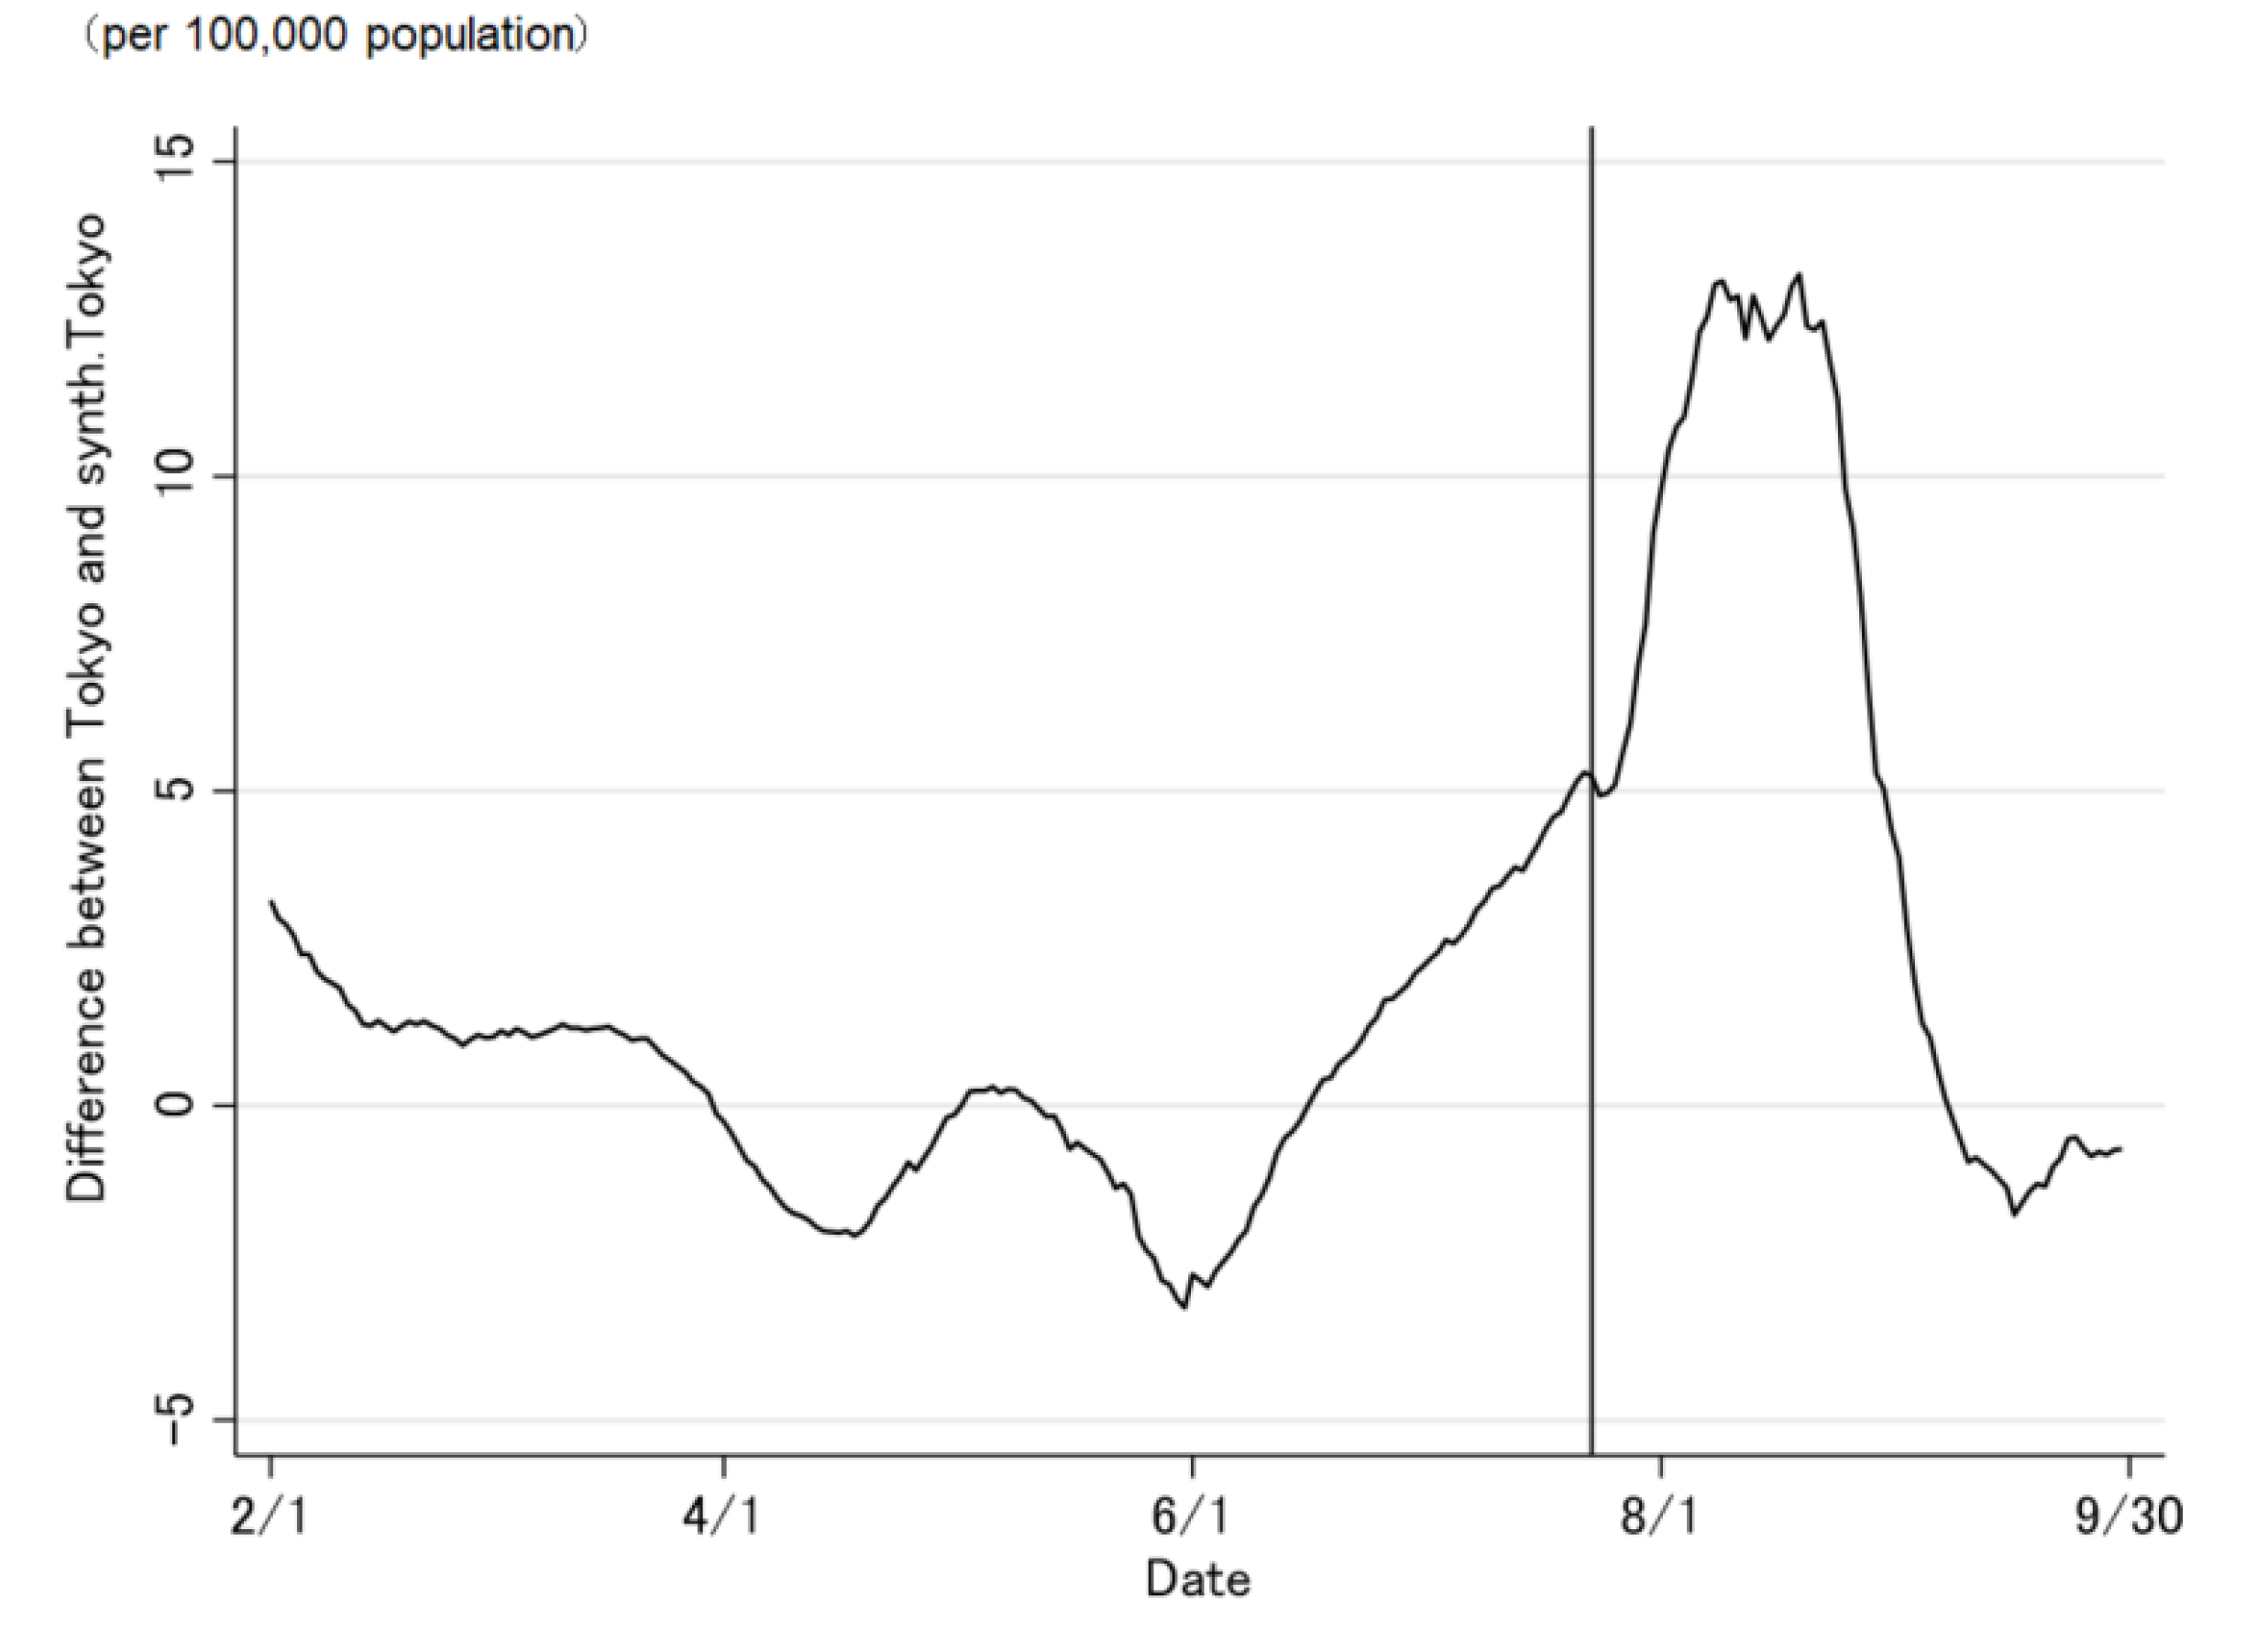
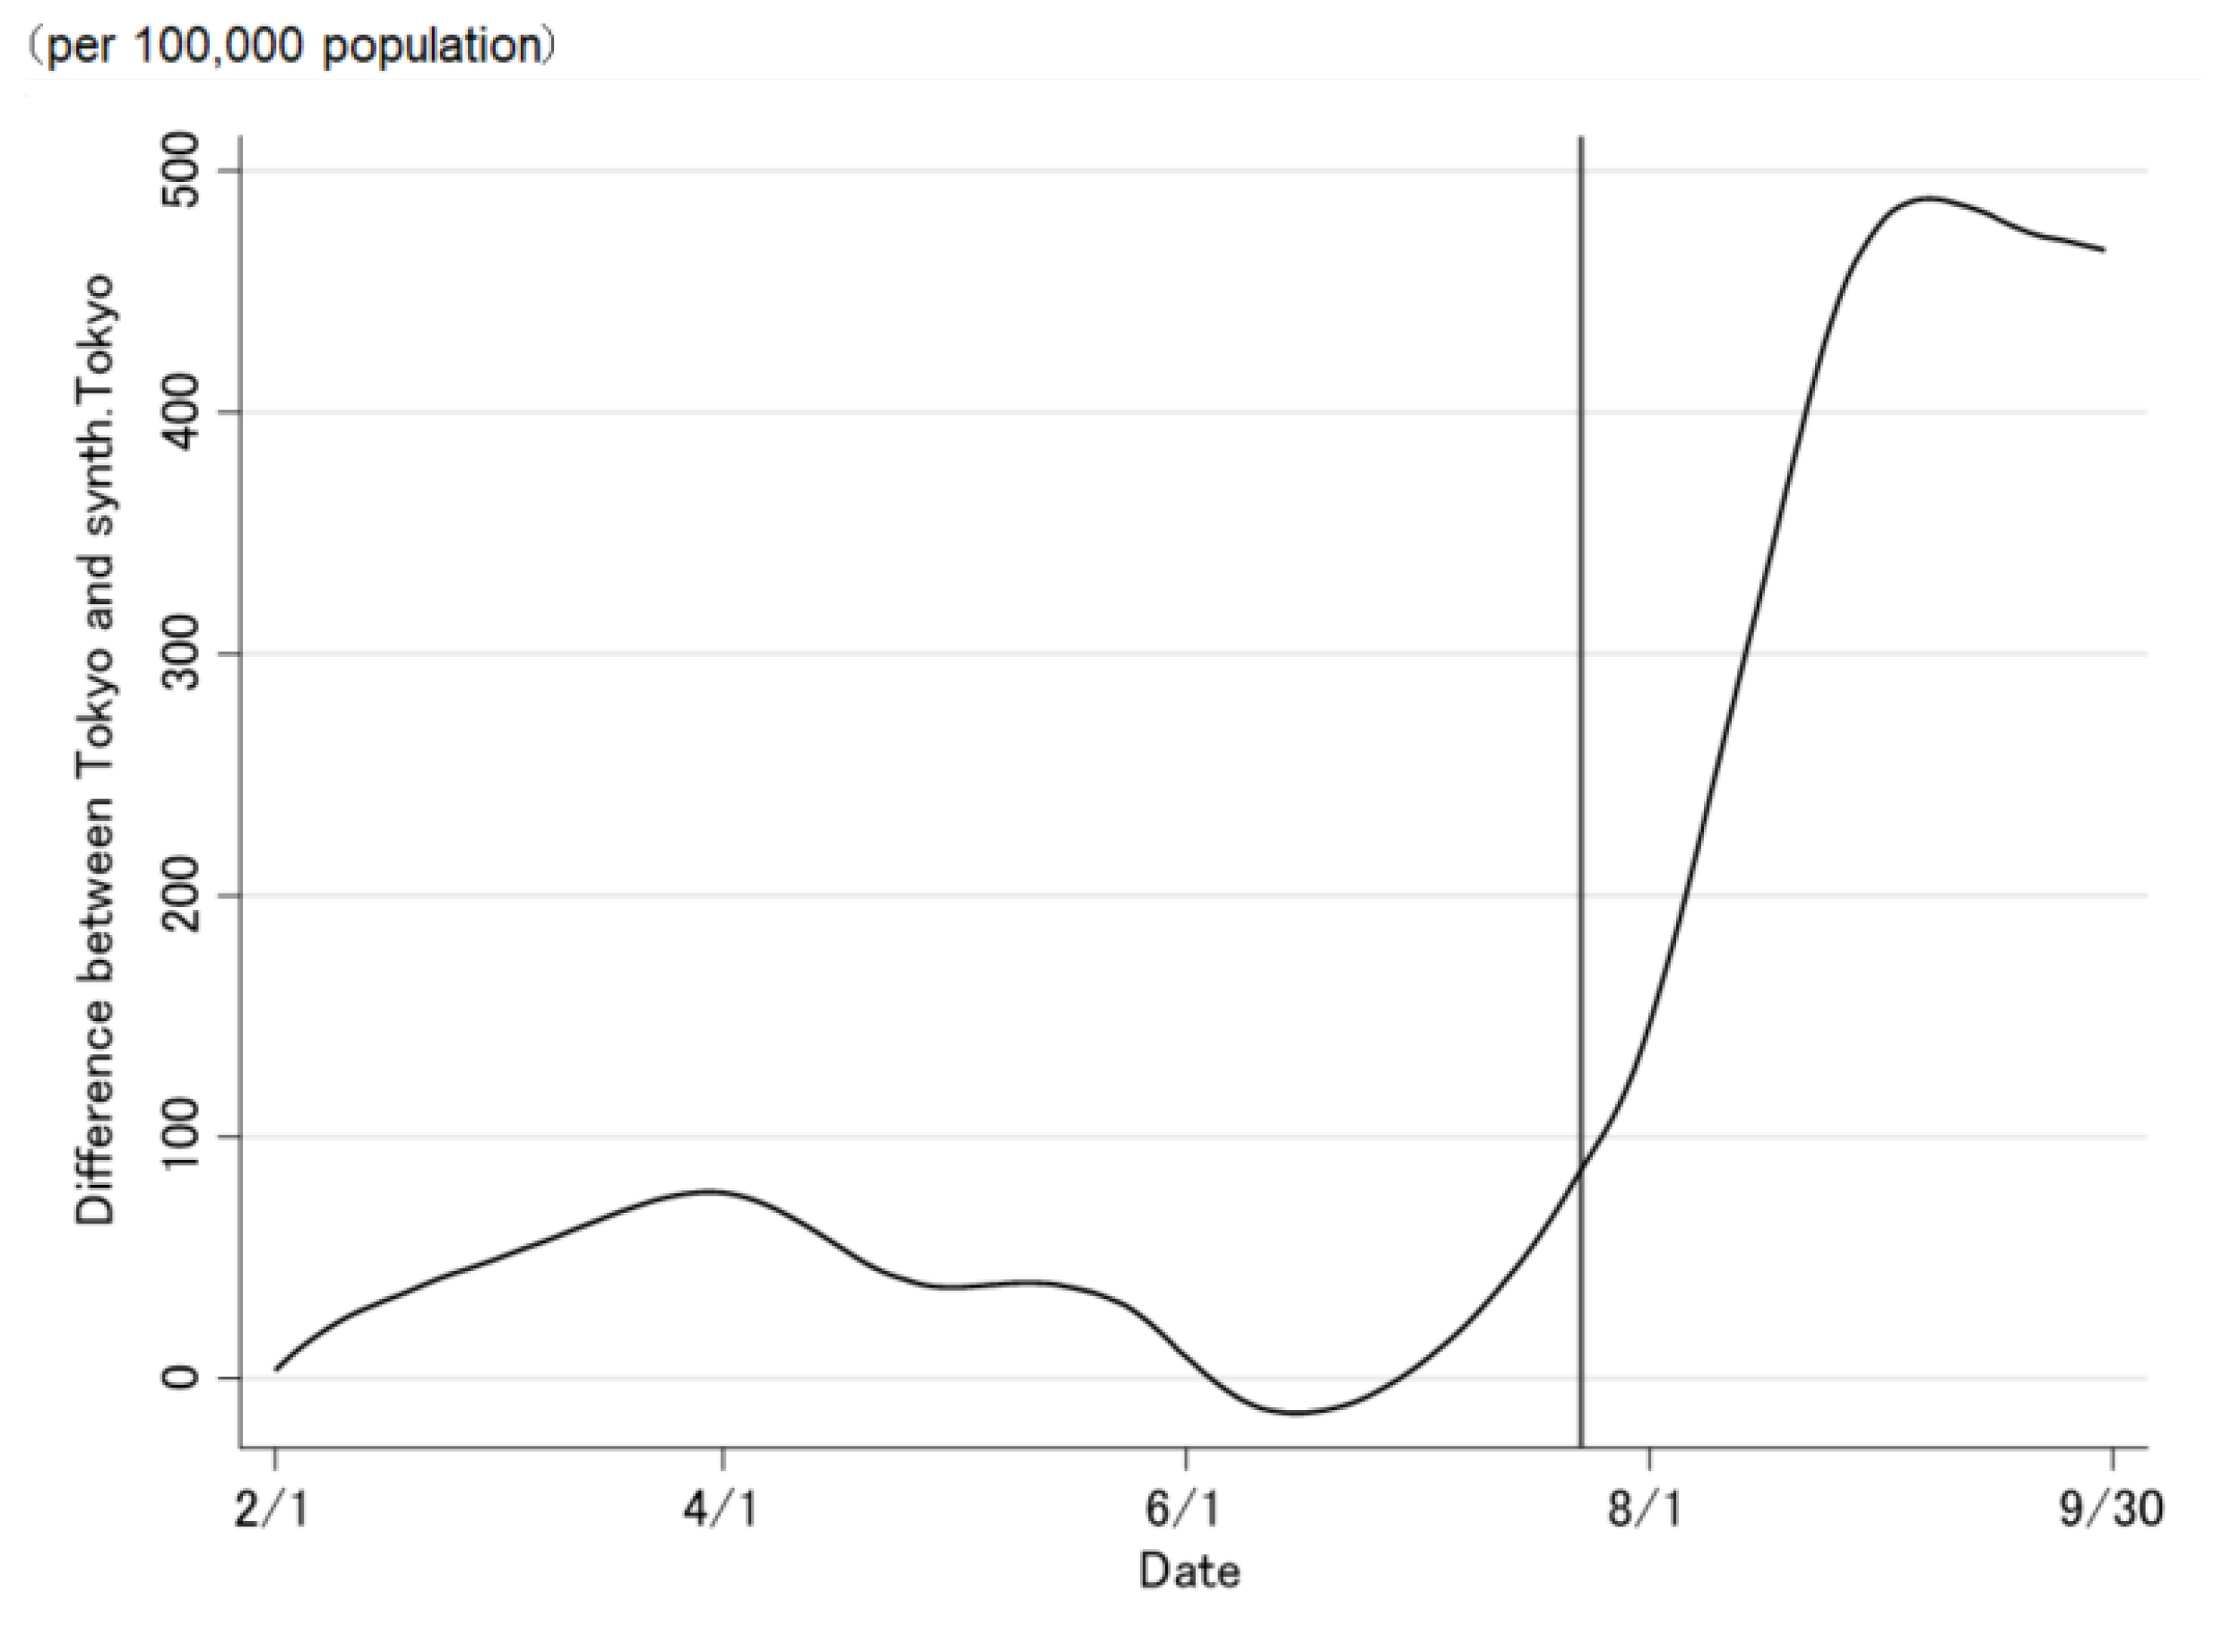
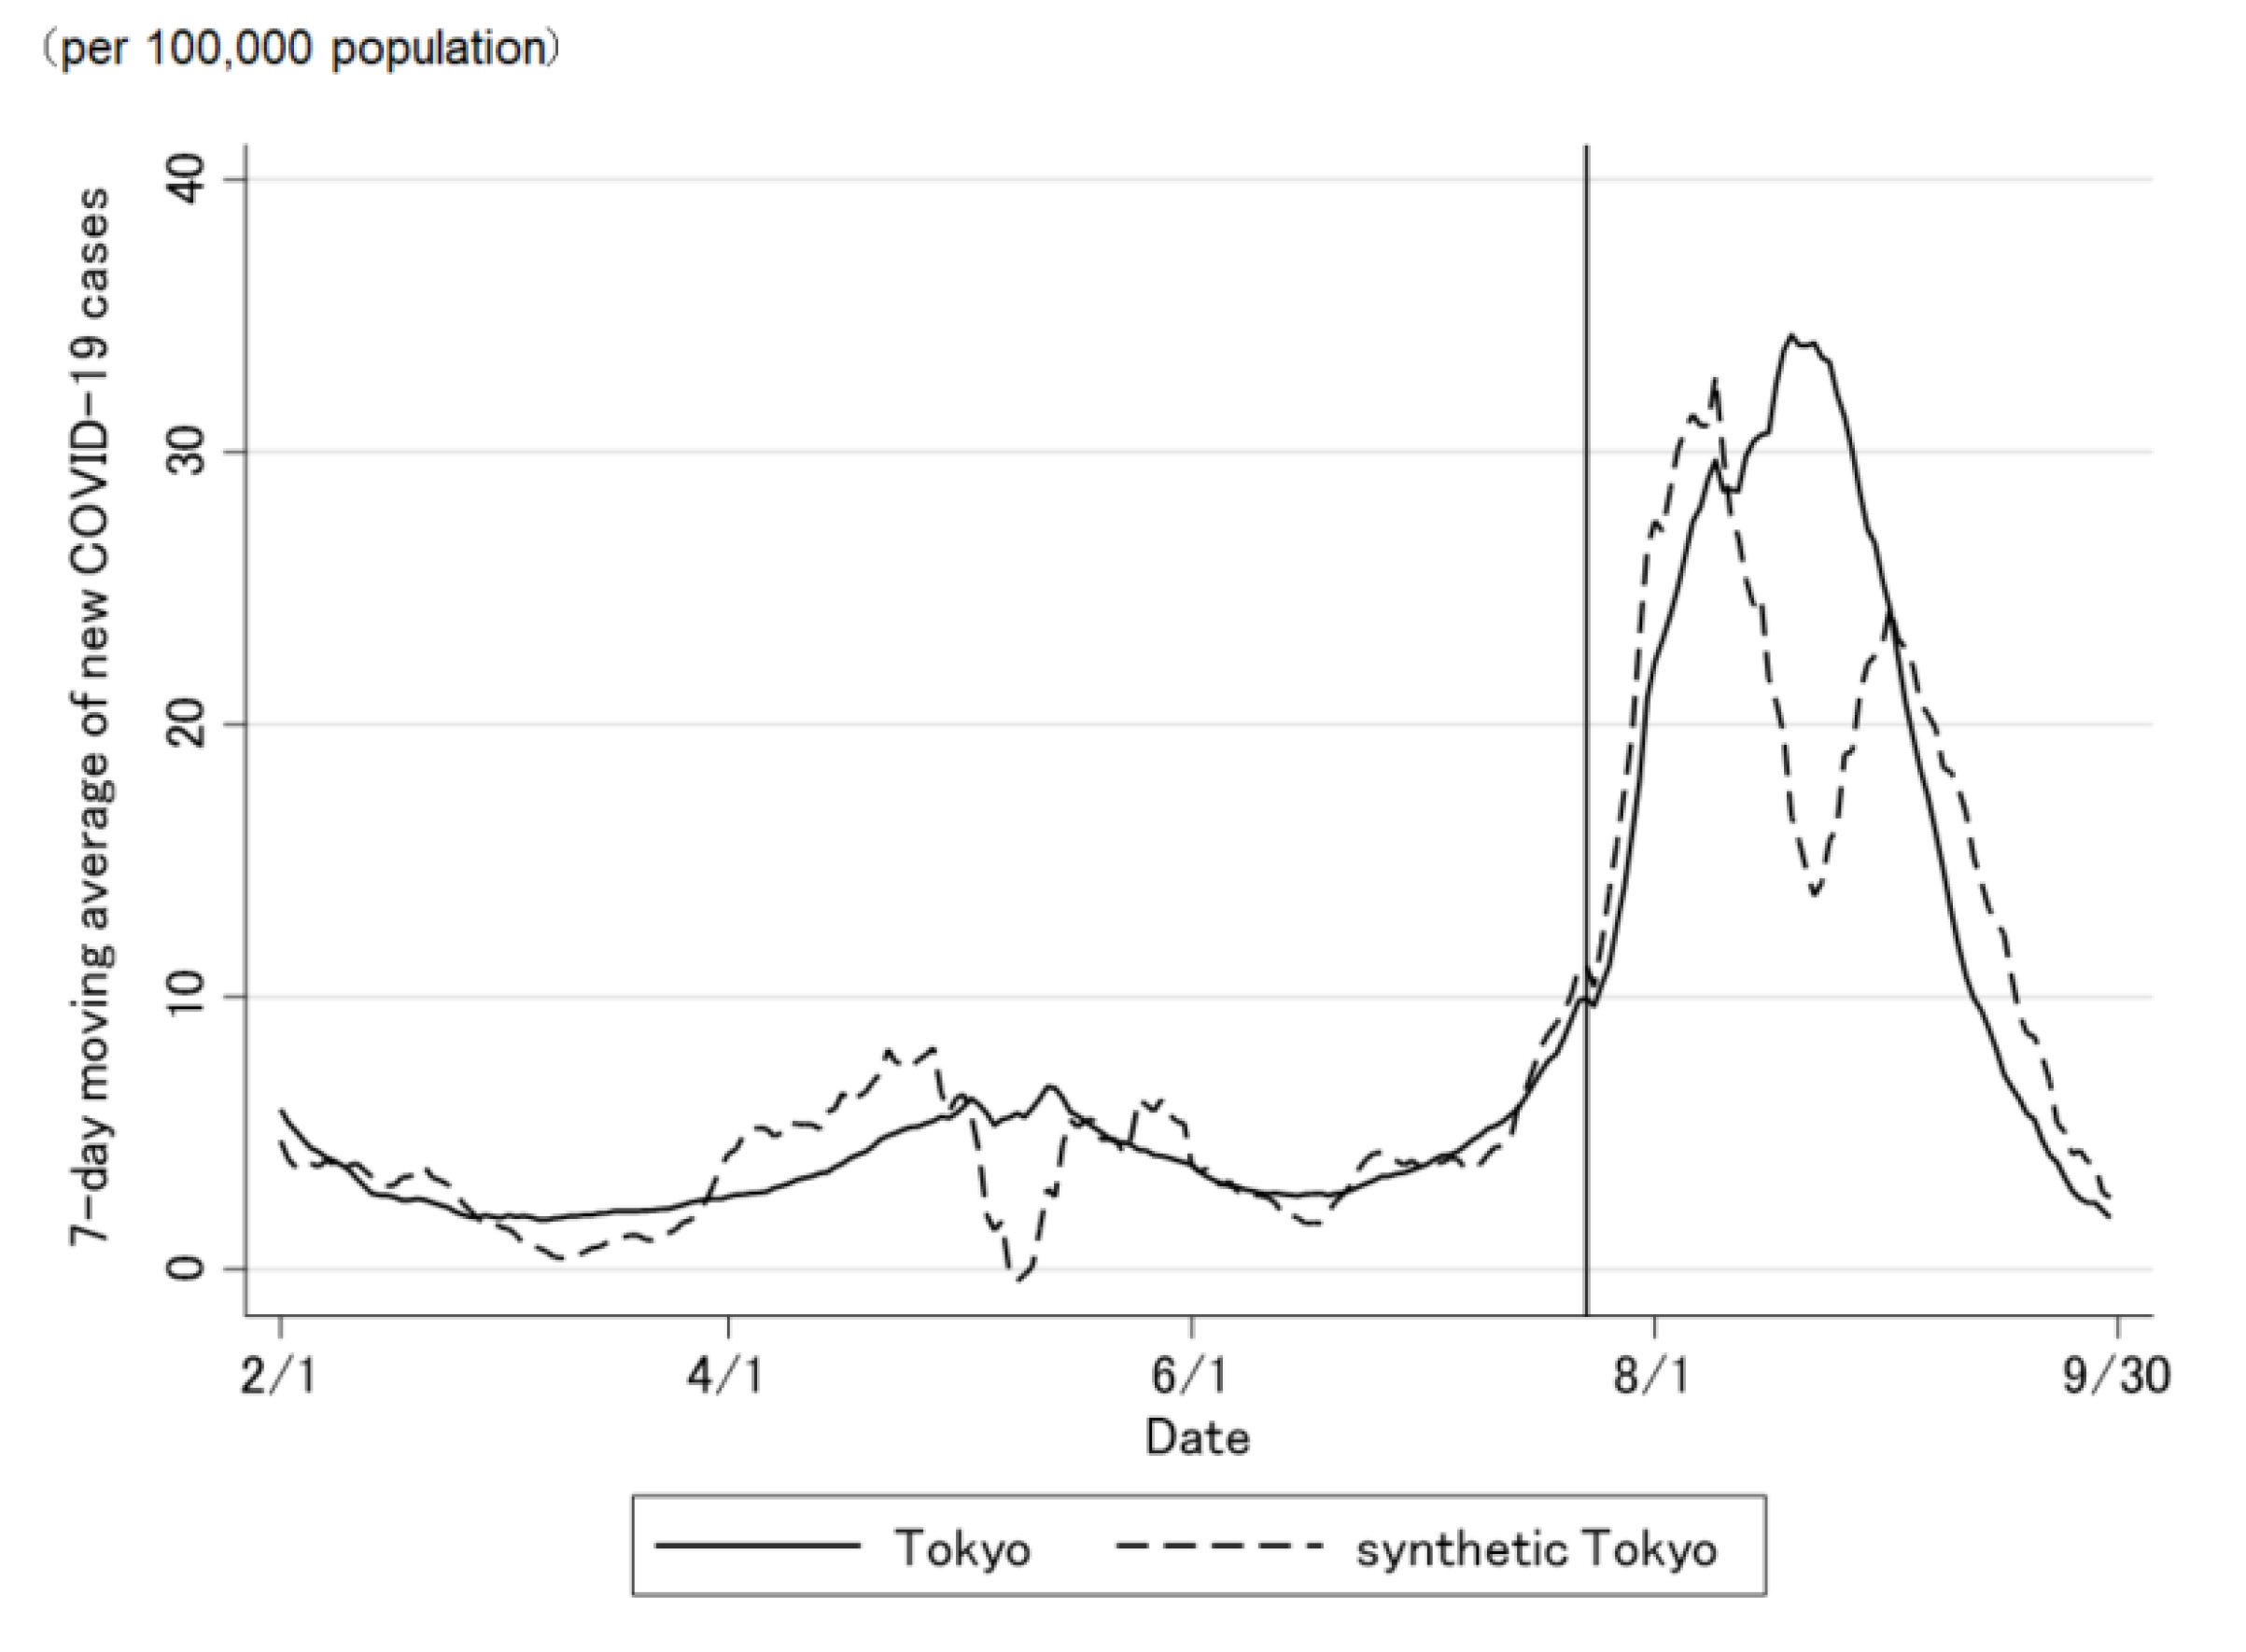
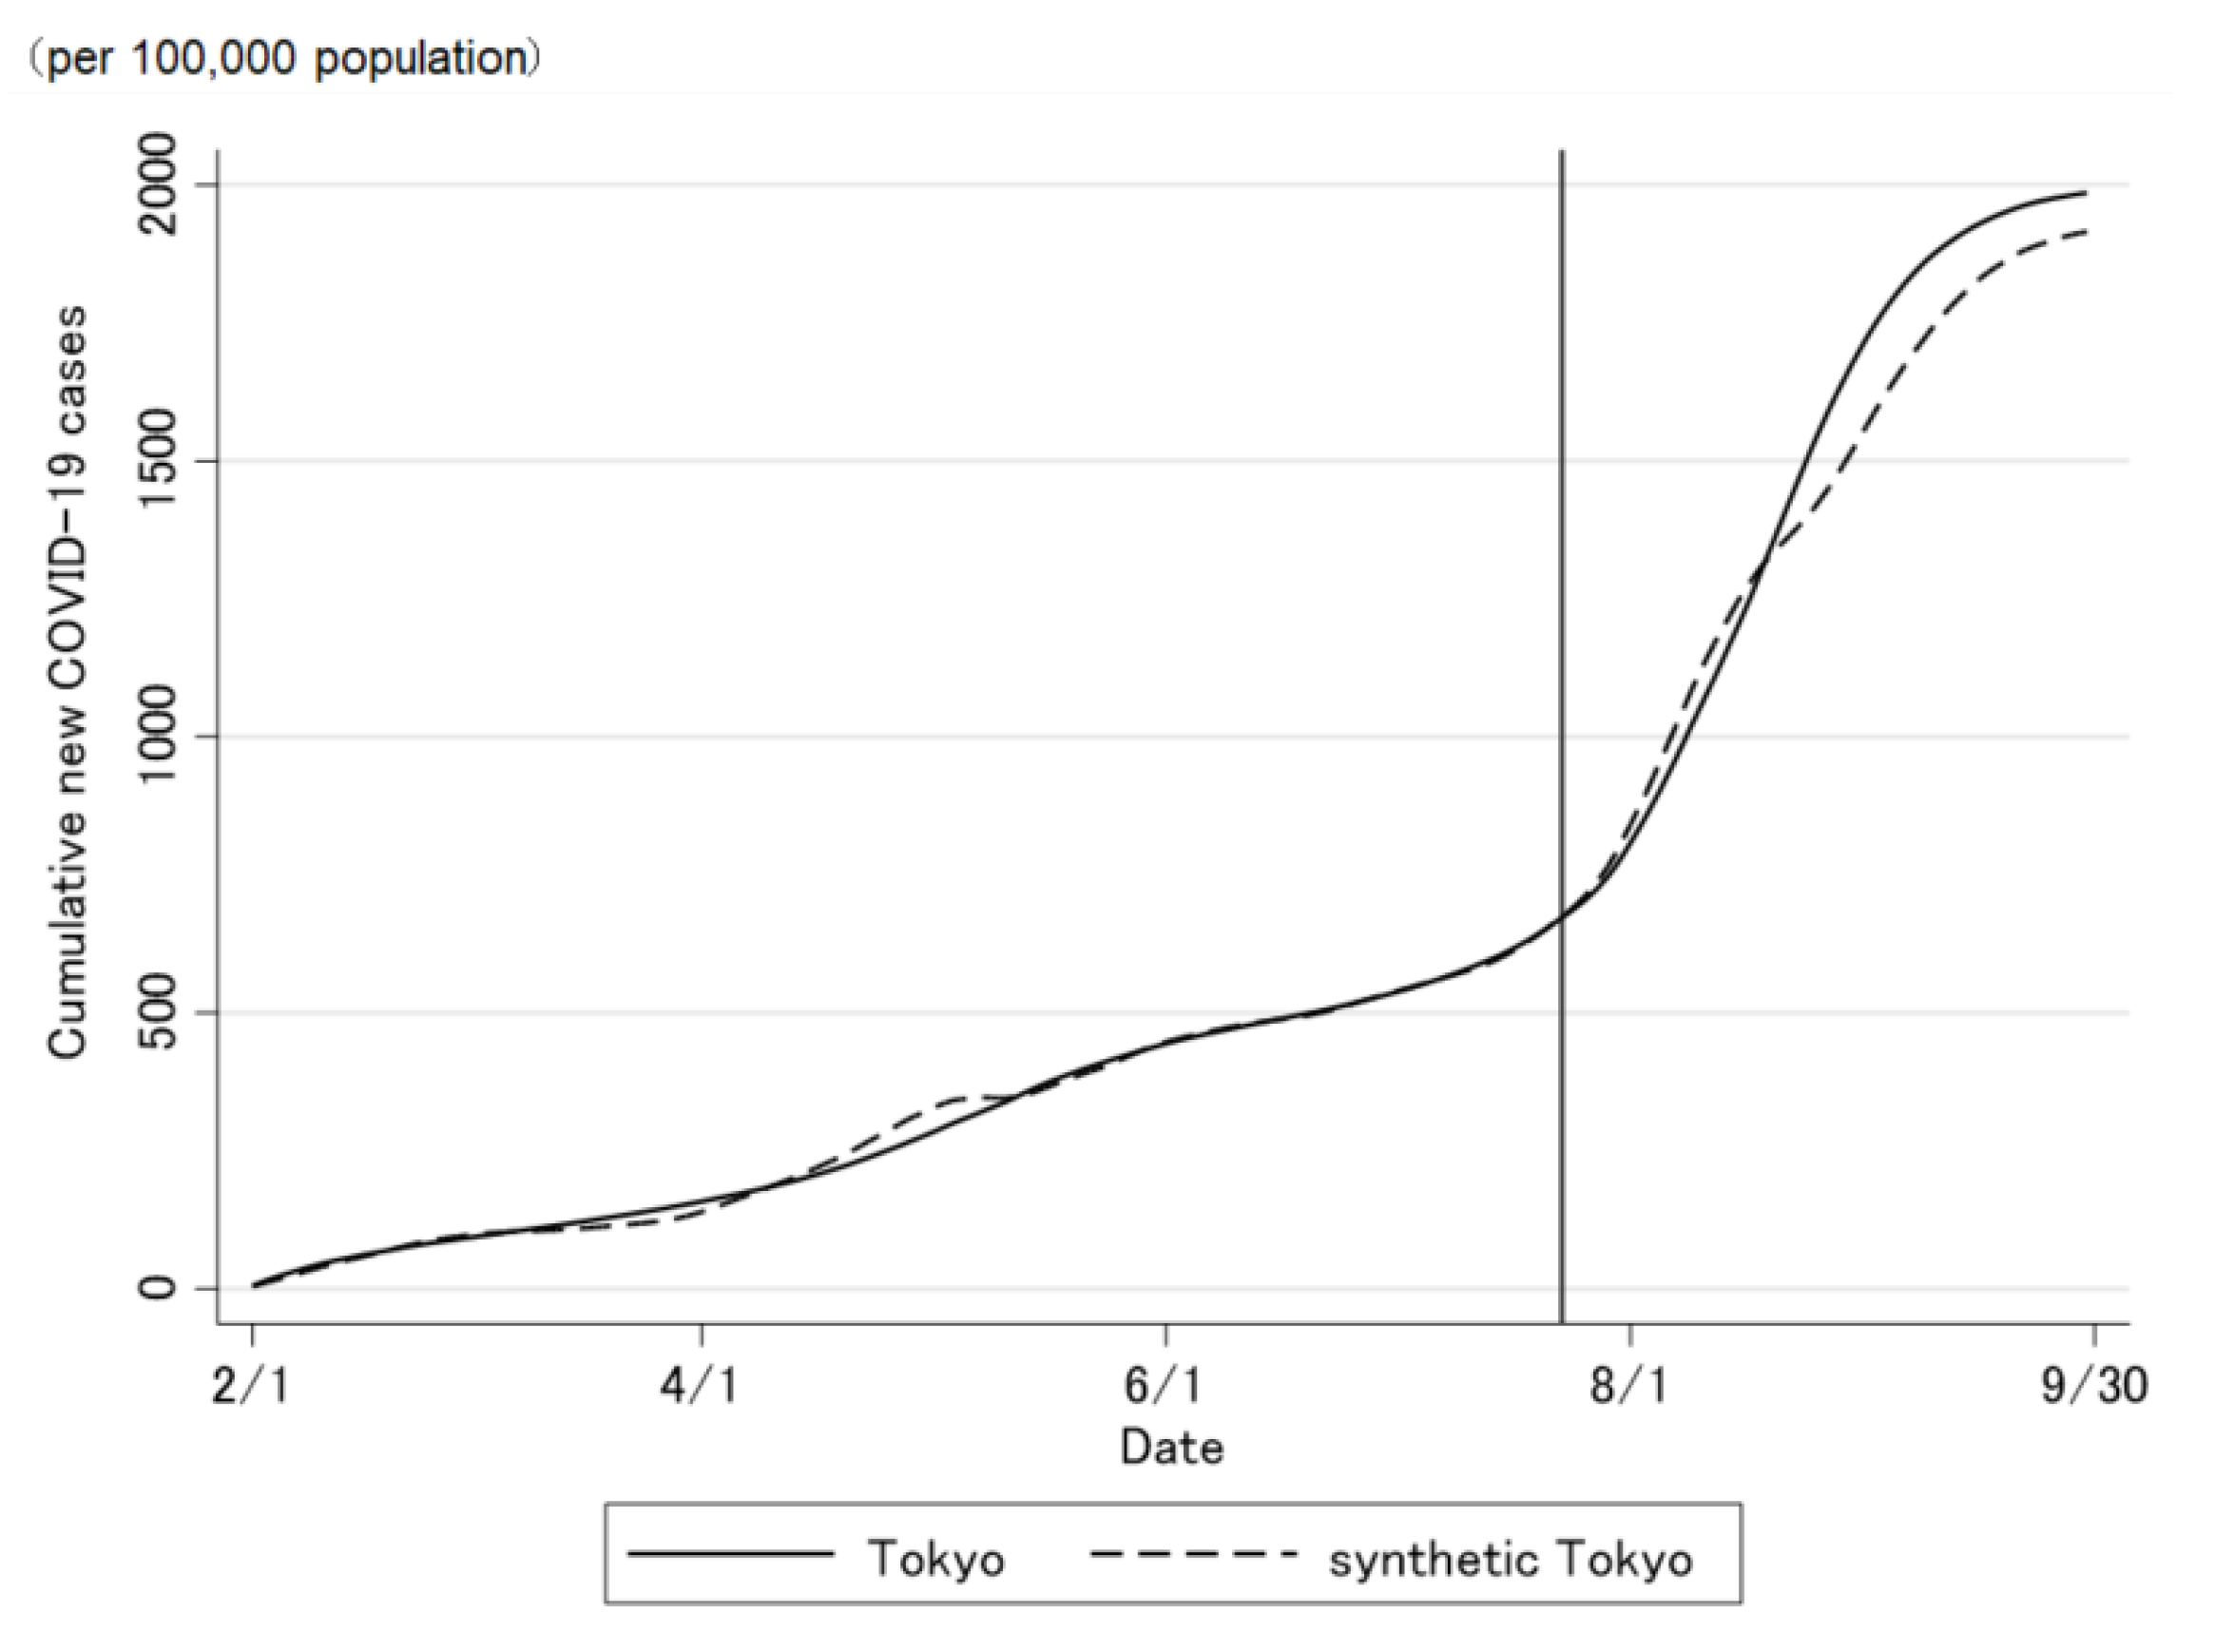
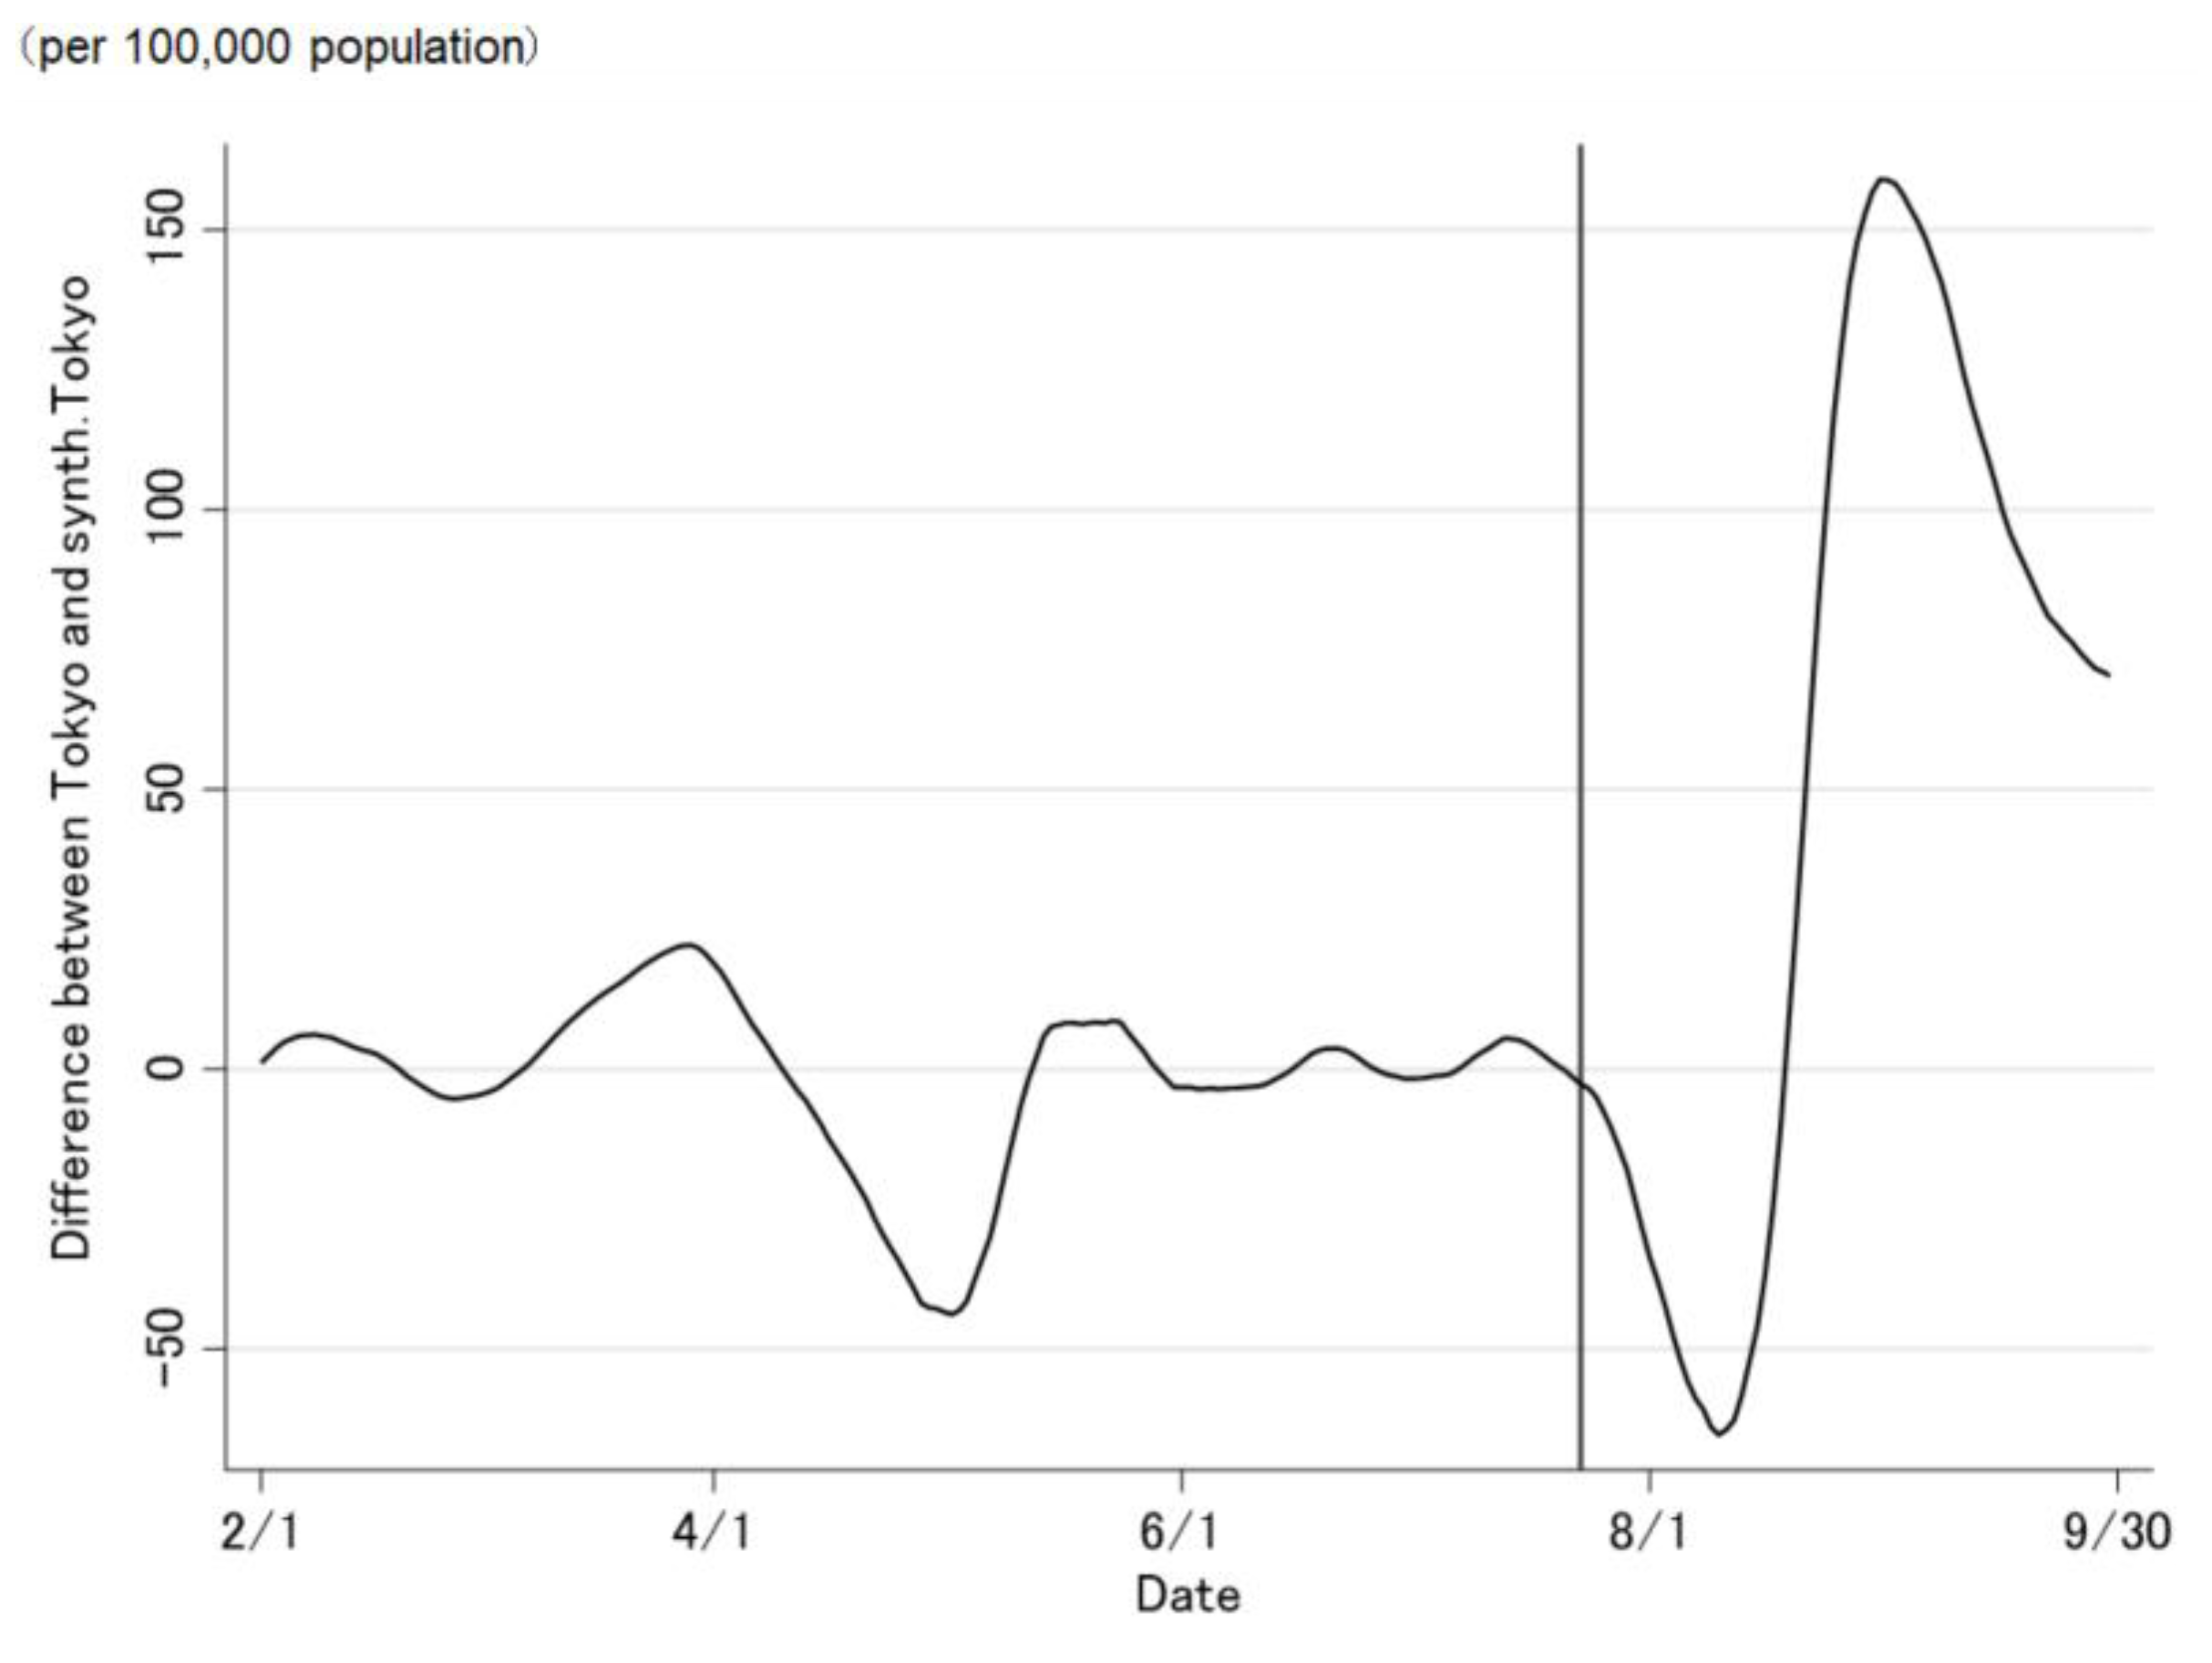
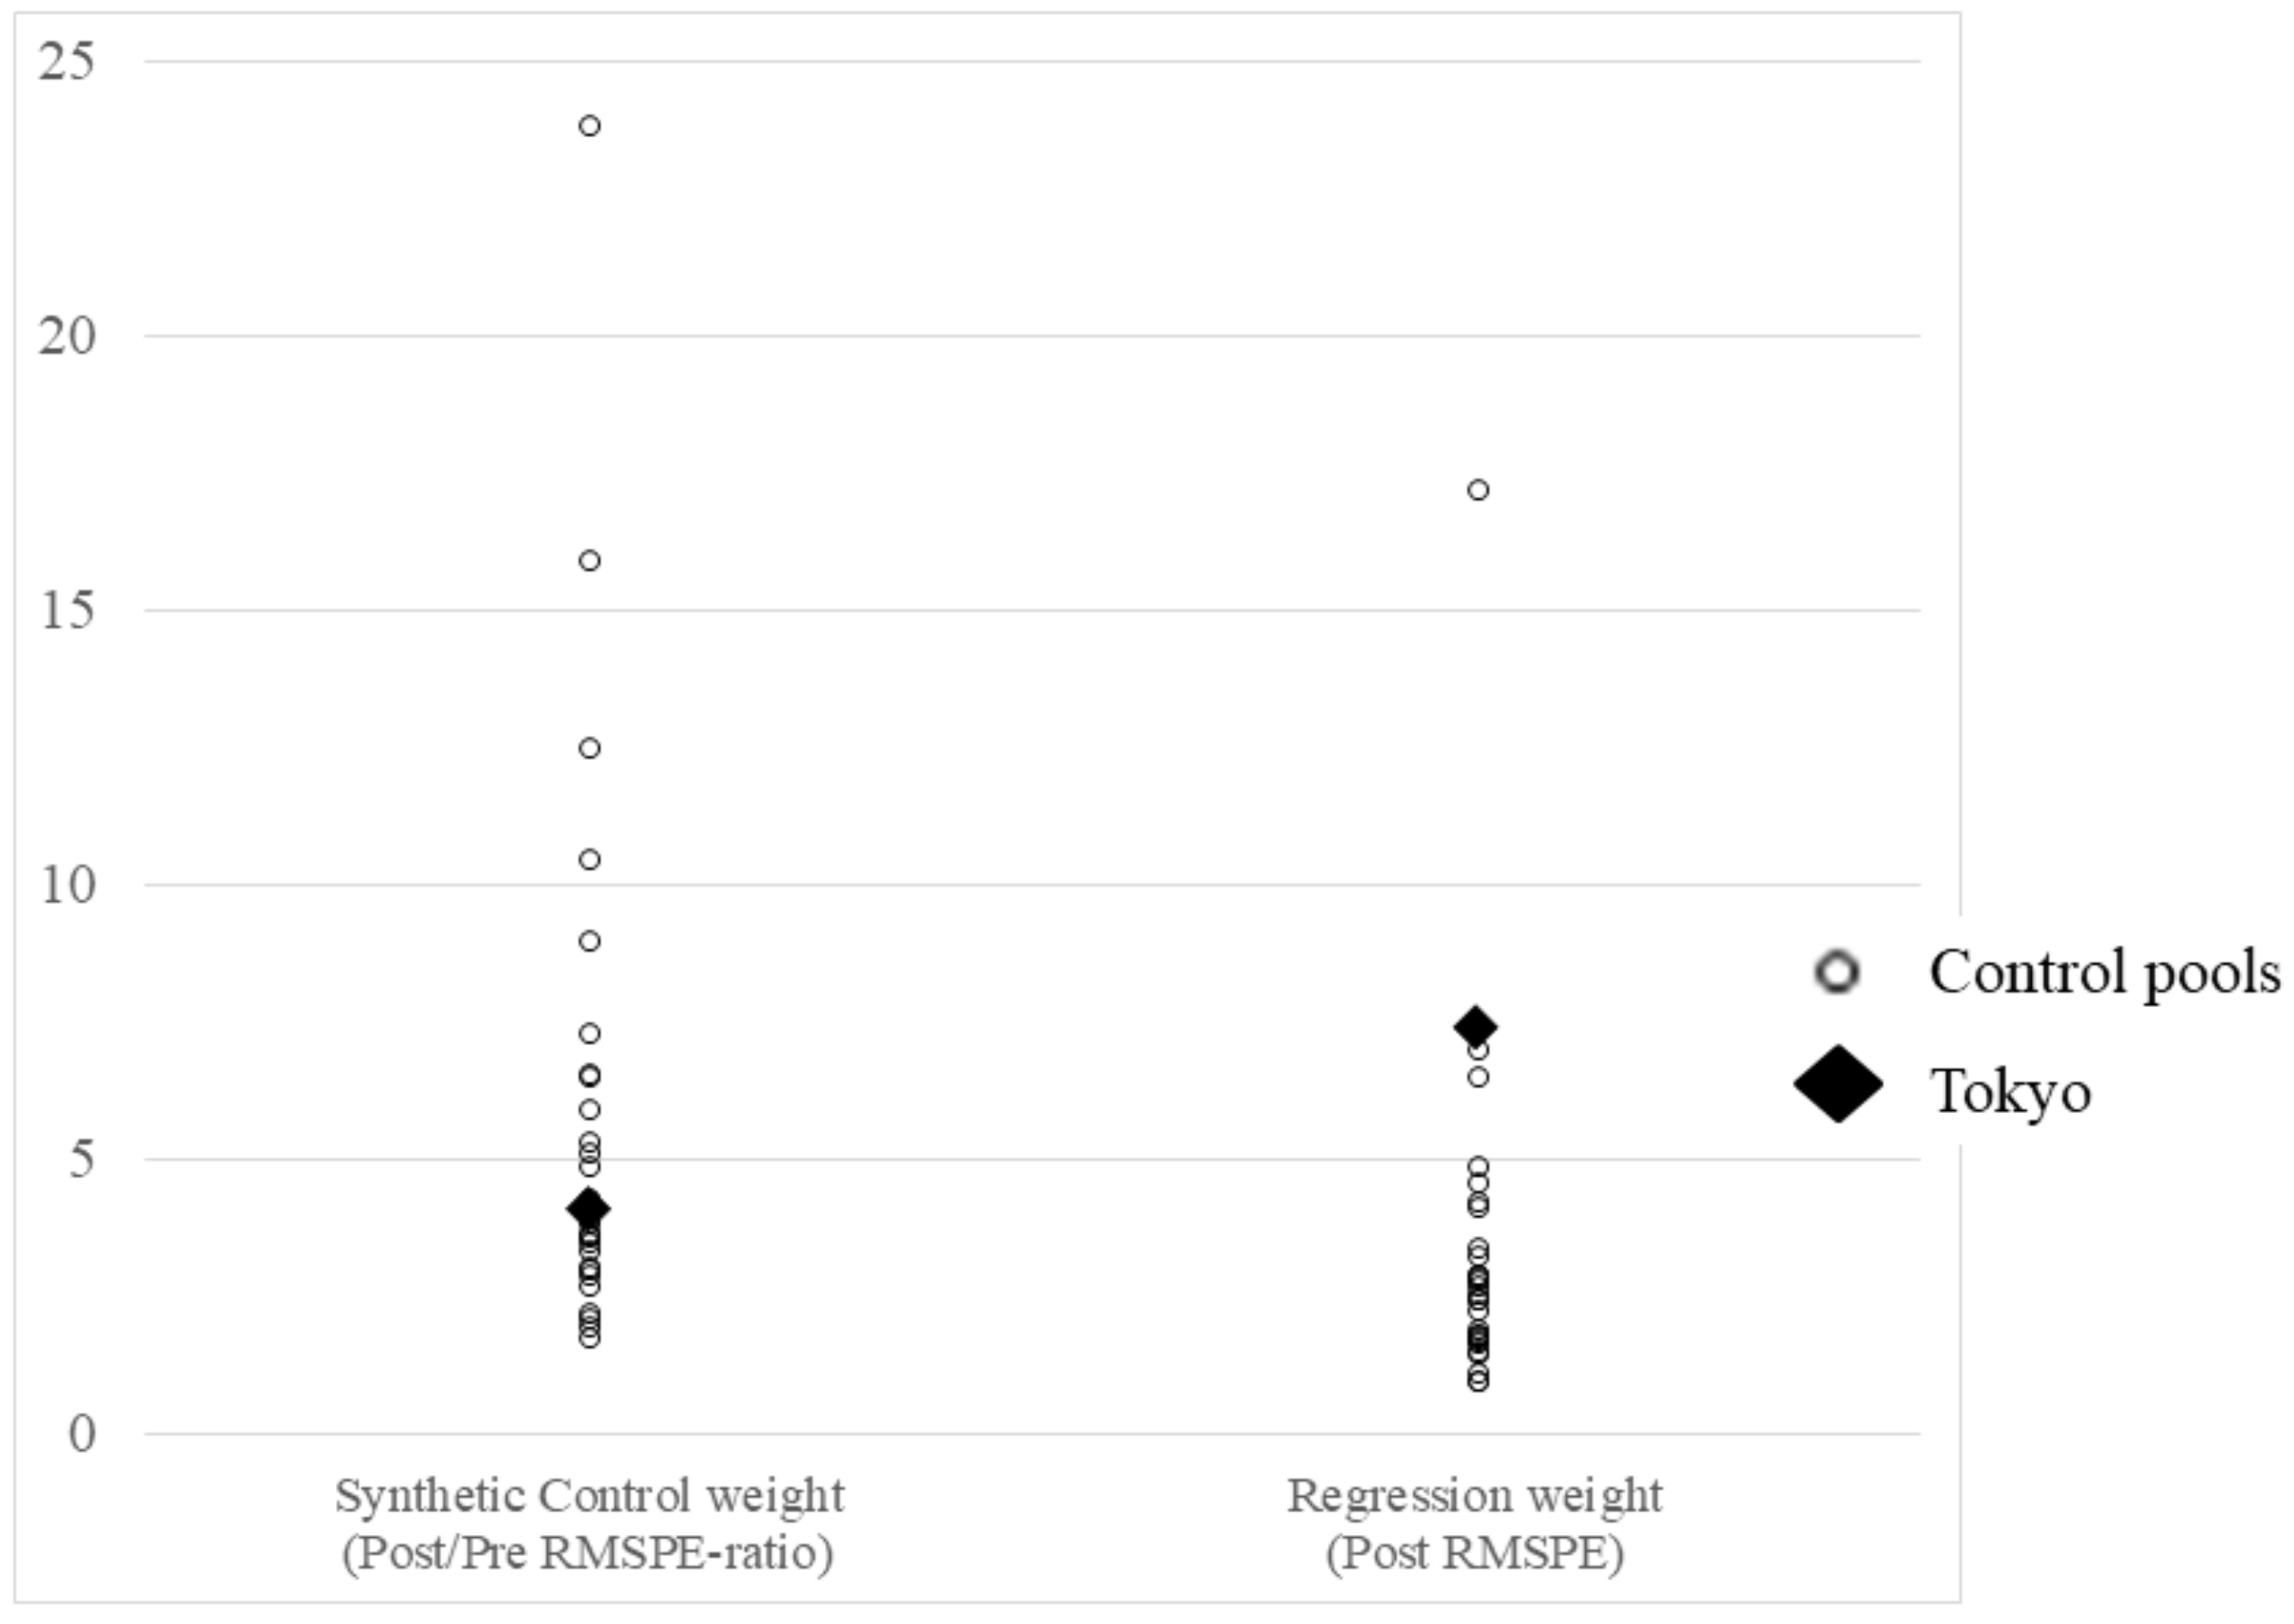
3. Results
4. Discussion
4.1. Strengths
4.2. Limitations
5. Conclusions
Supplementary Materials
Author Contributions
Funding
Institutional Review Board Statement
Informed Consent Statement
Data Availability Statement
Acknowledgments
Conflicts of Interest
References
- Cutler, D.M.; Summers, L.H. The COVID-19 pandemic and the $16 trillion virus. JAMA 2020, 324, 1495–1496. [Google Scholar] [CrossRef] [PubMed]
- Abadie, A.; Diamond, A.; Hainmueller, J. Synthetic control methods for comparative case studies: Estimating the effect of California’s tobacco control program. J. Am. Stat. Assoc. 2010, 105, 493–505. [Google Scholar] [CrossRef] [Green Version]
- Abadie, A.; Gardeazabal, J. The economic costs of conflict: A case study of the Basque Country. Am. Econ. Rev. 2003, 93, 113–132. [Google Scholar] [CrossRef] [Green Version]
- Born, B.; Dietrich, A.M.; Müller, G.J. The lockdown effect: A counterfactual for Sweden. PLoS ONE 2021, 16, e0249732. [Google Scholar] [CrossRef] [PubMed]
- Mitze, T.; Kosfeld, R.; Rode, J.; Wälde, K. Face masks considerably reduce COVID-19 cases in Germany. Proc. Natl. Acad. Sci. USA 2020, 117, 32293–32301. [Google Scholar] [CrossRef] [PubMed]
- Zhu, P.; Tan, X. Is compulsory home quarantine less effective than centralized quarantine in controlling the COVID-19 outbreak? Evidence from Hong Kong. Sustain. Cities Soc. 2021, 74, 103222. [Google Scholar] [CrossRef] [PubMed]
- Mills, M.C.; Rüttenauer, T. The effect of mandatory COVID-19 certificates on vaccine uptake: Synthetic-control modelling of six countries. Lancet Public Health 2021, 7, E15–E22. [Google Scholar] [CrossRef]
- Abadie, A.; Diamond, A.; Hainmueller, J. Comparative politics and the synthetic control method. Am. J. Political Sci. 2015, 59, 495–510. [Google Scholar] [CrossRef]
- Hahn, J.; Shi, R. Synthetic Control and Inference. Econometrics 2017, 5, 52. [Google Scholar] [CrossRef] [Green Version]
- Rehkopf, D.H.; Basu, S. A new tool for case studies in epidemiology-the synthetic control Method. Epidemiology 2018, 29, 503–505. [Google Scholar] [CrossRef] [PubMed]
- Prime Minister’s Office in Japan. Available online: https://www.kantei.go.jp/jp/headline/kansensho/vaccine.html (accessed on 13 December 2021).
- Ministry of Health, Labour and Welfare in Japan. About Coronavirus Disease 2019 (COVID-19). Available online: https://www.mhlw.go.jp/stf/seisakunitsuite/bunya/newpage_00032.html (accessed on 13 December 2021).
- Ito, K.; Piantham, C.; Nishiura, H. Predicted dominance of variant Delta of SARS-CoV-2 before Tokyo Olympic Games, Japan, July 2021. Euro. Surveill. 2021, 26, 2100570. [Google Scholar] [CrossRef] [PubMed]
- Center for Disease Control and Prevention. What You Need to Know About Variants. Available online: https://www.cdc.gov/coronavirus/2019-ncov/variants/about-variants.html?CDC_AA_refVal=https%3A%2F%2Fwww.cdc.gov%2Fcoronavirus%2F2019-ncov%2Variants%2Fvariant.html (accessed on 13 December 2021).
- Cheng, H.Y.; Jian, S.W.; Liu, D.P.; Ng, T.C.; Huang, W.T.; Lin, H.H. Contact tracing assessment of COVID-19 transmission dynamics in Taiwan and risk at different exposure periods before and after symptom onset. JAMA Intern. Med. 2020, 180, 1156–1163. [Google Scholar] [CrossRef]
- International Olympic Committee, International Paralympic Committee. Tokyo 2020 Playbooks. Available online: https://olympics.com/ioc/tokyo-2020-playbooks (accessed on 13 December 2021).
- Kucirka, L.M.; Lauer, S.A.; Laeyendecker, O.; Boon, D.; Lessler, J. Variation in false-negative rate of reverse transcriptase polymerase chain reaction-based SARS-CoV-2 tests by time since exposure. Ann. Intern. Med. 2020, 173, 262–267. [Google Scholar] [CrossRef]
- Ministry of Internal Affairs and Communications in Japan. Statistical Handbook of Japan 2021. Available online: https://www.stat.go.jp/data/nihon/index2.html (accessed on 13 December 2021).
- Ministry of Health, Labour and Welfare in Japan. Advisory Board for Countermeasures against Novel Coronavirus Infections. Available online: https://www.mhlw.go.jp/content/10900000/000820160.pdf (accessed on 13 December 2021).
- Abadie, A.; Diamond, A.; Hainmueller, J. SYNTH: Stata module to implement synthetic control methods for comparative case studies. Stat. Softw. Compon. 2010. Available online: https:ideas.repec.org/c/boc/bocode/s457334.html (accessed on 1 December 2021).
- Breidenbach, P.; Mitze, T. Large-Scale Sport Events and COVID-19 Infection Effects: Evidence from the German Professional Football ‘Experiment’. Econ. J. 2021, utab021. [Google Scholar] [CrossRef]
- Marsh, K.; Griffiths, E.; Young, J.J.; Gibb, C.A.; McMenamin, J. Contributions of the EURO 2020 Football Championship events to a third wave of SARS-CoV-2 in Scotland, 11 June to 7 July 2021. Euro. Surveill. 2021, 26, 2100707. [Google Scholar] [CrossRef] [PubMed]
- Kreif, N.; Grieve, R.; Hangartner, D.; Turner, A.J.; Nikolova, S.; Sutton, M. Examination of the synthetic control method for evaluating health policies with multiple treated units. Health Econ. 2016, 25, 1514–1528. [Google Scholar] [CrossRef] [PubMed] [Green Version]
- Yashio, T.; Murayama, A.; Kami, M.; Ozaki, A.; Tanimoto, T.; Rodriguez-Morales, A.J. COVID-19 infection during the Olympic and Paralympic Games Tokyo 2020. Travel Med. Infect. Dis. 2021, 44, 102205. [Google Scholar] [CrossRef] [PubMed]
- The Tokyo Metropolitan Government. Updates on COVID-19 in Tokyo. Available online: https://stopcovid19.metro.tokyo.lg.jp/en (accessed on 13 December 2021).
- Ma, Y.; Pei, S.; Shaman, J.; Dubrow, R.; Chen, K. Role of Meteorological Factors in the Transmission of SARS-CoV-2 in the United States. Nat. Commun. 2021, 12, 3602. [Google Scholar] [CrossRef] [PubMed]


| Prefecture | Synthetic Control Weight | Regression Weight | Prefecture | Synthetic Control Weight | Regression Weight |
|---|---|---|---|---|---|
| Okayama | 0 | −0.729 | Kumamoto | 0 | −0.171 |
| Tokushima | 0 | −0.716 | Shimane | 0 | −0.067 |
| Miyazaki | 0 | −0.660 | Aichi | 0 | −0.030 |
| Kagoshima | 0 | −0.548 | Okinawa | 0.267 | 0.075 |
| Shiga | 0 | −0.546 | Kochi | 0 | 0.218 |
| Kagawa | 0 | −0.540 | Nara | 0 | 0.284 |
| Hyogo | 0 | −0.493 | Ehime | 0 | 0.327 |
| Wakayama | 0 | −0.492 | Yamaguchi | 0 | 0.398 |
| Oita | 0 | −0.414 | Mie | 0 | 0.497 |
| Hiroshima | 0 | −0.357 | Kyoto | 0 | 0.569 |
| Saga | 0 | −0.328 | Osaka | 0.277 | 0.601 |
| Gifu | 0 | −0.250 | Fukui | 0 | 0.888 |
| Toyama | 0 | −0.233 | Tottori | 0 | 1.024 |
| Nagasaki | 0 | −0.175 | Fukuoka | 0 | 1.392 |
| 0.455 | 1.475 |
| Tokyo | Synthetic Tokyo | Regression-Weighted Tokyo | Population-Weighted Average of the Control Pool | |
|---|---|---|---|---|
| New case per 100,000 persons | ||||
| Mean between 1 February and 19 February 2021 | 3.71 | 1.78 | 3.71 | 1.18 |
| Mean between 19 February and 8 March 2021 | 2.08 | 0.92 | 2.08 | 0.50 |
| Mean between 8 March and 10 April 2021 | 2.40 | 2.06 | 2.40 | 1.14 |
| Mean between 10 April and 13 May 2021 | 5.02 | 5.87 | 5.02 | 4.60 |
| Mean between 13 May and 30 May 2021 | 5.05 | 6.42 | 5.05 | 4.81 |
| Mean between 30 May and 15 June 2021 | 3.16 | 5.06 | 3.16 | 1.97 |
| Mean between 15 June and 4 July 2021 | 3.26 | 1.97 | 3.26 | 0.77 |
| Mean between 4 July and 22 July 2021 | 6.21 | 2.39 | 6.21 | 0.96 |
| RMSPE of new COVID-19 cases | - | 1.92 | 0.00 | 2.39 |
| Related conditions | ||||
| Proportion of the population having received the second dose | 41.3% | 42.4% | 41.3% | 44.2% |
| Proportion of the COVID-19 variants in circulation | 54.0% | 18.9% | 54.0% | 27.1% |
| Proportion of people aged 15–64 years old | 65.8% | 59.5% | 65.8% | 58.3% |
| Proportion of people aged over 65 years old | 23.1% | 27.0% | 23.1% | 29.2% |
Publisher’s Note: MDPI stays neutral with regard to jurisdictional claims in published maps and institutional affiliations. |
© 2022 by the authors. Licensee MDPI, Basel, Switzerland. This article is an open access article distributed under the terms and conditions of the Creative Commons Attribution (CC BY) license (https://creativecommons.org/licenses/by/4.0/).
Share and Cite
Yamamoto, N.; Mitsuhashi, T.; Tsuchihashi, Y.; Yorifuji, T. Causal Effect of the Tokyo 2020 Olympic and Paralympic Games on the Number of COVID-19 Cases under COVID-19 Pandemic: An Ecological Study Using the Synthetic Control Method. J. Pers. Med. 2022, 12, 209. https://doi.org/10.3390/jpm12020209
Yamamoto N, Mitsuhashi T, Tsuchihashi Y, Yorifuji T. Causal Effect of the Tokyo 2020 Olympic and Paralympic Games on the Number of COVID-19 Cases under COVID-19 Pandemic: An Ecological Study Using the Synthetic Control Method. Journal of Personalized Medicine. 2022; 12(2):209. https://doi.org/10.3390/jpm12020209
Chicago/Turabian StyleYamamoto, Norio, Toshiharu Mitsuhashi, Yuuki Tsuchihashi, and Takashi Yorifuji. 2022. "Causal Effect of the Tokyo 2020 Olympic and Paralympic Games on the Number of COVID-19 Cases under COVID-19 Pandemic: An Ecological Study Using the Synthetic Control Method" Journal of Personalized Medicine 12, no. 2: 209. https://doi.org/10.3390/jpm12020209
APA StyleYamamoto, N., Mitsuhashi, T., Tsuchihashi, Y., & Yorifuji, T. (2022). Causal Effect of the Tokyo 2020 Olympic and Paralympic Games on the Number of COVID-19 Cases under COVID-19 Pandemic: An Ecological Study Using the Synthetic Control Method. Journal of Personalized Medicine, 12(2), 209. https://doi.org/10.3390/jpm12020209