
Clinical EEG of Rett Syndrome: Group Analysis Supplemented with Longitudinal Case Report


Abstract
:1. Introduction
2. Materials and Methods
2.1. Study Design
2.2. EEG Registration
2.3. Clinical Data
2.4. EEG Analysis
- Epileptiform and paroxysmal activity
- Benign sporadic wave discharges, spikes, multi-spikes, classified as benign focal epileptiform discharge of childhood (BFEDC) [25], which were not accompanied by clinical events. The index of this activity was calculated in relation to the analyzed EEG fragments (see Methods); their duration was, on average, from 100 to 900 ms. The topography of this activity was taken into account. Benign variants were included for several reasons. First, we believe that epileptiform activity can be easily misclassified, especially in children with atypical development [26,27,28]. Second, the EEG abnormalities including benign variants of epileptiform activity could be a sign of both brain immaturity and brain pathology [27] and we suggested that we need to take into account this factor when comparing RTT children with their typical peers.
- Episodic peak–wave or slow spike–wave complexes, which were not accompanied by clinical events and did not show repetitive structure, generalization or secondary generalization and did not exceed the duration of 2 s which are also not accompanied by clinical events and are not systemic in nature. These complexes, although sporadic, may potentially progress to hemi-generalized epileptiform activity. The topography of this activity was also taken into account.
- Typical or atypical epileptiform discharges manifesting with secondary generalized spike–slow wave discharges or spike–wave discharges. We analyzed accompanying clinical seizures or other clinical events, the duration of epileptiform discharges, the presence of generalization or secondary generalization, topography and complications.
- 2.
- General slowing
- 3.
- Beta rhythm
- 4.
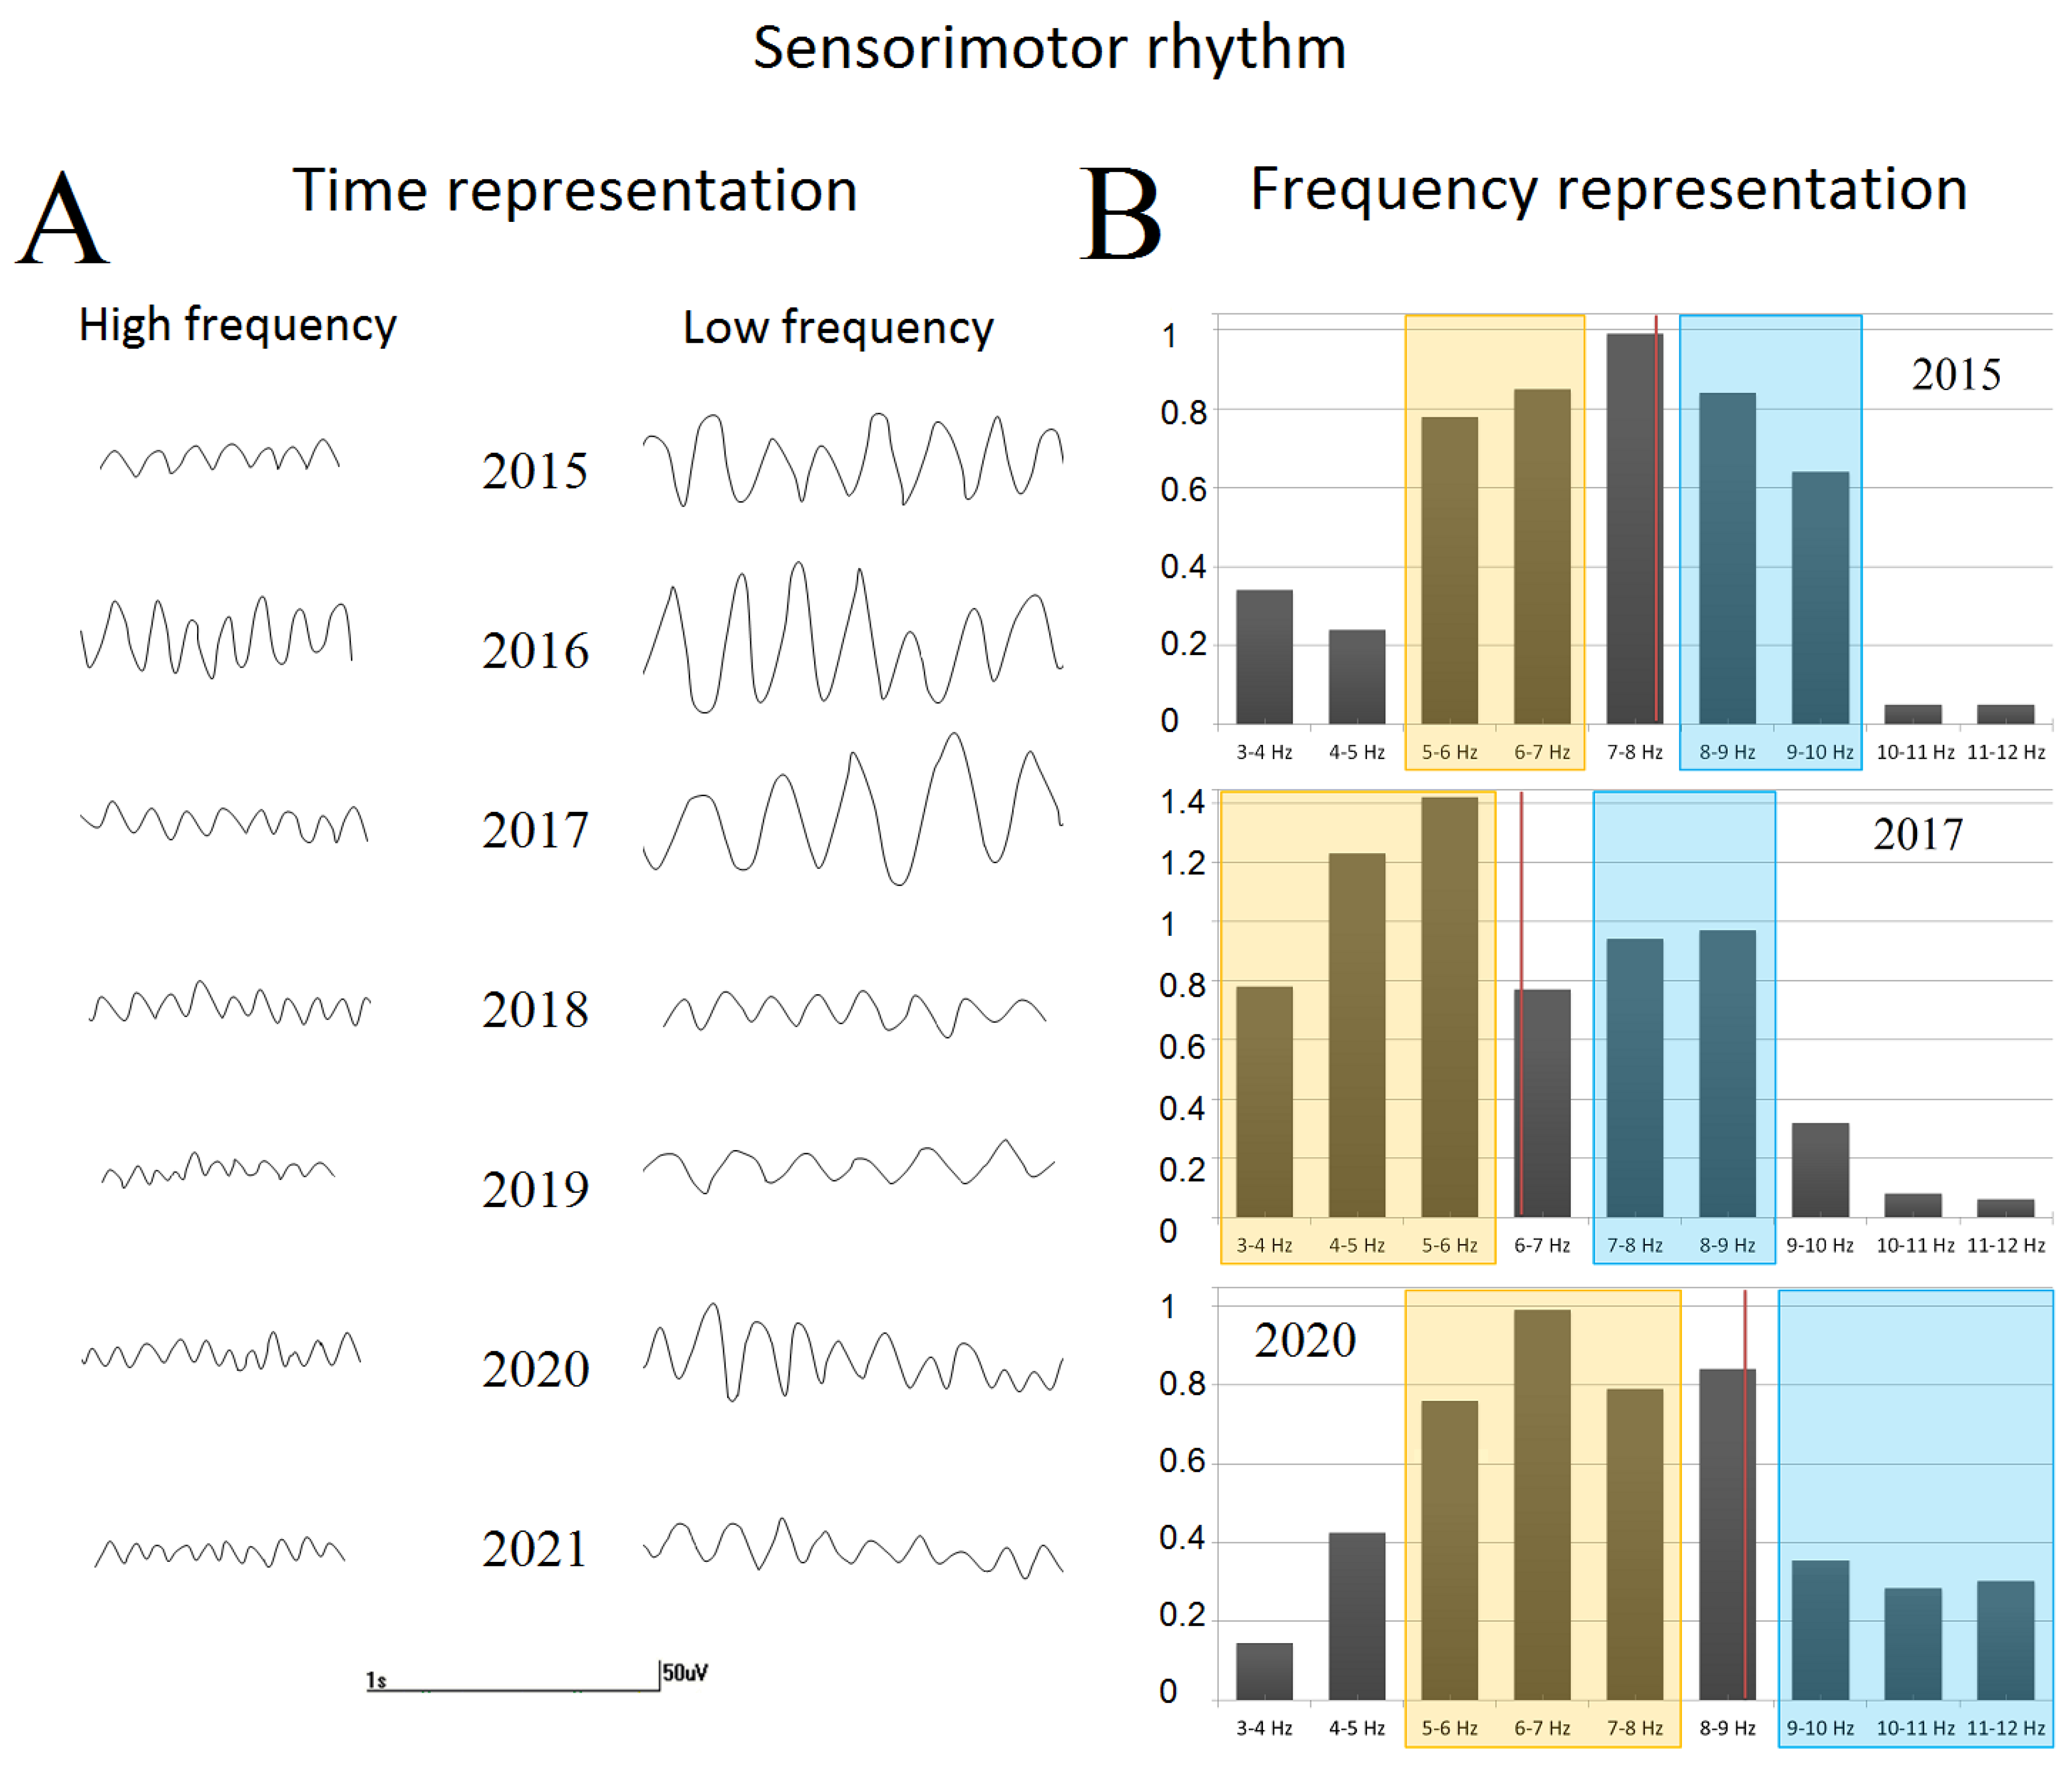
- The sensorimotor rhythm and its focal slowing
2.5. Statistical Analysis
3. Results
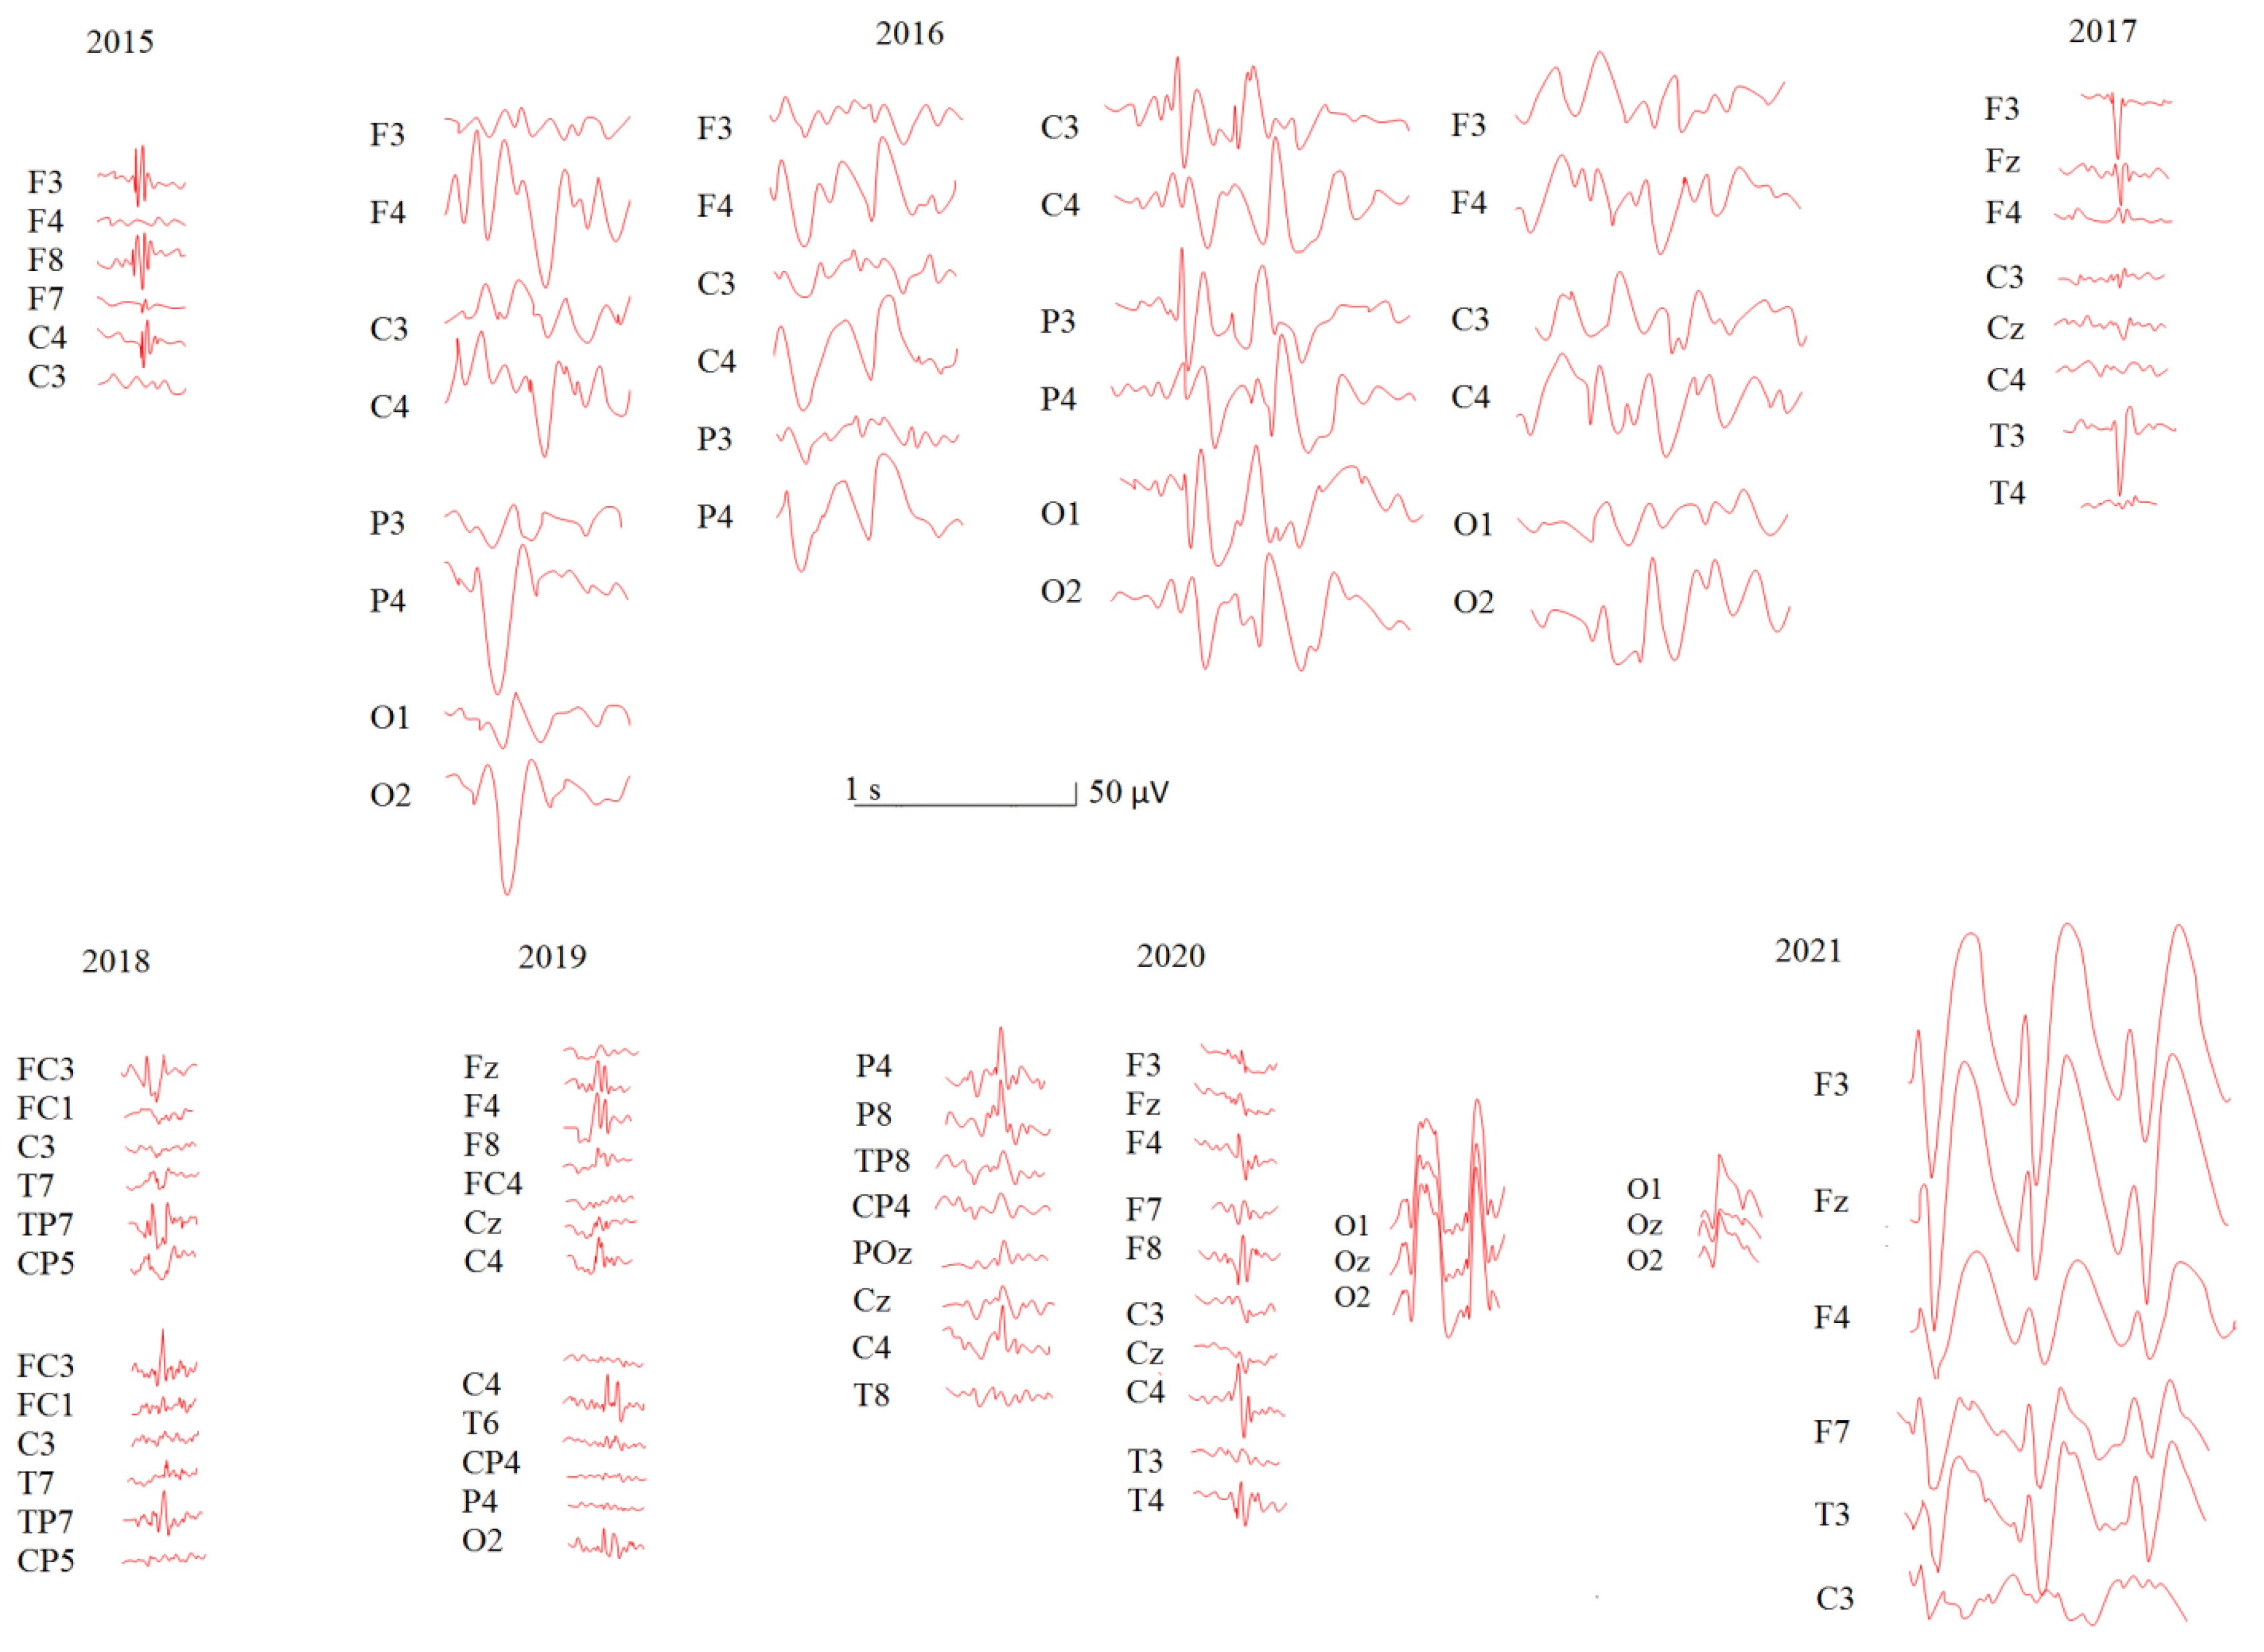
3.1. Longitudinal Study: Patient U
3.1.1. Demographic and Medical History
3.1.2. EEG Evaluation
3.2. RTT Group Analysis and Comparison with TD Peers
3.2.1. Demographic Features
3.2.2. Medical History Features
3.2.3. Epileptiform and Paroxysmal Activity
3.2.4. EEG Spectral Changes
4. Discussion
5. Conclusions
Author Contributions
Funding
Institutional Review Board Statement
Informed Consent Statement
Data Availability Statement
Acknowledgments
Conflicts of Interest
References
- Sarajlija, A.; Kisic-Tepavcevic, D.; Nikolic, Z.; Pavicevic, D.S.; Obradovic, S.; Djuric, M.; Pekmezovic, T. Epidemiology of Rett Syndrome in Serbia: Prevalence, Incidence and Survival. Neuroepidemiology 2015, 44, 1–5. [Google Scholar] [CrossRef] [PubMed]
- Chahrour, M.; Jung, S.Y.; Shaw, C.; Zhou, X.; Wong, S.T.C.; Qin, J.; Zoghbi, H.Y. MeCP2, a Key Contributor to Neurological Disease, Activates and Represses Transcription. Science 2008, 320, 1224–1229. [Google Scholar] [CrossRef] [PubMed] [Green Version]
- Nan, X.; Ng, H.H.; Johnson, C.A.; Laherty, C.D.; Turner, B.M.; Eisenman, R.N.; Bird, A. Transcriptional Repression by the Methyl-CpG-Binding Protein MeCP2 Involves a Histone Deacetylase Complex. Nature 1998, 393, 386–389. [Google Scholar] [CrossRef] [PubMed]
- Neul, J.L.; Kaufmann, W.E.; Glaze, D.G.; Christodoulou, J.; Clarke, A.J.; Bahi-Buisson, N.; Leonard, H.; Bailey, M.E.S.; Schanen, N.C.; Zappella, M.; et al. Rett Syndrome: Revised Diagnostic Criteria and Nomenclature. Ann. Neurol. 2010, 68, 944–950. [Google Scholar] [CrossRef] [PubMed] [Green Version]
- Richards, C.; Jones, C.; Groves, L.; Moss, J.; Oliver, C. Prevalence of Autism Spectrum Disorder Phenomenology in Genetic Disorders: A Systematic Review and Meta-Analysis. Lancet Psychiatry 2015, 2, 909–916. [Google Scholar] [CrossRef] [PubMed] [Green Version]
- Hagberg, B. Clinical Manifestations and Stages of Rett Syndrome. Ment. Retard. Dev. Disabil. Res. Rev. 2002, 8, 61–65. [Google Scholar] [CrossRef]
- Pintaudi, M.; Calevo, M.G.; Vignoli, A.; Parodi, E.; Aiello, F.; Baglietto, M.G.; Hayek, Y.; Buoni, S.; Renieri, A.; Russo, S.; et al. Epilepsy in Rett Syndrome: Clinical and Genetic Features. Epilepsy Behav. EB 2010, 19, 296–300. [Google Scholar] [CrossRef] [Green Version]
- Garofalo, E.A.; Drury, I.; Goldstein, G.W. EEG Abnormalities Aid Diagnosis of Rett Syndrome. Pediatric Neurol. 1988, 4, 350–353. [Google Scholar] [CrossRef] [Green Version]
- Operto, F.F.; Mazza, R.; Pastorino, G.M.G.; Verrotti, A.; Coppola, G. Epilepsy and Genetic in Rett Syndrome: A Review. Brain Behav. 2019, 9, e01250. [Google Scholar] [CrossRef] [Green Version]
- Krajnc, N. Management of Epilepsy in Patients with Rett Syndrome: Perspectives and Considerations. Ther. Clin. Risk Manag. 2015, 11, 925–932. [Google Scholar] [CrossRef]
- Smirnov, K.; Stroganova, T.; Molholm, S.; Sysoeva, O. Reviewing Evidence for the Relationship of EEG Abnormalities and RTT Phenotype Paralleled by Insights from Animal Studies. Int. J. Mol. Sci. 2021, 22, 5308. [Google Scholar] [CrossRef]
- Glaze, D.G. Neurophysiology of Rett Syndrome. J. Child Neurol. 2005, 20, 740–746. [Google Scholar] [CrossRef] [PubMed]
- Ishizaki, A.; Inoue, Y.; Sasaki, H.; Fukuyama, Y. Longitudinal Observation of Electroencephalograms in the Rett Syndrome. Brain Dev. 1989, 11, 407–412. [Google Scholar] [CrossRef] [PubMed]
- Trauner, D.A.; Haas, R.H. Electroencephalographic Abnormalities in Rett Syndrome. Pediatr. Neurol. 1987, 3, 331–334. [Google Scholar] [CrossRef] [PubMed]
- Verma, N.P.; Chheda, R.L.; Nigro, M.A.; Hart, Z.H. Electroencephalographic Findings in Rett Syndrome. Electroencephalogr. Clin. Neurophysiol. 1986, 64, 394–401. [Google Scholar] [CrossRef] [PubMed]
- Bader, G.G.; Witt-Engerström, I.; Hagberg, B. Neurophysiological Findings in the Rett Syndrome, II: Visual and Auditory Brainstem, Middle and Late Evoked Responses. Brain Dev. 1989, 11, 110–114. [Google Scholar] [CrossRef]
- Faienza, C.; Capone, C.; Sani, E.; Villani, D.; Prati, G. EEG Mapping in a Child with Rett Syndrome. Psychiatry Res. 1989, 29, 425–426. [Google Scholar] [CrossRef]
- Gorbachevskaya, N.; Bashina, V.; Gratchev, V.; Iznak, A. Cerebrolysin Therapy in Rett Syndrome: Clinical and EEG Mapping Study. Brain Dev. 2001, 23, S90–S93. [Google Scholar] [CrossRef]
- Brunsdon, V.E.A.; Bradford, E.E.F.; Ferguson, H.J. Sensorimotor Mu Rhythm during Action Observation Changes across the Lifespan Independently from Social Cognitive Processes. Dev. Cogn. Neurosci. 2019, 38, 100659. [Google Scholar] [CrossRef]
- Hoenen, M.; Lübke, K.T.; Pause, B.M. Sensitivity of the Human Mirror Neuron System for Abstract Traces of Actions: An EEG-Study. Biol. Psychol. 2017, 124, 57–64. [Google Scholar] [CrossRef]
- Niedermeyer, E.; Naidu, S.B.; Plate, C. Unusual EEG Theta Rhythms over Central Region in Rett Syndrome: Considerations of the Underlying Dysfunction. Clin. EEG Electroencephalogr. 1997, 28, 36–43. [Google Scholar] [CrossRef] [PubMed]
- Oberman, L.M.; Enticott, P.G.; Casanova, M.F.; Rotenberg, A.; Pascual-Leone, A.; McCracken, J.T. Transcranial Magnetic Stimulation in Autism Spectrum Disorder: Challenges, Promise, and Roadmap for Future Research. Autism Res. Off. J. Int. Soc. Autism Res. 2016, 9, 184–203. [Google Scholar] [CrossRef] [PubMed]
- Kaufmann, W.E.; Tierney, E.; Rohde, C.A.; Suarez-Pedraza, M.C.; Clarke, M.A.; Salorio, C.F.; Bibat, G.; Bukelis, I.; Naram, D.; Lanham, D.C.; et al. Social Impairments in Rett Syndrome: Characteristics and Relationship with Clinical Severity. J. Intellect. Disabil. Res. JIDR 2012, 56, 233–247. [Google Scholar] [CrossRef] [PubMed]
- Soghoyan, G.; Ledovsky, A.; Nekrashevich, M.; Martynova, O.; Polikanova, I.; Portnova, G.; Rebreikina, A.; Sysoeva, O.; Sharaev, M. A Toolbox and Crowdsourcing Platform for Automatic Labeling of Independent Components in Electroencephalography. Front. Neuroinform. 2021, 15, 720229. [Google Scholar] [CrossRef]
- Mushtaq, R.; Van Cott, A.C. Benign EEG Variants. Am. J. Electroneurodiagn. Technol. 2005, 45, 88–101. [Google Scholar] [CrossRef]
- Engel, J. ILAE Classification of Epilepsy Syndromes. Epilepsy Res. 2006, 70 (Suppl. S1), S5–S10. [Google Scholar] [CrossRef]
- Leibetseder, A.; Eisermann, M.; LaFrance, W.C.; Nobili, L.; von Oertzen, T.J. How to Distinguish Seizures from Non-Epileptic Manifestations. Epileptic Disord. Int. Epilepsy J. Videotape 2020, 22, 716–738. [Google Scholar] [CrossRef]
- Sheng, S.; Nalleballe, K.; Yadala, S. EEG Benign Variants. In StatPearls; StatPearls Publishing: Treasure Island, FL, USA, 2022. [Google Scholar]
- Britton, J.W.; Frey, L.C.; Hopp, J.L.; Korb, P.; Koubeissi, M.Z.; Lievens, W.E.; Pestana-Knight, E.M.; St. Louis, E.K. Electroencephalography (EEG): An Introductory Text and Atlas of Normal and Abnormal Findings in Adults, Children, and Infants; St. Louis, E.K., Frey, L.C., Eds.; American Epilepsy Society: Chicago, IL, USA, 2016; ISBN 978-0-9979756-0-4. [Google Scholar]
- Berchicci, M.; Zhang, T.; Romero, L.; Peters, A.; Annett, R.; Teuscher, U.; Bertollo, M.; Okada, Y.; Stephen, J.; Comani, S. Development of Mu Rhythm in Infants and Preschool Children. Dev. Neurosci. 2011, 33, 130–143. [Google Scholar] [CrossRef] [Green Version]
- Eid, M.; Gollwitzer, M.; Schmitt, M. Statistik und Forschungsmethoden: Mit Online-Materialien; 5, Korrigierte Auflage; Beltz: Weinheim, Germany, 2017; ISBN 978-3-621-28622-0. [Google Scholar]
- Bao, X.; Downs, J.; Wong, K.; Williams, S.; Leonard, H. Using a Large International Sample to Investigate Epilepsy in Rett Syndrome. Dev. Med. Child Neurol. 2013, 55, 553–558. [Google Scholar] [CrossRef]
- Glaze, D.G.; Percy, A.K.; Skinner, S.; Motil, K.J.; Neul, J.L.; Barrish, J.O.; Lane, J.B.; Geerts, S.P.; Annese, F.; Graham, J.; et al. Epilepsy and the Natural History of Rett Syndrome. Neurology 2010, 74, 909–912. [Google Scholar] [CrossRef]
- Tarquinio, D.C.; Hou, W.; Berg, A.; Kaufmann, W.E.; Lane, J.B.; Skinner, S.A.; Motil, K.J.; Neul, J.L.; Percy, A.K.; Glaze, D.G. Longitudinal Course of Epilepsy in Rett Syndrome and Related Disorders. Brain 2017, 140, 306–318. [Google Scholar] [CrossRef] [PubMed] [Green Version]
- Nissenkorn, A.; Levy-Drummer, R.S.; Bondi, O.; Renieri, A.; Villard, L.; Mari, F.; Mencarelli, M.A.; Lo Rizzo, C.; Meloni, I.; Pineda, M.; et al. Epilepsy in Rett Syndrome—Lessons from the Rett Networked Database. Epilepsia 2015, 56, 569–576. [Google Scholar] [CrossRef] [Green Version]
- Bashina, V.M.; Simashkova, N.V.; Grachev, V.V.; Gorbachevskaya, N.L. Speech and Motor Disturbances in Rett Syndrome. Neurosci. Behav. Physiol. 2002, 32, 323–327. [Google Scholar] [CrossRef]
- Roche, K.J.; LeBlanc, J.J.; Levin, A.R.; O’Leary, H.M.; Baczewski, L.M.; Nelson, C.A. Electroencephalographic Spectral Power as a Marker of Cortical Function and Disease Severity in Girls with Rett Syndrome. J. Neurodev. Disord. 2019, 11, 15. [Google Scholar] [CrossRef]
- Vignoli, A.; Fabio, R.A.; La Briola, F.; Giannatiempo, S.; Antonietti, A.; Maggiolini, S.; Canevini, M.P. Correlations between Neurophysiological, Behavioral, and Cognitive Function in Rett Syndrome. Epilepsy Behav. EB 2010, 17, 489–496. [Google Scholar] [CrossRef] [PubMed]
- Ryan, C.M.; Murray, B.J. An Unexpected Abnormality on the EEG. J. Clin. Sleep Med. JCSM Off. Publ. Am. Acad. Sleep Med. 2010, 6, 613–615. [Google Scholar] [CrossRef] [Green Version]
- Boutros, N.N.; Lajiness-O’Neill, R.; Zillgitt, A.; Richard, A.E.; Bowyer, S.M. EEG Changes Associated with Autistic Spectrum Disorders. Neuropsychiatr. Electrophysiol. 2015, 1, 3. [Google Scholar] [CrossRef] [Green Version]
- Dlouha, O.; Prihodova, I.; Skibova, J.; Nevsimalova, S. Developmental Language Disorder: Wake and Sleep Epileptiform Discharges and Co-Morbid Neurodevelopmental Disorders. Brain Sci. 2020, 10, 910. [Google Scholar] [CrossRef]
- Clarke, A.R.; Barry, R.J.; Johnstone, S.J.; McCarthy, R.; Selikowitz, M. EEG Development in Attention Deficit Hyperactivity Disorder: From Child to Adult. Clin. Neurophysiol. Off. J. Int. Fed. Clin. Neurophysiol. 2019, 130, 1256–1262. [Google Scholar] [CrossRef]
- el Achkar, C.M.; Harrer, M.; Smith, L.; Kelly, M.; Iqbal, S.; Maljevic, S.; Niturad, C.E.; Vissers, L.E.L.M.; Poduri, A.; Yang, E.; et al. Characterization of the GABRB2-Associated Neurodevelopmental Disorders. Ann. Neurol. 2021, 89, 573–586. [Google Scholar] [CrossRef]
- Eaton, C.B.; Thomas, R.H.; Hamandi, K.; Payne, G.C.; Kerr, M.P.; Linden, D.E.J.; Owen, M.J.; Cunningham, A.C.; Bartsch, U.; Struik, S.S.; et al. Epilepsy and Seizures in Young People with 22q11.2 Deletion Syndrome: Prevalence and Links with Other Neurodevelopmental Disorders. Epilepsia 2019, 60, 818–829. [Google Scholar] [CrossRef] [PubMed] [Green Version]
- Hong, L.E.; Summerfelt, A.; McMahon, R.; Adami, H.; Francis, G.; Elliott, A.; Buchanan, R.W.; Thaker, G.K. Evoked Gamma Band Synchronization and the Liability for Schizophrenia. Schizophr. Res. 2004, 70, 293–302. [Google Scholar] [CrossRef]
- Zhao, X.; Wang, X.; Yang, T.; Ji, S.; Wang, H.; Wang, J.; Wang, Y.; Wu, Q. Classification of Sleep Apnea Based on EEG Sub-Band Signal Characteristics. Sci. Rep. 2021, 11, 5824. [Google Scholar] [CrossRef] [PubMed]
- Khachidze, I.; Gugushvili, M.; Advadze, M. EEG Characteristics to Hyperventilation by Age and Sex in Patients With Various Neurological Disorders. Front. Neurol. 2021, 12, 727297. [Google Scholar] [CrossRef] [PubMed]
- Kizuk, S.A.D.; Vuong, W.; MacLean, J.E.; Dickson, C.T.; Mathewson, K.E. Electrophysiological Correlates of Hyperoxia during Resting-State EEG in Awake Human Subjects. Psychophysiology 2019, 56, e13401. [Google Scholar] [CrossRef] [PubMed]
- Wang, D.; Yee, B.J.; Wong, K.K.; Kim, J.W.; Dijk, D.-J.; Duffin, J.; Grunstein, R.R. Comparing the Effect of Hypercapnia and Hypoxia on the Electroencephalogram during Wakefulness. Clin. Neurophysiol. Off. J. Int. Fed. Clin. Neurophysiol. 2015, 126, 103–109. [Google Scholar] [CrossRef]


| Age at EEG Registration | Medications | Rett Syndrome Severity Subscales (Scores) | RTT Stages | |||||||
|---|---|---|---|---|---|---|---|---|---|---|
| Total | Seizures | Breath | Scoliosis | Walk | Hand Use | Speech | Sleep | |||
| 1 y 1 m | 8 | 0 | 0 | 0 | 3 | 1 | 3 | 1 | I | |
| 1 y 7 m | 8 | 0 | 0 | 0 | 3 | 1 | 3 | 1 | II | |
| 2 y 6 m | 12 | 0 | 2 | 1 | 3 | 2 | 3 | 1 | II | |
| 3 y 5 m | 12 | 0 | 2 | 1 | 3 | 2 | 3 | 1 | III | |
| 3 y 10 m | 12 | 0 | 2 | 1 | 3 | 2 | 3 | 1 | III | |
| 4 y 4 m | 12 | 0 | 2 | 1 | 3 | 2 | 3 | 1 | III | |
| 4 y 9 m | Sarizotan or placebo | 12 | 0 | 2 | 1 | 3 | 2 | 3 | 1 | III |
| 5 y 2 m | Sarizotan open-label | 12 | 0 | 2 | 1 | 3 | 2 | 3 | 1 | III |
| 5 y 3 m | Sarizotan open-label | 12 | 0 | 2 | 1 | 3 | 2 | 3 | 1 | III |
| 5 y 4 m | Sarizotan open-label | 12 | 0 | 2 | 1 | 3 | 2 | 3 | 1 | III |
| 5 y 7 m | Sarizotan open-label | 12 | 0 | 2 | 1 | 3 | 2 | 3 | 1 | III |
| 6 y 1 m | 12 | 0 | 2 | 1 | 3 | 2 | 3 | 1 | III | |
| 6 y 8 m | 13 | 1 | 2 | 1 | 3 | 2 | 3 | 1 | III | |
| 6 y 11 m | Lamotrigine | 13 | 1 | 2 | 1 | 3 | 2 | 3 | 1 | III |
| EEG Parameters | |||||||||
|---|---|---|---|---|---|---|---|---|---|
| GS | SM (µ) | β (µ) | Epileptiform | ||||||
| Age at EEG Registration | Fr | Amp | Amp | MinFr | MaxFr | Index | FrR | Amp | Index |
| 1 y 1 m * | 1.3 | 35 | 140 | 5.2 | 8.6 | 63.9 | 1.17 | 25 | 11.6 |
| 1 y 7 m * | 1.5 | 30 | 195 | 4.6 | 7.9 | 54.7 | 0.86 | 20 | 25.7 |
| 2 y 6 m * | 1.5 | 85 | 185 | 3.9 | 8.7 | 46.8 | 0.37 | 20 | 20.2 |
| 3 y 5m | 1.9 | 90 | 145 | 5.2 | 9.5 | 39.4 | 0.35 | 20 | 32.1 |
| 3 y 10 m * | 2.3 | 95 | 65 | 6.1 | 10.1 | 34.4 | 0.34 | 20 | 38.5 |
| 4 y 4 m | 2.4 | 90 | 70 | 5.5 | 10.5 | 35.25 | 0.42 | 20 | 29.4 |
| 4 y 9 m | 2.3 | 85 | 60 | 4.3 | 10.9 | 29.25 | 0.38 | 15 | 21.5 |
| 5 y 2 m * | 2.1 | 100 | 68 | 4.4 | 11.8 | 33.8 | 0.66 | 15 | 18.6 |
| 5 y 3 m | 1.9 | 90 | 72 | 4.9 | 11.3 | 41.8 | 0.45 | 15 | 14.9 |
| 5 y 4 m | 2.7 | 95 | 88 | 6.8 | 11.8 | 44.5 | 0.55 | 15 | 16.7 |
| 5 y 7 m | 2.4 | 95 | 94 | 5.1 | 11.2 | 38.2 | 0.41 | 15 | 19.9 |
| 6 y 1 m * | 2.2 | 95 | 112 | 6.6 | 11.4 | 36.1 | 0.38 | 15 | 12.2 |
| 6 y 8 m * | 2.6 | 125 | 55 | 6.1 | 11.8 | 18.1 | 0.24 | 15 | 62.5 |
| 6 y 11 m | 2.5 | 130 | 65 | 5.5 | 11.7 | 17.6 | 0.22 | 12 | 44.1 |
| Valid N | Mean | Median | Std. Dev. | Std. Error | ||
|---|---|---|---|---|---|---|
| Age TD | 41 | 9.106 | 9.04 | 3.457 | 0.54 | |
| Age RTT | 32 | 8.46 | 8.08 | 4.15 | 0.73 | |
| age of regression, RTT (month) | 32 | 17.45 | 17.5 | 5.6 | 1.19 | |
| RSS | Seizures | 31 | 0.81 | 0 | 0.98 | 0.18 |
| Breath irregularities | 31 | 1.19 | 1 | 1.05 | 0.19 | |
| Scoliosis | 30 | 1 | 1 | 1.05 | 0.19 | |
| Walk | 31 | 1.94 | 2 | 1.12 | 0.2 | |
| Hand use | 32 | 1.91 | 2 | 1.03 | 0.18 | |
| Speech | 32 | 2.53 | 3 | 0.51 | 0.09 | |
| Sleep | 31 | 0.58 | 0 | 0.76 | 0.14 | |
| Total | 32 | 9.75 | 9.5 | 3.65 | 0.65 | |
| RTT (n = 32) | TD (n = 41) | ||||
|---|---|---|---|---|---|
| Mean ± STD | Median | Mean ± STD | Median | Mann–Whitney U test | |
| GS_Fr | 2.55 ± 0.62 | 2.40 | 3.23 ± 0.65 | 3.2 | Z = −3.98, p = 0.0001 |
| Gs_Amp | 72.50 ± 38.33 | 70.00 | 35.24 ± 26.31 | 30 | Z = 4.20, p = 0.0001 |
| SM_Amp | 108.81 ± 49.62 | 107.50 | 73.17 ± 24.51 | 65 | Z = 3.346, p = 0.0007 |
| SM_MinFr | 3.16 ± 1.34 | 3.55 | 6.42 ± 1.39 | 6.3 | Z = −4.608, p < 0.0001 |
| SM_MaxFr | 9.89 ± 1.86 | 10.20 | 10.71 ± 1.19 | 10.91 | Z = −2.37, p = 0.017 |
| SM_Index | 18.95 ± 20.06 | 9.88 | 25.95 ± 14.48 | 23.4 | Z = −2.69, p = 0.007 |
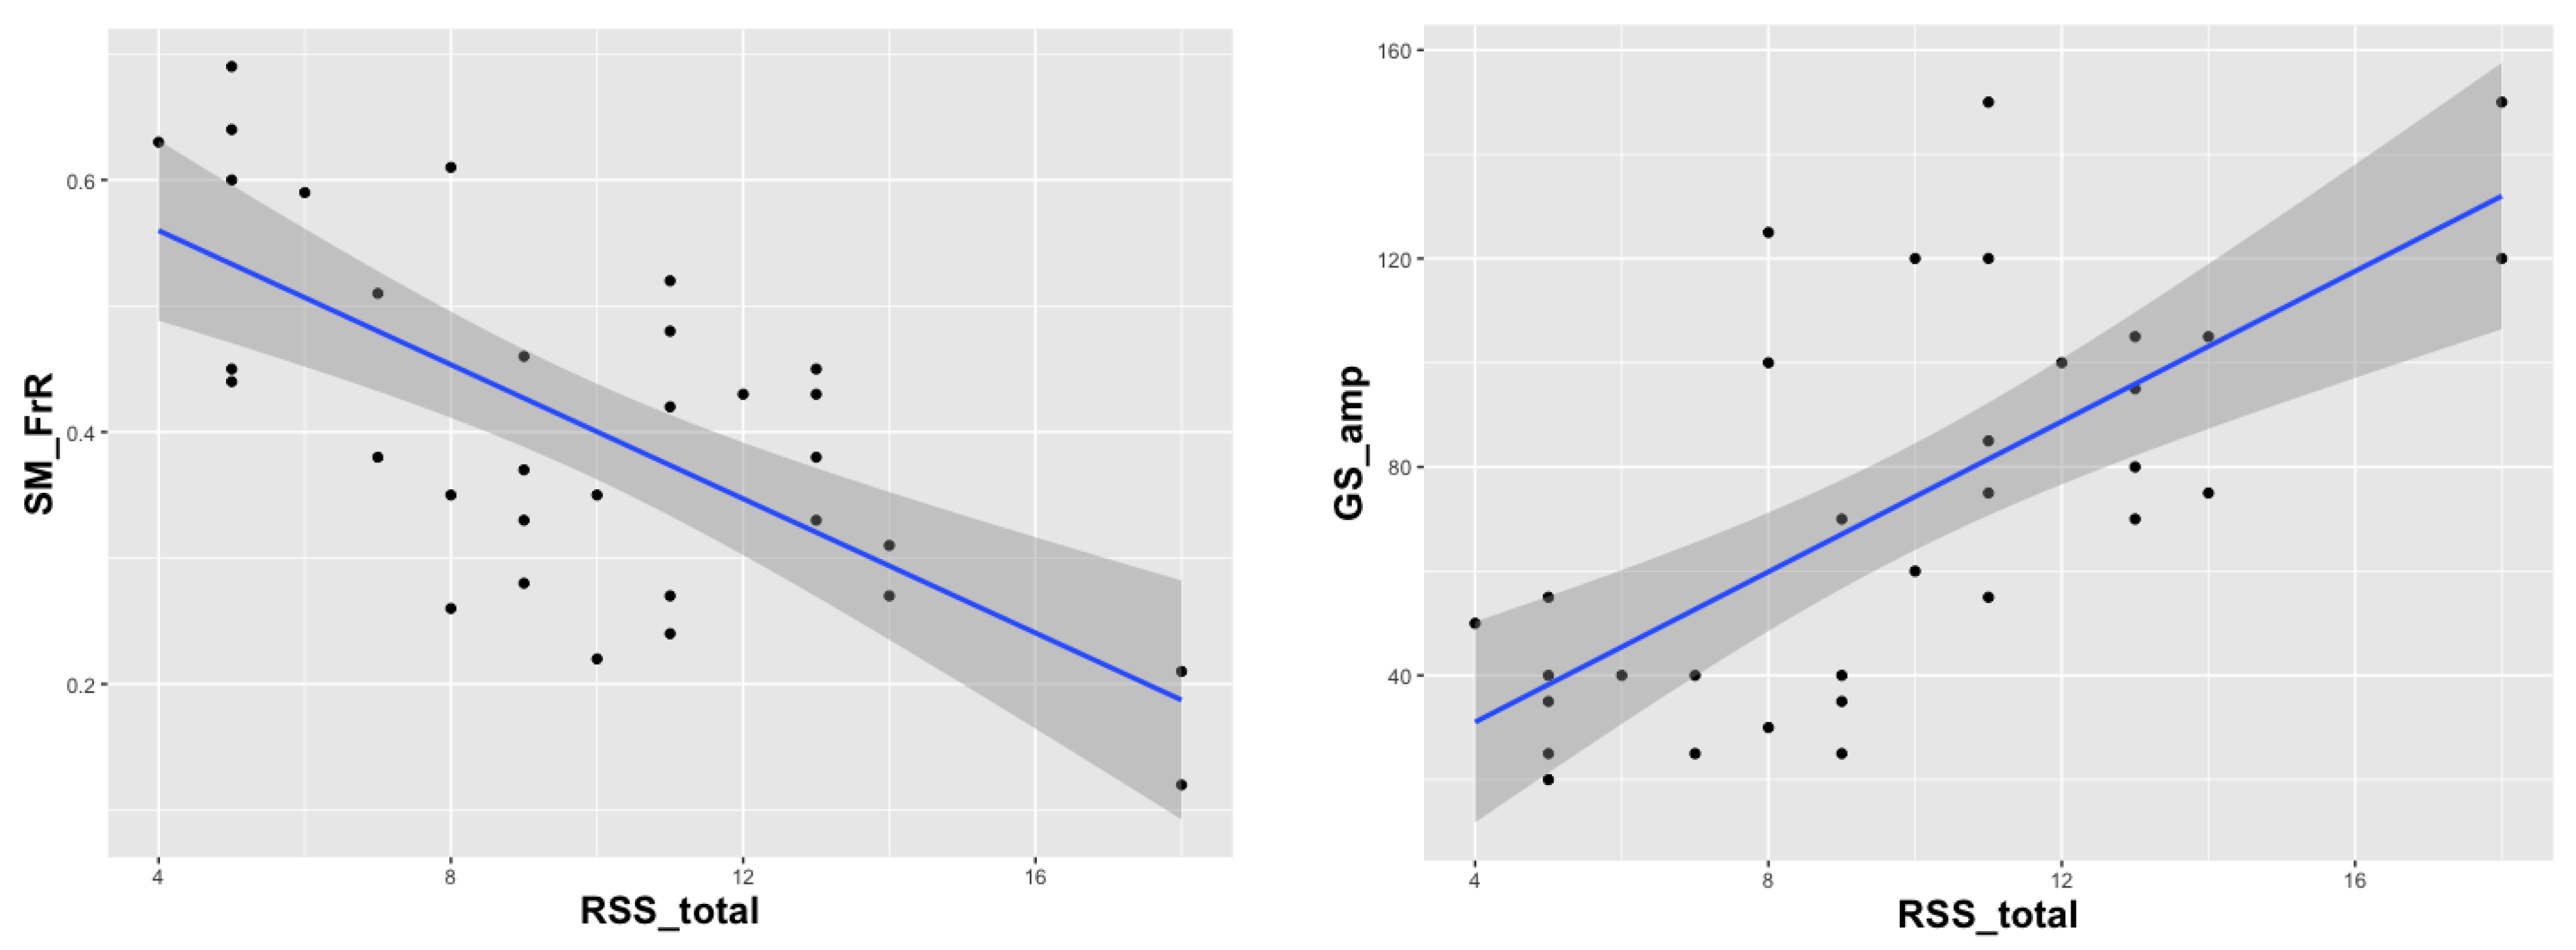
| SM_FrR | 0.41 ± 0.14 | 0.40 | 0.66 ± 0.14 | 0.665 | Z = −5.54, p < 0.0001 |
| Beta_Amp | 20.13 ± 7.89 | 19.75 | 16.63 ± 4.74 | 15 | Z = 1.67, p = 0.084 |
| Epileptiform activity | 8.78 ± 13.53 | 5.13 | 0.86 ± 1.68 | 0.11 | Z = 5.63, p < 0.0001 |
| RSS Subscales | Partial Correlation with GS_amp | Partial Correlation with SM_FrR | Comparison of GS and SM Correlations |
|---|---|---|---|
| Seizures | r = 0.19, p = 0.3 | r = −0.41, p = 0.02 | p = 0.12 |
| Breath irregularities | r = −0.09, p = 0.6 | r = −0.35, p = 0.05 | p = 0.04 |
| Scoliosis | r = 0.3, p = 0.09 | r = −0.19, p = 0.3 | p = 0.28 |
| Walk | r = 0.47, p = 0.006 | r = −0.49, p = 0.005 | p = 0.45 |
| Hand use | r = 0.5, p = 0.003 | r = −0.4, p = 0.02 | p = 0.28 |
| Speech | r = 0.45, p = 0.01 | r = −0.3, p = 0.1 | p = 0.21 |
| Sleep | r = 0.35, p = 0.05 | r = −0.2, p = 0.2 | p = 0.21 |
| Total | r = 0.58, p = 0.0005 | r = −0.62, p = 0.0002 | p = 0.39 |
Publisher’s Note: MDPI stays neutral with regard to jurisdictional claims in published maps and institutional affiliations. |
© 2022 by the authors. Licensee MDPI, Basel, Switzerland. This article is an open access article distributed under the terms and conditions of the Creative Commons Attribution (CC BY) license (https://creativecommons.org/licenses/by/4.0/).
Share and Cite
Portnova, G.; Neklyudova, A.; Voinova, V.; Sysoeva, O. Clinical EEG of Rett Syndrome: Group Analysis Supplemented with Longitudinal Case Report. J. Pers. Med. 2022, 12, 1973. https://doi.org/10.3390/jpm12121973
Portnova G, Neklyudova A, Voinova V, Sysoeva O. Clinical EEG of Rett Syndrome: Group Analysis Supplemented with Longitudinal Case Report. Journal of Personalized Medicine. 2022; 12(12):1973. https://doi.org/10.3390/jpm12121973
Chicago/Turabian StylePortnova, Galina, Anastasia Neklyudova, Victoria Voinova, and Olga Sysoeva. 2022. "Clinical EEG of Rett Syndrome: Group Analysis Supplemented with Longitudinal Case Report" Journal of Personalized Medicine 12, no. 12: 1973. https://doi.org/10.3390/jpm12121973
APA StylePortnova, G., Neklyudova, A., Voinova, V., & Sysoeva, O. (2022). Clinical EEG of Rett Syndrome: Group Analysis Supplemented with Longitudinal Case Report. Journal of Personalized Medicine, 12(12), 1973. https://doi.org/10.3390/jpm12121973