Abstract
Hepatocellular carcinoma (HCC) is a relatively chemo-resistant tumor. Several multi-kinase inhibitors have been approved for treating advanced HCC. However, most HCC patients are highly refractory to these drugs. Therefore, the development of more effective therapies for advanced HCC patients is urgently needed. Stathmin 1 (STMN1) is an oncoprotein that destabilizes microtubules and promotes cancer cell migration and invasion. In this study, cancer genomics data mining identified STMN1 as a prognosis biomarker and a therapeutic target for HCC. Co-expressed gene analysis indicated that STMN1 expression was positively associated with cell-cycle-related gene expression. Chemical sensitivity profiling of HCC cell lines suggested that High-STMN1-expressing HCC cells were the most sensitive to MST-312 (a telomerase inhibitor). Drug–gene connectivity mapping supported that MST-312 reversed the STMN1-co-expressed gene signature (especially BUB1B, MCM2/5/6, and TTK genes). In vitro experiments validated that MST-312 inhibited HCC cell viability and related protein expression (STMN1, BUB1B, and MCM5). In addition, overexpression of STMN1 enhanced the anticancer activity of MST-312 in HCC cells. Therefore, MST-312 can be used for treating STMN1-high expression HCC.
1. Introduction
Hepatocellular carcinoma (HCC) is one of the major causes of cancer-associated death in the world [1]. The main curative treatments for HCC are surgical resection and liver transplantation, which only benefits 15–25% of HCC patients. In addition, there is no reliably effective therapy for advanced or metastatic HCC patients [2,3]. Molecular targeted agents have been viewed as new treatment options, such as multi-kinase inhibitors, sorafenib, regorafenib, and lenvatinib [4,5,6]. However, these drugs only provide a short increase of median overall survival in HCC patients [4,5,6,7]. Thus, there is an urgent need to design more effective therapeutic strategies for HCC.
Stathmin 1, encoded by the human STMN1 gene, was first cloned in 1989 [8]. STMN1 is a cytosolic phosphoprotein that regulates microtubule dynamics by promoting microtubule destabilization and preventing tubulin polymerization [9]. Mechanistically, the unphosphorylated form of STMN1 (through the stathmin-like domain) interacts with two molecules of dimeric α/β-tubulin to form a tight ternary complex called the T2S complex, thereby limiting the availability of free tubulins [10,11]. In contrast, phosphorylation of STMN1 on multiple serine residues (Ser16, Ser25, Ser38, and Ser63) reduces its microtubule-destabilizing activity [12].
STMN1 is also known as Oncoprotein 18 (Op18). Increased STMN1 expression has been observed in numerous human tumors including HCC, which is associated with aggressive tumor phenotypes and poor prognosis [13,14,15,16,17]. Therefore, STMN1 has been viewed as a therapeutic target for cancer treatment [18,19,20]. In HCC, the anticancer effects of the lentivirus-mediated RNA interference (RNAi) targeting enhancer of zeste homolog 2 (EZH2), gambogic acid, and thyroid hormone are found through downregulation of STMN1 [21,22,23]. In addition, STMN1 expression can determine the sensitivity to apoptosis in HCC cells during hepatitis C viral (HCV) replication [24]. The oncogenic mechanism of STMN1 overexpression is largely dependent on its ability to destabilize microtubules, leading to the promotion of cancer cell division, migration, and invasion [9,25].
In this study, we employed bioinformatics approaches and identified MST-312, a telomerase inhibitor, as an effective treatment for high-STMN1-expressing HCC. Mechanistically, MST-312 could reverse the co-expressed gene network that was related to cell cycle alteration in HCC. MST-312 may serve as a precision treatment for HCC in the future.
2. Materials and Methods
2.1. Cancer Genomics Data Mining
The cancer genomics data in HCC were analyzed on the cBioPortal and GEPIA websites (https://www.cbioportal.org/ and http://gepia2.cancer-pku.cn/, respectively; accessed on: 29 July 2019) [26,27,28]. For cBioPortal analysis, the liver hepatocellular carcinoma (LIHC) PanCancer Atlas dataset from The Cancer Genome Atlas (TCGA) was used [29]. Complete samples (n = 348) with mutation, copy number alteration (CNA), and mRNA expression data were used for cBioPortal data mining. For GEPIA data mining, tumors (n = 369) and the matched normal (n = 50) samples in LIHC dataset were considered. Kaplan–Meier survival plots were also created using the cBioPortal and GEPIA databases. Three microarray datasets containing the normal and HCC tissues were analyzed on the Oncomine database (https://www.oncomine.org/; accessed on: 29 July 2019), including Chen Liver (normal = 76 and HCC = 104) [30], Roessler Liver 2 (normal = 220 and HCC = 225) [31], and Wurmbach Liver (normal = 10, cirrhosis = 13, dysplasia = 17, and HCC = 35) [32].
2.2. Kyoto Encyclopedia of Genes and Genomes (KEGG) Pathway Analysis
The STMN1-co-expressed genes with a correlation score of more than 0.7 were obtained from the GEPIA and Oncomine websites (Table S1). KEGG pathway enrichment was conducted using the WebGestalt online tool [33] at http://www.webgestalt.org/ (accessed on: 29 July 2019) or the compareCluster function in the clusterProfiler R-package [34].
2.3. Cancer Drug Sensitivity Analysis
The relationship between STMN1 mRNA expression and drug sensitivity was obtained from the Cancer Therapeutics Response Portal (CTRP) database [35,36,37] at https://portals.broadinstitute.org/ctrp/ (accessed on: 29 July 2019). The correlation between STMN1 mRNA expression and MST-312 drug activity was visualized using the CellMinerCDB online tool [38] at https://discover.nci.nih.gov/cellminercdb/ (accessed on: 29 July 2019). The correlation between MST-312 drug activity from the area under the curve (AUC) and STMN1 gene dependency based on clustered regularly interspaced short palindromic repeat (CRISPR) screening was obtained from the DepMap online tool [39] at https://depmap.org/ (accessed on: 29 July 2019). Lower AUC values indicate higher drug activity.
2.4. Connectivity Map (CMap) Analysis
The CMap analysis was performed online via https://clue.io/ (accessed on: 9 April 2021) [40]. The 57 STMN1-co-expressed genes were queried for drugs and gene knockdowns that could reverse the queried gene signature. The “Touchstone” tool was used to explore the relationship between MST-312 and gene knockdowns. The results were interpreted from the connectivity scores (from −100 to 100). Positive or negative scores indicate similarity or dissimilarity between two gene signatures, respectively.
2.5. Cell Culture, Stable Transfection, and Cell Viability Assay
The human hepatocellular carcinoma (HCC) cells, PLC/PRF/5 (PLC5) and HepG2, were purchased from the Bioresource Collection and Research Center (BCRC) of the Food Industry Research and Development Institute (Hsinchu, Taiwan). Cells were maintained in Dulbecco’s Modified Eagle’s Medium (DMEM) containing 10% fetal bovine serum and cultured in a 37 °C humidified incubator with 5% CO2. For the establishment of STMN1-overexpressing clones, PLC5 and HepG2 cells were transfected with p-EGFP-STMN1 or its control vector (p-EGFP) and then selected with 1 mg/mL G418 for at least 3 months. The STMN1-EGFP plasmid was a gift from Lynne Cassimeris (Addgene plasmid #86782; http://n2t.net/addgene:86782 accessed on: 29 July 2019; RRID: Addgene_86782) [41]. The cell viability was determined with Alamar Blue reagent (Thermo Fisher Scientific, Waltham, MA, USA) according to the manufacturer’s instruction.
2.6. Western Blotting
Western blotting was performed as described previously [42]. STMN1 (GTX104707 and GTX113341), MCM5 (GTX114090), BUB1B (GTX111289), and GAPDH (GTX100118) antibodies were purchased from GeneTex (Hsinchu, Taiwan). The PARP1 antibody (#9542) was purchased from Cell Signaling Technologies (Beverly, MA, USA). The caspase 3 antibody (19677-1-AP) was purchased from ProteinTech Group (Chicago, IL, USA).
3. Results
3.1. STMN1 Overexpression Is Associated with Poorer Prognosis in HCC
In recent years, increasing large-scale cancer genomics data and related analytic tools have become publicly available, making it possible to re-evaluate the role of a specific gene in cancers. Although STMN1 has been cloned since 1989 [8], investigation of its role in HCC is still limited. In this study, we queried the HCC cancer genomics data via the cBioPortal website to determine the genetic alterations (mutations and copy number variations) of the STMN1 gene in HCC. As shown in Figure 1A, only 2 of 372 (0.54%) and 1 of 372 (0.27%) HCC patients harbored STMN1 gene mutation and deep deletion, respectively, in the TCGA-LIHC dataset, and no alteration was found in the other five datasets. The STMN1 mRNA expression in HCC was further investigated using the TCGA-LIHC dataset (Figure 1B). We found that 54 of 366 (15%) HCC patients had higher STMN1 mRNA expression. When compared with the adjacent normal tissues, HCC tumor tissues indeed displayed higher STMN1 mRNA expression (Figure 1C, the left part). In addition, a stage-dependent increase of STMN1 mRNA in HCC tissues was found (Figure 1C, the right part).
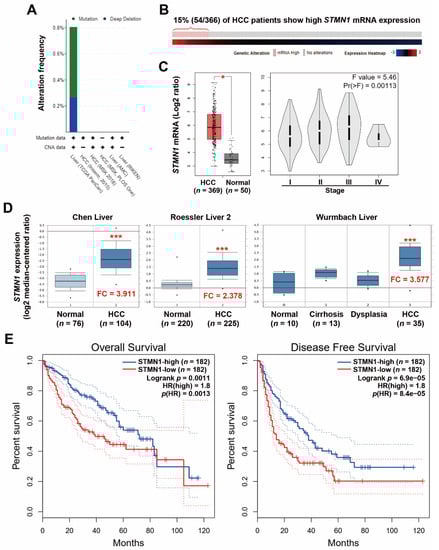
Figure 1.
STMN1 overexpression was associated with poor prognosis in HCC: (A) Genetic alterations of the STMN1 gene in five HCC datasets were analyzed through the cBioPortal database. CNA, copy number alteration. The “+” symbol indicates that the used dataset contains mutation or CNA data; (B) A bar code plot (OncoPrint) for STMN1 mRNA expression in HCC (TCGA-LIHC, PanCancer Atlas). The cases highlighted in red grids (mRNA high) had mRNA expression z-score higher than 1. The mRNA expression z-score means the relative expression of a gene in a tumor sample to the gene’s expression distribution in a reference population (diploid tumor samples); (C) The STMN1 mRNA expressions in normal and cancerous liver tissues (the left part) and in different tumor stages (the right part) were analyzed through the GEPIA website (TCGA-LIHC). * p < 0.05 compared with the normal group using one-way ANOVA; (D) The STMN1 mRNA expression in normal and cancerous liver tissues in three cohorts was analyzed through the Oncomine database. *** p < 0.01 compared with the normal group using the Student’s t-test. FC, fold change; (E) The impact of STMN1 mRNA expression on the overall and disease-free survival of HCC patients was analyzed through the GEPIA website. The group cutoff value was the median STMN1 mRNA expression.
To confirm the above observation, microarray gene expression profiles of normal and HCC tissues were obtained from the Oncomine database to compare STMN1 mRNA expression. As shown in Figure 1D, STMN1 mRNA was frequently overexpressed in HCC tissues in three microarray datasets. In addition, a slight increase of STMN1 mRNA was found in precancerous liver tissues (cirrhosis and dysplasia), suggesting that STMN1 may play an early role during hepatocarcinogenesis. Previous studies consistently suggest that protumorigenic overexpression of STMN1 is associated with hepatocarcinogenesis [16,43,44].
Previous studies have shown that STMN1 is frequently overexpressed in HCC, which is associated with tumor progression, early recurrence, and poor prognosis [15,16,17,45]. To ascertain the prognostic impact of STMN1 overexpression, Kaplan–Meier survival plots for overall and disease-free survival in HCC patients (TCGA-LIHC dataset) with higher and lower STMN1 mRNA expression were created using the GEPIA web-based tool. As shown in Figure 1E, HCC patients with high STMN1 mRNA expression had poorer overall and disease-free survival. Similarly, the top 15% of HCC patients with higher STMN1 mRNA expression (Figure 1B) also had lower overall and disease-free survival (Figure S1).
3.2. STMN1 Co-Expresses with Genes Related to Cell Cycle Regulation
To investigate the impact of STMN1 overexpression, STMN1-co-expressed genes were retrieved from the TCGA-LIHC dataset via the cBioPortal website (Table S1). KEGG pathway enrichment for these genes was performed using the WebGestalt online tool. As shown in Figure 2A, STMN1 overexpression was correlated with pathways related to cell cycle regulation such as cell cycle, DNA replication, oocyte maturation/meiosis, and cellular senescence. The KEGG cell cycle (hsa04110) pathway was mapped to STMN1-co-repressed genes as a representative (Figure 2B). We found that components for DNA replication (CDC6, CDC45, ORC1/6, MCM2/5/6/7), G2/M transition (CDC25A/B/C, CDK1, PLK1, Cyclins A/B), and mitosis (TTK/MPS1, MAD2, BUB1B/BUBR1, BUB1, PTTG1, CDC20) were upregulated, suggesting the active cell proliferation rate in high-STMN1-expressing HCC cells.
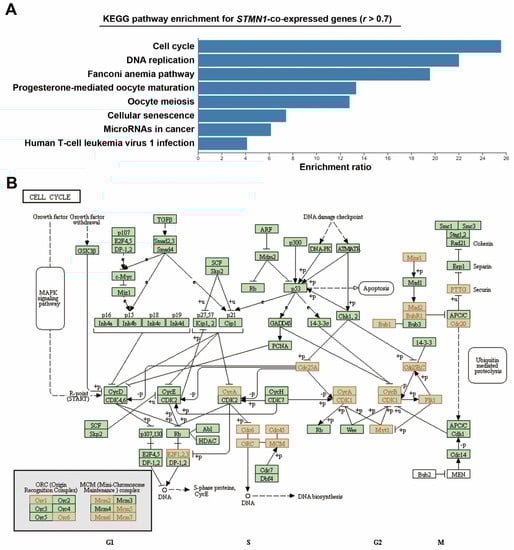
Figure 2.
Co-expression of STMN1 with cell-cycle regulatory genes in HCC (TCGA-LIHC): (A) STMN1-co-expressed genes were analyzed by GSEA using the WebGestalt web tool; (B) STMN1-co-expressed genes were mapped with KEGG cell cycle (hsa04110) pathway using the WebGestalt web tool. The mapped genes are highlighted in red.
To confirm the above analysis, an additional microarray dataset (Roessler Liver 2) containing 220 normal tissues and 225 HCC tissues was used to prepare STMN1-co-expressed genes via the Oncomine database (Table S1). The heat map for the top 20 co-expressed genes is shown in Figure 3A. Similarly, cell cycle and DNA replication pathways were the most enriched pathways (Figure 3B). KEGG cell cycle (hsa04110) mapping (Figure 3C) also showed the upregulation of genes related to DNA replication (CDC6, MCM2/3/4/5/6/7, CDC7, DBF4), G2/M transition (CDC25B/C, CDK1, Cyclins A/B), and mitosis (TTK/MPS1, MAD2, BUB1B/BUBR1, BUB1, PTTG1, CDC20). Consistently, a cross-comparison of KEGG pathway enrichment among four datasets (TCGA-LIHC, Chen Liver, Roessler Liver 2, and Wurmbach Liver) showed that cell-cycle-related genes were the most common genes co-expressed with STMN1 in HCC (Figure S2).
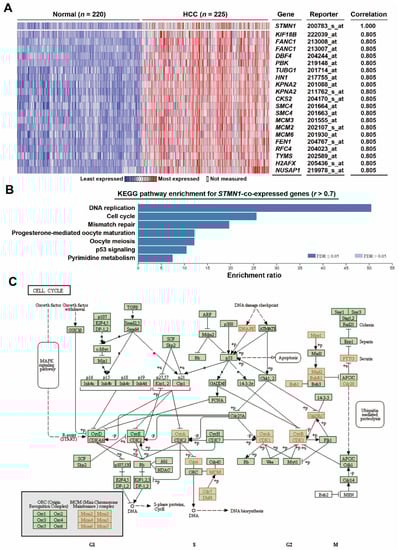
Figure 3.
Co-expression of STMN1 with cell-cycle regulatory genes in HCC (Oncomine): (A) Genes co-expressed with STMN1 were obtained from the Oncomine database (Roessler Liver 2). This heat map showed the related expression levels for the top 20 genes with STMN1 gene; (B) STMN1-co-expressed genes were analyzed by GSEA using the WebGestalt web tool; (C) STMN1-co-expressed genes were mapped with KEGG cell cycle (hsa04110) pathway using the WebGestalt web tool. The mapped genes are highlighted in red.
3.3. HCC Cells with Higher STMN1 Expression Are Sensitive to A Telomerase Inhibitor MST-312
STMN1 has been considered a therapeutic target for cancers [18,19,20]. To identify therapeutic drugs to selectively kill high-STMN1-expressing HCC cells, we mined the CTRP database and found that HCC cells with high STMN1 mRNA expression were sensitive to MST-312 (a telomerase inhibitor) and GMX-1778 (a competitive inhibitor of nicotinamide phosphoribosyltransferase) but resistant to BRD-K34099515 (unknown function) and Tacrolimus/FK506 (an immunosuppressive drug) (Figure 4A). We focused on investigating the most sensitive drug MST-312 (its chemical structure is shown in the embedded diagram of Figure 4B). A scatter plot showed the positive correlation between STMN1 mRNA expression and MST-312 drug activity (Figure 4B). To further confirm that the MST-312 drug activity was dependent on STMN1 downregulation, the STMN1-CRISPR-knockdown dependency data of HCC cells were obtained from the DepMap website. As shown in Figure 4C, MST-312 drug activity was highly correlated with the STMN1 dependency in 19 liver cancer cell lines.
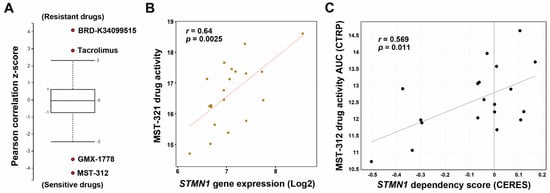
Figure 4.
The correlation between STMN1 mRNA expression and MST-312 drug sensitivity in HCC cell lines: (A) The drug response profiles correlated with STMN1 mRNA expression in HCC cell lines were analyzed using the CTRP database; (B) A scatter plot for the correlation between STMN1 mRNA expression and the MST-312 drug activity in HCC cell lines was generated through the CellMinerCDB website. The chemical structure of MST-312; (C) A scatter plot for the correlation between the MST-312 drug activity (AUC) and STMN1 gene dependency was generated through the DepMap website. CERES is a computational method to estimate gene dependency score levels from CRISPR screening. A lower CERES score indicates that a cell has a higher probability of gene dependency. A lower AUC means higher drug activity. CTRP, Cancer Therapeutics Response Portal.
According to the above analyses, we hypothesized that the efficacy of MST-312 against high-STMN1-expressing HCC cells may be due to its ability to downregulate and/or inactivate STMN1 and then reverse STMN1-co-expressed gene signature. To demonstrate this possibility, a CMap analysis was performed. The 57 STMN1-co-expressed genes were submitted and queried by the CMap database, and then the connection between STMN1-co-expressed gene signature and MST-321 was visualized as a heat map (Figure 5A). As expected, the STMN1-co-expressed gene signature can be reversed by MST-321 treatment. Interestingly, the STMN1-co-expressed gene signature was also reversed by STMN1-knockdown (Figure 5A), supporting the dependency of high-STMN1-expressing HCC cells on STMN1 gene expression.
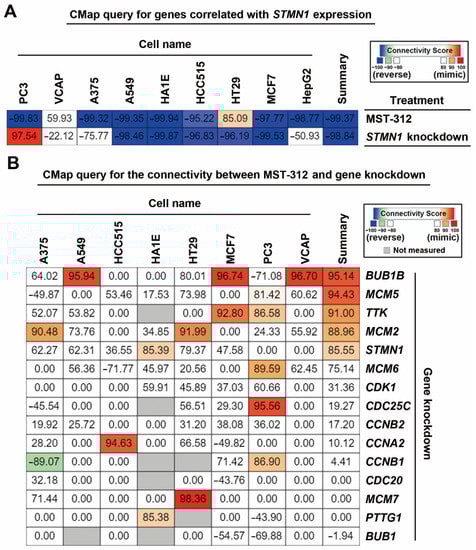
Figure 5.
Connectivity mapping for the STMN1-co-expressed genes: (A) Connections of STMN1-co-expression genes (57 common genes in TCGA-LIHC and Roessler Liver 2 datasets) with the MST-321 and STMN1 knockdown were analyzed through the CMap website; (B) Connections of MST-312 and the selective gene-knockdown signatures were obtained from the CMap website.
Because the CMap database contains gene signatures from drug-treated or shRNA/cDNA-transfected cancer cell lines [40], it can be used to explore the connections between drugs and genetic knockdown/overexpression. When querying the CMap database for the relationships between MST-312 and knockdown of STMN1-co-expressed gene signature, we found that MST-312 treatment was similar to knockdown of BUB1B, MCM2/5/6, TTK, and STMN1 (Figure 5B). Therefore, the anticancer potential of MST-321 against high-STMN1-expressing HCC cells may result from its inhibitory effect on DNA replication (MCM2/5/6) and mitosis (BUB1B, TTK, STMN1).
To validate our bioinformatics analyses, two HCC cell lines (PLC5 and HepG2) were used. The cell viability assay indicated that MST-312 was an effective anticancer drug against HCC cells (Figure 6A), which were associated with the induction of apoptosis as indicated by the cleavage of PARP1 (Figure 6B). MST-312 indeed inhibited the protein expression of STMN1, BUB1B, and MCM5 (Figure 6C). To further confirm the role of STMN1 in the anticancer activity of MST-312, stable STMN1-overexpressing HCC cells were established (Figure 6D). STMN1 overexpression enhanced the apoptosis-inducing activity of MST-312 as indicated by the cleavages of PARP1 and caspase 3 (Figure 6E), further supporting these findings. Taken together, MST-312 exhibits high anticancer activity against high-STMN1-expressing HCC cells.
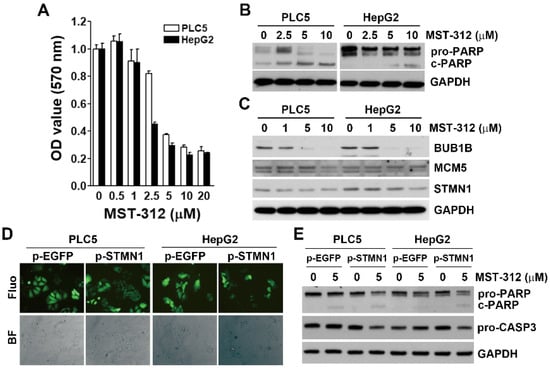
Figure 6.
Role of STMN1 in the in vitro anticancer effect of MTS-312: (A) PLC5 and HepG2 cells were treated with various doses of MST-312 for 72 h, and then cell viability was determined with Alamar Blue cell viability assay; (B) PLC5 and HepG2 cells were treated with the indicated concentrations of MST-312 for 72 h, and protein expression was determined by Western blotting; (C) PLC5 and HepG2 cells were treated with various doses of MST-312 for 24 h, and then protein expression was determined by Western blotting; (D) PLC5 and HepG2 cells were transfected with pcDNA3-STMN1-EGFP or pcDNA3-EGFP plasmid for 48 h and then selected with 1 mg/mL G418 for at least 3 months. The GFP fluorescence and cell morphology were observed under a fluorescence (Fluo) or bright-field (BF) microscope, respectively; (E) STMN1- and EGFP-overexpressing PLC5 and HepG2 cells were treated with 5 μM MST-312 for 72 h, and then protein expression was determined by Western blotting.
4. Discussion
We found that STMN1 overexpression in HCC was highly correlated with the overexpression of genes related to cell cycle progression, especially the mitosis stage. As a microtubule-destabilizing protein, fine-tuning of STMN1 activity controls spindle formation during mitosis, and both STMN1 overexpression and downregulation cause the failure of correct mitosis [18]. STMN1 is highly expressed in mitotic hepatocytes and promotes hepatocyte proliferation [46]. Because hepatocytes are the prime cells of origin for malignant transformation during HCC development [47], STMN1 upregulation may occur early during hepatocarcinogenesis.
MST-312 is synthesized as a telomerase inhibitor that can induce telomerase shortening and then inhibit cancer cell growth [48]. Telomerase, which is required for telomere synthesis, consists of telomerase RNA component (TERC) and telomerase reverse transcriptase (TERT). Telomerase activation due to TERT promoter mutation or TERT gene amplification is one of the earliest events during HCC development [49]. The oncogenic addiction of HCC cell lines to TERT was recently identified [50], suggesting that telomerase is an actionable therapeutic target of MST-312 for treating HCC.
The mechanism of STMN1 overexpression in HCC is still largely unclear. Previous studies demonstrate that the E2F transcription factor 1 (E2F1) is involved in STMN1 transactivation in HCC [51,52]. The E2F transcription factor family (E2F1-E2F8) plays a key role in cell cycle progression and proliferation and also integrates cell cycle progression with DNA repair, replication, and G2/M checkpoint via the coordination of related genes [53]. In addition, the overexpression of the E2F family, especially E2F1, and its oncogenic roles in HCC have been reported [54]. We speculated that the E2F family may contribute to the upregulation of STMN1 and its co-expressed genes. To confirm this possibility, the 57 STMN1-co-expressed genes commonly in TCGA-LIHC and Roessler Liver 2 datasets (Figure S3a) were analyzed for the upstream transcription factors using the WebGestalt online tool. Indeed, these genes contained the potential binding sites for the E2F family (Figure S3b).
Several limitations existed in this study. First, only bioinformatics and in vitro experimental analyses were performed. Further in vivo validation using animal models were required. Second, HepG2 is also referred to as a hepatoblastoma cell line [55], although the original publication indicates that it is derived from a liver hepatocellular carcinoma of a 15-year-old Caucasian male [56]. An additional HCC cell line would increase the data robustness. Third, this study only considered the STMN1-co-expressed genes. We could not exclude the potential roles of the genes negatively associated with STMN1 expression. Fourth, CMap database was employed to predict the effect of MST-312 on reversing the STMN1-co-expressed gene signature. Because signatures derived from multiple cancer cell types are usually conversed [40], the CMap database has been widely used for searching for drugs to treat various disease types in addition to cancers [57]. However, cell-type selective gene signatures still exist in 43% of compounds [40], which may be an additional limitation in this study.
In conclusion, this study integrated bioinformatics analysis to explore the role of STMN1 in HCC. We found that STMN1 overexpression is associated with the upregulation of genes related to cell cycle regulation. A telomerase inhibitor MST-312 was found to inhibit high-STMN1-expressing HCC cells via the reversal of the STMN1-co-expressed gene signature. Altogether, this study offers an insight into the therapeutic strategy for STMN1-overexpressing HCC patients.
Supplementary Materials
The following are available online at https://www.mdpi.com/article/10.3390/jpm11050332/s1, Table S1: The STMN1-co-expressed genes in hepatocellular carcinoma, Figure S1: The impact of STMN1 mRNA expression on the overall and disease-free survival of HCC patients, Figure S2: A dot plot showing the results of KEGG pathway enrichment in 4 datasets, Figure S3: Prediction of the upstream transcription regulators for STMN1-co-expressed genes.
Author Contributions
Conceptualization, S.-J.W. and P.-M.Y.; methodology, P.-M.Y.; validation, P.-M.Y.; formal analysis, S.-J.W. and P.-M.Y.; investigation, P.-M.Y.; resources, S.-J.W., P.-M.Y.; data curation, P.-M.Y.; writing—original draft preparation, S.-J.W. and P.-M.Y.; writing—review and editing, P.-M.Y.; visualization, S.-J.W. and P.-M.Y.; supervision, P.-M.Y.; funding acquisition, S.-J.W. and P.-M.Y.; project administration, P.-M.Y. All authors have read and agreed to the published version of the manuscript.
Funding
This research was funded by Yuan’s General Hospital, grant number 109YGH-TMU-04; Ministry of Science and Technology, grant number MOST109-2314-B-038-040; and Health and welfare surcharge of tobacco products, grant number MOHW110-TDU-B-212-144020.
Institutional Review Board Statement
Not applicable.
Informed Consent Statement
Not applicable.
Data Availability Statement
The datasets used in this article are publicly available as described in Section 2.
Acknowledgments
We thank the financial support from the TMU Research Center of Cancer Translational Medicine (The Featured Areas Research Center Program within the framework of the Higher Education Sprout Project by the Ministry of Education in Taiwan) and WanFang Hospital, Chi-Mei Medical Center, and the Hualien Tzu-Chi Hospital Joint Cancer Center Grant—Focus on Colon Cancer Research (the health and welfare surcharge of tobacco products of Taiwan).
Conflicts of Interest
The authors declare no conflict of interest.
References
- Parkin, D.M.; Bray, F.; Ferlay, J.; Pisani, P. Estimating the world cancer burden: Globocan 2000. Int. J. Cancer 2001, 94, 153–156. [Google Scholar] [CrossRef] [PubMed]
- Roberts, J.P. Tumor surveillance-what can and should be done? Screening for recurrence of hepatocellular carcinoma after liver transplantation. Liver Transplant. 2005, 11, S45–S46. [Google Scholar] [CrossRef] [PubMed]
- Blum, H.E. Hepatocellular carcinoma: Therapy and prevention. World J. Gastroenterol. 2005, 11, 7391. [Google Scholar] [CrossRef] [PubMed]
- Llovet, J.M.; Ricci, S.; Mazzaferro, V.; Hilgard, P.; Gane, E.; Blanc, J.F.; De Oliveira, A.C.; Santoro, A.; Raoul, J.L.; Forner, A.; et al. Sorafenib in Advanced Hepatocellular Carcinoma. N. Engl. J. Med. 2008, 359, 378–390. [Google Scholar] [CrossRef]
- Bruix, J.; Qin, S.; Merle, P.; Granito, A.; Huang, Y.-H.; Bodoky, G.; Pracht, M.; Yokosuka, O.; Rosmorduc, O.; Breder, V.; et al. Regorafenib for patients with hepatocellular carcinoma who progressed on sorafenib treatment (RESORCE): A randomised, double-blind, placebo-controlled, phase 3 trial. Lancet 2017, 389, 56–66. [Google Scholar] [CrossRef]
- Kudo, M.; Finn, R.S.; Qin, S.; Han, K.-H.; Ikeda, K.; Piscaglia, F.; Baron, A.; Park, J.-W.; Han, G.; Jassem, J.; et al. Lenvatinib versus sorafenib in first-line treatment of patients with unresectable hepatocellular carcinoma: A randomised phase 3 non-inferiority trial. Lancet 2018, 391, 1163–1173. [Google Scholar] [CrossRef]
- Cheng, A.-L.; Kang, Y.-K.; Chen, Z.; Tsao, C.-J.; Qin, S.; Kim, J.S.; Luo, R.; Feng, J.; Ye, S.; Yang, T.-S.; et al. Efficacy and safety of sorafenib in patients in the Asia-Pacific region with advanced hepatocellular carcinoma: A phase III randomised, double-blind, placebo-controlled trial. Lancet Oncol. 2009, 10, 25–34. [Google Scholar] [CrossRef]
- Zhu, X.X.; Kozarsky, K.; Strahler, J.R.; Eckerskorn, C.; Lottspeich, F.; Melhem, R.; Lowe, J.; A Fox, D.; Hanash, S.M.; Atweh, G.F. Molecular Cloning of A Novel Human Leukemia-Associated Gene. J. Biol. Chem. 1989, 264, 14556–14560. [Google Scholar] [CrossRef]
- Baldassarre, G.; Belletti, B.; Nicoloso, M.S.; Schiappacassi, M.; Vecchione, A.; Spessotto, P.; Morrione, A.; Canzonieri, V.; Colombatti, A. p27Kip1-stathmin interaction influences sarcoma cell migration and invasion. Cancer Cell 2005, 7, 51–63. [Google Scholar] [CrossRef]
- Jourdain, L.; Curmi, P.; Sobel, A.; Pantaloni, M.; Carlier, M.-F. Stathmin: A Tubulin-Sequestering Protein Which Forms a Ternary T2S Complex with Two Tubulin Molecules†. Biochemistry 1997, 36, 10817–10821. [Google Scholar] [CrossRef]
- Cassimeris, L. The oncoprotein 18/stathmin family of microtubule destabilizers. Curr. Opin. Cell Biol. 2002, 14, 18–24. [Google Scholar] [CrossRef]
- Larsson, N.; Marklund, U.; Gradin, H.M.; Brattsand, G.; Gullberg, M. Control of microtubule dynamics by oncoprotein 18: Dissection of the regulatory role of multisite phosphorylation during mitosis. Mol. Cell. Biol. 1997, 17, 5530–5539. [Google Scholar] [CrossRef] [PubMed]
- Belletti, B.; Nicoloso, M.S.; Schiappacassi, M.; Berton, S.; Lovat, F.; Wolf, K.; Canzonieri, V.; D’Andrea, S.; Zucchetto, A.; Friedl, P.; et al. Stathmin Activity Influences Sarcoma Cell Shape, Motility, and Metastatic Potential. Mol. Biol. Cell 2008, 19, 2003–2013. [Google Scholar] [CrossRef] [PubMed]
- Nemunaitis, J. Stathmin 1: A protein with many tasks. New biomarker and potential target in cancer. Expert Opin. Ther. Targets 2012, 16, 631–634. [Google Scholar] [CrossRef]
- Hsieh, S.-Y.; Huang, S.-F.; Yu, M.-C.; Yeh, T.-S.; Chen, T.-C.; Lin, Y.-J.; Chang, C.-J.; Sung, C.-M.; Lee, Y.-L.; Hsu, C.-Y. Stathmin1 overexpression associated with polyploidy, tumor-cell invasion, early recurrence, and poor prognosis in human hepatoma. Mol. Carcinog. 2010, 49, 476–487. [Google Scholar] [CrossRef] [PubMed]
- Singer, S.; Ehemann, V.; Brauckhoff, A.; Keith, M.; Vreden, S.; Schirmacher, P.; Breuhahn, K. Protumorigenic overexpression of stathmin/Op18 by gain-of-function mutation in p53 in human hepatocarcinogenesis. Hepatology 2007, 46, 759–768. [Google Scholar] [CrossRef]
- Yuan, R.-H.; Jeng, Y.-M.; Chen, H.-L.; Lai, P.-L.; Pan, H.-W.; Hsieh, F.-J.; Lin, C.-Y.; Lee, P.-H.; Hsu, H.-C. Stathmin overexpression cooperates with p53 mutation and osteopontin overexpression, and is associated with tumour progression, early recurrence, and poor prognosis in hepatocellular carcinoma. J. Pathol. 2006, 209, 549–558. [Google Scholar] [CrossRef]
- Belletti, B.; Baldassarre, G. Stathmin: A protein with many tasks. New biomarker and potential target in cancer. Expert Opin. Ther. Targets 2011, 15, 1249–1266. [Google Scholar] [CrossRef]
- Biaoxue, R.; Xiguang, C.; Hua, L.; Shuanying, Y. Stathmin-dependent molecular targeting therapy for malignant tumor: The latest 5 years’ discoveries and developments. J. Transl. Med. 2016, 14, 1–18. [Google Scholar] [CrossRef]
- Rana, S.; Maples, P.B.; Senzer, N.; Nemunaitis, J. Stathmin 1: A novel therapeutic target for anticancer activity. Expert Rev. Anticancer Ther. 2008, 8, 1461–1470. [Google Scholar] [CrossRef]
- Chen, Y.; Lin, M.C.; Yao, H.; Wang, H.; Zhang, A.-Q.; Yu, J.; Hui, C.-K.; Lau, G.K.; He, M.-L.; Sung, J.; et al. Lentivirus-mediated RNA interference targeting enhancer of zeste homolog 2 inhibits hepatocellular carcinoma growth through down-regulation of stathmin. Hepatology 2007, 46, 200–208. [Google Scholar] [CrossRef]
- Tseng, Y.-H.; Huang, Y.-H.; Lin, T.-K.; Wu, S.-M.; Chi, H.-C.; Tsai, C.-Y.; Tsai, M.-M.; Lin, Y.-H.; Chang, W.-C.; Chang, Y.-T.; et al. Thyroid hormone suppresses expression of stathmin and associated tumor growth in hepatocellular carcinoma. Sci. Rep. 2016, 6, 38756. [Google Scholar] [CrossRef]
- Wang, X.; Chen, Y.; Han, Q.-B.; Chan, C.-Y.; Wang, H.; Liu, Z.; Cheng, C.H.-K.; Yew, D.T.; Lin, M.C.; He, M.-L.; et al. Proteomic identification of molecular targets of gambogic acid: Role of stathmin in hepatocellular carcinoma. Proteomics 2009, 9, 242–253. [Google Scholar] [CrossRef]
- Lu, N.T.; Liu, N.M.; Patel, D.; Vu, J.Q.; Liu, L.; Kim, C.Y.; Cho, P.; Khachatoorian, R.; Patel, N.; E Magyar, C.; et al. Oncoprotein Stathmin Modulates Sensitivity to Apoptosis in Hepatocellular Carcinoma Cells During Hepatitis C Viral Replication. J. Cell Death 2018, 11, 1179066018785141. [Google Scholar] [CrossRef]
- Rodriguez, O.C.; Schaefer, A.W.; Mandato, C.A.; Forscher, P.; Bement, W.M.; Waterman-Storer, C.M. Conserved microtubule–actin interactions in cell movement and morphogenesis. Nat. Cell Biol. 2003, 5, 599–609. [Google Scholar] [CrossRef] [PubMed]
- Cerami, E.; Gao, J.; Dogrusoz, U.; Gross, B.E.; Sumer, S.O.; Aksoy, B.A.; Jacobsen, A.; Byrne, C.J.; Heuer, M.L.; Larsson, E.; et al. The cBio Cancer Genomics Portal: An Open Platform for Exploring Multidimensional Cancer Genomics Data: Figure 1. Cancer Discov. 2012, 2, 401–404. [Google Scholar] [CrossRef] [PubMed]
- Gao, J.; Aksoy, B.A.; Dogrusoz, U.; Dresdner, G.; Gross, B.; Sumer, S.O.; Sun, Y.; Jacobsen, A.; Sinha, R.; Larsson, E.; et al. Integrative Analysis of Complex Cancer Genomics and Clinical Profiles Using the cBioPortal. Sci. Signal. 2013, 6, pl1. [Google Scholar] [CrossRef] [PubMed]
- Tang, Z.; Kang, B.; Li, C.; Chen, T.; Zhang, Z. GEPIA2: An enhanced web server for large-scale expression profiling and interactive analysis. Nucleic Acids Res. 2019, 47, W556–W560. [Google Scholar] [CrossRef] [PubMed]
- Sanchez-Vega, F.; Mina, M.; Armenia, J.; Chatila, W.K.; Luna, A.; La, K.C.; Dimitriadoy, S.; Liu, D.L.; Kantheti, H.S.; Saghafinia, S.; et al. Oncogenic Signaling Pathways in The Cancer Genome Atlas. Cell 2018, 173, 321–337.e10. [Google Scholar] [CrossRef]
- Chen, X.; Cheung, S.T.; So, S.; Fan, S.T.; Barry, C.; Higgins, J.; Lai, K.-M.; Ji, J.; Dudoit, S.; Ng, I.O.; et al. Gene Expression Patterns in Human Liver Cancers. Mol. Biol. Cell 2002, 13, 1929–1939. [Google Scholar] [CrossRef]
- Roessler, S.; Jia, H.-L.; Budhu, A.; Forgues, M.; Ye, Q.-H.; Lee, J.-S.; Thorgeirsson, S.S.; Sun, Z.; Tang, Z.-Y.; Qin, L.-X.; et al. A Unique Metastasis Gene Signature Enables Prediction of Tumor Relapse in Early-Stage Hepatocellular Carcinoma Patients. Cancer Res. 2010, 70, 10202–10212. [Google Scholar] [CrossRef]
- Wurmbach, E.; Chen, Y.-B.; Khitrov, G.; Zhang, W.; Roayaie, S.; Schwartz, M.; Fiel, I.; Thung, S.; Mazzaferro, V.; Bruix, J.; et al. Genome-wide molecular profiles of HCV-induced dysplasia and hepatocellular carcinoma. Hepatology 2007, 45, 938–947. [Google Scholar] [CrossRef]
- Liao, Y.; Wang, J.; Jaehnig, E.J.; Shi, Z.; Zhang, B. WebGestalt 2019: Gene set analysis toolkit with revamped UIs and APIs. Nucleic Acids Res. 2019, 47, W199–W205. [Google Scholar] [CrossRef]
- Yu, G.; Wang, L.-G.; Han, Y.; He, Q.-Y. clusterProfiler: An R Package for Comparing Biological Themes Among Gene Clusters. OMICS A J. Integr. Biol. 2012, 16, 284–287. [Google Scholar] [CrossRef] [PubMed]
- Basu, A.; Bodycombe, N.E.; Cheah, J.H.; Price, E.V.; Liu, K.; Schaefer, G.I.; Ebright, R.Y.; Stewart, M.L.; Ito, D.; Wang, S.; et al. An Interactive Resource to Identify Cancer Genetic and Lineage Dependencies Targeted by Small Molecules. Cell 2013, 154, 1151–1161. [Google Scholar] [CrossRef]
- Rees, M.G.; Seashore-Ludlow, B.; Cheah, J.H.; Adams, D.J.; Price, E.V.; Gill, S.; Javaid, S.; Coletti, M.E.; Jones, V.L.; Bodycombe, N.E.; et al. Correlating chemical sensitivity and basal gene expression reveals mechanism of action. Nat. Chem. Biol. 2016, 12, 109–116. [Google Scholar] [CrossRef] [PubMed]
- Seashore-Ludlow, B.; Rees, M.G.; Cheah, J.H.; Cokol, M.; Price, E.V.; Coletti, M.E.; Jones, V.; Bodycombe, N.E.; Soule, C.K.; Gould, J.; et al. Harnessing Connectivity in a Large-Scale Small-Molecule Sensitivity Dataset. Cancer Discov. 2015, 5, 1210–1223. [Google Scholar] [CrossRef]
- Rajapakse, V.N.; Luna, A.; Yamade, M.; Loman, L.; Varma, S.; Sunshine, M.; Iorio, F.; Sousa, F.G.; Elloumi, F.; Aladjem, M.I.; et al. CellMinerCDB for Integrative Cross-Database Genomics and Pharmacogenomics Analyses of Cancer Cell Lines. iScience 2018, 10, 247–264. [Google Scholar] [CrossRef]
- Tsherniak, A.; Vazquez, F.; Montgomery, P.G.; Weir, B.A.; Kryukov, G.; Cowley, G.S.; Gill, S.; Harrington, W.F.; Pantel, S.; Krill-Burger, J.M.; et al. Defining a Cancer Dependency Map. Cell 2017, 170, 564–576.e16. [Google Scholar] [CrossRef]
- Subramanian, A.; Narayan, R.; Corsello, S.M.; Peck, D.D.; Natoli, T.E.; Lu, X.; Gould, J.; Davis, J.F.; Tubelli, A.A.; Asiedu, J.K.; et al. A Next Generation Connectivity Map: L1000 Platform and the First 1,000,000 Profiles. Cell 2017, 171, 1437–1452.e17. [Google Scholar] [CrossRef] [PubMed]
- Ringhoff, D.N.; Cassimeris, L. Stathmin Regulates Centrosomal Nucleation of Microtubules and Tubulin Dimer/Polymer Partitioning. Mol. Biol. Cell 2009, 20, 3451–3458. [Google Scholar] [CrossRef]
- Leung, S.W.; Chou, C.-J.; Huang, T.-C.; Yang, P.-M. An Integrated Bioinformatics Analysis Repurposes an Antihelminthic Drug Niclosamide for Treating HMGA2-Overexpressing Human Colorectal Cancer. Cancers 2019, 11, 1482. [Google Scholar] [CrossRef]
- Ahn, E.Y.; Yoo, J.E.; Rhee, H.; Kim, M.S.; Choi, J.; Ko, J.E.; Lee, J.S.; Park, Y.N. Increased expression of stathmin and elongation factor 1α in precancerous nodules with telomere dysfunction in hepatitis B viral cirrhotic patients. J. Transl. Med. 2014, 12, 154. [Google Scholar] [CrossRef]
- Liu, Y.; Gan, L.; Guo, K.; Li, Y.; Kang, X.; Sun, L.; Shu, H.; Liu, Y. Up-regulated expression of stathmin may be associated with hepatocarcinogenesis. Oncol. Rep. 2010, 23, 1037–1043. [Google Scholar] [CrossRef]
- Li, C.; Tan, Y.-X.; Zhou, H.; Ding, S.-J.; Li, S.-J.; Ma, D.-J.; Man, X.-B.; Hong, Y.; Zhang, L.; Li, L.; et al. Proteomic analysis of hepatitis B virus-associated hepatocellular carcinoma: Identification of potential tumor markers. Proteomics 2005, 5, 1125–1139. [Google Scholar] [CrossRef]
- Zhao, E.; Shen, Y.; Amir, M.; Farris, A.B.; Czaja, M.J. Stathmin 1 Induces Murine Hepatocyte Proliferation and Increased Liver Mass. Hepatol. Commun. 2019, 4, 38–49. [Google Scholar] [CrossRef] [PubMed]
- Marquardt, J.U. Deconvolution of the cellular origin in hepatocellular carcinoma: Hepatocytes take the center stage. Hepatology 2016, 64, 1020–1023. [Google Scholar] [CrossRef] [PubMed]
- Seimiya, H.; Oh-Hara, T.; Suzuki, T.; Naasani, I.; Shimazaki, T.; Tsuchiya, K.; Tsuruo, T. Telomere shortening and growth inhibition of human cancer cells by novel synthetic telomerase inhibitors MST-312, MST-295, and MST-1991. Mol. Cancer Ther. 2002, 1, 657–665. [Google Scholar] [PubMed]
- Zucman-Rossi, J.; Villanueva, A.; Nault, J.-C.; Llovet, J.M. Genetic Landscape and Biomarkers of Hepatocellular Carcinoma. Gastroenterology 2015, 149, 1226–1239.e4. [Google Scholar] [CrossRef] [PubMed]
- Ningarhari, M.; Caruso, S.; Hirsch, T.Z.; Bayard, Q.; Franconi, A.; Védie, A.-L.; Noblet, B.; Blanc, J.-F.; Amaddeo, G.; Ganne, N.; et al. Telomere length is key to hepatocellular carcinoma diversity and telomerase addiction is an actionable therapeutic target. J. Hepatol. 2021, 74, 1155–1166. [Google Scholar] [CrossRef] [PubMed]
- Chen, Y.-L.; Uen, Y.-H.; Li, C.-F.; Horng, K.-C.; Chen, L.-R.; Wu, W.-R.; Tseng, H.-Y.; Huang, H.-Y.; Wu, L.-C.; Shiue, Y.-L. The E2F Transcription Factor 1 Transactives Stathmin 1 in Hepatocellular Carcinoma. Ann. Surg. Oncol. 2012, 20, 4041–4054. [Google Scholar] [CrossRef] [PubMed]
- Drucker, E.; Holzer, K.; Pusch, S.; Winkler, J.; Calvisi, D.F.; Eiteneuer, E.; Herpel, E.; Goeppert, B.; Roessler, S.; Ori, A.; et al. Karyopherin α2-dependent import of E2F1 and TFDP1 maintains protumorigenic stathmin expression in liver cancer. Cell Commun. Signal. 2019, 17, 1–14. [Google Scholar] [CrossRef] [PubMed]
- Ren, B.; Cam, H.; Takahashi, Y.; Volkert, T.; Terragni, J.; Young, R.A.; Dynlacht, B.D. E2F integrates cell cycle progression with DNA repair, replication, and G2/M checkpoints. Genes Dev. 2002, 16, 245–256. [Google Scholar] [CrossRef]
- Huntington, J.T.; Tang, X.; Kent, L.N.; Schmidt, C.R.; Leone, G. The Spectrum of E2F in Liver Disease-Mediated Regulation in Biology and Cancer. J. Cell. Physiol. 2016, 231, 1438–1449. [Google Scholar] [CrossRef] [PubMed]
- López-Terrada, D.; Cheung, S.W.; Finegold, M.J.; Knowles, B.B. Hep G2 is a hepatoblastoma-derived cell line. Hum. Pathol. 2009, 40, 1512–1515. [Google Scholar] [CrossRef]
- Knowles, B.B.; Howe, C.C.; Aden, D.P. Human hepatocellular carcinoma cell lines secrete the major plasma proteins and hepatitis B surface antigen. Science 1980, 209, 497–499. [Google Scholar] [CrossRef] [PubMed]
- Keenan, A.B.; Wojciechowicz, M.L.; Wang, Z.; Jagodnik, K.M.; Jenkins, S.L.; Lachmann, A.; Ma’Ayan, A. Connectivity Mapping: Methods and Applications. Annu. Rev. Biomed. Data Sci. 2019, 2, 69–92. [Google Scholar] [CrossRef]
Publisher’s Note: MDPI stays neutral with regard to jurisdictional claims in published maps and institutional affiliations. |
© 2021 by the authors. Licensee MDPI, Basel, Switzerland. This article is an open access article distributed under the terms and conditions of the Creative Commons Attribution (CC BY) license (https://creativecommons.org/licenses/by/4.0/).