1. Introduction
Severe asthma is a major global cause of morbidity and healthcare costs [
1]. More than 60% of adults with asthma, have uncontrolled, symptomatic asthma [
2]. There is an acute need for advances in pharmacologic therapies and pharmacogenetics in asthma to improve the identification of novel drug targets [
3]. In a randomized clinical trial repurposing imatinib, a tyrosine kinase inhibitor of the KIT proto-oncogene receptor tyrosine kinase, for severe asthma, imatinib use improved forced expiratory volume in 1 s (FEV
1) compared to placebo treatment [
4]. KIT is the receptor for stem cell factor; soluble stem cell factor levels are increased in the serum of asthmatics and correlate with asthma severity [
5]. In that trial, imatinib-treated patients with the greatest increases in FEV
1 had higher baseline bronchoalveolar lavage neutrophil counts, suggesting that imatinib may particularly benefit non-eosinophilic asthmatics.
Patients with non-eosinophilic asthma phenotypes report poor disease control despite multiple controller medications and have limited treatment options [
6]. Despite significant advances in asthma treatment over the past decade, biomarkers and available biologics (e.g., anti-IgE, anti-interleukin (IL)-5, anti-IL-4R) are primarily directed to eosinophilic phenotypes [
7]. Therefore, clinicians face a dual challenge in treating non-eosinophilic asthma: lack of data-guided therapy and limited therapeutic interventions.
Systems biology analytic approaches are designed to capture complex biological interactions that may inform a particular clinical phenotype [
8]. The application of these quantitative tools can identify biological pathways or components of those pathways that predict phenotypes/endotypes, biomarkers and drug interventions [
3]. Clinically meaningful findings may contribute to personalized approaches to care. In this pilot study, we conducted a network analysis of bronchial epithelium gene expression to characterize the phenotypes of severe asthma patients with, and without, lung function change following imatinib treatment.
2. Materials and Methods
We performed low input RNA-seq on bronchial brushing samples obtained from patients enrolled in the KIT Inhibition by Imatinib in Patients with Severe Refractory Asthma (KIA) trial [
1]. Ten imatinib-treated patient samples and 14 placebo-treated patient samples were analyzed. We defined clinical response to imatinib treatment as an increase of ≥5% between baseline and post-imatinib FEV
1 measurements.
To identify changes in gene expression by imatinib treatment, we first performed differential expression (DE) analysis (paired t-test) on normalized data from all paired samples between pre-and post-imatinib and pre- and post- placebo treatments. To account for false positive expressions related to placebo effects, we removed genes that were significantly DE and had the same direction of effect in both placebo and imatinib-treated groups. The Benjamini-Hochberg method was used to control the false discovery rate.
We, then, constructed personalized perturbation profiles (PEEPs) from the gene expression data using genes uniquely expressed in imatinib-treated patients [
9]. PEEP methodology addresses the genetic heterogeneity of complex diseases, such as asthma, by characterizing gene expression patterns at the individual patient level. For each individual in the imatinib treatment (case) group, PEEP compares the expression level of a gene to a reference distribution of the expression level of that same gene in the placebo (control) group. The resulting deviation, calculated as a z-score, is positive if the gene is overexpressed with respect to the control distribution, and negative otherwise. This analytic approach has been validated in asthma, among other chronic diseases [
9]. Using PEEP, we identified post-imatinib gene expression changes at the level of single individuals, compared to baseline gene expression in the pre-imatinib patient population. Based on the PEEP analysis results, we then conducted a hierarchical clustering using the average method and Euclidean distance metric. We examined the association of these profiles with patient phenotypes with and without meaningful clinical improvements in FEV
1.
Next, to reduce the false positives and account for fluctuations in expression levels, only genes with absolute z-score of 2 or above are selected as differentially expressed in the individual profiles. We identified biological processes upregulated or repressed across the imatinib-treated population using pathway enrichment analysis (Enrichr, g:Profiler) on genes with z-scores above 2 and z-scores below −2 [
10]. We used a functional protein-protein interaction (PPI) network (HumanNet-FN) [
11] to identify a disease module (gene set related to the imatinib response phenotype that forms a connected component) as a means of identifying potentially relevant pathways, rather than individual genes, that might not otherwise be detected with DE alone. Finally, we measured the distances between genes of these pathways to genes from patients with greatest increases in FEV
1, and to genes from patients without improvement in FEV
1. Genes in close proximity within protein-protein interaction networks have been found to demonstrate similar biological functions [
12].
3. Results
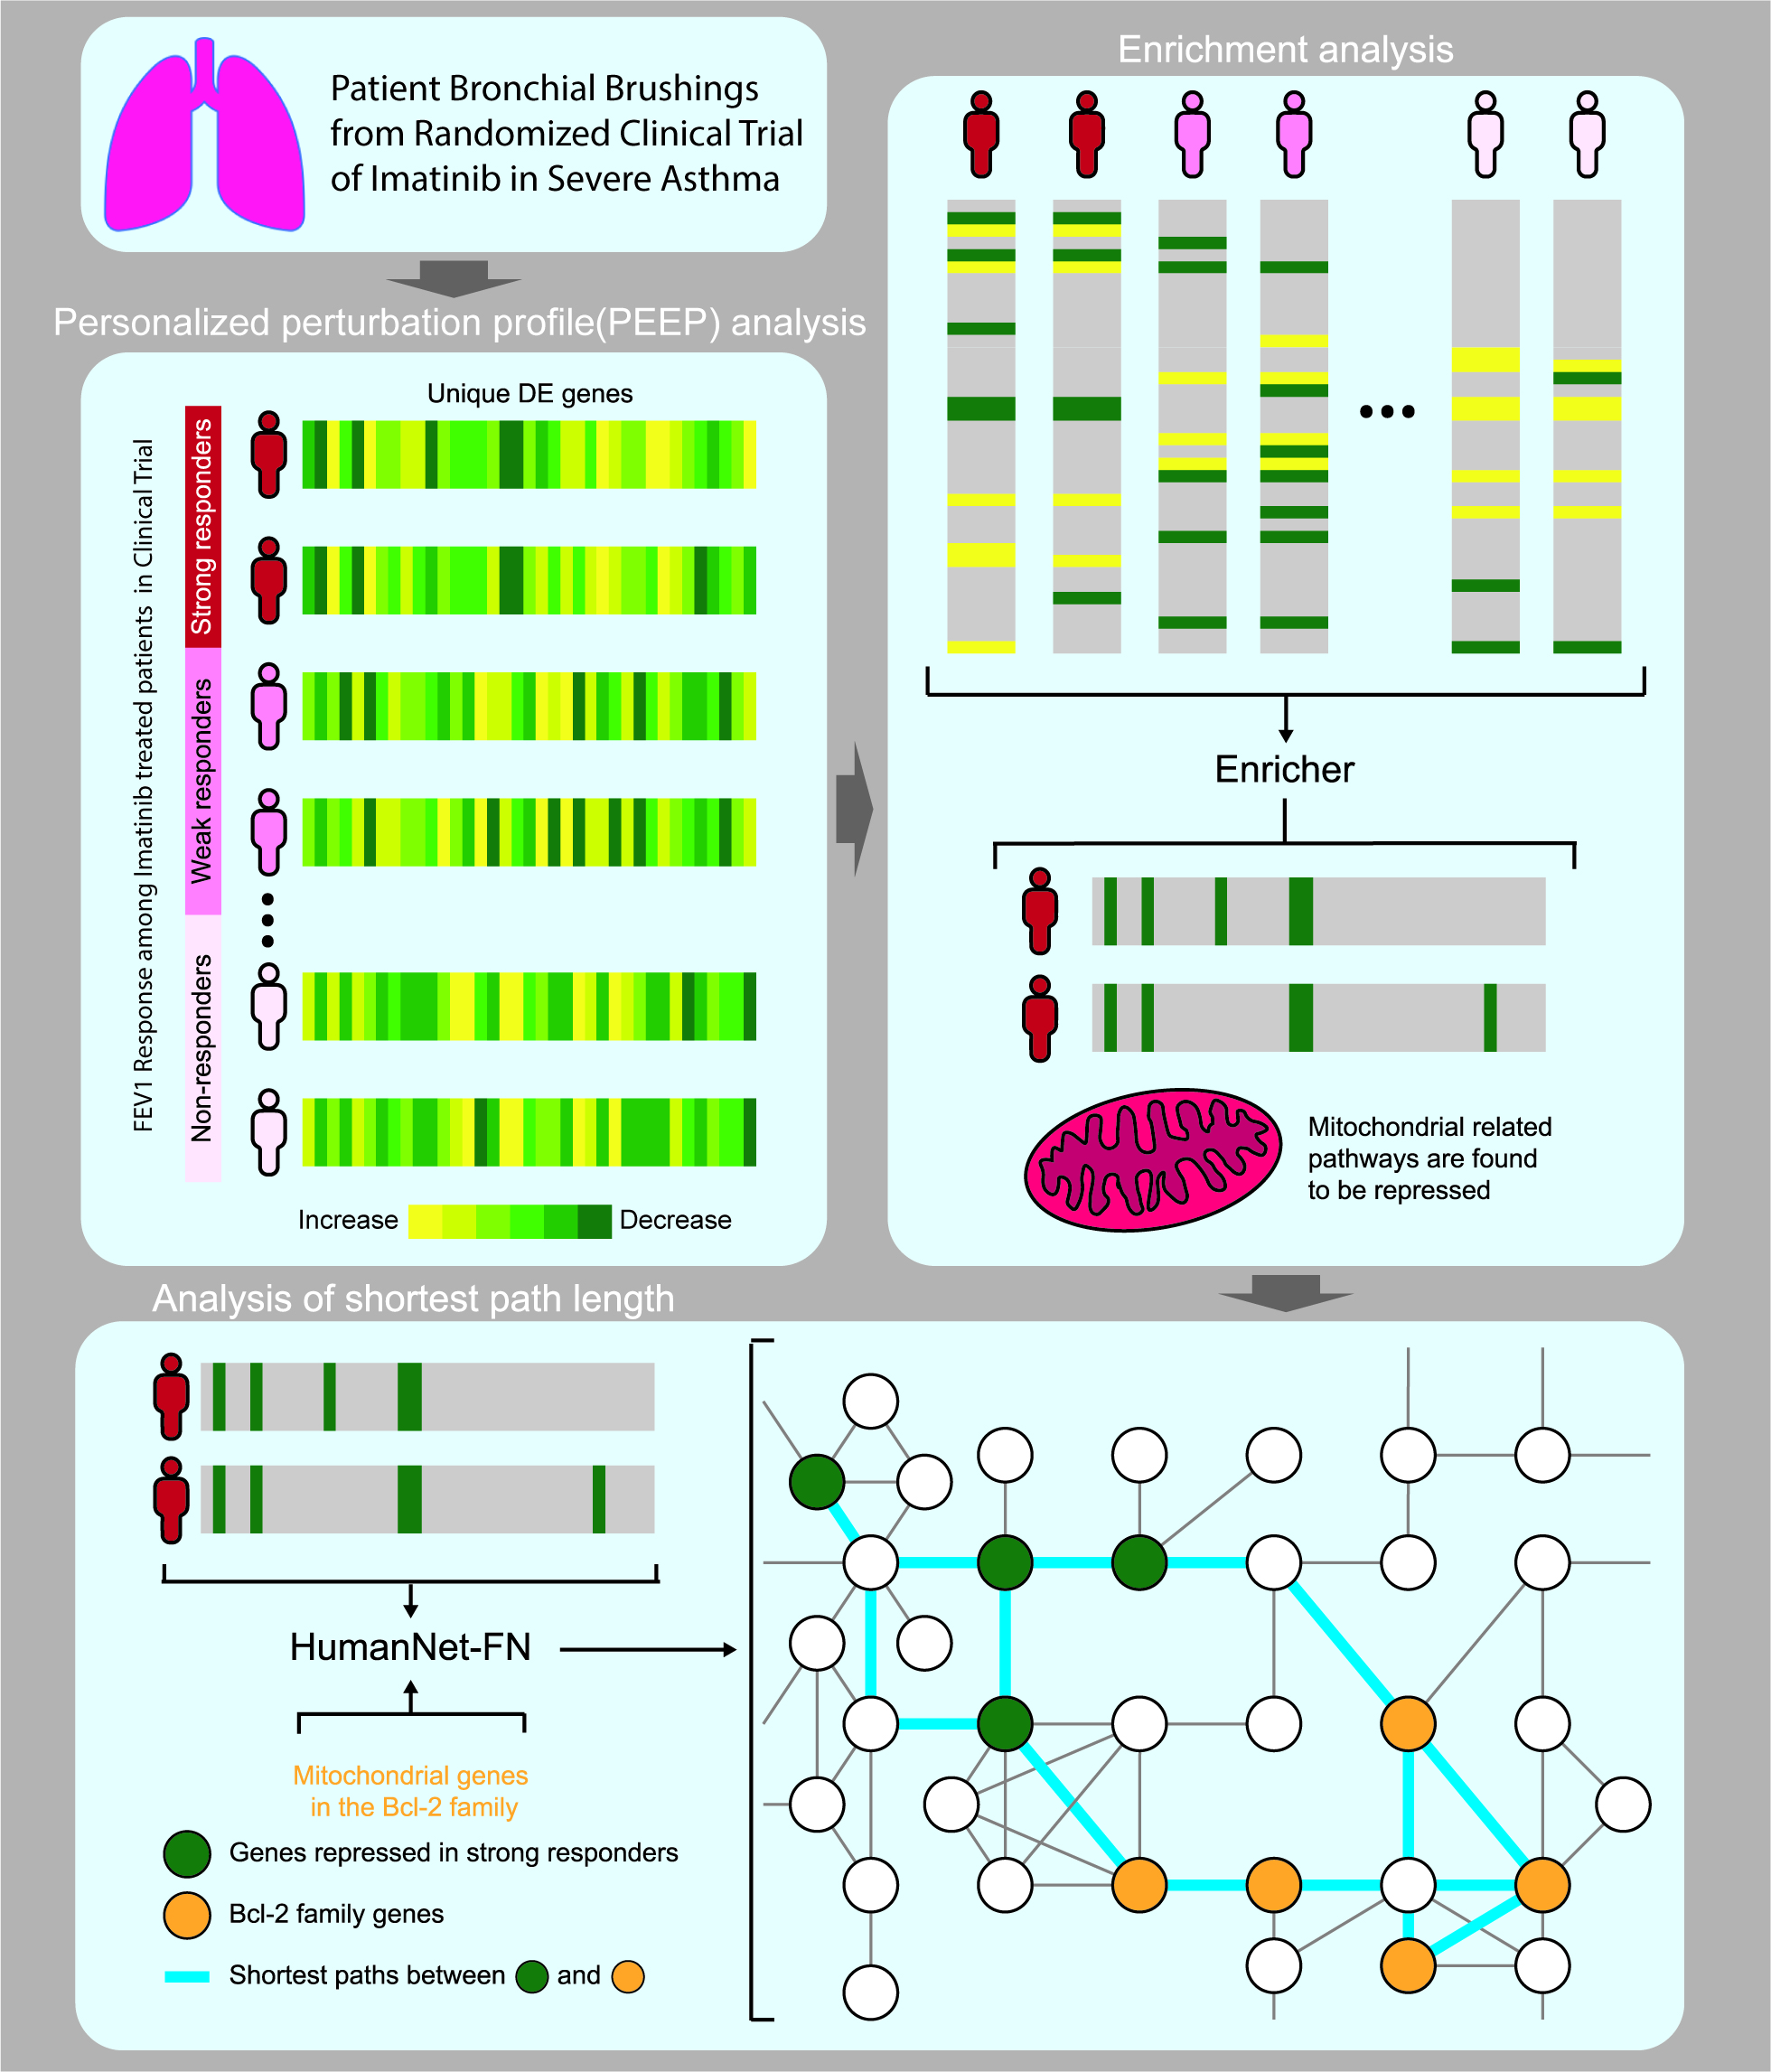
3.1. Personalized Perturbation Profile (PEEP) Analysis
At baseline, there were no significant clinical differences between the imatinib and placebo-treated subsets with regards to demographics, FEV
1, markers of airway hyperresponsiveness, inflammation, and Asthma Control Questionnaire (ACQ-6) score (
Table 1).
Paired
t-testing from the RNA-seq data yielded 557 genes that were differentially expressed in the imatinib treated group at a nominal level of significance (
p-value ≤ 0.05) (
Supplementary Table S1). PEEP analysis on these genes resulted in a unique expression profile for each patient (
n = 10) (
Figure 1). Differences in the gene expression profiles based on PEEP analysis between imatinib and placebo-treated patients is depicted in
Figure 2.
3.2. Hierarchical Clustering Based on PEEP
Unsupervised clustering on the gene expression profiles of the 557 genes based on the PEEP analysis identified that patients with FEV
1 improvement on imatinib (
n = 5) shared similar profiles (
Figure 3). Clustering yielded distinct groups of patients corresponding to percent change in FEV
1: Two patients (green; entitled strong responders relative to the other groups) had an improvement greater than 20% while three patients (yellow; entitled weak responders) had a 5–10% increase in FEV
1 and five patients (in gray) had <5% response (entitled non-responders). The FEV1 response is a continuous variable [
13]; therefore cut-offs for analyses were objectively based on the clustering results and not pre-specified. In an exploratory analysis, we found that the average decrease in serum tryptase during between pre- and post-treatment visits was greatest among FEV
1 strong responders, lower for weak responders, and least among non-responders (
Supplementary Figure S1).
Profiles of weak responders shared no common genes with z-scores above 2 or below −2 and there were no common up- or down-regulated pathways. Similarly, imatinib-treated patients without improvement in FEV1 shared no common up- or down-regulated biological processes, suggesting that the lack of drug response in these patients may stem from heterogenous factors.
In contrast, we found four genes were commonly repressed across the strong responders compared to the imatinib-treated population in the PEEP analysis: MPV17L2 (
p = 0.02), CNIH2 (
p = 0.02), AP1M2 (
p = 0.04), PTPMT1 (
p = 0.04). We found that these strong responders uniquely shared multiple downregulated mitochondrial-related pathways, such as mitochondrial ribosome assembly, gene expression, and localization (
Supplementary Table S2). Among weak responders, and non-responders, none of these pathways were significantly affected.
3.3. Shortest Distance Analysis to Mitochondrial Genes
In the functional PPI mitochondrial genes in the Bcl-2 family measured in closer proximity to the shared, repressed genes of strong responders, than to genes of imatinib non-responders. In particular, mitochondrial genes BIK, BID3, BCLXL, MCL1 and BCLW of the anti-apoptotic subgroup measured closest to strong responders’ genes (
Figure 4).
4. Discussion
In this pilot study, we applied systems biology approaches to clinical trial data to study the heterogeneous response of patients with severe asthma to imatinib treatment. Applying PEEP to the genomic data on a subset of trial participants generated individual-level gene expression profiles of imatinib response. An analysis of these profiles identified a set of pathways and related genes that distinguished strong responders from weak responders, and from non-responders, based on FEV1 change with imatinib. Patients with improved lung function after treatment showed a set of uniquely repressed mitochondrial genes in their bronchial epithelium brushings.
There has been increasing attention on mitochondrial dysfunction in airway disease [
14]. Multiple features of mitochondrial function and structure have been implicated in the pathophysiology of asthma [
15,
16]. Altered homeostasis of mitochondrial biogenesis may lead to airway remodeling (e.g., increase in bronchial smooth muscle) that is characteristic of severe asthma [
17]. Similarly, reduced mitochondrial membrane potential and metabolic activity may play a role in fibroblasts and other cell populations contributing to the pathogenesis of fibrosis in severe asthma [
18,
19]. The non-eosinophilic phenotype is more common in severe asthma, suggesting that mitochondrial mechanisms may be particularly relevant in this domain. Mitochondrial membrane permeability and stability responds to environmental stressors [
14], as well as to mitochondrial products released from damaged mitochondria, which may be important in inflammasome-mediated mechanisms of non-eosinophilic asthma [
20]. Increasingly, bioinformatics [
19] and omics [
21] approaches are being used to elucidate the impact of genetic differences in mitochondrial dysfunction and airway disease. Our findings add to this growing literature and its relevance to novel therapeutics [
22]. Mitochondrial genes in the Bcl-2 family measured closer to the genes of strong responders in our PPI network. Bcl-2 proteins have previously been reported to be involved in mitochondrial stability [
23], and mediate imatinib chemosensitivity [
24]. The close proximity of these genes within the PPI network further supports the role of these pathways in airway response to imatinib.
The limitations to our pilot analysis include that we were only able to perform RNA-seq on a subset of responders and non-responders in the KIA trial. While our subjects were representative of trial participants, the relatively small sample size of many clinical trials like ours, and the heterogeneity of clinical response to treatment, constitute a challenge for traditional group-wise analyses. We accounted for the latter limitation by estimating individual-level variation with PEEP. Specifically, the PEEP study design uses two sets of controls in a robust analysis: Placebo-treated patients to eliminate false positive results and the individual-level comparison to eliminate between person variability. This approach likely contributes to our ability to see significant results despite a small sample size. Our use of PEEP highlights its potential for application in omics analysis of larger cohorts from future clinical trials to develop personalized phenotypes and targeted treatment—particularly in traditionally poorly understood disease states such as non-eosinophilic asthma.
5. Conclusions
Our results suggest a new role for mitochondrial pathways in airflow limitation in non-eosinophilic severe asthma and highlight these pathways as potential therapeutic targets. Large-scale clinical trials using imatinib are planned, setting the stage for the validation of these findings and addressing a pressing clinical need for additional treatment options for severe asthma [
25].
Supplementary Materials
The following are available online at
https://www.mdpi.com/article/10.3390/jpm11040240/s1, Table S1: Genes differentially expressed in imatinib-treated patients, Table S2: Pathway enrichment analysis results for patients with >20% improvement in forced expiratory volume in 1 s (FEV
1) after imatinib treatment, Figure S1: Change in serum tryptase by FEV1 response.
Author Contributions
Conceptualization, K.N.C., S.T.W., E.I., J.A.B., S.H.B. and D.F.; methodology, S.H.B., E.M., A.R., E.I. and S.T.W.; formal analysis, S.H.B., D.F., E.M., A.R.; writing—original draft preparation, D.F. and S.H.B.; writing—review and editing, E.I., J.A.B., S.T.W. and K.N.C.; visualization, S.H.B., E.M. and A.R.; supervision, S.T.W.; project administration, D.F.; funding acquisition, E.I., S.T.W., J.A.B.; S.H.B. and D.F. contributed equally as co-first authors. All authors have read and agreed to the published version of the manuscript.
Funding
This research was funded by the NIH, grant numbers: T32AI007306-33, AI078908, HL11113, HL117945, R37AI052353, R01AI136041, R01HL136209, R01AI130109, U19AO095219, K23AI118804.
Institutional Review Board Statement
The KIA study was conducted according to the guidelines of the Declaration of Helsinki, and approved by the Institutional Review Board of Brigham and Women’s Hospital (Clinical Trial Protocol KIA—0016; CR 6/2015).
Informed Consent Statement
Written informed consent was obtained from all subjects involved in the KIA study.
Acknowledgments
We gratefully acknowledge the contributions of the late Amitabh Sharma to this work. The KIA study was approved by the Brigham and Women’s Hospital IRB and funded by U01HL102225; imatinib was provided by Novartis.
Conflicts of Interest
The authors declare that the research was conducted in the absence of any commercial or financial relationships that could be construed as a potential conflict of interest. S.H.B., D.F., E.M., A.R. have no relevant conflict of interest to disclose. K.N.C. has served as an advisory board member for TEVA, Regeneron, Novartis, Optinose, GlaxoSmithKline, Sanofi-Pasteur, Genentech, and Blueprint Medicines and reports personal fees from Novartis, Third Harmonic, and Ribon Therapeutics. E.I. reports personal fees from AB Science, Allergy and Asthma Network (AAN PCORI), Biometry, Equillium, Merck, NHLBI, 4D Pharma, Pneuma Respiratory, PPS Health, Regeneron, Sanofi Genzyme, Sienna Biopharmaceutical, grants, personal fees and non-financial support from Genentech, grants and personal fees from Amgen, AstraZeneca, Avillion, Novartis, personal fees and non-financial support from GlaxoSmithKline, TEVA, grants from Gossamer Bio, grants and non-financial support from Circassia, non-financial support from Boehringer Ingelheim, other from Vorso Corp, outside the submitted work. J.A.B. has served as a scientific advisory board member for Sanofi-Regeneron, Third Harmonic Bio, and Siolata Therapeutics. S.T.W. reports receiving authorship payment from UpToDate. The funders had no role in the design of the study; in the collection, analyses, or interpretation of data; in the writing of the manuscript, or in the decision to publish the results.
References
- Carr, T.F.; Kraft, M. Management of Severe Asthma before Referral to the Severe Asthma Specialist. J. Allergy Clin. Immunol. Pr. 2017, 5, 877–886. [Google Scholar] [CrossRef]
- Centers for Disease Control and Prevention. AsthmaStats: Uncontrolled Asthma Among Adults. 2019. Available online: https://www.cdc.gov/asthma/asthma_stats/default.htm (accessed on 7 April 2020).
- Colas, L.; Hassoun, D.; Magnan, A. Needs for Systems Approaches to Better Treat Individuals with Severe Asthma: Predicting Phenotypes and Responses to Treatments. Front. Med. 2020, 7, 7. [Google Scholar] [CrossRef]
- Cahill, K.N.; Katz, H.R.; Cui, J.; Lai, J.; Kazani, S.; Crosby-Thompson, A.; Garofalo, D.; Castro, M.; Jarjour, N.; DiMango, E.; et al. KIT Inhibition by Imatinib in Patients with Severe Refractory Asthma. N. Engl. J. Med. 2017, 376, 1911–1920. [Google Scholar] [CrossRef] [PubMed]
- Makowska, J.S.; Cieslak, M.; Kowalski, M.L. Stem cell factor and its soluble receptor (c-kit) in serum of asthmatic patients- correlation with disease severity. BMC Pulm. Med. 2009, 9, 27. [Google Scholar] [CrossRef] [PubMed]
- Wenzel, S. Severe Asthma in Adults. Am. J. Respir. Crit. Care Med. 2005, 172, 149–160. [Google Scholar] [CrossRef] [PubMed]
- Baos, S.; Calzada, D.; Cremades-Jimeno, L.; Sastre, J.; Picado, C.; Quiralte, J.; Florido, F.; Lahoz, C.; Cardaba, B. Nonallergic Asthma and Its Severity: Biomarkers for Its Discrimination in Peripheral Samples. Front. Immunol. 2018, 9, 1416. [Google Scholar] [CrossRef] [PubMed]
- Sonawane, A.R.; Weiss, S.T.; Glass, K.; Sharma, A. Network Medicine in the Age of Biomedical Big Data. Front. Genet. 2019, 10, 294. [Google Scholar] [CrossRef] [PubMed]
- Menche, J.; Guney, E.; Sharma, A.; Branigan, P.J.; Loza, M.J.; Baribaud, F.; Dobrin, R.; Barabási, A.-L. Integrating personalized gene expression profiles into predictive disease-associated gene pools. NPJ Syst. Biol. Appl. 2017, 3, 10. [Google Scholar] [CrossRef]
- Chen, E.Y.; Tan, C.M.; Kou, Y.; Duan, Q.; Wang, Z.; Meirelles, G.V.; Clark, N.R.; Ma’Ayan, A. Enrichr: Interactive and collaborative HTML5 gene list enrichment analysis tool. BMC Bioinform. 2013, 14, 128. [Google Scholar] [CrossRef]
- Hwang, S.; Kim, C.Y.; Yang, S.; Kim, E.; Hart, T.; Marcotte, E.M.; Lee, I. HumanNet v2: Human gene networks for disease research. Nucleic Acids Res. 2019, 47, D573–D580. [Google Scholar] [CrossRef]
- Sharan, R.; Ulitsky, I.; Shamir, R. Network-based prediction of protein function. Mol. Syst. Biol. 2007, 3, 88. [Google Scholar] [CrossRef] [PubMed]
- Tepper, R.S.; Wise, R.S.; Covar, R.; Irvin, C.G.; Kercsmar, C.M.; Kraft, M.; Liu, M.C.; O’Connor, G.T.; Peters, S.P.; Sorkness, R.; et al. Asthma outcomes: Pulmonary physiology. J. Allergy Clin. Immunol. 2012, 129, S65–S87. [Google Scholar] [CrossRef] [PubMed]
- Prakash, Y.; Pabelick, C.M.; Sieck, G.C. Mitochondrial Dysfunction in Airway Disease. Chest 2017, 152, 618–626. [Google Scholar] [CrossRef]
- Agrawal, A.; Mabaliraian, U. Rejuvenating cellular respiration for optimizing respiratory function: Targeting mitochondria. Am. J. Physiol. Lung Cell Mol. Physiol. 2016, 310, L103–L113. [Google Scholar] [CrossRef]
- Delmotte, P.; Sieck, G.C. Interaction between endplasmic/sarcoplasmic reticulum stress (ER/SR stress), mitochondrial signal-ing and Ca(2b) regulation in airway smooth muscle (ASM). Can. J. Physiol. Pharmacol. 2015, 93, 97–110. [Google Scholar] [CrossRef]
- Trian, T.; Benard, G.; Begueret, H.; Rossignol, R.; Girodet, P.-O.; Ghosh, D.; Ousova, O.; Vernejoux, J.-M.; Marthan, R.; Tunon-de-Lara, J.-M.; et al. Bronchial smooth muscle remodeling involves calcium-dependent en-hanced mitochondrial biogenesis in asthma. J. Exp. Med. 2007, 204, 3173–3181. [Google Scholar] [CrossRef] [PubMed]
- Rangarajan, S.; Bernard, K.; Thannickal, V.J. Mitochondrial Dysfunction in Pulmonary Fibrosis. Ann. Am. Thorac. Soc. 2017, 14, S383–S388. [Google Scholar] [CrossRef] [PubMed]
- Ramakrishnan, R.K.; Bajbouj, K.; Hachim, M.Y.; Mogas, A.K.; Mahboub, B.; Olivenstein, R.; Hamoudi, R.; Halwani, R.; Hamid, Q. Enhanced mitophagy in bronchial fibroblasts from severe asthmatic patients. PLoS ONE 2020, 15, e0242695. [Google Scholar] [CrossRef] [PubMed]
- Kim, R.Y.; Pinkerton, J.W.; Gibson, P.G.; Cooper, M.A.; Horvat, J.C.; Hansbro, P.M. Inflammasomes in COPD and neutrophilic asthma. Thorax 2015, 70, 1199–1201. [Google Scholar] [CrossRef]
- Cocco, M.P.; White, E.; Xiao, S.; Hu, D.; Mak, A.; Sleiman, P.; Yang, M.; Bobbitt, K.R.; Gui, H.; Levin, A.M.; et al. Asthma and its relationship to mitochondrial copy number: Results from the Asthma Translational Genomics Collaborative (ATGC) of the Trans-Omics for Precision Medicine (TOPMed) program. PLoS ONE 2020, 15, e0242364. [Google Scholar] [CrossRef]
- Xu, W.; Ghosh, S.; Comhair, S.A.; Asosingh, K.; Janocha, A.J.; Mavrakis, D.A.; Bennett, C.D.; Gruca, L.L.; Graham, B.B.; Queisser, K.A.; et al. Increased mitochondrial arginine metabolism supports bioenergetics in asthma. J. Clin. Investig. 2016, 126, 2465–2481. [Google Scholar] [CrossRef] [PubMed]
- Rooswinkel, R.W.; van de Kooij, B.; de Vries, E.; Paauwe, M.; Braster, R.; Verheij, M.; Borst, J. Antiapoptotic potency of Bcl-2 proteins primarily relies on their stability, not binding selectivity. Blood 2014, 123, 2806–2815. [Google Scholar] [CrossRef] [PubMed]
- Xiao, Q.; Hu, Y.; Liu, Y.; Wang, Z.; Geng, H.; Hu, L.; Xu, D.; Wang, K.; Zheng, L.; Zheng, S.; et al. BEX1 Promotes Imatinib-Induced Apoptosis by Binding to and Antagonizing BCL-2. PLoS ONE 2014, 9, e91782. [Google Scholar] [CrossRef] [PubMed]
- Siddiqui, S.; Denlinger, L.C.; Fowler, S.J.; Akuthota, P.; Shaw, D.E.; Heaney, L.G.; Brown, L.; Castro, M.; Winders, T.A.; Kraft, M.; et al. Unmet Needs in Severe Asthma Subtyping and Precision Medicine Trials. Bridging Clinical and Patient Perspectives. Am. J. Respir. Crit. Care Med. 2019, 199, 823–829. [Google Scholar] [CrossRef] [PubMed]
| Publisher’s Note: MDPI stays neutral with regard to jurisdictional claims in published maps and institutional affiliations. |
© 2021 by the authors. Licensee MDPI, Basel, Switzerland. This article is an open access article distributed under the terms and conditions of the Creative Commons Attribution (CC BY) license (http://creativecommons.org/licenses/by/4.0/).