
Lower Hippocampal Volume in Patients with Schizophrenia and Bipolar Disorder: A Quantitative MRI Study

 ,
, 
Abstract
1. Introduction
2. Materials and Methods
2.1. Participants
2.2. MRI Data Acquisition
2.3. Regions of Interest and Volume Measurement
2.4. Statistical Analysis
3. Results
3.1. Reliability
3.2. Relative Volumes of Each ROI
3.3. Correlations
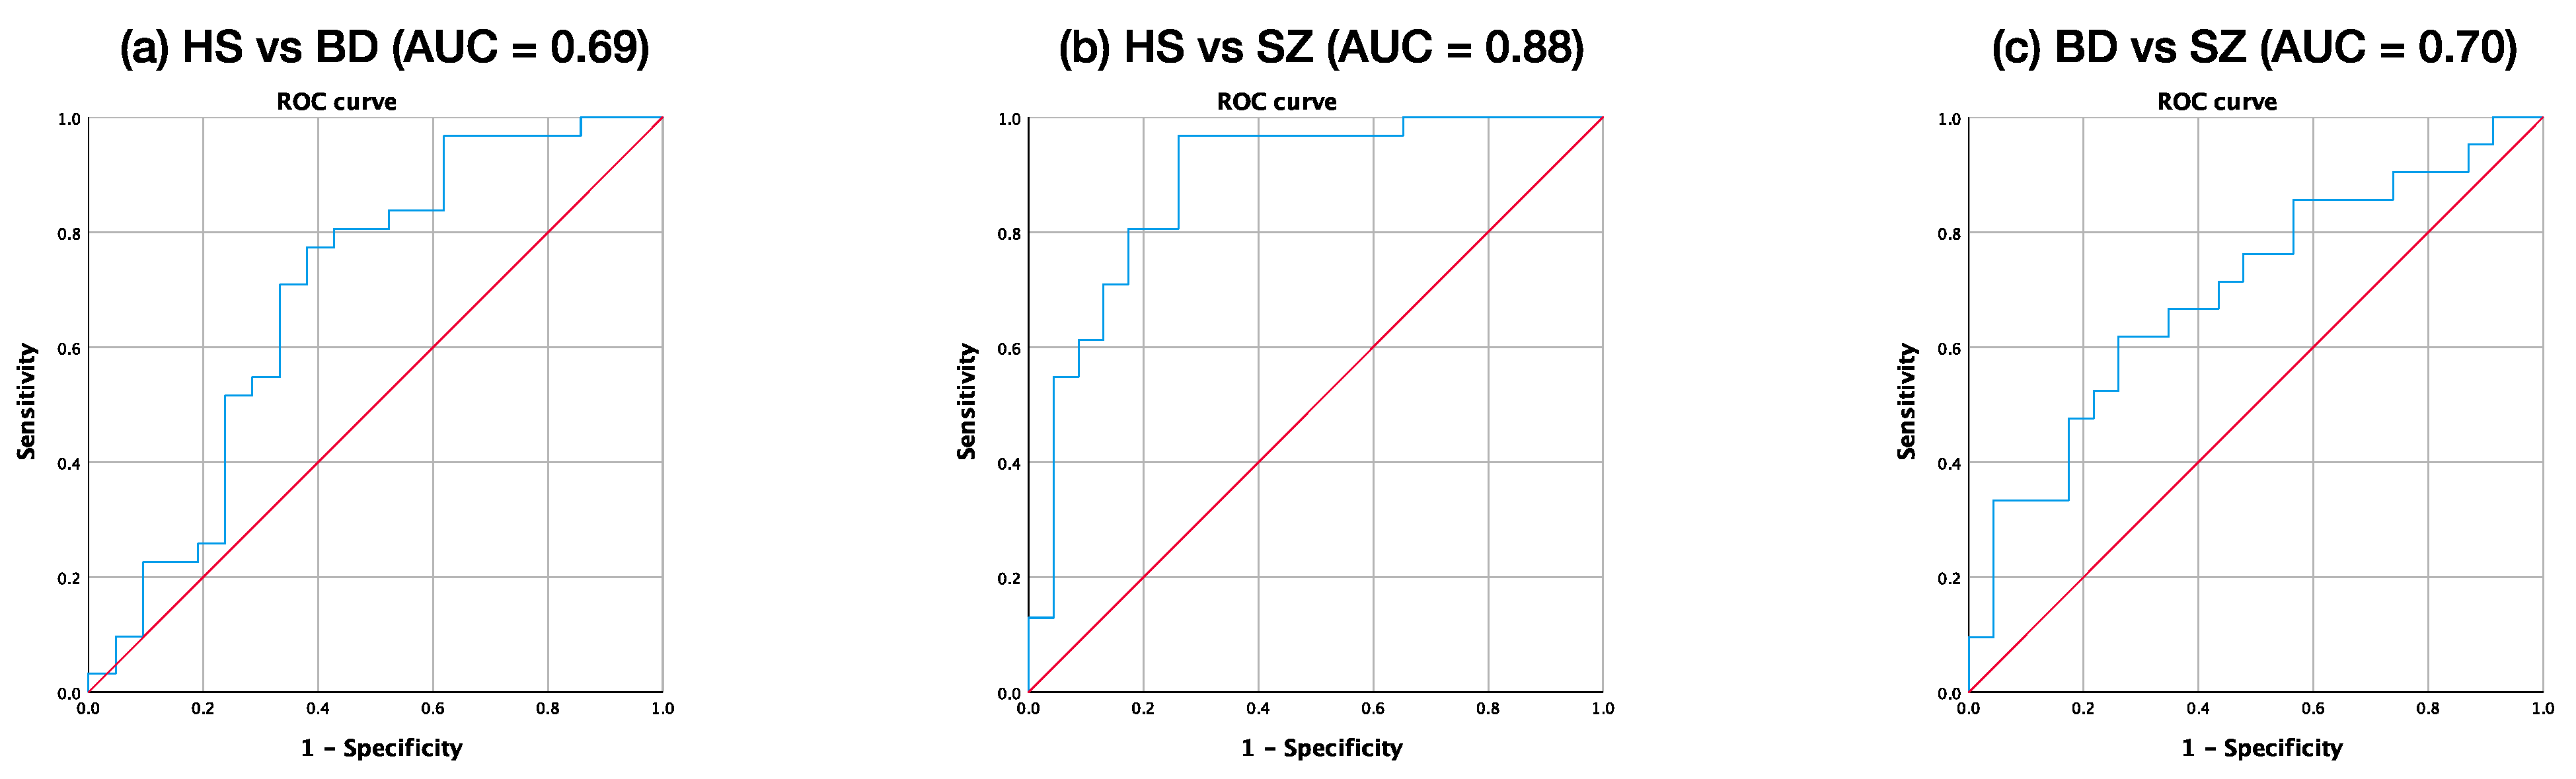
3.4. ROC Analysis
4. Discussion
Author Contributions
Funding
Institutional Review Board Statement
Informed Consent Statement
Data Availability Statement
Acknowledgments
Conflicts of Interest
References
- Anttila, V.; Bulik-Sullivan, B.; Finucane, H.K.; Walters, R.K.; Bras, J.; Duncan, L.; Neale, B.M. Analysis of shared heritability in common disorders of the brain. Science 2018, 360, eaap8757. [Google Scholar] [PubMed]
- Lee, S.H.; Ripke, S.; Neale, B.M.; Faraone, S.V.; Purcell, S.M.; Perlis, R.H.; Wray, N.R. Genetic relationship between five psychiatric disorders estimated from genome-wide SNPs. Nat. Genet. 2013, 45, 984–994. [Google Scholar] [PubMed]
- Ivleva, E.I.; Clementz, B.A.; Dutcher, A.M.; Arnold, S.J.; Jeon-Slaughter, H.; Aslan, S.; Tamminga, C.A. Brain structure biomarkers in the psychosis biotypes: Findings from the bipolar-schizophrenia network for intermediate phenotypes. Biol. Psychiatry 2017, 82, 26–39. [Google Scholar] [CrossRef]
- Hirano, S.; Hirano, Y.; Maekawa, T.; Obayashi, C.; Oribe, N.; Kuroki, T.; Kanba, S.; Onitsuka, T. Abnormal neural oscillatory activity to speech sounds in schizophrenia: A magnetoencephalography study. J. Neurosci. 2008, 28, 4897–4903. [Google Scholar] [CrossRef] [PubMed]
- Oribe, N.; Onitsuka, T.; Hirano, S.; Hirano, Y.; Maekawa, T.; Obayashi, C.; Ueno, T.; Kasai, K.; Kanba, S. Differentiation between bipolar disorder and schizophrenia revealed by neural oscillation to speech sounds: An MEG study. Bipolar Disord. 2010, 12, 804–812. [Google Scholar] [CrossRef]
- Hirano, Y.; Hirano, S.; Maekawa, T.; Obayashi, C.; Oribe, N.; Monji, A.; Kasai, K.; Kanba, S.; Onitsuka, T. Auditory gating deficit to human voices in schizophrenia: A MEG study. Schizophr. Res. 2010, 117, 61–67. [Google Scholar] [CrossRef] [PubMed]
- Tsuchimoto, R.; Kanba, S.; Hirano, S.; Oribe, N.; Ueno, T.; Hirano, Y.; Nakamura, I.; Oda, Y.; Miura, T.; Onitsuka, T. Reduced high and low frequency gamma synchronization in patients with chronic schizophrenia. Schizophr. Res. 2011, 133, 99–105. [Google Scholar] [CrossRef]
- Isomura, S.; Onitsuka, T.; Tsuchimoto, R.; Nakamura, I.; Hirano, S.; Oda, Y.; Oribe, N.; Hirano, Y.; Ueno, T.; Kanba, S. Differentiation between major depressive disorder and bipolar disorder by auditory steady-state responses. J. Affect. Disord. 2016, 190, 800–806. [Google Scholar] [CrossRef]
- Oribe, N.; Hirano, Y.; Del Re, E.; Mesholam-Gately, R.I.; Woodberry, K.A.; Ueno, T.; Kanba, S.; Onitsuka, T.; Shenton, M.E.; Spencer, K.M.; et al. Longitudinal evaluation of visual P300 amplitude in clinical high-risk subjects: An event-related potential study. Psychiatry Clin. Neurosci. 2020, 74, 527–534. [Google Scholar] [CrossRef]
- Wolf, A.; Ueda, K.; Hirano, Y. Recent Updates of Eye-movement Abnormalities in Patients with Schizophrenia: A Scoping Review. Psychiatry Clin. Neurosci. 2020. [Google Scholar] [CrossRef]
- Kato, T. Current understanding of bipolar disorder: Toward integration of biological basis and treatment strategies. Psychiatry Clin. Neurosci. 2019, 73, 526–540. [Google Scholar] [CrossRef] [PubMed]
- Brugger, S.P.; Howes, O.D. Group heterogeneity and homogeneity of regional brain structure in schizophrenia: A meta-analysis. JAMA Psychiatry 2017, 74, 1104–1111. [Google Scholar] [CrossRef]
- Ellison-Wright, I.; Bullmore, E. Anatomy of bipolar disorder and schizophrenia: A meta-analysis. Schizophr. Res. 2010, 117, 1–12. [Google Scholar] [CrossRef]
- Madeira, N.; Duarte, J.V.; Martins, R.; Costa, G.N.; Macedo, A.; Castelo-Branco, M. Morphometry and gyrification in bipolar disorder and schizophrenia: A comparative MRI study. NeuroImage 2020, 26, 102220. [Google Scholar] [CrossRef] [PubMed]
- Bora, E.; Fornito, A.; Yucel, M.; Pantelis, C. The effects of gender on grey matter abnormalities in major psychoses: A comparative voxelwise meta-analysis of schizo- phrenia and bipolar disorder. Psychol. Med. 2012, 42, 295–307. [Google Scholar] [CrossRef]
- Giuliani, N.R.; Calhoun, V.D.; Pearlson, G.D.; Francis, A.; Buchanan, R.W. Voxel-based morphometry versus region of interest: A comparison of two methods for analyzing gray matter differences in schizophrenia. Schizophr. Res. 2005, 74, 135–147. [Google Scholar] [CrossRef]
- Botvinik-Nezer, R.; Holzmeister, F.; Camerer, C.F.; Dreber, A.; Huber, J.; Johannesson, M.; Kirchler, M.; Iwanir, R.; Mumford, J.A.; Adcock, R.A.; et al. Variability in the analysis of a single neuroimaging dataset by many teams. Nature 2020, 582, 84–88. [Google Scholar] [CrossRef]
- Kasai, K.; Shenton, M.E.; Salisbury, D.F.; Hirayasu, Y.; Onitsuka, T.; Spencer, M.H.; Yurgelun-Todd, D.A.; Kikinis, R.; Jolesz, F.A.; McCarley, R.W. Progressive decrease of left Heschl gyrus and planum temporale gray matter volume in first-episode schizophrenia: A longitudinal magnetic resonance imaging study. Arch. Gen. Psychiatry 2003, 60, 766–775. [Google Scholar] [CrossRef]
- Reite, M.; Teale, P.; Rojas, D.C.; Reite, E.; Asherin, R.; Hernandez, O. MEG auditory evoked fields suggest altered structural/functional asymmetry in primary but not secondary auditory cortex in bipolar disorder. Bipolar Disord. 2009, 11, 371–381. [Google Scholar] [CrossRef]
- Frey, A.; Nery, M.; Quevedo, J.; Soares, K. The role of hippocampus in the pathophysiology of bipolar disorder. Behav. Pharmacol. 2007, 18, 419–430. [Google Scholar] [CrossRef] [PubMed]
- Lieberman, J.A.; Girgis, R.R.; Brucato, G.; Moore, H.; Provenzano, F.; Kegeles, L.; Javitt, D.; Kantrowitz, J.; Wall, M.M.; Corcoran, C.M.; et al. Hippocampal dysfunction in the pathophysiology of schizophrenia: A selective review and hypothesis for early detection and intervention. Mol. Psychiatry 2018, 23, 1764–1772. [Google Scholar] [CrossRef]
- Eichenbaum, H. Hippocampus: Cognitive processes and neural representations that underlie declarative memory. Neuron 2004, 44, 109–120. [Google Scholar] [CrossRef]
- Haukvik, U.K.; Tamnes, C.K.; Soderman, E.; Agartz, I. Neuroimaging hippocampal subfields in schizophrenia and bipolar disorder: A systematic review and meta-analysis. J. Psychiatr. Res. 2018, 104, 217–226. [Google Scholar] [CrossRef]
- Morris, J.S.; Ohman, A.; Dolan, R.J. Conscious and unconscious emotional learning in the human amygdala. Nature 1998, 393, 467–470. [Google Scholar] [CrossRef] [PubMed]
- LaBar, K.S.; Gatenby, J.C.; Gore, J.C.; LeDoux, J.E.; Phelps, E.A. Human amygdala activation during conditioned fear acquisition and extinction: A mixed-trial fMRI study. Neuron 1998, 20, 937–945. [Google Scholar] [CrossRef]
- Ho, N.F.; Li Hui Chong, P.; Lee, D.R.; Chew, Q.H.; Chen, G.; Sim, K. The Amygdala in Schizophrenia and Bipolar Disorder: A Synthesis of Structural MRI, Diffusion Tensor Imaging, and Resting-State Functional Connectivity Findings. Harv. Rev. Psychiatry 2019, 27, 150–164. [Google Scholar] [CrossRef]
- Hibar, D.P.; Westlye, L.T.; van Erp, T.G.; Rasmussen, J.; Leonardo, C.D.; Faskowitz, J.; Haukvik, U.K.; Hartberg, C.B.; Doan, N.T.; Agartz, I.; et al. Subcortical volumetric abnormalities in bipolar disorder. Mol. Psychiatry 2016, 21, 1710–1716. [Google Scholar] [CrossRef]
- Da Costa, S.; van der Zwaag, W.; Marques, J.P.; Frackowiak, R.S.; Clarke, S.; Saenz, M. Human primary auditory cortex follows the shape of Heschl’s gyrus. J. Neurosci. 2011, 31, 14067–14075. [Google Scholar] [CrossRef]
- Nakada, T.; Fujii, Y.; Yoneoka, Y.; Kwee, I.L. Planum temporale: Where spoken and written language meet. Eur. Neurol. 2001, 46, 121–125. [Google Scholar] [CrossRef] [PubMed]
- Hirayasu, Y.; McCarley, R.W.; Salisbury, D.F.; Tanaka, S.; Kwon, J.S.; Frumin, M.; Snyderman, D.; Yurgelun-Todd, D.; Kikinis, R.; Jolesz, F.A.; et al. Planum temporale and Heschl gyrus volume reduction in schizophrenia: A magnetic resonance imaging study of first-episode patients. Arch. Gen. Psychiatry 2000, 57, 692–699. [Google Scholar] [CrossRef] [PubMed]
- Javitt, D.C.; Sweet, R.A. Auditory dysfunction in schizophrenia: Integrating clinical and basic features. Nat. Rev. Neurosci. 2015, 16, 535–550. [Google Scholar] [CrossRef]
- Hirano, S.; Spencer, K.M.; Onitsuka, T.; Hirano, Y. Language-Related Neurophysiological Deficits in Schizophrenia. Clin. EEG Neurosci. 2020, 51, 222–233. [Google Scholar] [CrossRef]
- Hirano, Y.; Oribe, N.; Kanba, S.; Onitsuka, T.; Nestor, P.G.; Spencer, K.M. Spontaneous Gamma Activity in Schizophrenia. JAMA Psychiatry 2015, 72, 813–821. [Google Scholar] [CrossRef] [PubMed]
- Hirano, Y.; Oribe, N.; Onitsuka, T.; Kanba, S.; Nestor, P.G.; Hosokawa, T.; Levin, M.; Shenton, M.E.; McCarley, R.W.; Spencer, K.M. Auditory Cortex Volume and Gamma Oscillation Abnormalities in Schizophrenia. Clin. EEG Neurosci. 2020, 51, 244–251. [Google Scholar] [CrossRef] [PubMed]
- Takahashi, T.; Malhi, G.S.; Wood, S.J.; Yucel, M.; Walterfang, M.; Kawasaki, Y.; Suzuki, M.; Pantelis, C. Gray matter reduction of the superior temporal gyrus in patients with established bipolar I disorder. J. Affect. Disord. 2010, 123, 276–282. [Google Scholar] [CrossRef]
- Oldfield, R.C. The assessment and analysis of handedness: The Edinburgh inventory. Neuropsychologia 1971, 9, 97–113. [Google Scholar] [CrossRef]
- Hollingshead, A. Two Factor Index of Social Position; Yale University Press: New Haven, CT, USA, 1965. [Google Scholar]
- Kay, S.R.; Fiszbein, A.; Opler, L.A. The positive and negative syndrome scale (PANSS) for schizophrenia. Schizophr. Bull. 1987, 13, 261–276. [Google Scholar] [CrossRef] [PubMed]
- Young, R.C.; Biggs, J.T.; Ziegler, V.E.; Meyer, D.A. A rating scale for mania: Reliability, validity and sensitivity. Br. J. Psychiatry 1978, 133, 429–435. [Google Scholar] [CrossRef]
- Williams, J.B. A structured interview guide for the Hamilton Depression Rating Scale. Arch. Gen. Psychiatry 1988, 45, 742–747. [Google Scholar] [CrossRef]
- Ashburner, J.; Friston, K.J. Voxel-based morphometry-the methods. Neuroimage 2000, 11, 805–821. [Google Scholar] [CrossRef]
- Kwon, J.S.; McCarley, R.W.; Hirayasu, Y.; Anderson, J.E.; Fischer, I.A.; Kikinis, R.; Jolesz, F.A.; Shenton, M.E. Left planum temporale volume reduction in schizophrenia. Arch. Gen. Psychiatry 1999, 56, 142–148. [Google Scholar] [CrossRef]
- Barta, P.E.; Pearlson, G.D.; Brill, L.B.; Royall, R.; McGilchrist, I.K.; Pulver, A.E.; Powers, R.E.; Casanova, M.F.; Tien, A.Y.; Frangou, S.; et al. Planum temporale asymmetry reversal in schizophrenia: Replication and relationship to gray matter abnormalities. Am. J. Psychiatry 1997, 154, 661–667. [Google Scholar]
- Shapleske, J.; Rossell, S.L.; Simmons, A.; David, A.S.; Woodruff, P.W. Are auditory hallucinations the consequence of abnormal cerebral lateralization? A morphometric MRI study of the sylvian fissure and planum temporale. Biol. Psychiatry 2001, 49, 685–693. [Google Scholar] [CrossRef]
- Steinmetz, H.; Rademacher, J.; Huang, Y.X.; Hefter, H.; Zilles, K.; Thron, A.; Freund, H.J. Cerebral asymmetry: MR planimetry of the human planum temporale. J. Comput. Assist. Tomogr. 1989, 13, 996–1005. [Google Scholar] [CrossRef]
- Barta, P.E.; Petty, R.G.; McGilchrist, I.; Lewis, R.W.; Jerram, M.; Casanova, M.F.; Powers, R.E.; Brill, L.B.; Pearlson, G.D. Asymmetry of the planum temporale: Methodological considerations and clinical associations. Psychiatry Res. 1995, 61, 137–150. [Google Scholar] [CrossRef]
- Honeycutt, N.A.; Musick, A.; Barta, P.E.; Pearlson, G.D. Measurement of the planum temporale (PT) on magnetic resonance imaging scans: Temporal PT alone and with parietal extension. Psychiatry Res. 2000, 98, 103–116. [Google Scholar] [CrossRef]
- van Erp, T.G.; Hibar, D.P.; Rasmussen, J.M.; Glahn, D.C.; Pearlson, G.D.; Andreassen, O.A.; Agartz, I.; Westlye, L.T.; Haukvik, U.K.; Dale, A.M.; et al. Subcortical brain volume abnormalities in 2028 individuals with schizophrenia and 2540 healthy controls via the ENIGMA consortium. Mol. Psychiatry 2016, 21, 547–553. [Google Scholar] [CrossRef] [PubMed]
- Seidman, L.J.; Faraone, S.V.; Goldstein, J.M.; Kremen, W.S.; Horton, N.J.; Makris, N.; Toomey, R.; Kennedy, D.; Caviness, V.S.; Tsuang, M.T. Left hippocampal volume as a vulnerability indicator for schizophrenia: A magnetic resonance imaging morphometric study of nonpsychotic first-degree relatives. Arch. Gen. Psychiatry 2002, 59, 839–849. [Google Scholar] [CrossRef]
- Bryant, N.L.; Buchanan, R.W.; Vladar, K.; Breier, A.; Rothman, M. Gender differences in temporal lobe structures of patients with schizophrenia: A volumetric MRI study. Am. J. Psychiatry 1999, 156, 603–609. [Google Scholar] [PubMed]
- Karantonis, J.A.; Rossell, S.L.; Carruthers, S.P.; Sumner, P.; Hughes, M.; Green, M.J.; Pantelis, C.; Burdick, K.E.; Cropley, V.; Van Rheenen, T.E. Brain morphology does not clearly map to cognition in individuals on the bipolar-schizophrenia-spectrum: A cross-diagnostic study of cognitive subgroups. J. Affect. Disord. 2021, 281, 776–785. [Google Scholar] [CrossRef] [PubMed]
- Dezhina, Z.; Ranlund, S.; Kyriakopoulos, M.; Williams, S.C.R.; Dima, D. A systematic review of associations between functional MRI activity and polygenic risk for schizophrenia and bipolar disorder. Brain Imaging Behav. 2019, 13, 862–877. [Google Scholar] [CrossRef]
- Goodkind, M.; Eickhoff, S.B.; Oathes, D.J.; Jiang, Y.; Chang, A.; Jones-Hagata, L.B.; Ortega, B.N.; Zaiko, Y.V.; Roach, E.L.; Korgaonkar, M.S.; et al. Identification of a common neurobiological substrate for mental illness. JAMA Psychiatry 2015, 72, 305–315. [Google Scholar] [CrossRef] [PubMed]
- Le, B.D.; Stein, J.L. Mapping causal pathways from genetics to neuropsychiatric disorders using genome-wide imaging genetics: Current status and future directions. Psychiatry Clin. Neurosci. 2019, 73, 357–369. [Google Scholar] [CrossRef] [PubMed]
- Appaji, A.; Nagendra, B.; Chako, D.M.; Padmanabha, A.; Jacob, A.; Hiremath, C.V.; Varambally, S.; Kesavan, M.; Venkatasubramanian, G.; Rao, S.V.; et al. Examination of retinal vascular trajectory in schizophrenia and bipolar disorder. Psychiatry Clin. Neurosci. 2019, 73, 738–744. [Google Scholar] [CrossRef]
- Omori, W.; Itagaki, K.; Kajitani, N.; Abe, H.; Okada-Tsuchioka, M.; Okamoto, Y.; Takebayashi, M. Shared preventive factors associated with relapse after a response to electroconvulsive therapy in four major psychiatric disorders. Psychiatry Clin. Neurosci. 2019, 73, 494–500. [Google Scholar] [CrossRef] [PubMed]
- Kubo, K. Increased densities of white matter neurons as a cross-disease feature of neuropsychiatric disorders. Psychiatry Clin. Neurosci. 2020, 74, 166–175. [Google Scholar] [CrossRef]
- Smucny, J.; Davidson, I.; Carter, C.S. Comparing machine and deep learning-based algorithms for prediction of clinical improvement in psychosis with functional magnetic resonance imaging. Hum. Brain Mapp. 2021, 42, 1197–1205. [Google Scholar] [CrossRef]
- Knöchel, C.; Stäblein, M.; Storchak, H.; Reinke, B.; Jurcoane, A.; Prvulovic, D.; Linden, D.E.; van de Ven, V.; Ghinea, D.; Wenzler, S.; et al. Multimodal assessments of the hippocampal formation in schizophrenia and bipolar disorder: Evidences from neurobehavioral measures and functional and structural MRI. Neuroimage 2014, 6, 134–144. [Google Scholar] [CrossRef]
- Hwang, H.C.; Kim, S.M.; Han, D.H. Different facial recognition patterns in schizophrenia and bipolar disorder assessed using a computerized emotional perception test and fMRI. J. Affect. Disord. 2021, 279, 83–88. [Google Scholar] [CrossRef]
- Thompson, P.M.; Jahanshad, N.; Ching, C.R.; Salminen, L.E.; Thomopoulos, S.I.; Bright, J.; Baune, B.T.; Bertolín, S.; Bralten, J.; Bruin, W.B.; et al. ENIGMA and global neuroscience: A decade of large-scale studies of the brain in health and disease across more than 40 countries. Transl. Psychiatry 2020, 10, 100. [Google Scholar] [CrossRef]
- Nogovitsyn, N.; Souza, R.; Muller, M.; Srajer, A.; Metzak, P.D.; Hassel, S.; Ismail, Z.; Protzner, A.; Bray, S.L.; Lebel, C.; et al. Aberrant limbic brain structures in young individuals at risk for mental illness. Psychiatry Clin. Neurosci. 2020, 74, 294–302. [Google Scholar] [CrossRef]
- Nemoto, K.; Shimokawa, T.; Fukunaga, M.; Yamashita, F.; Tamura, M.; Yamamori, H.; Yasuda, Y.; Azechi, H.; Kudo, N.; Watanabe, Y.; et al. Differentiation of schizophrenia using structural MRI with consideration of scanner differences: A real-world multisite study. Psychiatry Clin. Neurosci. 2020, 74, 56–63. [Google Scholar] [CrossRef] [PubMed]
- Roes, M.M.; Yin, J.; Taylor, L.; Metzak, P.D.; Lavigne, K.M.; Chinchani, A.; Tipper, C.M.; Woodward, T.S. Hallucination-Specific structure-function associations in schizophrenia. Psychiatry Res. Neuroimaging 2020, 305, 111171. [Google Scholar] [CrossRef]
- van Dellen, E.; Börner, C.; Schutte, M.; van Montfort, S.; Abramovic, L.; Boks, M.P.; Cahn, W.; van Haren, N.; Mandl, R.; Stam, C.J.; et al. Functional brain networks in the schizophrenia spectrum and bipolar disorder with psychosis. NPJ Schizophr. 2020, 6, 22. [Google Scholar] [CrossRef]
- Reddy-Thootkur, M.; Kraguljac, N.V.; Lahti, A.C. The role of glutamate and GABA in cognitive dysfunction in schizophrenia and mood disorders—A systematic review of magnetic resonance spectroscopy studies. Schizophr. Res. 2020. [Google Scholar] [CrossRef]
- Bustillo, J.R.; Jones, T.; Qualls, C.; Chavez, L.; Lin, D.; Lenroot, R.K.; Gasparovic, C. Proton magnetic resonance spectroscopic imaging of gray and white matter in bipolar-I and schizophrenia. J. Affect. Disord. 2019, 246, 745–753. [Google Scholar] [CrossRef] [PubMed]
- Das, T.K.; Javadzadeh, A.; Dey, A.; Sabesan, P.; Théberge, J.; Radua, J.; Palaniyappan, L. Antioxidant defense in schizophrenia and bipolar disorder: A meta-analysis of MRS studies of anterior cingulate glutathione. Prog. Neuropsychopharmacol. Biol. Psychiatry 2019, 91, 94–102. [Google Scholar] [CrossRef] [PubMed]
- Dogan, A.E.; Yuksel, C.; Du, F.; Chouinard, V.A.; Öngür, D. Brain lactate and pH in schizophrenia and bipolar disorder: A systematic review of findings from magnetic resonance studies. Neuropsychopharmacology 2018, 43, 1681–1690. [Google Scholar] [CrossRef]
- Hellwig, S.; Domschke, K. Update on PET imaging biomarkers in the diagnosis of neuropsychiatric disorders. Curr. Opin. Neurol. 2019, 32, 539–547. [Google Scholar] [CrossRef]
- Jauhar, S.; Nour, M.M.; Veronese, M.; Rogdaki, M.; Bonoldi, I.; Azis, M.; Turkheimer, F.; McGuire, P.; Young, A.H.; Howes, O.D. A Test of the Transdiagnostic Dopamine Hypothesis of Psychosis Using Positron Emission Tomographic Imaging in Bipolar Affective Disorder and Schizophrenia. JAMA Psychiatry 2017, 74, 1206–1213. [Google Scholar] [CrossRef]
- Li, C.T.; Yang, K.C.; Lin, W.C. Glutamatergic Dysfunction and Glutamatergic Compounds for Major Psychiatric Disorders: Evidence from Clinical Neuroimaging Studies. Front. Psychiatry 2019, 9, 767. [Google Scholar] [CrossRef]
- Molina, V.; Lubeiro, A.; de Luis Garcia, R.; Gomez-Pilar, J.; Martín-Santiago, O.; Iglesias-Tejedor, M.; Holgado-Madera, P.; Segarra-Echeverría, R.; Recio-Barbero, M.; Núñez, P.; et al. Deficits of entropy modulation of the EEG: A biomarker for altered function in schizophrenia and bipolar disorder? J Psychiatry Neurosci. 2020, 45, 322–333. [Google Scholar] [CrossRef]
- Hudgens-Haney, M.E.; Clementz, B.A.; Ivleva, E.I.; Keshavan, M.S.; Pearlson, G.D.; Gershon, E.S.; Keedy, S.K.; Sweeney, J.A.; Gaudoux, F.; Bunouf, P.; et al. Cognitive Impairment and Diminished Neural Responses Constitute a Biomarker Signature of Negative Symptoms in Psychosis. Schizophr. Bull. 2020, 46, 1269–1281. [Google Scholar] [CrossRef]
- Murphy, M.; Stickgold, R.; Öngür, D. Electroencephalogram Microstate Abnormalities in Early-Course Psychosis. Biol. Psychiatry 2020, 5, 35–44. [Google Scholar] [CrossRef]
- Monaghan, C.K.; Brickman, S.; Huynh, P.; Öngür, D.; Hall, M.H. A longitudinal study of event related potentials and correlations with psychosocial functioning and clinical features in first episode psychosis patients. Int. J. Psychophysiol. 2019, 145, 48–56. [Google Scholar] [CrossRef] [PubMed]
- Parker, D.A.; Hamm, J.P.; McDowell, J.E.; Keedy, S.K.; Gershon, E.S.; Ivleva, E.I.; Pearlson, G.D.; Keshavan, M.S.; Tamminga, C.A.; Sweeney, J.A.; et al. Auditory steady-state EEG response across the schizo-bipolar spectrum. Schizophr. Res. 2019, 209, 218–226. [Google Scholar] [CrossRef]
- Spironelli, C.; Romeo, Z.; Maffei, A.; Angrilli, A. Comparison of automatic visual attention in schizophrenia, bipolar disorder, and major depression: Evidence from P1 event-related component. Psychiatry Clin. Neurosci. 2019, 73, 331–339. [Google Scholar] [CrossRef]
- Newson, J.J.; Thiagarajan, T.C. EEG Frequency Bands in Psychiatric Disorders: A Review of Resting State Studies. Front. Hum. Neurosci. 2019, 12, 521. [Google Scholar] [CrossRef] [PubMed]
- Zhou, T.H.; Mueller, N.E.; Spencer, K.M.; Mallya, S.G.; Lewandowski, K.E.; Norris, L.A.; Levy, D.L.; Cohen, B.M.; Öngür, D.; Hall, M.H. Auditory steady state response deficits are associated with symptom severity and poor functioning in patients with psychotic disorder. Schizophr. Res. 2018, 201, 278–286. [Google Scholar] [CrossRef] [PubMed]
- Braeutigam, S.; Dima, D.; Frangou, S.; James, A. Dissociable auditory mismatch response and connectivity patterns in adolescents with schizophrenia and adolescents with bipolar disorder with psychosis: A magnetoencephalography study. Schizophr. Res. 2018, 193, 313–318. [Google Scholar] [CrossRef]
- Ohara, N.; Hirano, Y.; Oribe, N.; Tamura, S.; Nakamura, I.; Hirano, S.; Tsuchimoto, R.; Ueno, T.; Togao, O.; Hiwatashi, A.; et al. Neurophysiological Face Processing Deficits in Patients with Chronic Schizophrenia: An MEG Study. Front. Psychiatry 2020, 11, 554844. [Google Scholar] [CrossRef] [PubMed]
- Hirano, Y.; Nakamura, I.; Tamura, S.; Onitsuka, T. Long-Term Test-Retest Reliability of Auditory Gamma Oscillations Between Different Clinical EEG Systems. Front. Psychiatry 2020, 11, 876. [Google Scholar] [CrossRef]
- Oribe, N.; Hirano, Y.; Del Re, E.; Seidman, L.J.; Mesholam-Gately, R.I.; Woodberry, K.A.; Wojcik, J.D.; Ueno, T.; Kanba, S.; Onitsuka, T.; et al. Progressive reduction of auditory evoked gamma in first episode schizophrenia but not clinical high risk individuals. Schizophr. Res. 2019, 208, 145–152. [Google Scholar] [CrossRef]
- Hironaga, N.; Takei, Y.; Mitsudo, T.; Kimura, T.; Hirano, Y. Prospects for Future Methodological Development and Application of Magnetoencephalography Devices in Psychiatry. Front. Psychiatry 2020, 11, 863. [Google Scholar] [CrossRef]
- Hirano, Y.; Tamura, S. Recent Findings on Neurofeedback Training for Auditory Hallucinations in Schizophrenia. Curr. Opin. Psychiatry 2021. [Google Scholar] [CrossRef] [PubMed]
- Habtewold, T.D.; Rodijk, L.H.; Liemburg, E.J.; Sidorenkov, G.; Boezen, H.M.; Bruggeman, R.; Alizadeh, B.Z. A systematic review and narrative synthesis of data-driven studies in schizophrenia symptoms and cognitive deficits. Transl. Psychiatry 2020, 10, 244. [Google Scholar] [CrossRef] [PubMed]
- Egloff, L.; Lenz, C.; Studerus, E.; Harrisberger, F.; Smieskova, R.; Schmidt, A.; Huber, C.; Simon, A.; Lang, U.E.; Riecher-Rössler, A.; et al. Sexually dimorphic subcortical brain volumes in emerging psychosis. Schizophr. Res. 2018, 199, 257–265. [Google Scholar] [CrossRef] [PubMed]
- Fusar-Poli, P.; Smieskova, R.; Kempton, M.J.; Ho, B.C.; Andreasen, N.C.; Borgwardt, S. Progressive brain changes in schizophrenia related to antipsychotic treatment? A meta-analysis of longitudinal MRI studies. Neurosci. Biobehav. Rev. 2013, 37, 1680–1691. [Google Scholar] [CrossRef] [PubMed]
- Hashimoto, N.; Ito, Y.M.; Okada, N.; Yamamori, H.; Yasuda, Y.; Fujimoto, M.; Kudo, N.; Takemura, A.; Son, S.; Narita, H.; et al. The effect of duration of illness and antipsychotics on subcortical volumes in schi- zophrenia: Analysis of 778 subjects. NeuroImage 2018, 17, 563–569. [Google Scholar] [CrossRef]


| Healthy Subjects (HS) | Patients with Bipolar Disorder (BD) | Patients with Schizophrenia (SZ) | χ2 or F or t | df | p | |
|---|---|---|---|---|---|---|
| Male/Female | 11/20 | 11/10 | 8/15 | 1.66 | 2 | 0.44 |
| Age (years) | 49.2 ± 9.8 | 48.9 ± 9.1 | 44.3 ± 6.2 | 2.50 | 2, 73 | 0.09 |
| Handedness a | 92.0 ± 32.7 | 82.4 ± 51.0 | 96.7 ± 8.7 | 0.99 | 2, 73 | 0.38 |
| SES b | 2.4 ± 0.8 | 2.9 ± 1.0 | 3.6 ± 1.0 | 10.66 | 2, 45 | <0.001 |
| Parental SES | 3.1 ± 0.9 | 2.9 ± 0.9 | 2.8 ± 0.9 | 1.10 | 2, 45 | 0.34 |
| Education (years) | 14.4 ± 2.6 | 14.2 ± 2.3 | 14.4 ± 2.0 | 0.95 | 2, 45 | 0.39 |
| Symptom onset # (years) | 37.8 ± 11.2 | 26.7 ± 6.7 | 31.95 | 42 | <0.001 | |
| Medication dose (CPZ equiv., mg) | 144.2 ± 183.9 | 599.8 ± 328.4 | 5.60 | 42 | <0.001 | |
| PANSS positive | 18.1 ± 7.9 | |||||
| PANSS negative | 22.5 ± 7.7 | |||||
| PANSS general | 42.9 ± 15.2 | |||||
| YMRS | 5.2 ± 5.7 | |||||
| SIGH-D score | 10.3 ± 5.9 |
| Healthy Subjects (HS) | Patients with Bipolar Disorder (BD) | Patients with Schizophrenia (SZ) | df | F | p | |
|---|---|---|---|---|---|---|
| Intracranial Volume (mL) | 1380 ± 128 | 1422 ± 136 | 1418 ± 157 | 2, 72 | 0.79 | 0.46 |
| Left Hippocampus | ||||||
| Absolute (mL) | 2.91 ± 0.22 | 2.92 ± 0.24 | 2.72 ± 0.24 | |||
| Relative (%) | 0.211 ± 0.015 | 0.206 ± 0.022 | 0.193 ± 0.018 | 2, 72 | 7.47 | 0.001 * |
| Right Hippocampus | ||||||
| Absolute (mL) | 2.95 ± 0.29 | 2.86 ± 0.20 | 2.67 ± 0.28 | |||
| Relative (%) | 0.214 ± 0.014 | 0.202 ± 0.020 | 0.189 ± 0.017 | 2, 72 | 15.06 | <0.0001 † |
| Left Amygdala | ||||||
| Absolute (mL) | 1.26 ± 0.17 | 1.28 ± 0.14 | 1.24 ± 0.16 | |||
| Relative (%) | 0.091 ± 0.009 | 0.091 ± 0.012 | 0.087 ± 0.009 | 2, 72 | 1.01 | 0.37 |
| Right Amygdala | ||||||
| Absolute (mL) | 1.25 ± 0.20 | 1.31 ± 0.14 | 1.26 ± 0.17 | |||
| Relative (%) | 0.091 ± 0.010 | 0.093 ± 0.012 | 0.089 ± 0.008 | 2, 72 | 0.78 | 0.46 |
| Left Heschl’s gyrus | ||||||
| Absolute (mL) | 2.03 ± 0.50 | 2.02 ± 0.53 | 1.95 ± 0.59 | |||
| Relative (%) | 0.147 ± 0.032 | 0.148 ± 0.039 | 0.137 ± 0.035 | 2, 72 | 0.71 | 0.50 |
| Right Heschl’s gyrus | ||||||
| Absolute (mL) | 1.71 ± 0.48 | 1.77 ± 0.46 | 1.75 ± 0.55 | |||
| Relative (%) | 0.123 ± 0.029 | 0.125 ± 0.034 | 0.123 ± 0.034 | 2, 72 | 0.03 | 0.97 |
| Left Planum temporale | ||||||
| Absolute (mL) | 2.94 ± 0.60 | 2.88 ± 0.68 | 2.79 ± 0.56 | |||
| Relative (%) | 0.213 ± 0.036 | 0.203 ± 0.046 | 0.197 ± 0.032 | 2, 72 | 1.20 | 0.31 |
| Right Planum temporale | ||||||
| Absolute (mL) | 2.53 ± 0.76 | 2.56 ± 0.36 | 2.63 ± 0.65 | |||
| Relative (%) | 0.183 ± 0.050 | 0.182 ± 0.032 | 0.186 ± 0.044 | 2, 72 | 0.06 | 0.94 |
Publisher’s Note: MDPI stays neutral with regard to jurisdictional claims in published maps and institutional affiliations. |
© 2021 by the authors. Licensee MDPI, Basel, Switzerland. This article is an open access article distributed under the terms and conditions of the Creative Commons Attribution (CC BY) license (http://creativecommons.org/licenses/by/4.0/).
Share and Cite
Sato, J.; Hirano, Y.; Hirakawa, N.; Takahashi, J.; Oribe, N.; Kuga, H.; Nakamura, I.; Hirano, S.; Ueno, T.; Togao, O.; et al. Lower Hippocampal Volume in Patients with Schizophrenia and Bipolar Disorder: A Quantitative MRI Study. J. Pers. Med. 2021, 11, 121. https://doi.org/10.3390/jpm11020121
Sato J, Hirano Y, Hirakawa N, Takahashi J, Oribe N, Kuga H, Nakamura I, Hirano S, Ueno T, Togao O, et al. Lower Hippocampal Volume in Patients with Schizophrenia and Bipolar Disorder: A Quantitative MRI Study. Journal of Personalized Medicine. 2021; 11(2):121. https://doi.org/10.3390/jpm11020121
Chicago/Turabian StyleSato, Jinya, Yoji Hirano, Noriaki Hirakawa, Junichi Takahashi, Naoya Oribe, Hironori Kuga, Itta Nakamura, Shogo Hirano, Takefumi Ueno, Osamu Togao, and et al. 2021. "Lower Hippocampal Volume in Patients with Schizophrenia and Bipolar Disorder: A Quantitative MRI Study" Journal of Personalized Medicine 11, no. 2: 121. https://doi.org/10.3390/jpm11020121
APA StyleSato, J., Hirano, Y., Hirakawa, N., Takahashi, J., Oribe, N., Kuga, H., Nakamura, I., Hirano, S., Ueno, T., Togao, O., Hiwatashi, A., Nakao, T., & Onitsuka, T. (2021). Lower Hippocampal Volume in Patients with Schizophrenia and Bipolar Disorder: A Quantitative MRI Study. Journal of Personalized Medicine, 11(2), 121. https://doi.org/10.3390/jpm11020121