
Correlation between Post-Acute Electroconvulsive Therapy Alpha-Band Spectrum Power Increase and Improvement of Psychiatric Symptoms

 ,
,
Abstract
:1. Introduction
2. Materials and Methods
2.1. Participants
2.2. ECT Therapy
2.3. EEG Recordings
2.4. Statistical Analysis
3. Results
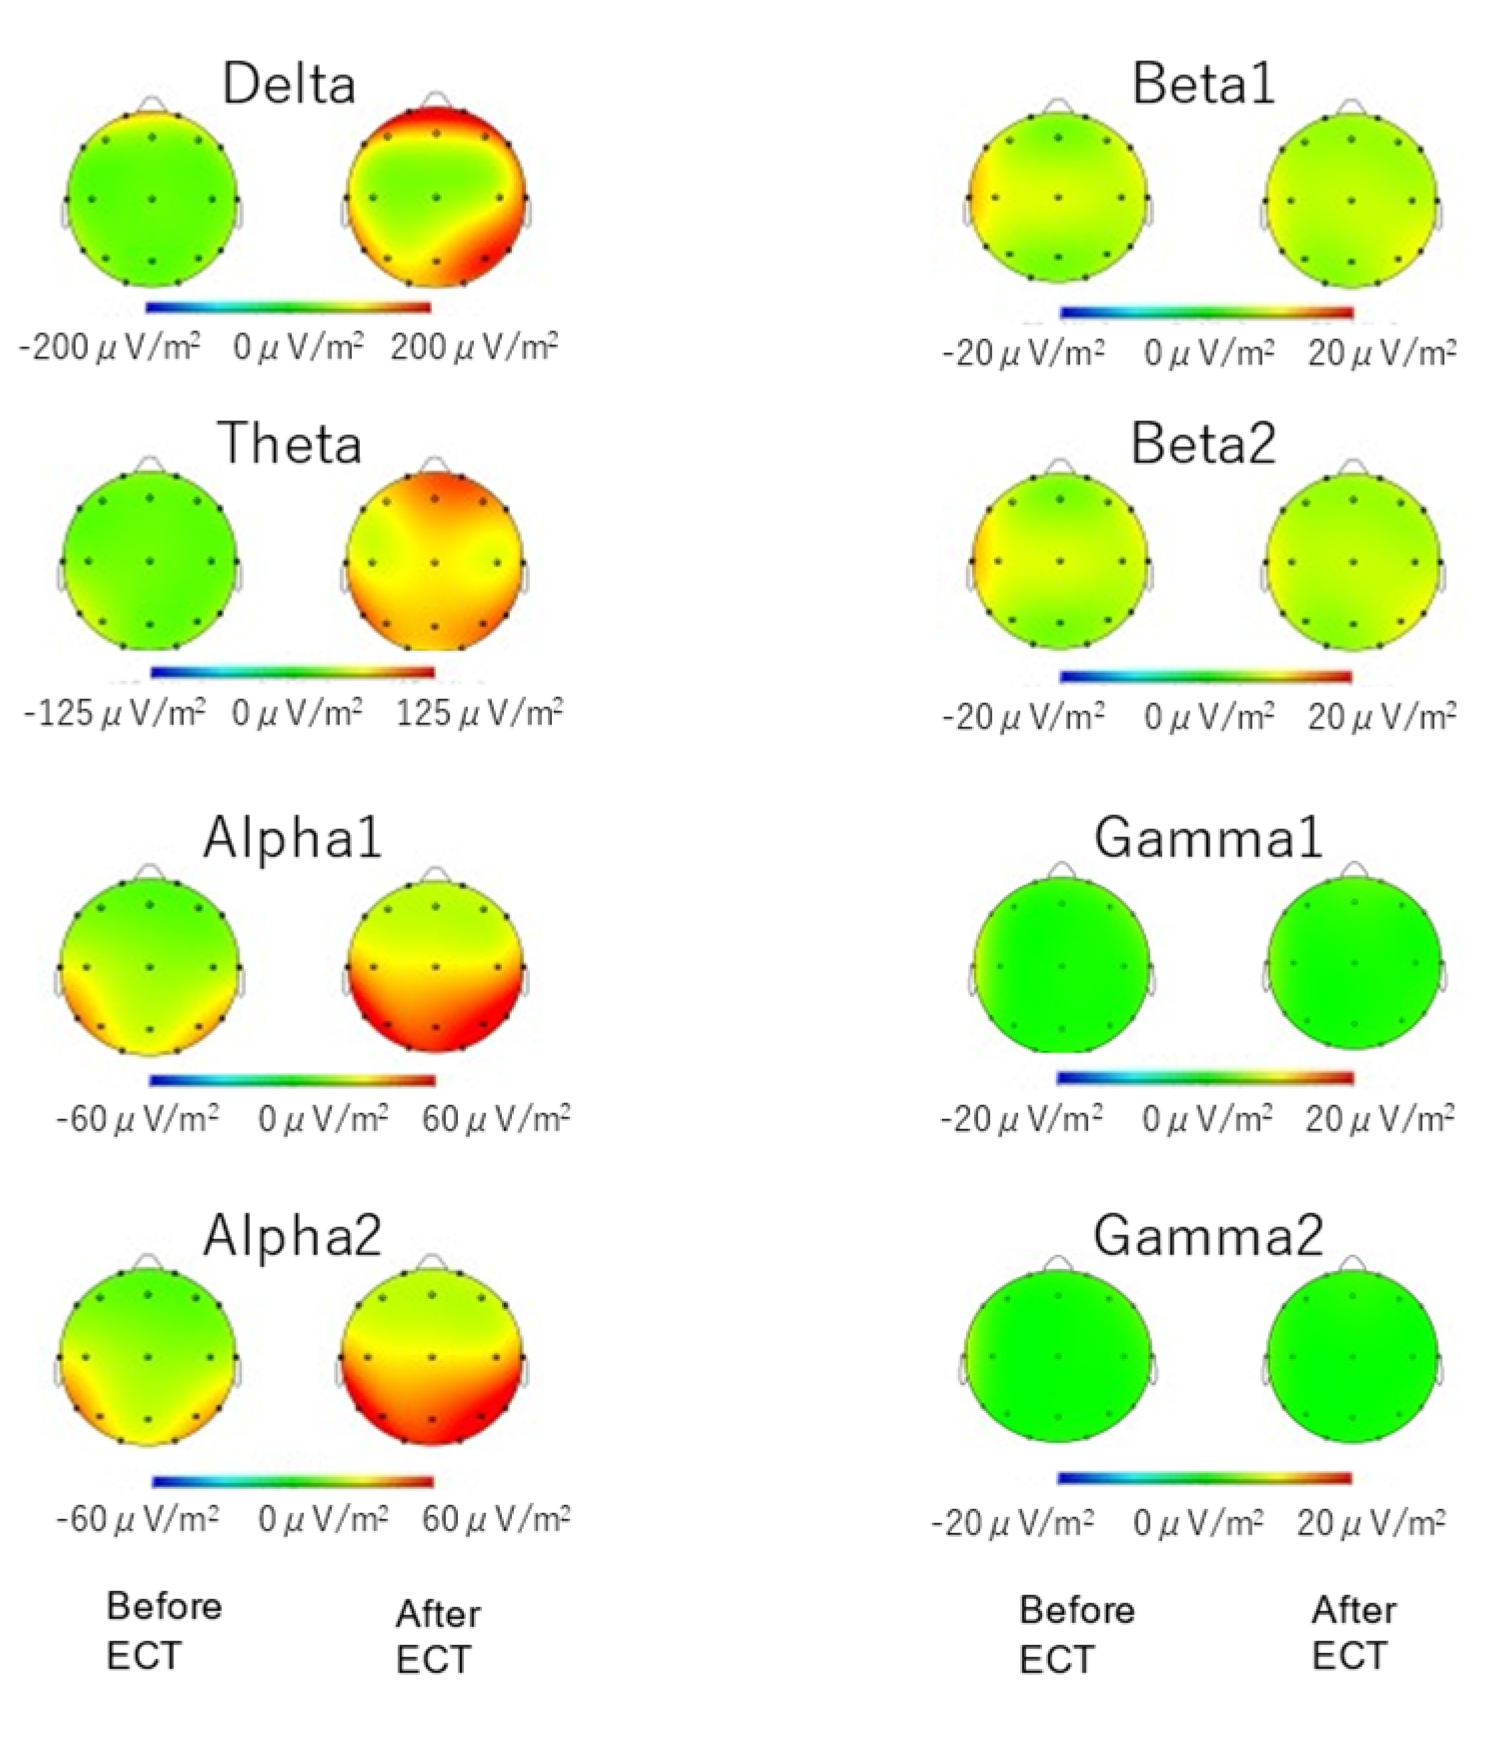
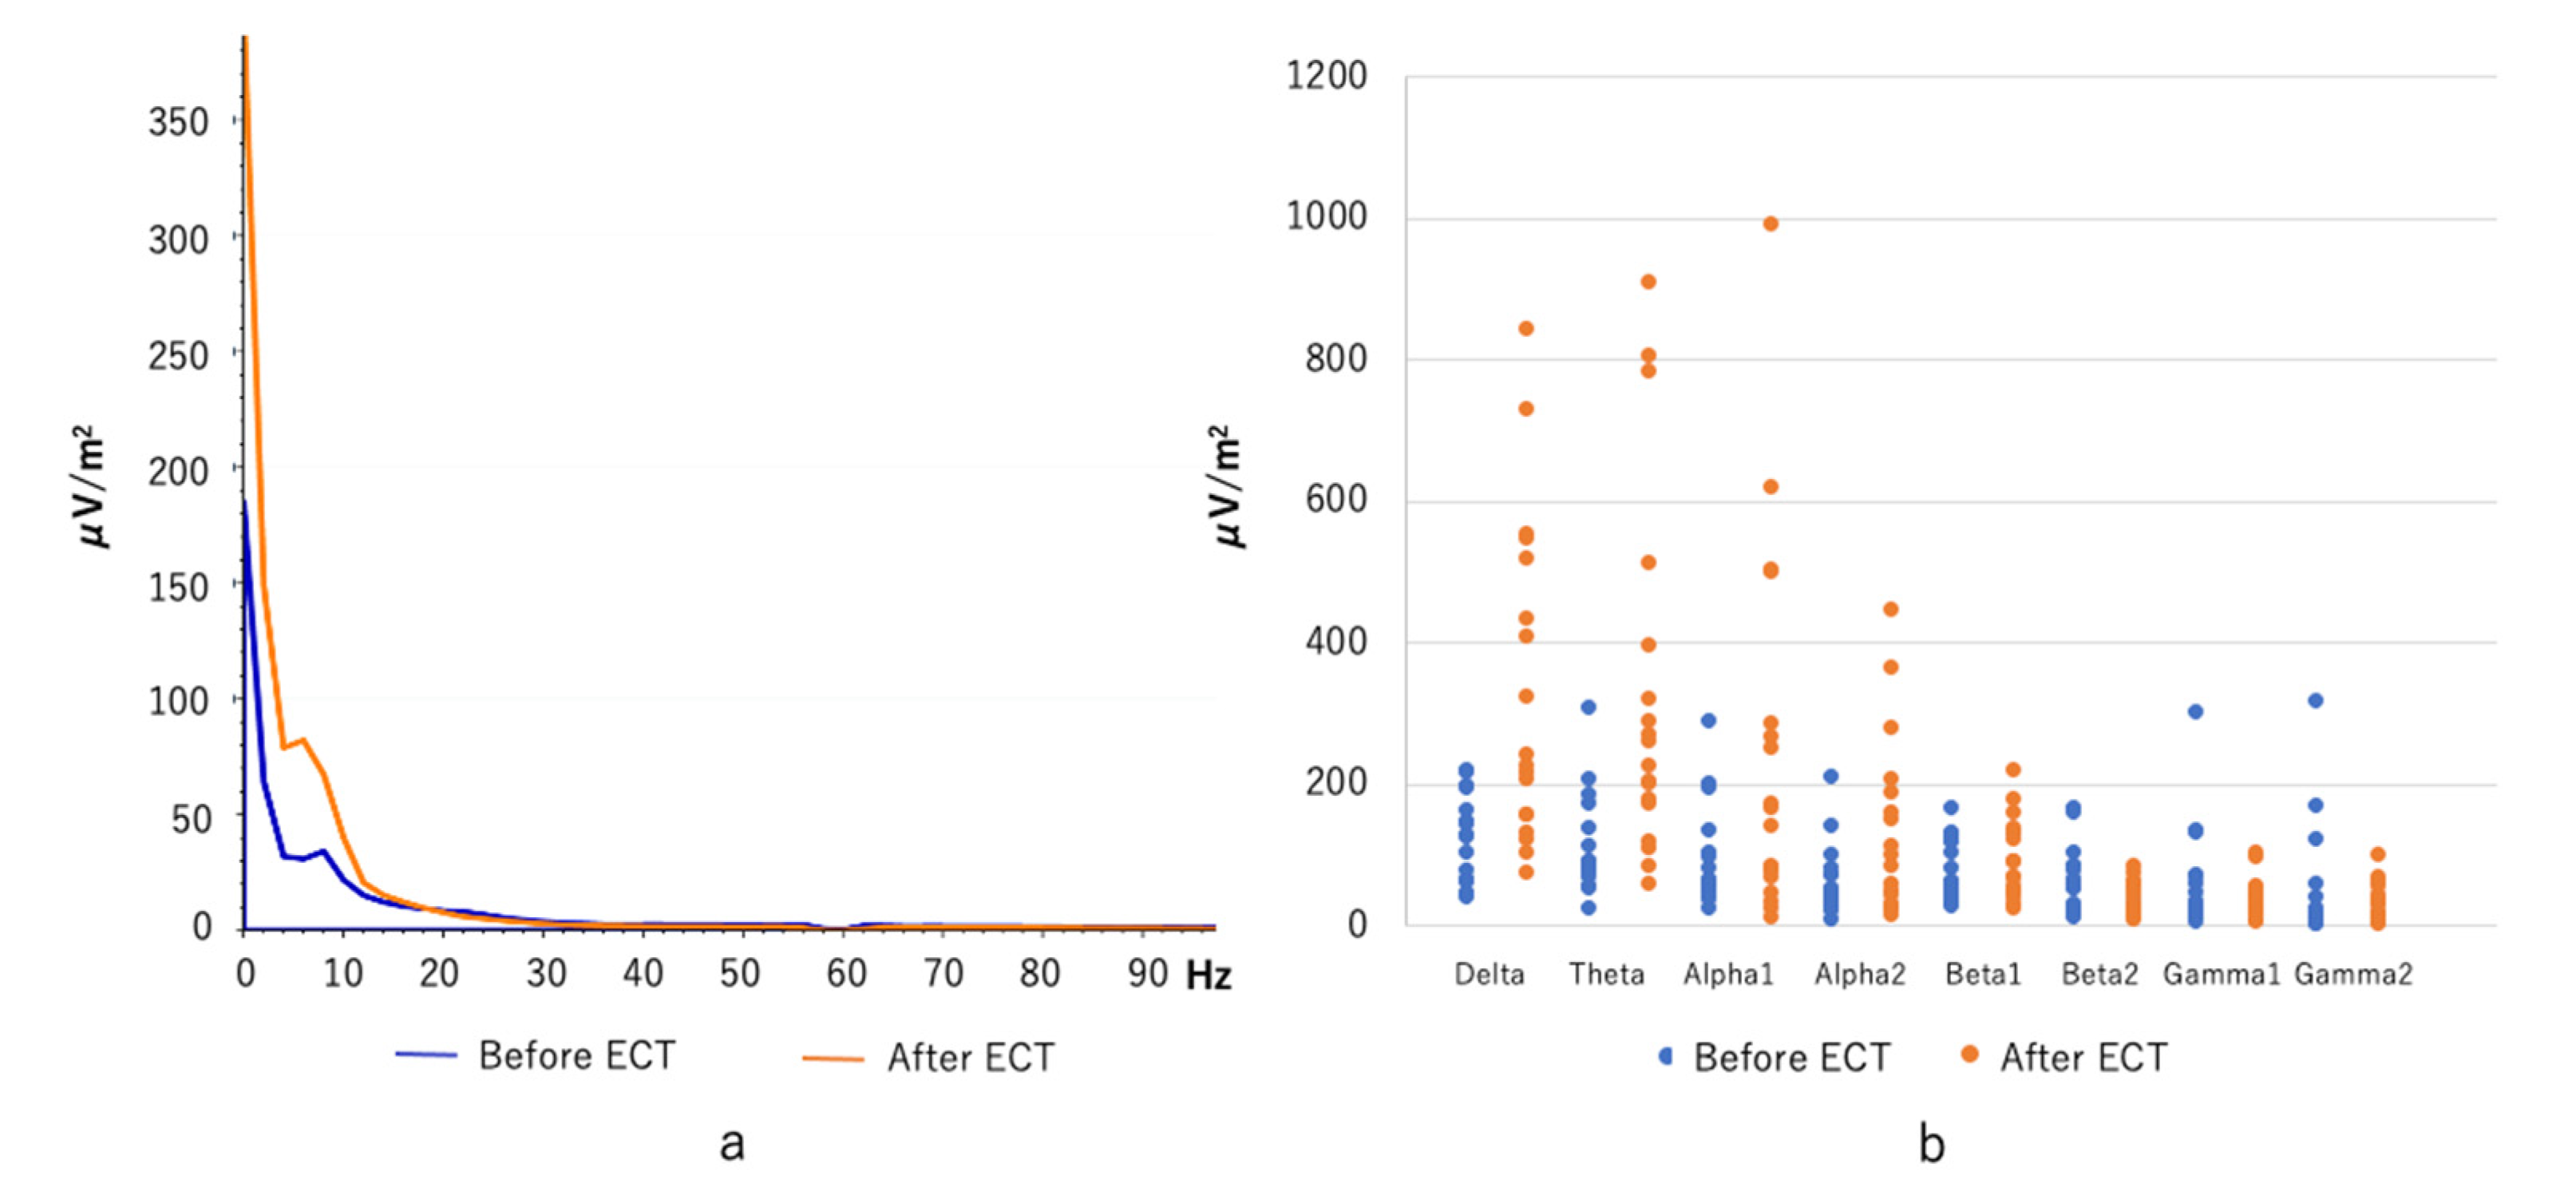
3.1. Spectral Power
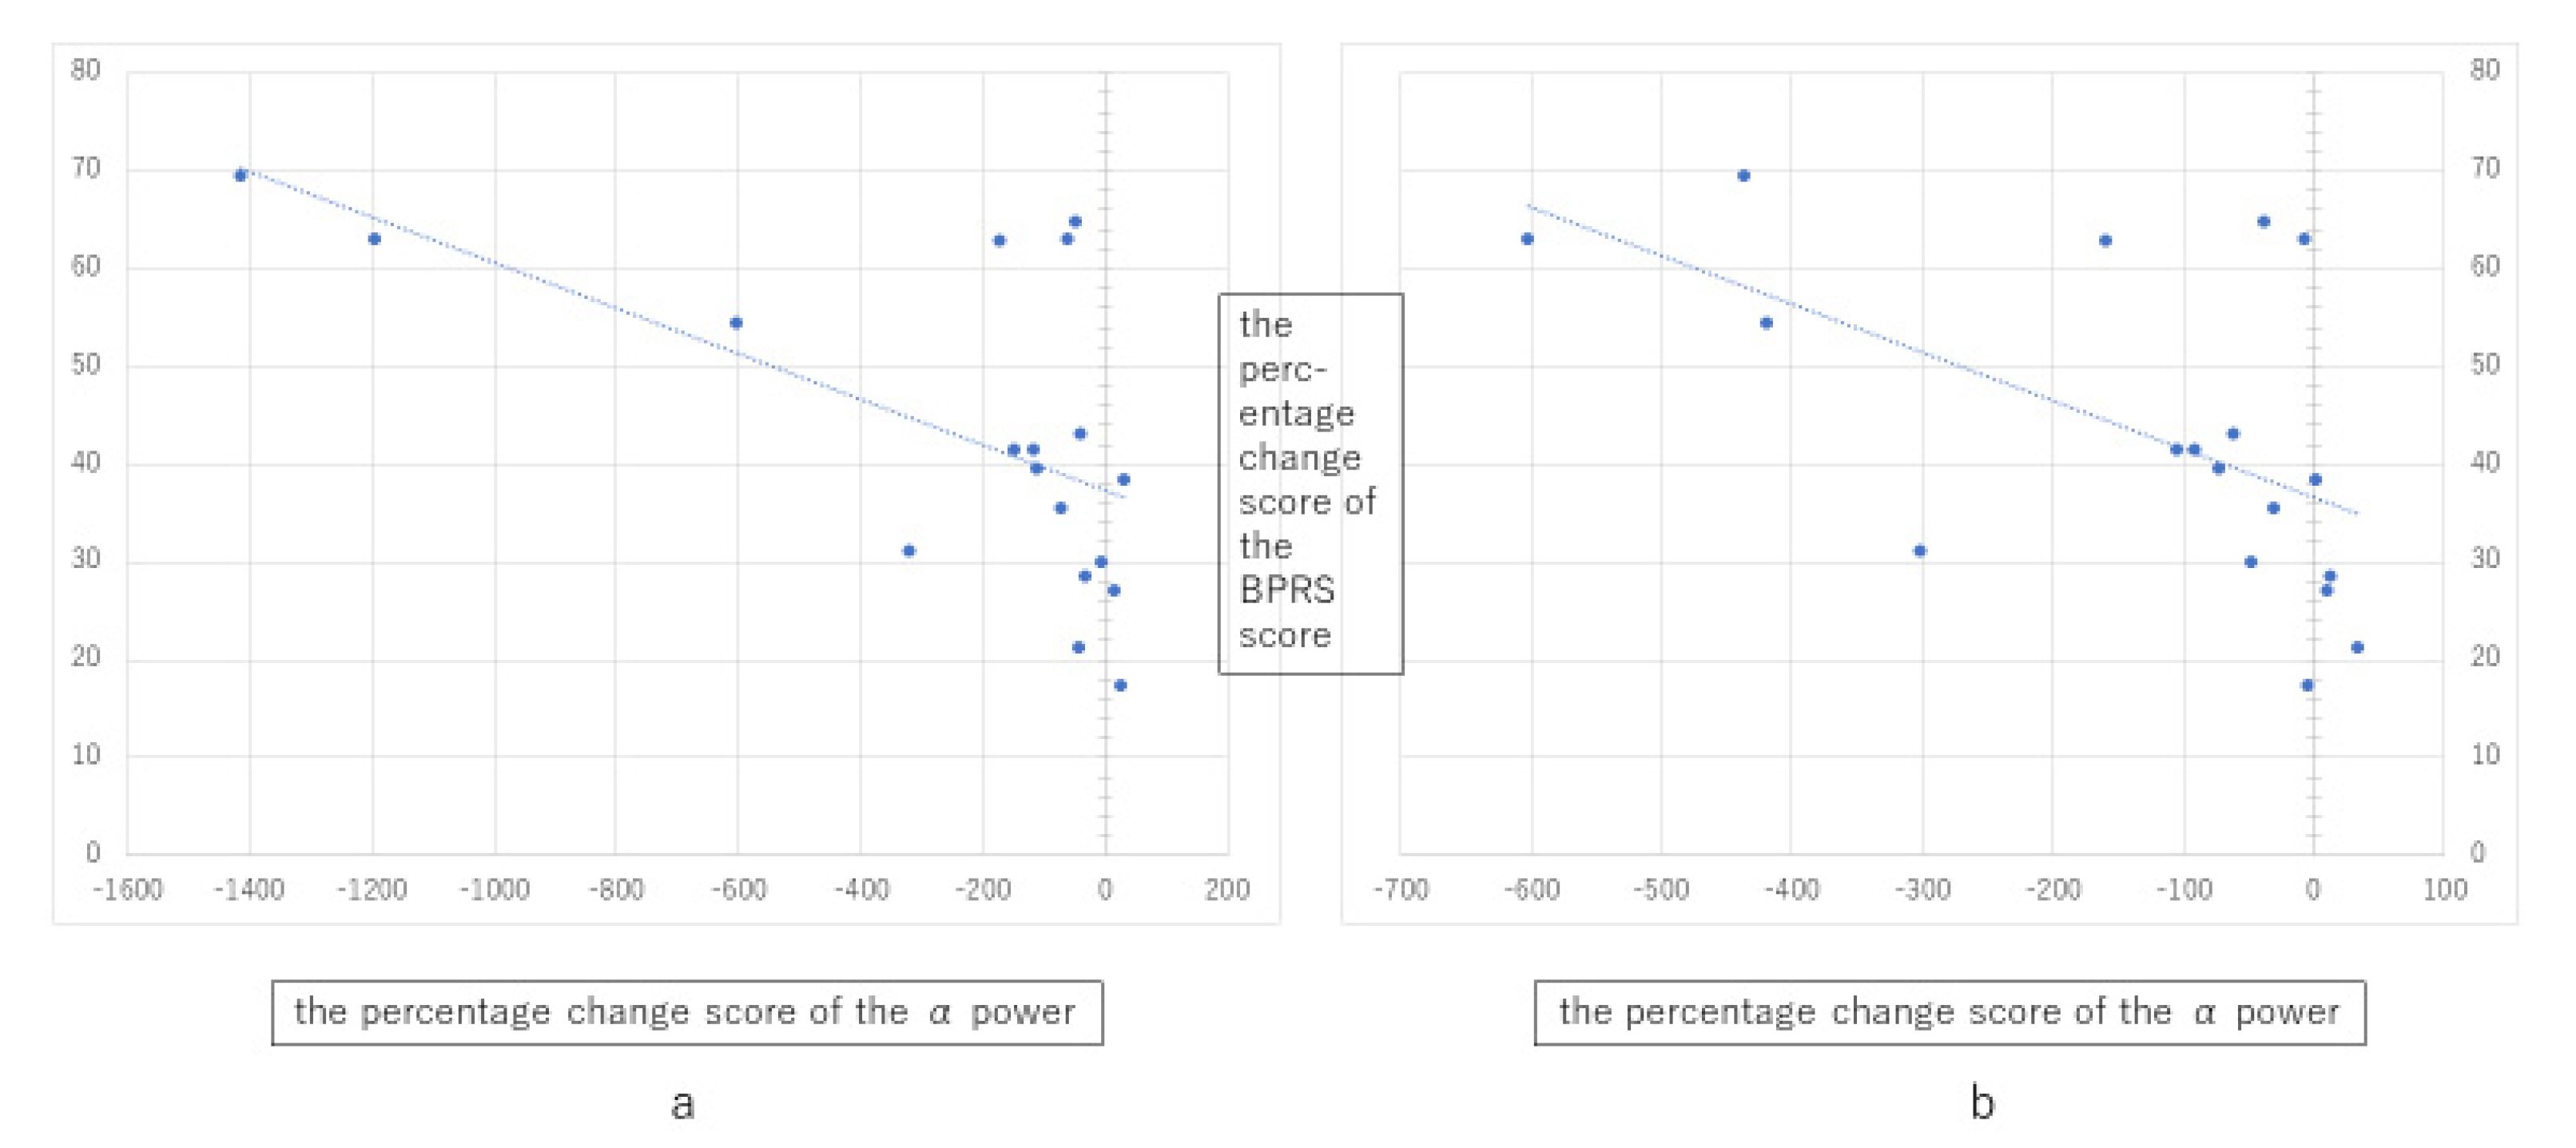
3.2. Correlation between Spectral Power and Clinical Variables
4. Discussion
Author Contributions
Funding
Institutional Review Board Statement
Informed Consent Statement
Data Availability Statement
Acknowledgments
Conflicts of Interest
References
- Cerletti, U.; Bini, L. l’Elettroshock. Arch. Gen. Neurol. Psichiatr. Psicoanal. 1938, 19, 266–268. [Google Scholar]
- Grover, S.; Sahoo, S.; Rabha, A.; Koirala, R. ECT in Schizophrenia: A Review of the Evidence. Acta Neuropsychiatr. 2019, 31, 115–127. [Google Scholar] [CrossRef] [PubMed]
- Kellner, C.H.; Obbels, J.; Sienaert, P. When to Consider Electroconvulsive Therapy (ECT). Acta Psychiatr. Scand. 2020, 141, 304–315. [Google Scholar] [CrossRef] [PubMed]
- Krueger, R.B.; Sackeim, H.A. Electroconvulsive Therapy and Schizophrenia; Hirsch, S.R., Weinberger, D., Eds.; Blackwell Publishing Scientific: Oxford, UK, 1995; pp. 503–545. [Google Scholar]
- Abrams, R. Electroconvulsive Therapy, 3rd ed.; Oxford University Press: New York, NY, USA, 1997. [Google Scholar]
- Brunoni, A.R.; Baeken, C.; Machado-Vieira, R.; Gattaz, W.F.; Vanderhasselt, M.A. BDNF Blood Levels After Electroconvulsive Therapy in Patients with Mood Disorders: A Systematic Review and Meta-Analysis. World J. Biol. Psychiatry 2014, 15, 411–418. [Google Scholar] [CrossRef] [PubMed]
- Rocha, R.B.; Dondossola, E.R.; Grande, A.J.; Colonetti, T.; Ceretta, L.B.; Passos, I.C.; Quevedo, J.; da Rosa, M.I. Increased BDNF Levels After Electroconvulsive Therapy in Patients with Major Depressive Disorder: A Meta-Analysis Study. J. Psychiatr. Res. 2016, 83, 47–53. [Google Scholar] [CrossRef] [PubMed]
- Kruse, J.L.; Congdon, E.; Olmstead, R.; Njau, S.; Breen, E.C.; Narr, K.L.; Espinoza, R.; Irwin, M.R. Inflammation and Improvement of Depression Following Electroconvulsive Therapy in Treatment-Resistant Depression. J. Clin. Psychiatry 2018, 79, 17m1159. [Google Scholar] [CrossRef] [PubMed]
- An, X.; Shi, X. Effects of Electroconvulsive Shock on Neuro-Immune Responses: Does Neuro-Damage Occur? Psychiatry. Res. 2020, 292, 113289. [Google Scholar] [CrossRef] [PubMed]
- Sackeim, H.A.; Luber, B.; Katzman, G.P.; Moeller, J.R.; Prudic, J.; Devanand, D.P.; Nobler, M.S. The Effects of Electroconvulsive Therapy on Quantitative Electroencephalograms. Relationship to Clinical Outcome. Arch. Gen. Psychiatry 1996, 53, 814–824. [Google Scholar] [CrossRef] [PubMed]
- Farzan, F.; Boutros, N.N.; Blumberger, D.M.; Daskalakis, Z.J. What Does the Electroencephalogram Tell Us About the Mechanisms of Action of ECT in Major Depressive Disorders? J. ECT 2014, 30, 98–106. [Google Scholar] [CrossRef] [PubMed]
- Pizzagalli, D.; Pascual-Marqui, R.D.; Nitschke, J.B.; Oakes, T.R.; Larson, C.L.; Abercrombie, H.C.; Schaefer, S.M.; Koger, J.V.; Benca, R.M.; Davidson, R.J. Anterior Cingulate Activity as a Predictor of Degree of Treatment Response in Major Depression: Evidence from Brain Electrical Tomography Analysis. Am. J. Psychiatry 2001, 158, 405–415. [Google Scholar] [CrossRef] [PubMed]
- McCormick, L.M.; Yamada, T.; Yeh, M.; Brumm, M.C.; Thatcher, R.W. Antipsychotic Effect of Electroconvulsive Therapy Is Related to Normalization of Subgenual Cingulate Theta Activity in Psychotic Depression. J. Psychiatr. Res. 2009, 43, 553–560. [Google Scholar] [CrossRef] [PubMed]
- Honda, S.; Matsumoto, M.; Tajinda, K.; Mihara, T. Enhancing Clinical Trials through Synergistic Gamma Power Analysis. Front. Psychiatry 2020, 11, 537. [Google Scholar] [CrossRef]
- Bolwig, T.G. Neuroimaging and Electroconvulsive Therapy: A Review. J. ECT 2014, 30, 138–142. [Google Scholar] [CrossRef] [PubMed]
- American Psychiatric Association. Diagnostic and Statistical Manual of Mental Disorders, 5th ed.; Amer Psychiatric Pub.: Arlington, VA, USA, 2013. [Google Scholar]
- American Psychiatric Association Committee; Weiner, R.D. The Practice of Electroconvulsive Therapy: Recommendations for Treatment, Training, and Privileging: A Task Force Report of the American Psychiatric Association; Amer Psychiatric Pub.: Arlington, VA, USA, 2001. [Google Scholar]
- Ventura, J.; Lukoff, D.; Nuechterlein, K.H.; Liberman, R.P.; Green, M.; Shaner, A. Brief Psychiatric Rating Scale (BPRS), expanded version 4.0: Scales, anchor points, and administration manual. Int. J. Meth. Psych. 1993, 3, 227–244. [Google Scholar]
- Overall, J.E.; Gorham, D.R. The Brief Psychiatric Rating Scale. Psychol. Rep. 1962, 10, 799–812. [Google Scholar] [CrossRef]
- Chen, X.S.; Liu, M.S. Application of Brain Electrical Activity Mapping in Psychiatrical Studies. J. Mod. Electrophysiol. 2010, 17, 188–192. [Google Scholar]
- Zhao, L.; Jiang, Y.; Zhang, H. Effects of Modified Electroconvulsive Therapy on the Electroencephalogram of Schizophrenia Patients. Springerplus 2016, 5, 1063. [Google Scholar] [CrossRef] [PubMed] [Green Version]
- Bruder, G.E.; Sedoruk, J.P.; Stewart, J.W.; McGrath, P.J.; Quitkin, F.M.; Tenke, C.E. Electroencephalographic Alpha Measures Predict Therapeutic Response to a Selective Serotonin Reuptake Inhibitor Antidepressant: Pre- and Post-Treatment Findings. Biol. Psychiatry 2008, 63, 1171–1177. [Google Scholar] [CrossRef] [PubMed] [Green Version]
- Başar, E. A review of α Activity in Integrative Brain Function: Fundamental Physiology, Sensory Coding, Cognition and Pathology. Int. J. Psychophysiol. 2012, 86, 1–24. [Google Scholar] [CrossRef] [PubMed]
- Canuet, L.; Ishii, R.; Pascual-Marqui, R.D.; Iwase, M.; Kurimoto, R.; Aoki, Y.; Ikeda, S.; Takahashi, H.; Nakahachi, T.; Takeda, M. Resting-state EEG Source Localization and Functional Connectivity in Schizophrenia-Like Psychosis of Epilepsy. PLoS ONE 2011, 6, e27863. [Google Scholar] [CrossRef] [PubMed] [Green Version]
- Fu, Z.; Sui, J.; Espinoza, R.; Narr, K.; Qi, S.; Sendi, M.S.E.; Abbott, C.C.; Calhoun, V.D. Whole-Brain Functional Connectivity Dynamics Associated with Electroconvulsive Therapy Treatment Response. Biol. Psychiatry Cogn. Neurosci. Neuroimaging 2021, in press. [Google Scholar] [CrossRef] [PubMed]


| No. | Sex | Age (y) | Diagnosis | Number of ECT Treatments | Pulse-Wave Therapy Device | Sine-Wave Therapy Device | BPRS | Onset Age (y) | Recent Illness Period (mo) | Illness Episodes (mo) | Concomitant Psychotropics | ||||
|---|---|---|---|---|---|---|---|---|---|---|---|---|---|---|---|
| EA | Emax (%) | PWmax (msec) | Vmax (V) | ET (sec) | Before | After | |||||||||
| 1 | M | 27 | Sc | 12 | bf | 40 | 0.5 | 86 | 52 | 20 | 3 | 2 | HPD9mg, Que400mg | ||
| 2 | M | 26 | Sc | 15 | bf | 90 | 0.5 | 70 | 41 | 18 | 9 | 2 | Ola20mg, HPD9mg | ||
| 3 | M | 32 | Sc | 12 | bf | 15 | 0.5 | 90 | 62 | 25 | 13 | 3 | Ris12mg, Que200mg | ||
| 4 | M | 19 | Sc | 12 | bf | 15 | 0.5 | 98 | 81 | 15 | 21 | 3 | Clo600mg | ||
| 5 | M | 30 | Sc | 27 | bf | 100 | 0.5 | 105 | 75 | 24 | 27 | 3 | Zot300mg | ||
| 6 | F | 70 | MD | 7 | bf | 35 | 0.5 | 43 | 26 | 52 | 3 | 8 | Mir45mg, Ola5mg | ||
| 7 | M | 44 | Sc | 12 | bf | 100 | 0.75 | 61 | 48 | 16 | 14 | 15 | Ris12mg, Ase20mg | ||
| 8 | F | 45 | Sc | 19 | bf | 100 | 1 | 121 | 37 | 22 | 1 | 5 | Ola5mg | ||
| 9 | M | 57 | BD | 26 | bf | 100 | 1.25 | 115 | 10 | 50 | 35 | 39 | 21 | 5 | Mil50mg |
| 10 | F | 68 | MD | 12 | bf | 100 | 0.5 | 113 | 42 | 67 | 3 | 2 | Esc20mg, Ris8mg | ||
| 11 | F | 61 | MD | 13 | bf | 45 | 0.5 | 78 | 48 | 60 | 14 | 1 | Ven225mg, Mir15mg, Ola20mg | ||
| 12 | M | 86 | MD | 12 | ru | 60 | 0.25 | 65 | 38 | 85 | 4 | 2 | Dul40mg, Mir15mg, Tra50mg | ||
| 13 | M | 70 | MD | 15 | ru | 70 | 0.25 | 71 | 25 | 69 | 9 | 1 | Esc20mg, Mir45mg, Ari3mg | ||
| 14 | F | 63 | BD | 10 | ru | 50 | 0.25 | 48 | 31 | 50 | 6 | 6 | VPA 600mg, Que112.5mg | ||
| 15 | M | 69 | Sc | 12 | ru | 50 | 0.25 | 90 | 41 | 30 | 6 | 2 | Ase15mg, CPZ100mg | ||
| 16 | F | 47 | ATPD | 15 | bf | 50 | 0.5 | 92 | 50 | 47 | 1 | 1 | Que300mg | ||
| 17 | F | 67 | MD | 9 | ru | 50 | 0.25 | 73 | 35 | 66 | 4 | 1 | Esc20mg, Que300mg, Ris1mg | ||
| 18 | M | 50 | Sc | 15 | bf | 100 | 0.5 | 74 | 54 | 19 | 60 | 10 | Clo450mg | ||
| Avg | 51.7 | 79.3 | 45.6 | 40.2 | 12.2 | 4 | |||||||||
| SD | 19.1 | 22 | 15.3 | 22.2 | 14.1 | 3.7 | |||||||||
Publisher’s Note: MDPI stays neutral with regard to jurisdictional claims in published maps and institutional affiliations. |
© 2021 by the authors. Licensee MDPI, Basel, Switzerland. This article is an open access article distributed under the terms and conditions of the Creative Commons Attribution (CC BY) license (https://creativecommons.org/licenses/by/4.0/).
Share and Cite
Iwanaga, H.; Ueno, T.; Oribe, N.; Hashimoto, M.; Nishimura, J.; Nakayama, N.; Haraguchi, N.; Tateishi, H.; Kunitake, Y.; Mizoguchi, Y.; et al. Correlation between Post-Acute Electroconvulsive Therapy Alpha-Band Spectrum Power Increase and Improvement of Psychiatric Symptoms. J. Pers. Med. 2021, 11, 1315. https://doi.org/10.3390/jpm11121315
Iwanaga H, Ueno T, Oribe N, Hashimoto M, Nishimura J, Nakayama N, Haraguchi N, Tateishi H, Kunitake Y, Mizoguchi Y, et al. Correlation between Post-Acute Electroconvulsive Therapy Alpha-Band Spectrum Power Increase and Improvement of Psychiatric Symptoms. Journal of Personalized Medicine. 2021; 11(12):1315. https://doi.org/10.3390/jpm11121315
Chicago/Turabian StyleIwanaga, Hideyuki, Takefumi Ueno, Naoya Oribe, Manabu Hashimoto, Jun Nishimura, Naho Nakayama, Nami Haraguchi, Hiroshi Tateishi, Yutaka Kunitake, Yoshito Mizoguchi, and et al. 2021. "Correlation between Post-Acute Electroconvulsive Therapy Alpha-Band Spectrum Power Increase and Improvement of Psychiatric Symptoms" Journal of Personalized Medicine 11, no. 12: 1315. https://doi.org/10.3390/jpm11121315
APA StyleIwanaga, H., Ueno, T., Oribe, N., Hashimoto, M., Nishimura, J., Nakayama, N., Haraguchi, N., Tateishi, H., Kunitake, Y., Mizoguchi, Y., & Monji, A. (2021). Correlation between Post-Acute Electroconvulsive Therapy Alpha-Band Spectrum Power Increase and Improvement of Psychiatric Symptoms. Journal of Personalized Medicine, 11(12), 1315. https://doi.org/10.3390/jpm11121315