Personalized beyond Precision: Designing Unbiased Gold Standards to Improve Single-Subject Studies of Personal Genome Dynamics from Gene Products


Abstract
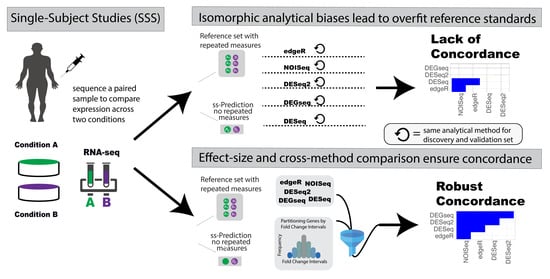
1. Introduction
2. Methods and Materials
2.1. Datasets
2.2. Software Environment
2.3. Differential Expression Software Tools
2.4. Building Effect-Size-Informed Reference Standards
2.5. Low Expression Pre-Filtering
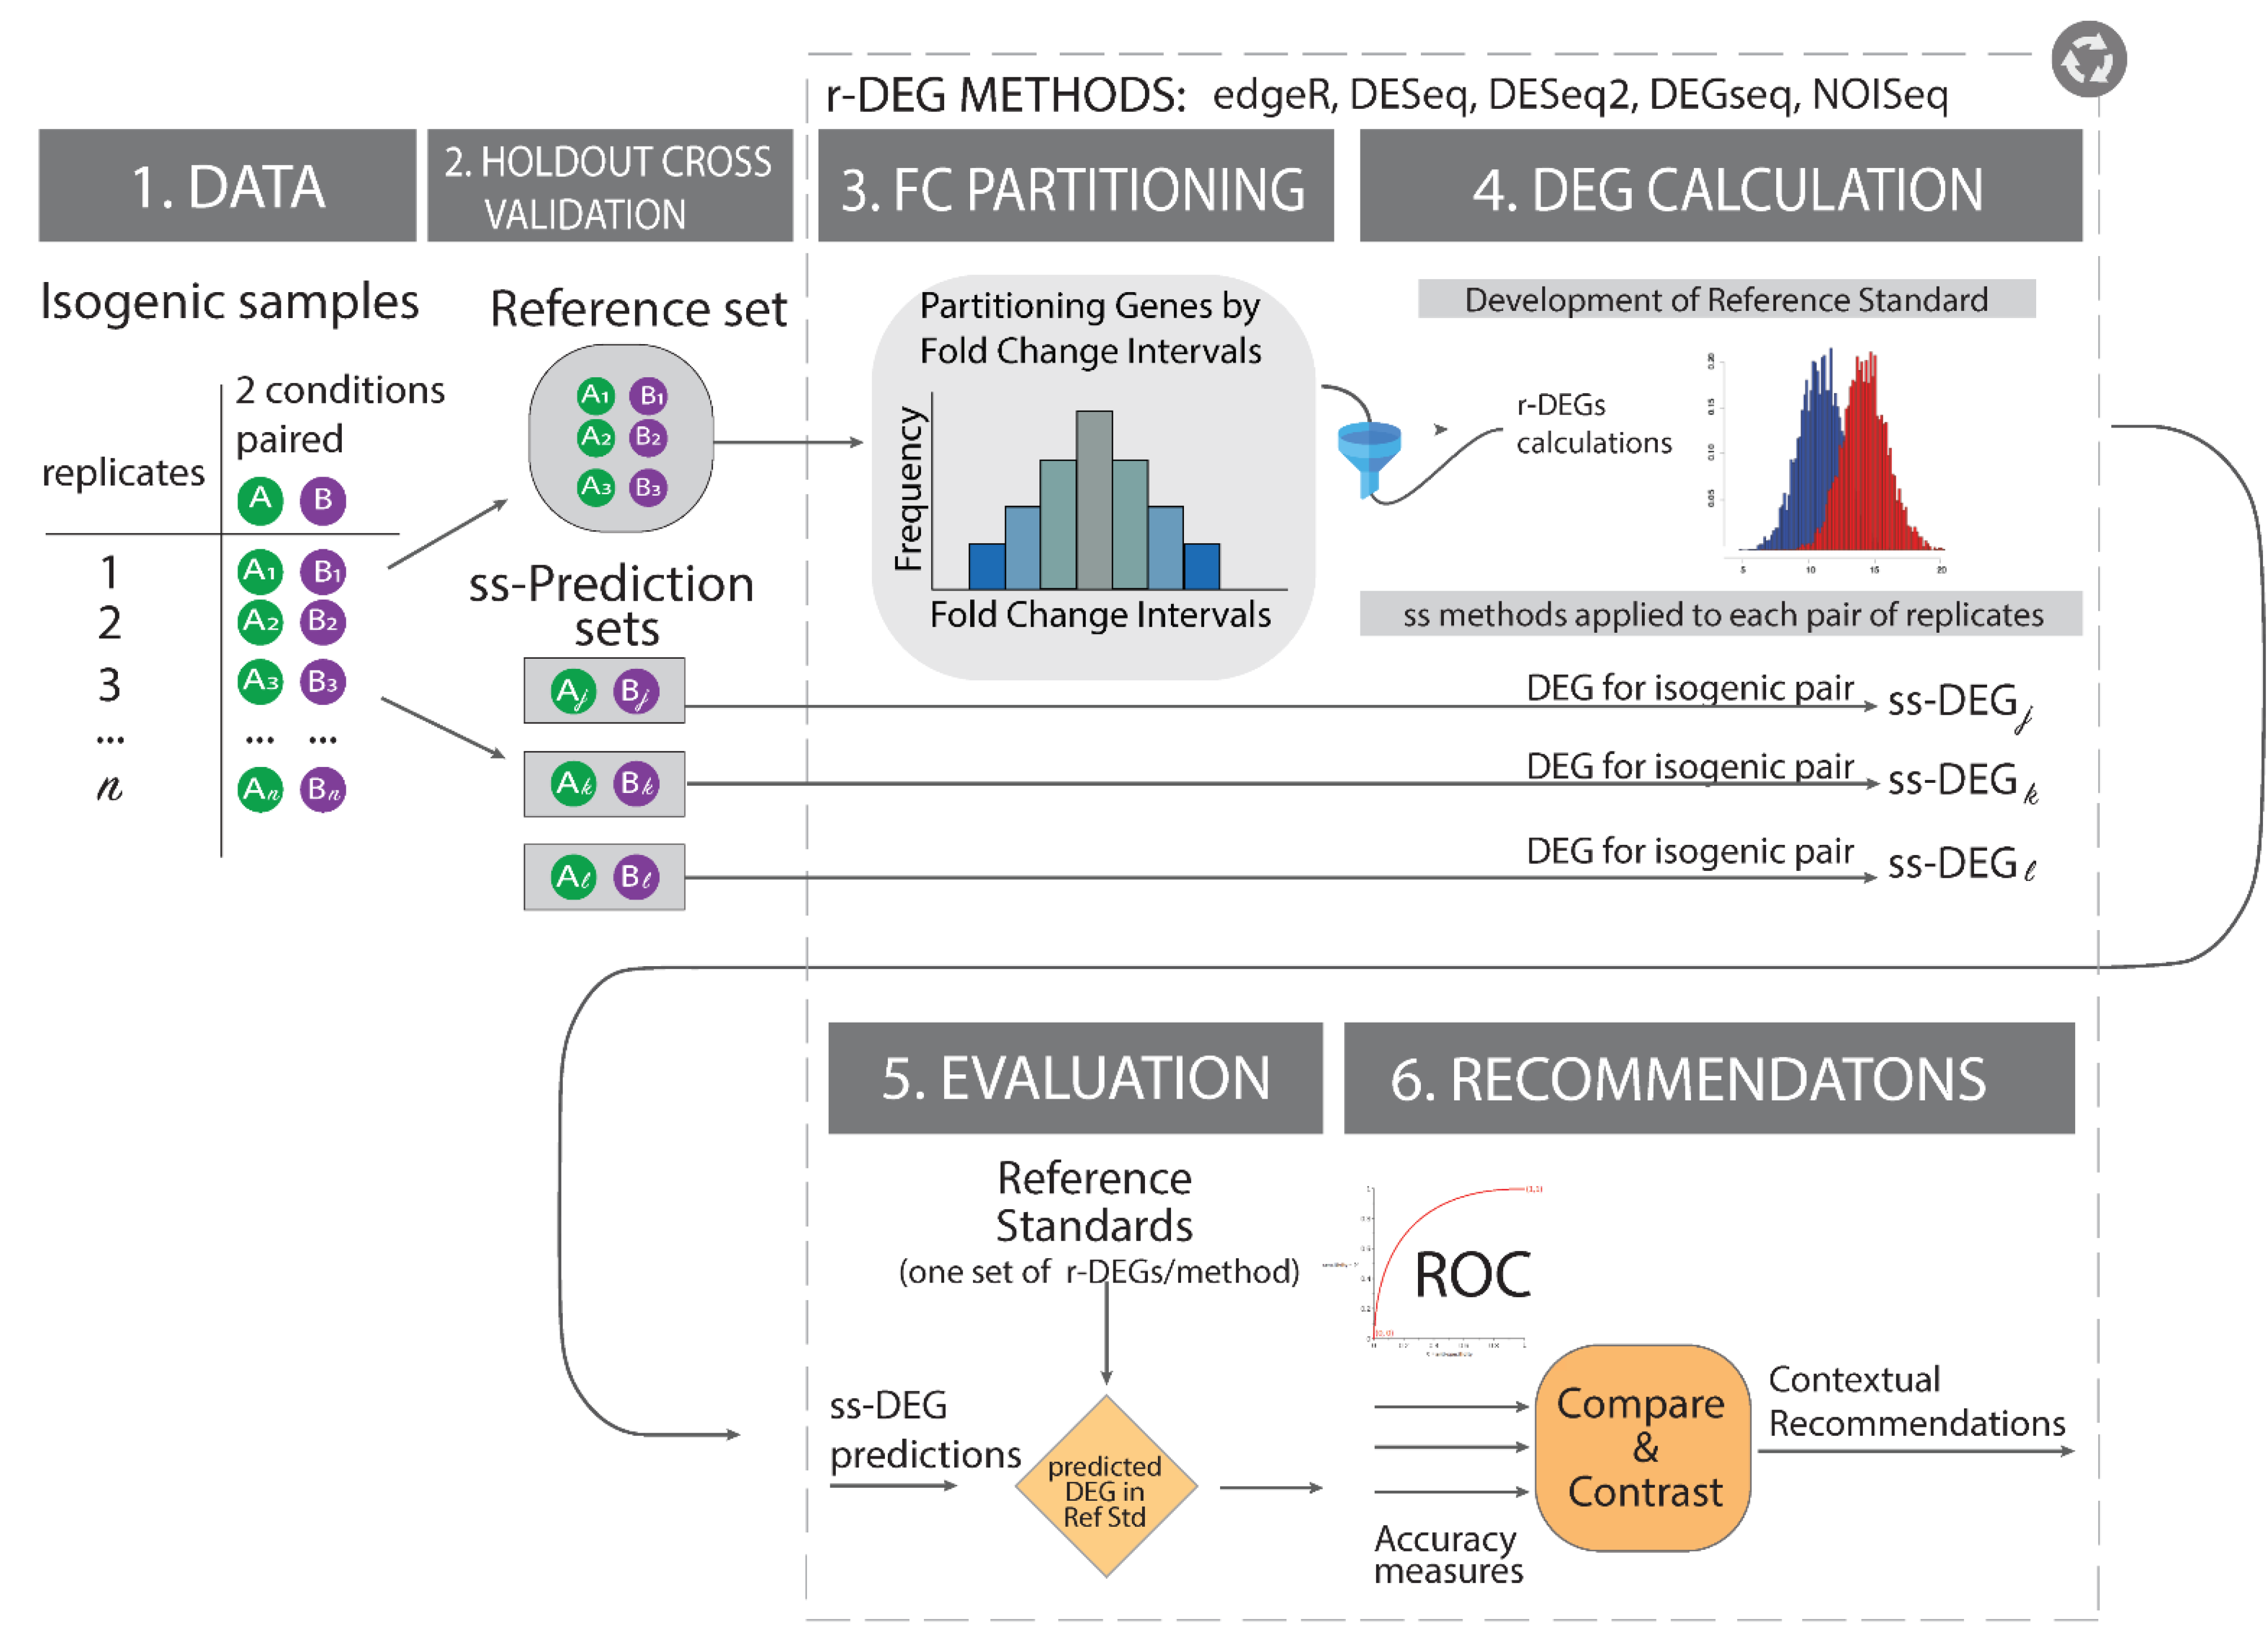
2.6. Experimental Design
2.7. Optimization of a Reference Standard Using Maximum Jaccard Index Concordance
| Algorithm 1. The referenceNof1 algorithm pseudocode to construct an optimized and unbiased reference standard. | ||
| Variable | Description | |
| Inputs | FC | A list of fold change thresholds |
| Cutoffs | A list of expression thresholds | |
| Target | A minimum median Jaccard index to attain | |
| Steps | For genes in region using Cutoffi and FCi, do | |
| For method do | ||
| Identify set of differentially expressed genes | ||
| End for | ||
| Calculate pairwise Jaccard Index (JI) for all (M,N) pairs of methods: | ||
| Calculate median Jaccard Index | ||
| If ( Target) | ||
| Return Cutoff* = Cutoffi, FC* = FCi | ||
| Else | ||
| Update FC, Cutoff parameters | ||
| End for | ||
| If (Target attained) | ||
| Return Cutoff*, FC* | ||
| Else | ||
| Print No threshold achieved target Jaccard Index | ||
| The referenceNof1 algorithm requires a user to input the FC and expression cutoff filters for it to then identify the optimal region for producing the reference standard. For each pair of FC-region and expression cutoff combination, it calculates each method’s list of differentially expressed genes (DEGs), and then for each DEG list it calculates the Jaccard Index as a set-theoretic pairwise similarity measure. After calculating all pairwise Jaccard indices, it calculates the median for each region. If a parameter combination attains the desired median Jaccard Index, an early stopping rule is implemented, and the optimal parameter combination is returned. Otherwise, it continues the search until the target Jaccard Index is attained or the search through the parameter space is complete. (Legend: In the manuscript and figure, we represent FC for upregulated genes and 1/FC for downregulated genes.”) | ||
2.8. Comparing the Proposed Reference Standard Optimization with a Single Heteromorphic One
2.9. ReferenceNof1 R Package
3. Results
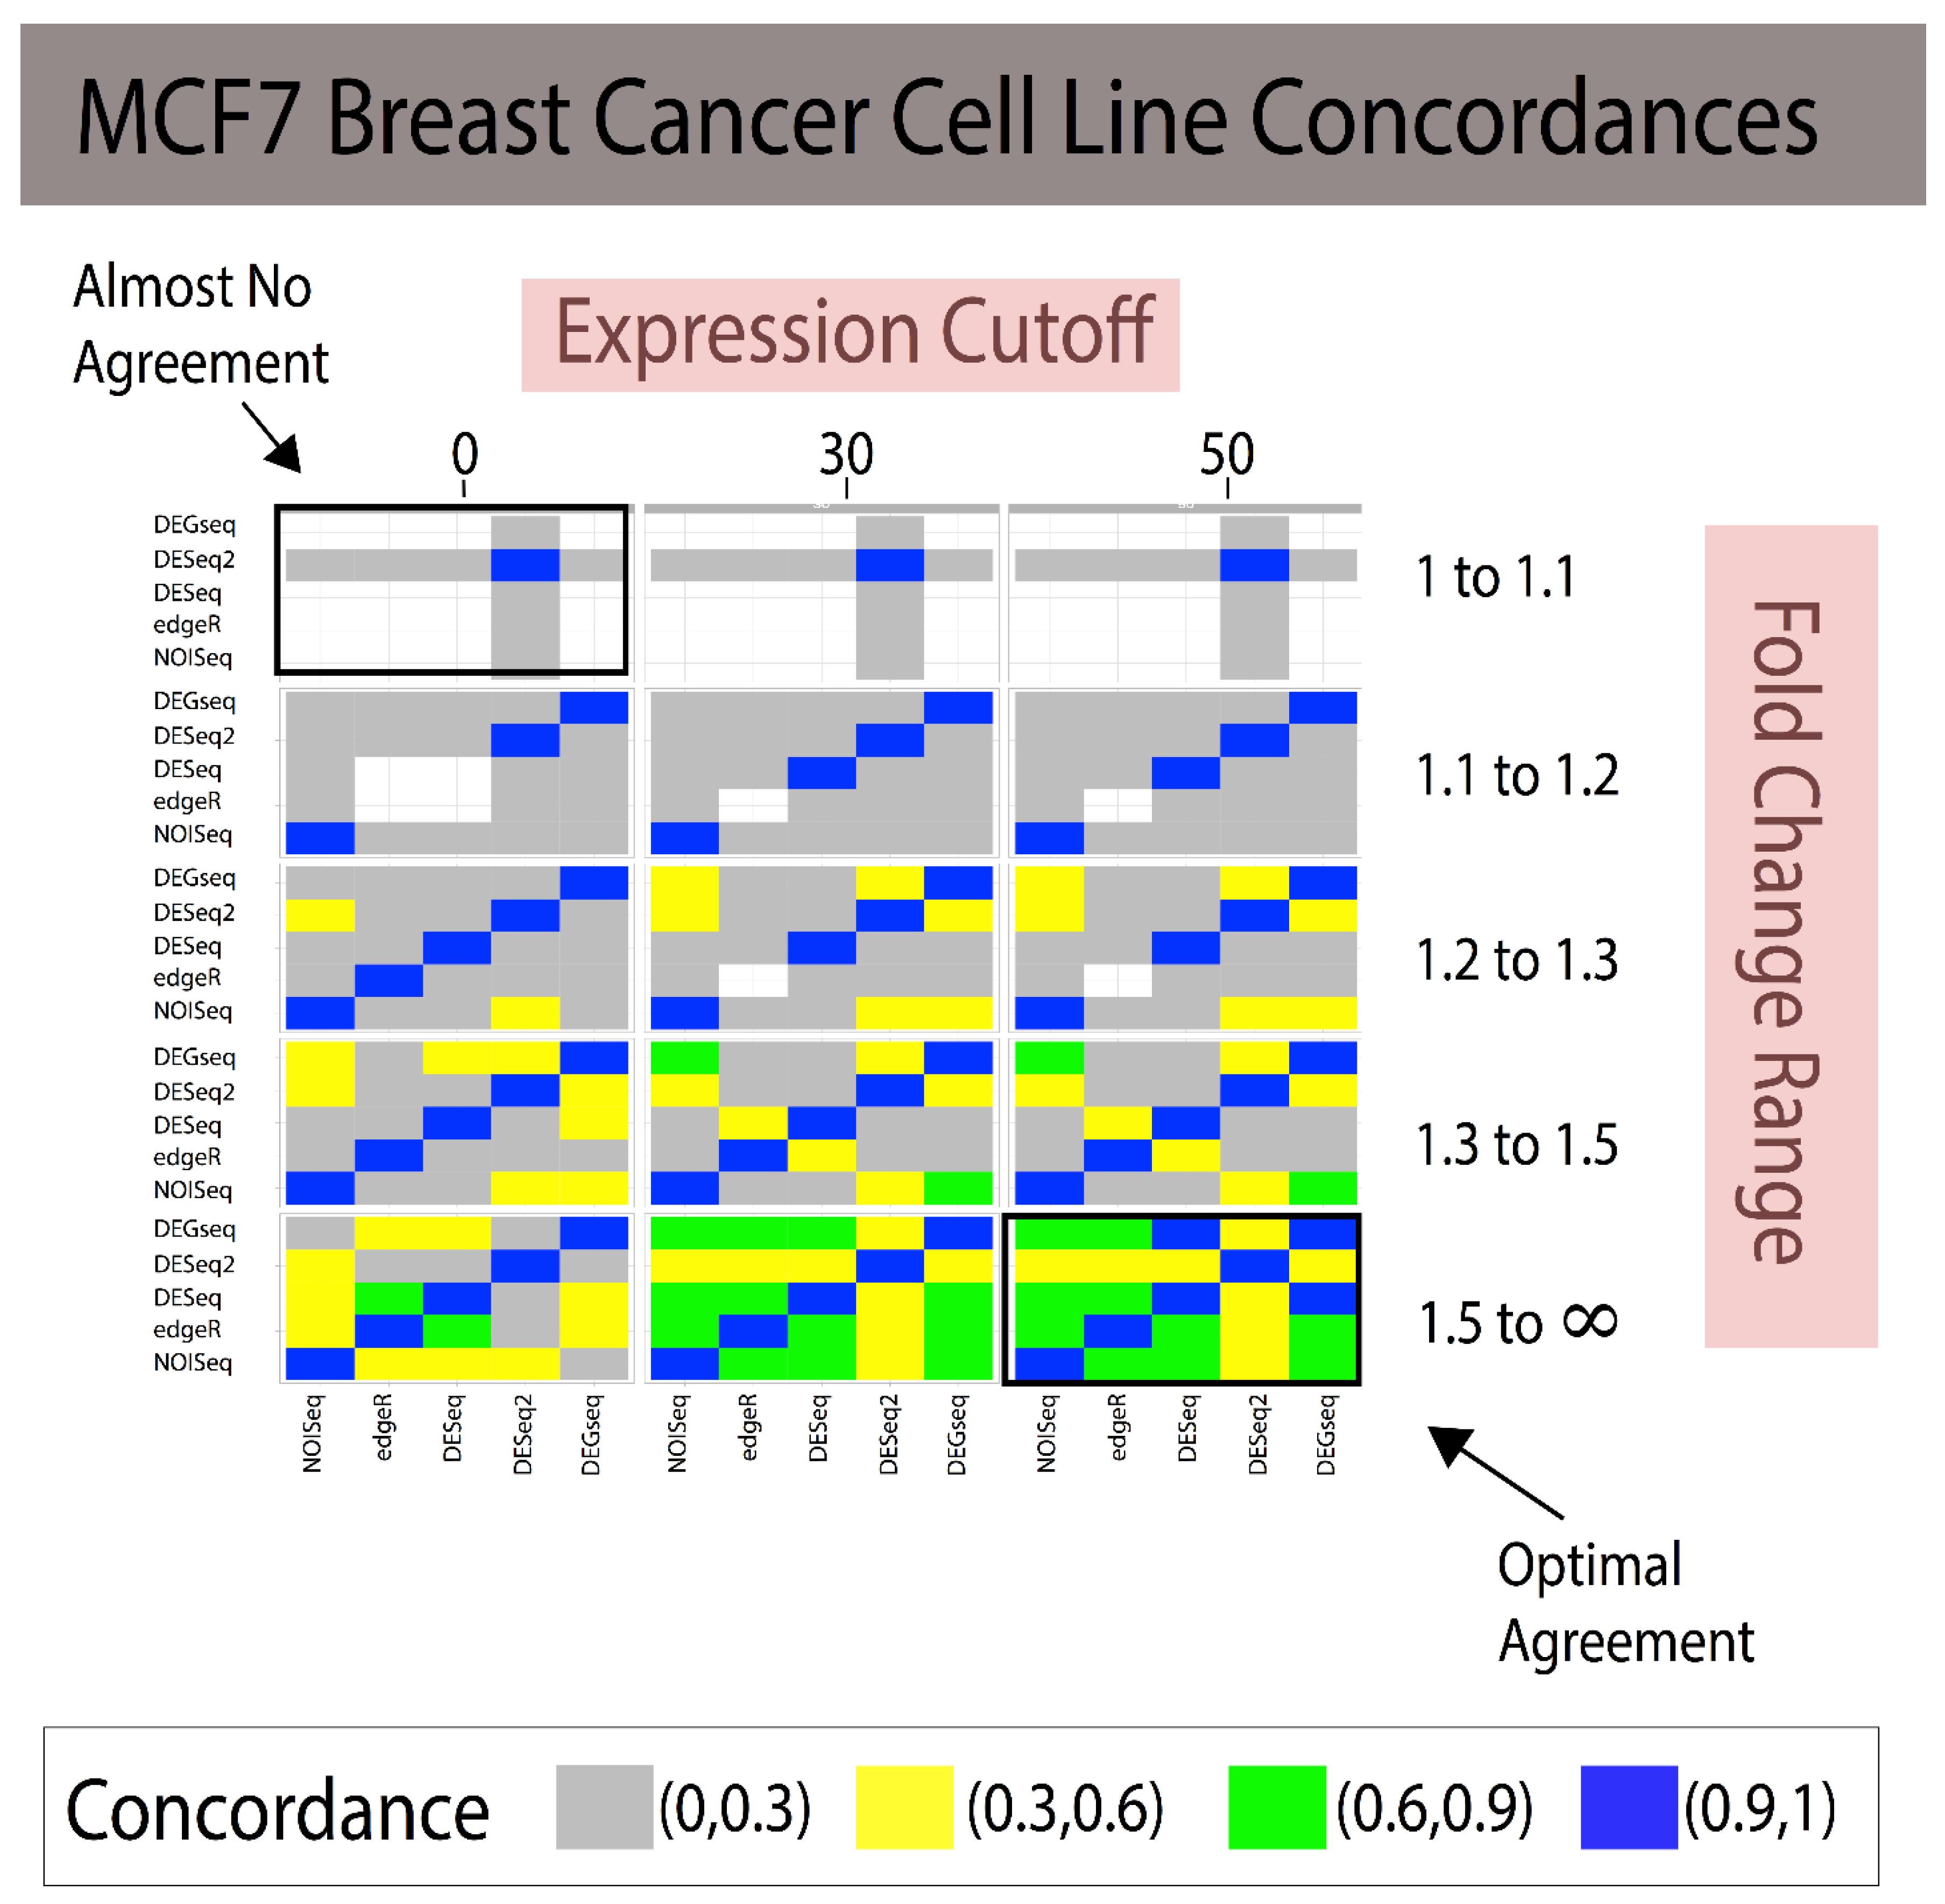
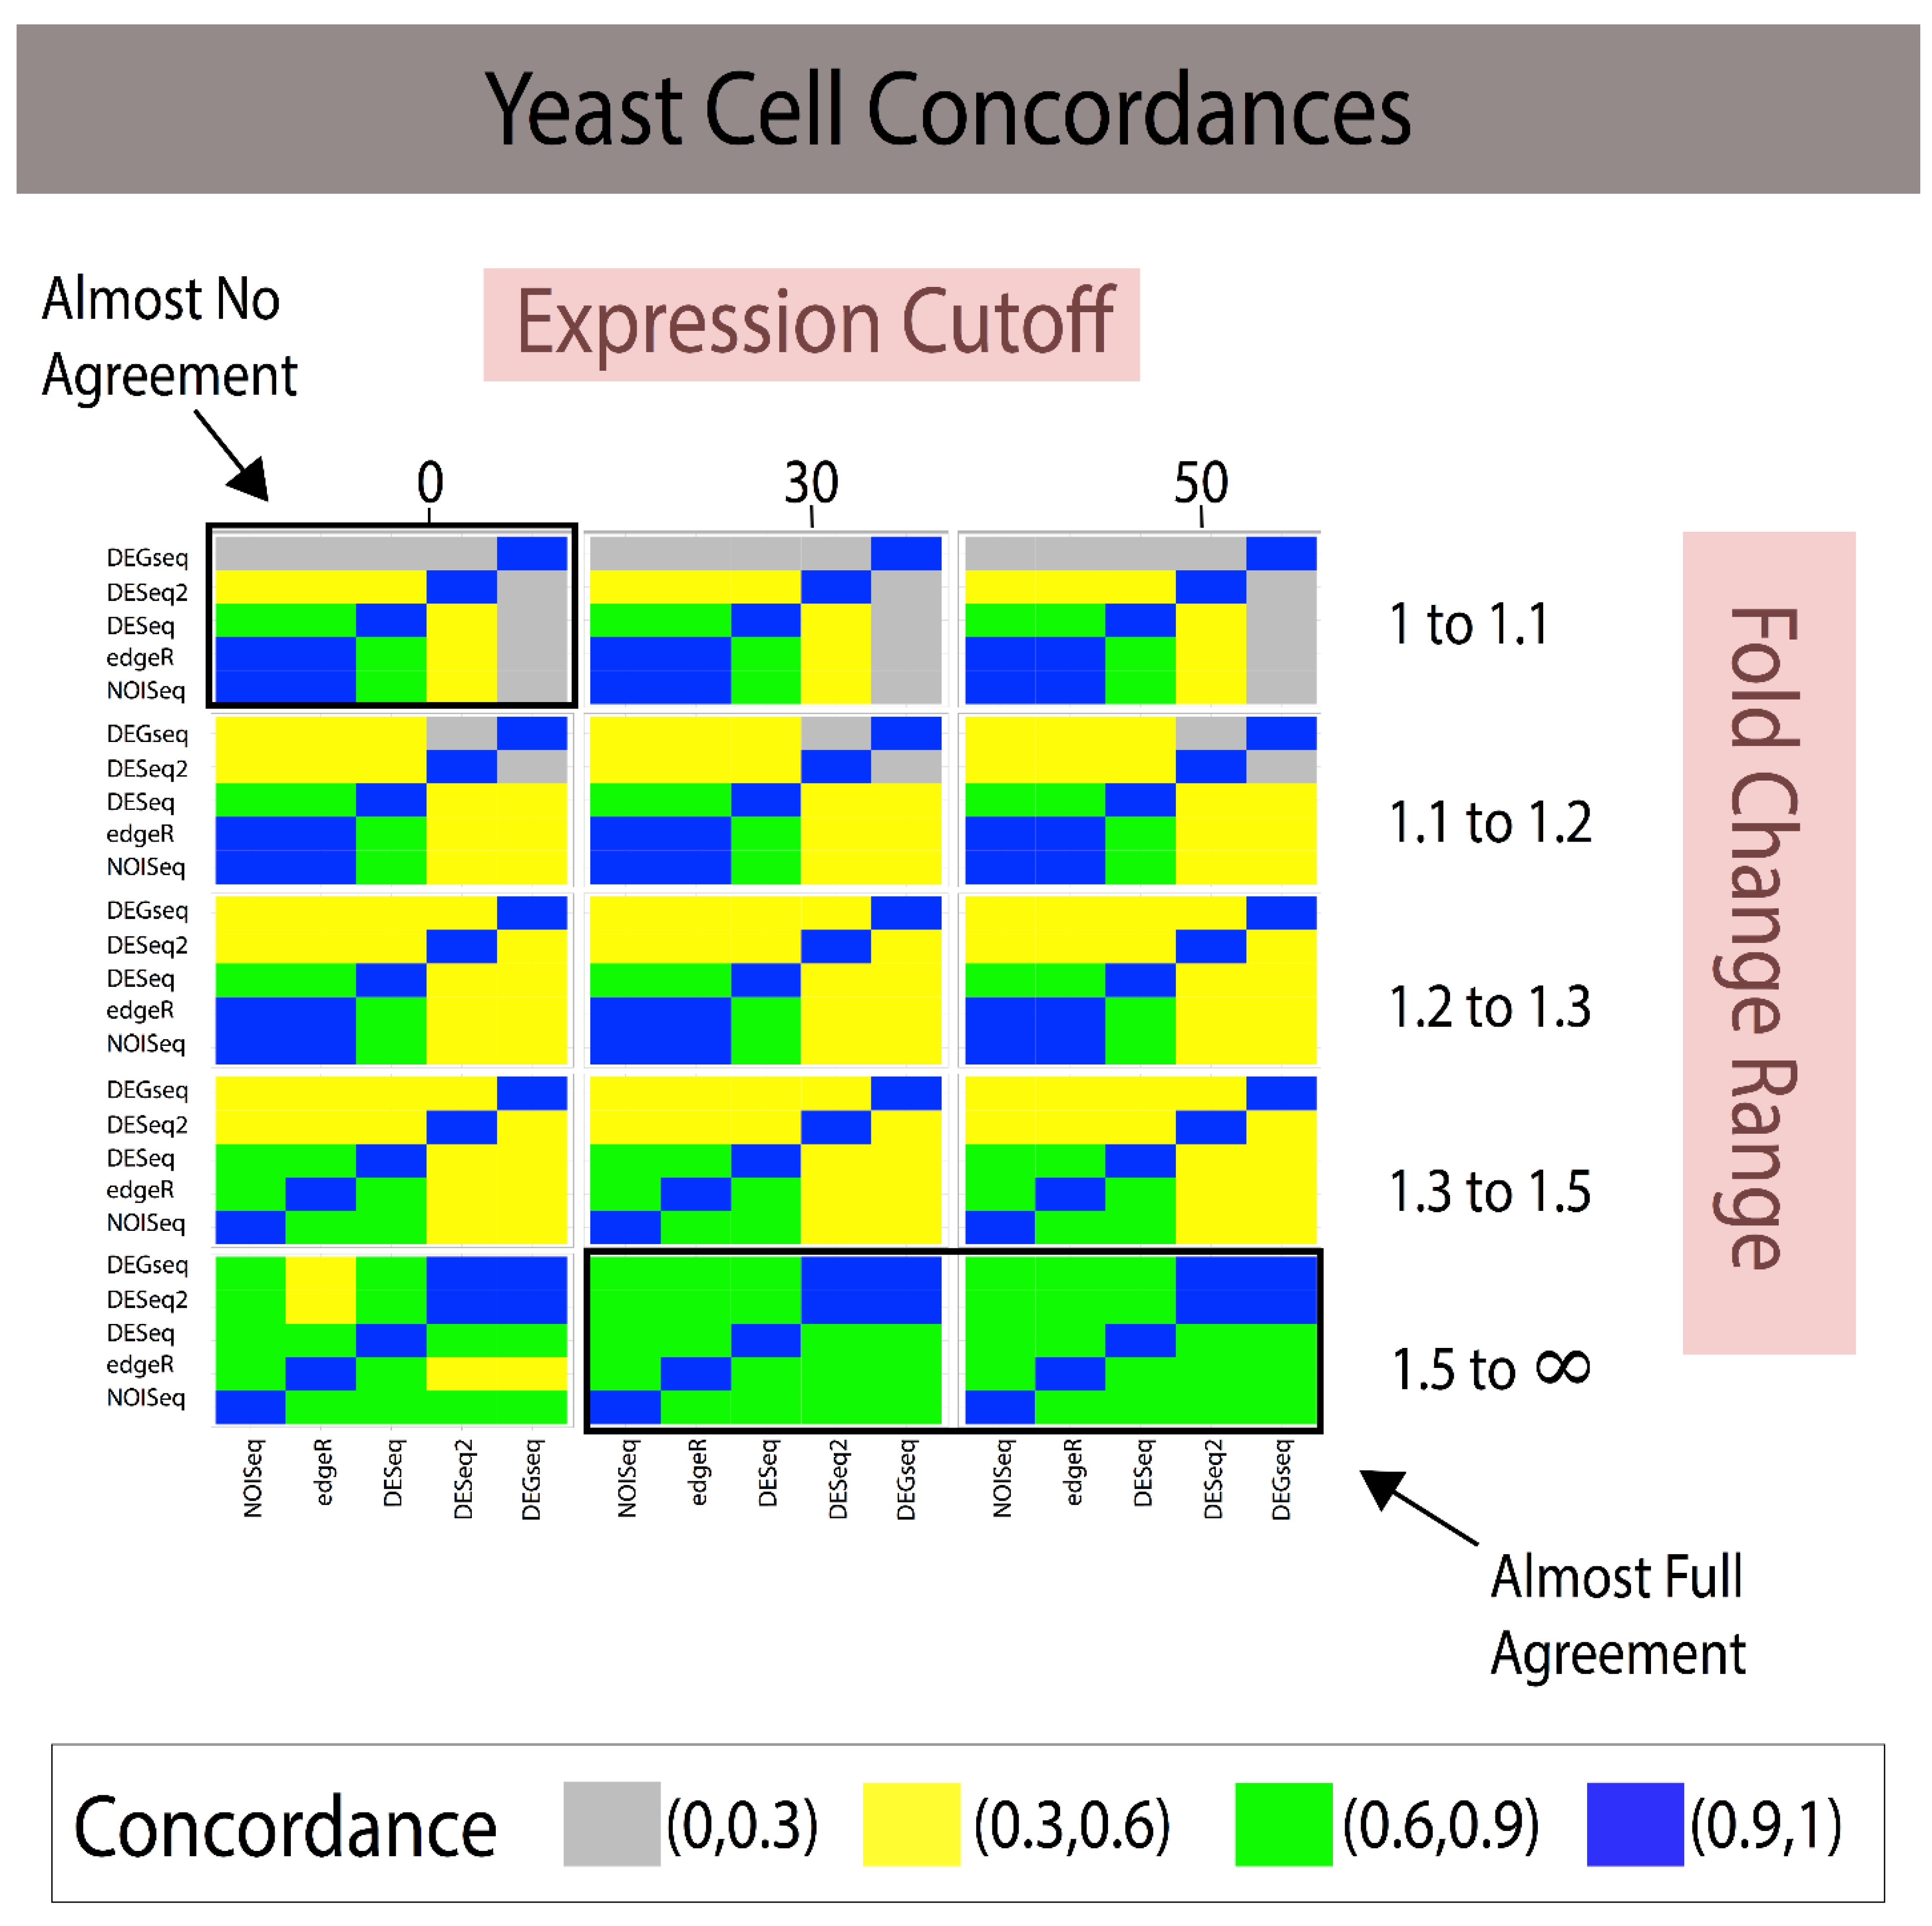
3.1. Fold Change Region Analysis
3.2. Combining Fold Change and Low-Expression Noise Reduction in Reference Standards
3.3. DESeq Example Analysis with Robust Reference Standards
4. Discussion, Limitations, and Future Studies
4.1. Discussion
4.2. Limitations and Future Studies
5. Conclusions
Supplementary Materials
Author Contributions
Funding
Institutional Review Board Statement
Informed Consent Statement
Data Availability Statement
Conflicts of Interest
Mathematical Notation
| Notation & Variable | Variable Description | Equation |
| Ak and Bk | Gene product expression of gene k in conditions A and B | Figure 1 |
| FC | Fold change: we represent FC for upregulated genes and 1/FC for downregulated genes.”) | Equation (1) |
| Jaccard Index = | Jaccard index is the ratio of significant gene products in common between results derived from analytical methods M and N divided by the union of these sets | Equation (2) |
| Intersection of sets M and N | Equation (2) | |
| Union of M and N | Equation (2) | |
| |M| | Cardinality or size of set M | Equation (2) |
| Ri | Region i, portion of the transcriptome resulting from the filters and cutoffs selected in referenceNof1 | Algorithm 1 |
| JI (M,N),Ri | The Jaccard index between analytics methods M and N for genes in region Ri | Algorithm 1 |
Acronyms and Abbreviations
| Abbreviation | Name |
| DEGs | Differentially expressed genes |
| SSS | single-subject studies |
| FC | Fold change for upregulated genes and 1/Fold change for downregulated genes |
| NHST | Null Hypothesis Significance Testing |
References
- Baker, M. 1500 scientists lift the lid on reproducibility. Nat. News 2016, 533, 452. [Google Scholar] [CrossRef] [PubMed]
- Vitali, F.; Li, Q.; Schissler, A.G.; Berghout, J.; Kenost, C.; Lussier, Y.A. Developing a ‘personalome’for precision medicine: Emerging methods that compute interpretable effect sizes from single-subject transcriptomes. Brief. Bioinform. 2017, 20, 789–805. [Google Scholar] [CrossRef] [PubMed]
- Lim, S.; Lee, S.; Jung, I.; Rhee, S.; Kim, S. Comprehensive and critical evaluation of individualized pathway activity measurement tools on pan-cancer data. Brief. Bioinform. 2020, 21, 36–46. [Google Scholar] [CrossRef] [PubMed]
- Kratochwill, T.R.; Hitchcock, J.; Horner, R.; Levin, J.R.; Odom, S.; Rindskopf, D.; Shadish, W. Single-case designs technical documentation; What Works Clearinghouse: Princeton, NJ, USA, 2010.
- Kratochwill, T.R.; Brody, G.H. Single subject designs: A perspective on the controversy over employing statistical inference and implications for research and training in behavior modification. Behav. Modif. 1978, 2, 291–307. [Google Scholar] [CrossRef]
- Schissler, A.G.; Gardeux, V.; Li, Q.; Achour, I.; Li, H.; Piegorsch, W.W.; Lussier, Y.A. Dynamic changes of RNA-sequencing expression for precision medicine: N-of-1-pathways Mahalanobis distance within pathways of single subjects predicts breast cancer survival. Bioinformatics 2015, 31, i293–i302. [Google Scholar] [CrossRef] [PubMed]
- Li, Q.; Schissler, A.G.; Gardeux, V.; Achour, I.; Kenost, C.; Berghout, J.; Li, H.; Zhang, H.H.; Lussier, Y.A. N-of-1-pathways MixEnrich: Advancing precision medicine via single-subject analysis in discovering dynamic changes of transcriptomes. BMC Med. Genom. 2017, 10, 27. [Google Scholar] [CrossRef]
- Gardeux, V.; Achour, I.; Li, J.; Maienschein-Cline, M.; Li, H.; Pesce, L.; Parinandi, G.; Bahroos, N.; Winn, R.; Foster, I. ‘N-of-1-pathways’ unveils personal deregulated mechanisms from a single pair of RNA-Seq samples: Towards precision medicine. J. Am. Med. Inform. Assoc. 2014, 21, 1015–1025. [Google Scholar] [CrossRef]
- Li, Q.; Zaim, S.R.; Aberasturi, D.; Berghout, J.; Li, H.; Vitali, F.; Kenost, C.; Zhang, H.H.; Lussier, Y.A. Interpretation of ‘Omics dynamics in a single subject using local estimates of dispersion between two transcriptomes. In AMIA Annual Symposium Proceedings; American Medical Informatics Association: Bethesda, MD, USA, 2019; p. 582. [Google Scholar]
- McShane, B.B.; Gal, D.; Gelman, A.; Robert, C.; Tackett, J.L. Abandon statistical significance. Am. Stat. 2019, 73, 235–245. [Google Scholar] [CrossRef]
- Wasserstein, R.L.; Schirm, A.L.; Lazar, N.A. Moving to a World Beyond “p < 0.05”; Taylor & Francis: Oxfordshire, UK, 2019. [Google Scholar]
- Zaim, S.R.; Kenost, C.; Berghout, J.; Vitali, F.; Zhang, H.H.; Lussier, Y.A. Evaluating single-subject study methods for personal transcriptomic interpretations to advance precision medicine. BMC Med. Genom. 2019, 12, 96. [Google Scholar]
- Liu, Y.; Zhou, J.; White, K.P. RNA-seq differential expression studies: More sequence or more replication? Bioinformatics 2014, 30, 301–304. [Google Scholar] [CrossRef]
- Anders, S.; Huber, W. Differential Expression of RNA-Seq Data at the Gene Level–the DESeq Package; European Molecular Biology Laboratory (EMBL): Heidelberg, Germany, 2012; Volume 10, p. f1000research. [Google Scholar]
- Wang, L.; Feng, Z.; Wang, X.; Wang, X.; Zhang, X. Degseq: An R Package for Identifying Differentially Expressed Genes from Rna-Seq Data. Bioinformatics 2009, 26, 136–138. [Google Scholar] [CrossRef] [PubMed]
- Schurch, N.J.; Schofield, P.; Gierliński, M.; Cole, C.; Sherstnev, A.; Singh, V.; Wrobel, N.; Gharbi, K.; Simpson, G.G.; Owen-Hughes, T.; et al. How many biological replicates are needed in an RNA-seq experiment and which differential expression tool should you use? RNA 2016, 22, 839–851. [Google Scholar] [CrossRef] [PubMed]
- Edgar, R.; Domrachev, M.; Lash, A.E. Gene Expression Omnibus: NCBI gene expression and hybridization array data repository. Nucleic Acids Res. 2002, 30, 207–210. [Google Scholar] [CrossRef]
- Ihaka, R.; Gentleman, R. R: A language for data analysis and graphics. J. Comput. Graph. Stat. 1996, 5, 299–314. [Google Scholar]
- Robinson, M.D.; McCarthy, D.J.; Smyth, G.K. edgeR: A Bioconductor Package for Differential Expression Analysis of Digital Gene Expression Data. Bioinformatics 2009, 26, 139–140. [Google Scholar] [CrossRef]
- Love, M.I.; Huber, W.; Anders, S. Moderated estimation of fold change and dispersion for RNA-seq data with DESeq2. Genome Biol. 2014, 15, 550. [Google Scholar] [CrossRef]
- Tarazona, S.; García, F.; Ferrer, A.; Dopazo, J.; Conesa, A. NOIseq: A RNA-seq differential expression method robust for sequencing depth biases. EMBnet J. 2011, 17, 18–19. [Google Scholar] [CrossRef]
- Feng, J.; Meyer, C.A.; Wang, Q.; Liu, J.S.; Shirley Liu, X.; Zhang, Y. GFOLD: A generalized fold change for ranking differentially expressed genes from RNA-seq data. Bioinformatics 2012, 28, 2782–2788. [Google Scholar] [CrossRef]
- Sha, Y.; Phan, J.H.; Wang, M.D. Effect of low-expression gene filtering on detection of differentially expressed genes in RNA-seq data. In Proceedings of the 2015 37th Annual International Conference of the IEEE Engineering in Medicine and Biology Society (EMBC), Milan, Italy, 25–29 August 2015; IEEE: Piscataway, NJ, USA, 2015; pp. 6461–6464. [Google Scholar]
- Hackstadt, A.J.; Hess, A.M. Filtering for increased power for microarray data analysis. BMC Bioinform. 2009, 10, 11. [Google Scholar] [CrossRef]
- Bourgon, R.; Gentleman, R.; Huber, W. Independent filtering increases detection power for high-throughput experiments. Proc. Natl. Acad. Sci. USA 2010, 107, 9546–9551. [Google Scholar] [CrossRef] [PubMed]
- Gardeux, V.; Bosco, A.; Li, J.; Halonen, M.J.; Jackson, D.; Martinez, F.D.; Lussier, Y.A. Towards a PBMC “virogram assay” for precision medicine: Concordance between ex vivo and in vivo viral infection transcriptomes. J. Biomed. Inform. 2015, 55, 94–103. [Google Scholar] [CrossRef] [PubMed]
- Gardeux, V.; Berghout, J.; Achour, I.; Schissler, A.G.; Li, Q.; Kenost, C.; Li, J.; Shang, Y.; Bosco, A.; Saner, D.; et al. A genome-by-environment interaction classifier for precision medicine: Personal transcriptome response to rhinovirus identifies children prone to asthma exacerbations. J. Am. Med. Inform. Assoc. 2017, 24, 1116–1126. [Google Scholar] [CrossRef] [PubMed]
- Zaim, S.R.; Li, Q.; Schissler, A.G.; Lussier, Y.A. Emergence of pathway-level composite biomarkers from converging gene set signals of heterogeneous transcriptomic responses. In Proceedings of the Pacific Symposium on Biocomputing, Kohala Coast, HI, USA, 3–7 January 2018; World Scientific: Singapore, 2018; pp. 484–495. [Google Scholar]
- Ashburner, M.; Ball, C.A.; Blake, J.A.; Botstein, D.; Butler, H.; Cherry, J.M.; Davis, A.P.; Dolinski, K.; Dwight, S.S.; Eppig, J.T. Gene ontology: Tool for the unification of biology. Nat. Genet. 2000, 25, 25. [Google Scholar] [CrossRef] [PubMed]


| Issue | Description |
|---|---|
| Statistical assumptions bias | When conditions of applicability (e.g., homoscedasticity assumptions) of the theoretical distribution of the underlying analytics are overlooked and unapplicable, prioritized results contain biases (false positives and false negatives) inherent to modeling inadequacies. |
| Analytical bias and systematic errors | Studies that use the same analytical method for the prediction calculation as for the reference standard construction incorrectly confirm systematic errors leading to analytical biases. For example, creating a reference standard with the same analytical method (isomorphic evaluation) as the one generating predictions can lead to “naive replication” of results comprising both true and false positives (biased systematic artefacts of a specific analytical method). Isomorphic evaluations in Omics analyses are anti-conservative by design. |
| Conflicting biomarker predictions in a single subject | Single-subject studies lack references by design: what happens when analytical method A and analytical method B disagree on a gene’s significance? Is gene x really significant? There is a lack of accuracy framework for evaluating and resolving conflicting signal stemming from distinct DEG analytics in a single-subject analysis. |
| Dataset dependency biases | Reusing part of the reference standard data for generating predictions creates dependencies, an evaluation framework problem observed more frequently in statistical evaluation of isogenic data [11,12]. |
| Dataset | Samples | Genome Size (# Genes) | Access to Data |
|---|---|---|---|
| MCF7 Breast Cancer [13] | 7 | ~20,000 | GEO: GSE51403 |
| Yeast [16] | 48 | ~7000 | Github: bartongroup/profDGE48 |
| Parameter | Values |
|---|---|
| Fold change window | [1–1.1], [1.1–1.2], [1.2–1.3], [1.3–1.5], [1.5–] |
| Low expression cutoff | 0, 5, 10, 20, 30, 50 |
| Analytical Method A | Analytical Method B | 1 < FC < 1.1 (~85 DEGs) | 1.1 < FC < 1.2 (~175 DEGs) | 1.2 < FC < 1.3 (~700 DEGs) | 1.3 < FC < 1.5 (~1100 DEGs) | 1.5 < FC < ∞ (~365 DEGs) |
|---|---|---|---|---|---|---|
| NOISeq | edgeR | 0.500 | 0.333 | 0.885 | 0.819 | 0.631 |
| NOISeq | DESeq | 0 | 0 | 0.814 | 0.747 | 0.586 |
| NOISeq | DESeq2 | 0.005 | 0.002 | 0.311 | 0.436 | 0.372 |
| NOISeq | DEGseq | 0 | 0 | 0.355 | 0.569 | 0.672 |
| edgeR | DESeq | 0 | 0 | 0.902 | 0.868 | 0.795 |
| edgeR | DESeq2 | 0.002 | 0 | 0.329 | 0.468 | 0.515 |
| edgeR | DEGseq | 0 | 0 | 0.387 | 0.558 | 0.658 |
| DESeq | DESeq2 | 0 | 0.076 | 0.332 | 0.457 | 0.489 |
| DESeq | DEGseq | 0 | 0.285 | 0.415 | 0.555 | 0.661 |
| DESeq2 | DEGseq | 0.005 | 0.135 | 0.452 | 0.654 | 0.450 |
| Predictions of ss-DEGs Calculate by DESeq | |||
|---|---|---|---|
| Reference Standard Construction | References True DEGs (False= Remaining Transcripts) | Average Precision | Average Recall |
| Intersection of DEGs between methods * | 522 (16,625) | 0.57 | 0.08 |
| Majority vote of DEGs between methods * | 1424 (15,723) | 0.77 | 0.04 |
| referenceNof1 applied to intersection of DEGs * between methods | 165 (16,982) | 0.70 | 0.12 |
| referenceNof1 applied to majority vote of DEGs * between methods | 406 (16,741) | 0.85 | 0.06 |
Publisher’s Note: MDPI stays neutral with regard to jurisdictional claims in published maps and institutional affiliations. |
© 2020 by the authors. Licensee MDPI, Basel, Switzerland. This article is an open access article distributed under the terms and conditions of the Creative Commons Attribution (CC BY) license (http://creativecommons.org/licenses/by/4.0/).
Share and Cite
Zaim, S.R.; Kenost, C.; Zhang, H.H.; Lussier, Y.A. Personalized beyond Precision: Designing Unbiased Gold Standards to Improve Single-Subject Studies of Personal Genome Dynamics from Gene Products. J. Pers. Med. 2021, 11, 24. https://doi.org/10.3390/jpm11010024
Zaim SR, Kenost C, Zhang HH, Lussier YA. Personalized beyond Precision: Designing Unbiased Gold Standards to Improve Single-Subject Studies of Personal Genome Dynamics from Gene Products. Journal of Personalized Medicine. 2021; 11(1):24. https://doi.org/10.3390/jpm11010024
Chicago/Turabian StyleZaim, Samir Rachid, Colleen Kenost, Hao Helen Zhang, and Yves A. Lussier. 2021. "Personalized beyond Precision: Designing Unbiased Gold Standards to Improve Single-Subject Studies of Personal Genome Dynamics from Gene Products" Journal of Personalized Medicine 11, no. 1: 24. https://doi.org/10.3390/jpm11010024
APA StyleZaim, S. R., Kenost, C., Zhang, H. H., & Lussier, Y. A. (2021). Personalized beyond Precision: Designing Unbiased Gold Standards to Improve Single-Subject Studies of Personal Genome Dynamics from Gene Products. Journal of Personalized Medicine, 11(1), 24. https://doi.org/10.3390/jpm11010024