1. Introduction
Colorectal cancer is one of the most common malignancies worldwide and represents a significant public health concern. According to the International Agency for Research on Cancer (IARC) and the World Health Organization (WHO), colorectal cancer is the third most frequently diagnosed cancer globally and the second leading cause of cancer-related deaths [
1,
2,
3]. Due to this substantial disease burden, both early detection and the identification of reliable prognostic biomarkers and imaging-based parameters carry critical importance.
Carcinoembryonic antigen (CEA) is a glycoprotein found in the blood and remains one of the most widely used and easily accessible biomarkers in the management of colorectal cancer [
4]. In healthy, non-smoking adults, serum CEA levels below 3.0 ng/mL are considered normal, whereas in smokers, due to higher baseline levels, the upper limit may reach 5 ng/mL. Therefore, in clinical practice, 5 ng/mL is commonly used as the threshold for distinguishing normal from elevated CEA levels. Pretreatment CEA levels between 5 and 10 ng/mL are generally associated with localized disease and a favorable prognosis, while levels exceeding 10 ng/mL indicate a higher risk of recurrence and poorer outcomes [
5]. Serum CEA levels provide valuable clinical information, particularly for postoperative surveillance and prognostic evaluation, and are routinely recommended in international guidelines [
6,
7,
8,
9]. However, CEA levels are not always directly correlated with tumor burden or biological aggressiveness. In metastatic colorectal cancer, CEA levels are often elevated; however, in some advanced-stage cases, they may remain within normal limits [
10,
11,
12]. Therefore, biological variability may lead to false-negative or false-positive results. Thus, although clinically useful, CEA alone is insufficient for reliable diagnostic and prognostic decision-making, highlighting the need for complementary tools that can better reflect tumor biology.
Diagnostic imaging undergoes a transformative shift from a discipline based solely on visual interpretation to a data-driven science, integrating quantitative information extracted from images into clinical decision-making. Medical images are complex data sources that reflect the physical and biological properties of tissues. With advances in computational technologies and artificial intelligence algorithms, these images can now be systematically analyzed and decomposed into hundreds of quantitative features—such as intensity, shape, and texture—enabling the objective assessment of tumor heterogeneity. This entire process, known as radiomics, is transforming radiology into a predictive, data-oriented discipline. Radiomics has emerged as a significant field of research in personalized oncology, offering a non-invasive means to characterize the microstructural and biological properties of tumors [
13]. These quantitative features are thought to reflect underlying molecular and pathological characteristics, such as tumor heterogeneity, angiogenesis, and gene expression, providing valuable insights beyond visual assessment.
Computed tomography (CT)-based radiomic features can quantitatively characterize tumor microstructure and have been linked to clinical outcomes, treatment response, and prognostic indicators. Previous studies have demonstrated that radiomic features can predict survival, risk of metastasis, and treatment response in colorectal cancer [
14,
15,
16]. Furthermore, radiomic features may provide complementary imaging-based information related to serum biomarkers such as CEA and may contribute to improved tumor characterization. To the best of our knowledge, the relationship between CT-based radiomic features and serum CEA status has not been sufficiently investigated in the literature. Therefore, this study aims to explore whether radiomic features may provide imaging-based information associated with CEA levels in colon cancer patients. In this context, this study aimed to evaluated the role of radiomic features derived from preoperative CT in distinguishing CEA-positive from CEA-negative colon cancer patients and their potential contribution to clinical decision-making.
2. Materials and Methods
2.1. Study Population
This study included 150 adult patients (75 women and 75 men) with histopathologically confirmed colon cancer who underwent preoperative abdominal CT imaging at our institution between January 2021 and October 2025 and had untreated serum CEA measurements available. A total of 41 patients were excluded due to poor image quality, the absence of preoperative CEA values, or incomplete clinical records. The final cohort consisted of 109 eligible patients (53 CEA-positive and 56 CEA-negative). All abdominal CT scans were reviewed to ensure adequate image quality and complete visualization of the colon. Patients with poor image quality or incomplete clinical and laboratory data were excluded. Radiomic features were extracted from segmented tumor regions on preoperative CT images. Serum CEA measurements were obtained within 10 days prior to the CT examination to ensure temporal consistency between imaging and laboratory data. Patients with CEA levels of 5 ng/mL or higher were classified as CEA-positive, while those with CEA levels below 5 ng/mL were classified as CEA-negative. The extracted features were then compared between the CEA-positive and CEA-negative groups to evaluate their discriminative potential.
2.2. Radiological Protocol
All abdominal CT examinations were performed using a 64-slice CT scanner (Optima CT 660, General Electric Medical Systems, Milwaukee, WI, USA). Patients were scanned in the supine position. The protocol included spiral scanning with a tube voltage of 120 kV and a tube current of 70–120 mAs. Slice thicknesses were set to 1.25, 2.5, and 5 mm, and multiplanar reconstructions were obtained. All examinations were contrast-enhanced, and a water-soluble, non-ionic, high-iodine concentration contrast agent (300–350 mg/mL) was administered intravenously via an 18-gauge catheter placed in the antecubital vein using an automatic dual-injector system at a dose of 1 mL/kg (90–100 mL at a rate of 3–5 mL/s. Imaging was initiated 65 s after the delay, and all evaluations were performed on images obtained in the portal venous phase.
2.3. Radiomic Feature Extraction, Reliability Analysis, and Modeling
A total of 107 quantitative radiomic features (including first-order statistics, shape, and texture features derived from GLCM, GLRLM, etc.) were extracted from the manually segmented tumor regions on the contrast-enhanced CT images. Tumor segmentation was performed manually by an experienced abdominal radiologist with 13 years of dedicated experience. Tumor segmentation was performed using the open-source software 3D Slicer (version 5.8.1), and radiomic features were subsequently extracted using the PyRadiomics library (version 3.1.0). To ensure the robustness and reproducibility of the extracted radiomic features, both intra- and inter-observer reliability analyses were performed on a randomly selected subset of 30 patients. One experienced radiologist performed the tumor segmentation twice with a 2-week interval (intra-observer), and a second experienced radiologist performed the segmentation once (inter-observer). The Intra-class Correlation Coefficient (ICC) was calculated for all 107 features. Features with an ICC value of less than 0.8 for intra- or inter-observer agreement were excluded from subsequent analysis, as they were deemed unreliable.
The remaining robust features underwent Z-score normalization, followed by correlation-based feature selection using a threshold of |ρ| ≥ 0.8, resulting in a final set of 41 features. This feature selection step was implemented as a preliminary unsupervised filtering procedure prior to model training. Since the method is based on feature–feature correlations and does not utilize class labels, it does not directly exploit discriminative information between classes, thereby reducing the risk of label-driven information leakage. The primary objective of this step was to eliminate redundant features and stabilize the feature space rather than to optimize predictive performance.
Then, machine learning models (SVM, Decision Tree, Ensemble, k-NN, NN) were trained using stratified 5-fold cross-validation. The models were evaluated strictly using the test folds to ensure unbiased performance estimation. Hyperparameter optimization for each model was performed using Bayesian Optimization over 30 iterations, followed by refinement with Grid Search, on the training folds.
2.4. Statistical Analysis
Radiomic features extracted from CT images were scaled using z-score normalization after excluding missing or non-diagnostic data. To reduce multicollinearity, Pearson correlation coefficients were calculated, and in highly correlated pairs (|ρ| ≥ 0.6–0.8), the feature with lower variance was removed.
Machine learning models, including SVM, Decision Tree, Ensemble Learning, k-NN, and NN, were applied. Hyperparameter optimization was performed using Bayesian optimization, followed by grid search refinement.
Model performance was evaluated using stratified 5-fold cross-validation to ensure generalizability. Evaluation metrics included Accuracy, Recall (Sensitivity), Specificity, Precision, F1 score, and ROC-AUC. For each metric, mean values and 95% confidence intervals were calculated from the cross-validation results. Special emphasis was placed on Recall and ROC-AUC, given their clinical importance for correctly identifying CEA-positive cases and reducing false negatives.
2.5. Dataset
In this study, radiomic features extracted from CT images of patients with colon tumors were utilized. The images belonged to clinically confirmed CEA-positive and CEA-negative patient groups. For each patient, radiomic features obtained from different cross-sectional levels were provided as separate Excel files. All files were merged to create a patient-specific primary database. Initially, the dataset contained 107 features, with each row representing a feature vector derived from CT images. Tumor segmentation was performed manually by an experienced abdominal radiologist. For each patient, images were obtained from three slices: the one with the largest tumor area (central slice) and the immediately adjacent cranial and caudal slices. The images were saved in TIFF format. The segmented tumor images were subsequently used for radiomic feature extraction and preprocessing steps.
2.6. Data Preprocessing
First, missing values and non-diagnostic records were excluded from the dataset. All features were scaled using z-score normalization. Each feature was labeled using the structure “ImageType_FeatureClass_FeatureName,” enabling class-level correlation analysis. The dataset was divided into two classes: CEA-positive (1) and CEA-negative (0).
2.7. Feature Selection
To reduce multicollinearity among features, correlation-based feature pruning was applied [
17,
18]. Pearson correlation coefficients were calculated for all feature pairs, and pairs with |ρ| ≥ threshold were identified as highly correlated. For each correlated pair, the feature with lower variance was removed. This process was repeated for correlation thresholds of 0.6, 0.7, and 0.8.
The resulting feature dimensions were as follows:
- -
One hundred and seven features: Original dataset without reduction.
- -
Forty-one features: Final selected feature set at correlation threshold 0.8.
- -
Thirty-one and twenty-two features: Reduced sets obtained under stricter thresholds (0.7 and 0.6).
2.8. Classification
Five machine learning classifiers were evaluated on the selected feature sets: SVM, Decision Tree, Ensemble Learning, k-NN, and NN. Hyperparameters for each classifier were optimized using Bayesian optimization over 30 iterations [
19], which probabilistically models the parameter space to identify the best configuration with fewer trials.
All models were evaluated using stratified 5-fold cross-validation (CV-5), ensuring reliable generalization testing despite the limited sample size. Hyperparameters were further refined via grid search. Each model was trained and tested using CV-5, providing a statistically reliable assessment of generalization.
2.9. Performance Evaluation
The performance of the models was assessed using Accuracy, Recall (sensitivity), Specificity, F1 score, Precision, and Brier score, as defined in Equations (1)–(6). In Equation (6), the term
represents the model’s predicted probability for the positive class,
indicates the true binary outcome, and
corresponds to the sample size used in the evaluation. ROC-AUC score was also included in comparisons. For each metric, mean values and ±95% confidence intervals were calculated from the stratified 5-fold cross-validation results. Particular emphasis was placed on Recall and ROC-AUC metrics, as they hold specific clinical importance for correctly identifying CEA-positive patients.
3. Results
The baseline clinical and pathological characteristics of the study population are summarized in
Table 1. The cohort included 109 patients with a mean age of 55.09 ± 16.81 years, of whom 64.2% were male. Based on serum CEA levels, 49.5% of patients were classified as CEA-positive. The distribution of TNM classification and tumor stages demonstrated a heterogeneous patient population.
The distribution of smoking status and its association with serum CEA levels are presented in
Table 2. A total of 38 patients (34.9%) were smokers, whereas 71 (65.1%) were non-smokers. The mean serum CEA level was significantly higher in smokers compared to non-smokers (20.78 ± 7.31 vs. 4.08 ± 2.56,
p = 0.001), indicating that smoking status may act as a confounding factor influencing CEA levels.
In multivariate linear regression analysis, smoking remained significantly associated with increased serum CEA levels after adjusting for age, sex, tumor stage, and tumor type (β = 28.589, SE = 8.806,
p = 0.003). No statistically significant associations were observed for the other variables included in the model (
Table 3).
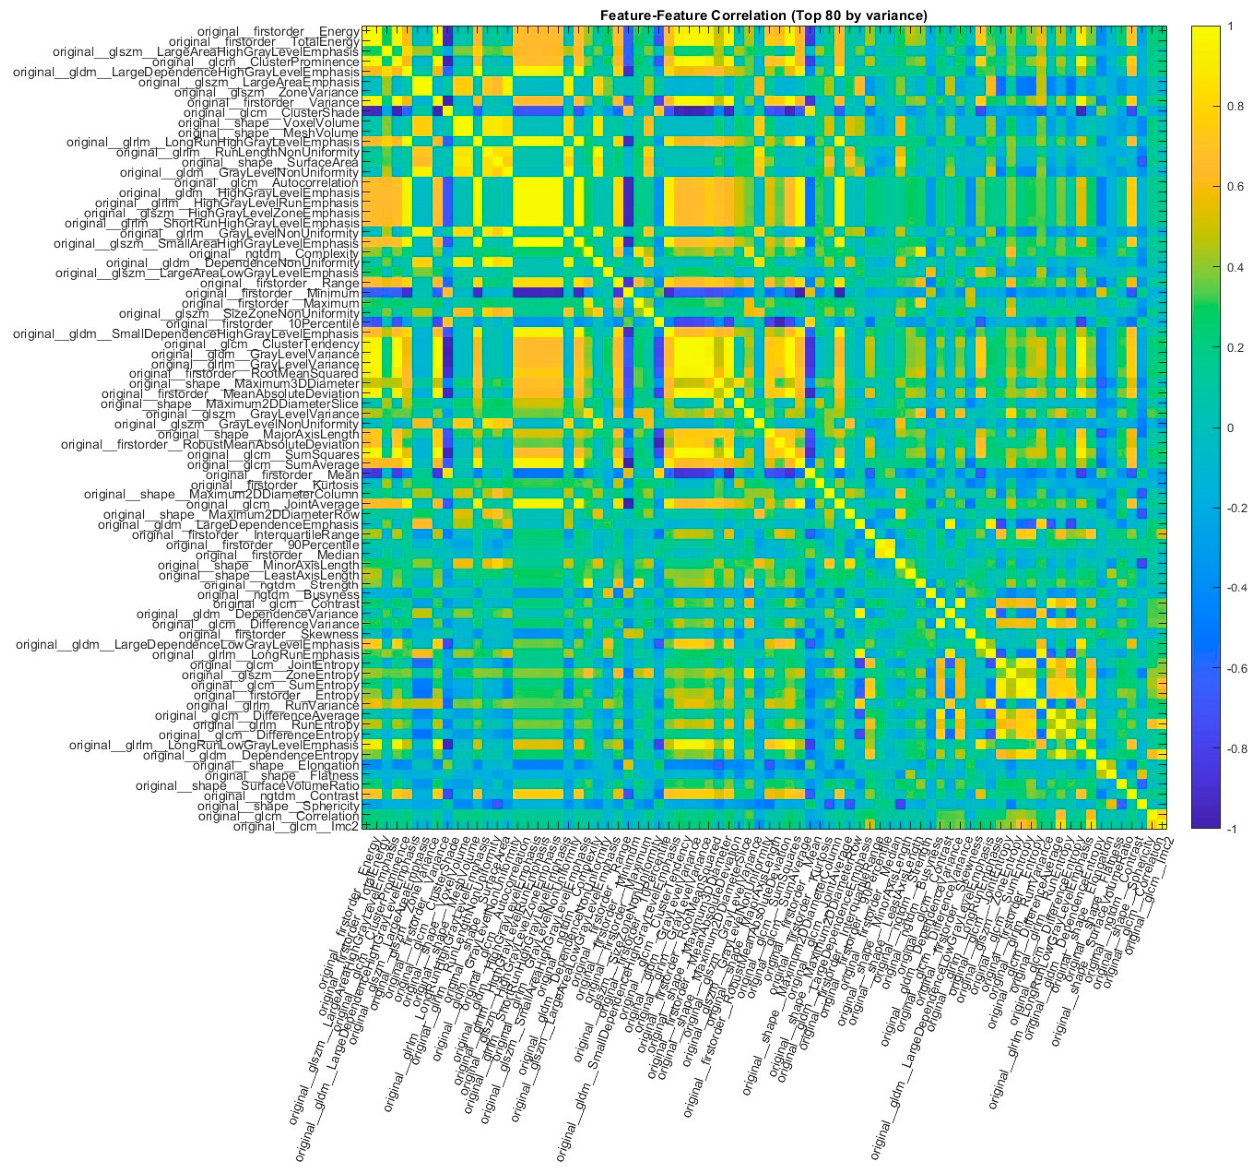
The correlation structure of the radiomic features obtained without dimensionality reduction is shown in
Figure 1.
As shown, many features are highly correlated, indicating redundant information in the dataset. Using all 107 features without dimensionality reduction, the classification results are presented in
Table 4.
Based on the stratified 5-fold cross-validation results, the k-NN model achieved the highest overall performance with 79.2 ± 2.0% accuracy and 0.8545 ± 0.013 ROC-AUC. This finding indicates that radiomic features exhibit clustering tendencies among similar instances and that neighborhood-based decision mechanisms can successfully capture this structure. The SVM model demonstrated 75.5 ± 2.0% accuracy and 90.6 ± 1.8% specificity, maintaining the lowest false-positive rate. However, its relatively low sensitivity (60.4 ± 2.5%) suggests a tendency to miss some positive cases.
The Ensemble method yielded comparable accuracy (75.5 ± 1.9%) but showed higher sensitivity (67.9 ± 2.3%), providing a more balanced ability to detect positive cases. In contrast, the Decision Tree and NN models exhibited lower accuracy and F1 scores, indicating more limited discriminative power. Overall, when all features were used, models achieved high specificity but lower sensitivity, meaning they were more effective at correctly classifying negative cases while partially failing to detect positive cases.
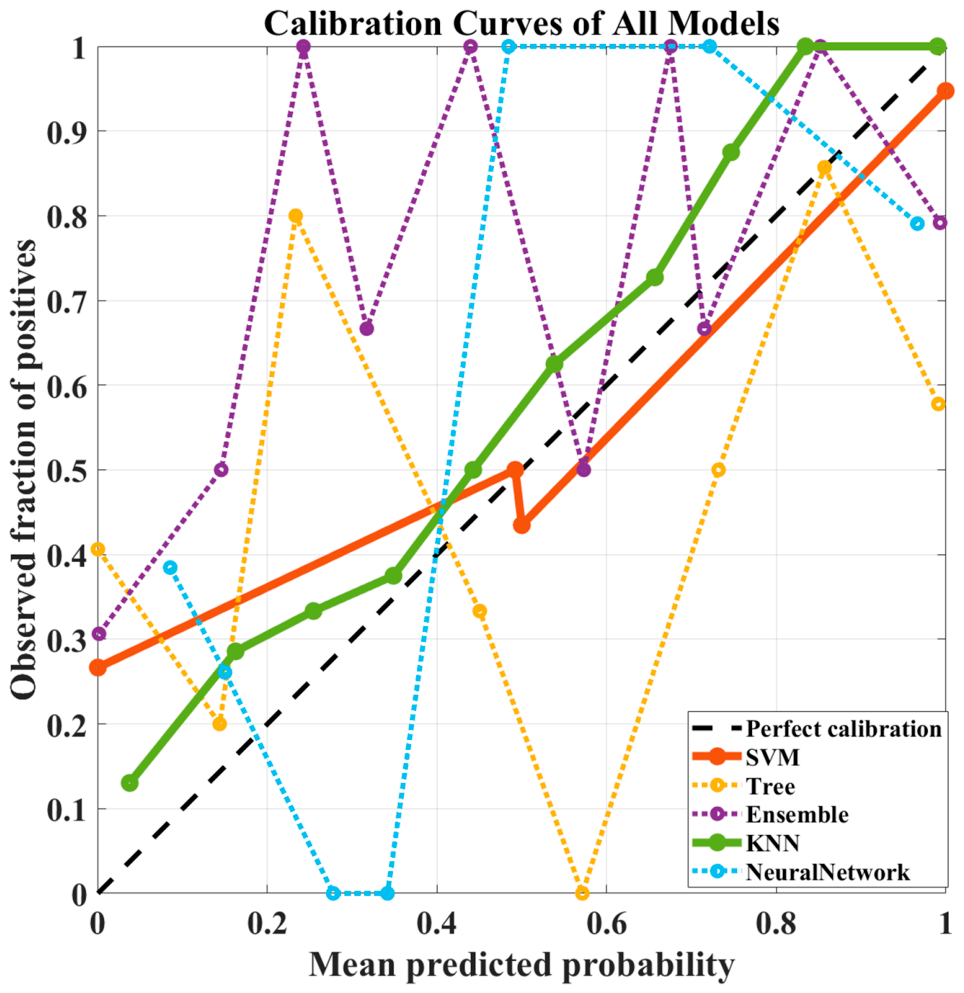
In addition to discrimination performance, calibration analysis was conducted to assess the reliability of predicted probabilities. As illustrated in
Figure 2, calibration curves reveal notable differences among models despite similar classification performance. The k-NN model shows a more consistent alignment with the diagonal reference line, indicating relatively better calibration behavior, particularly at higher probability ranges. In contrast, the Decision Tree and Neural Network models exhibit larger deviations and instability across probability bins, suggesting less reliable probability estimates.
In conclusion, on the dataset without dimensionality reduction, the k-NN and SVM models outperformed the other methods in terms of overall classification performance and stability. Furthermore, the calibration analysis supports these findings by demonstrating that the k-NN model provides more reliable probability estimates, reinforcing its suitability for applications where probabilistic interpretation is critical.
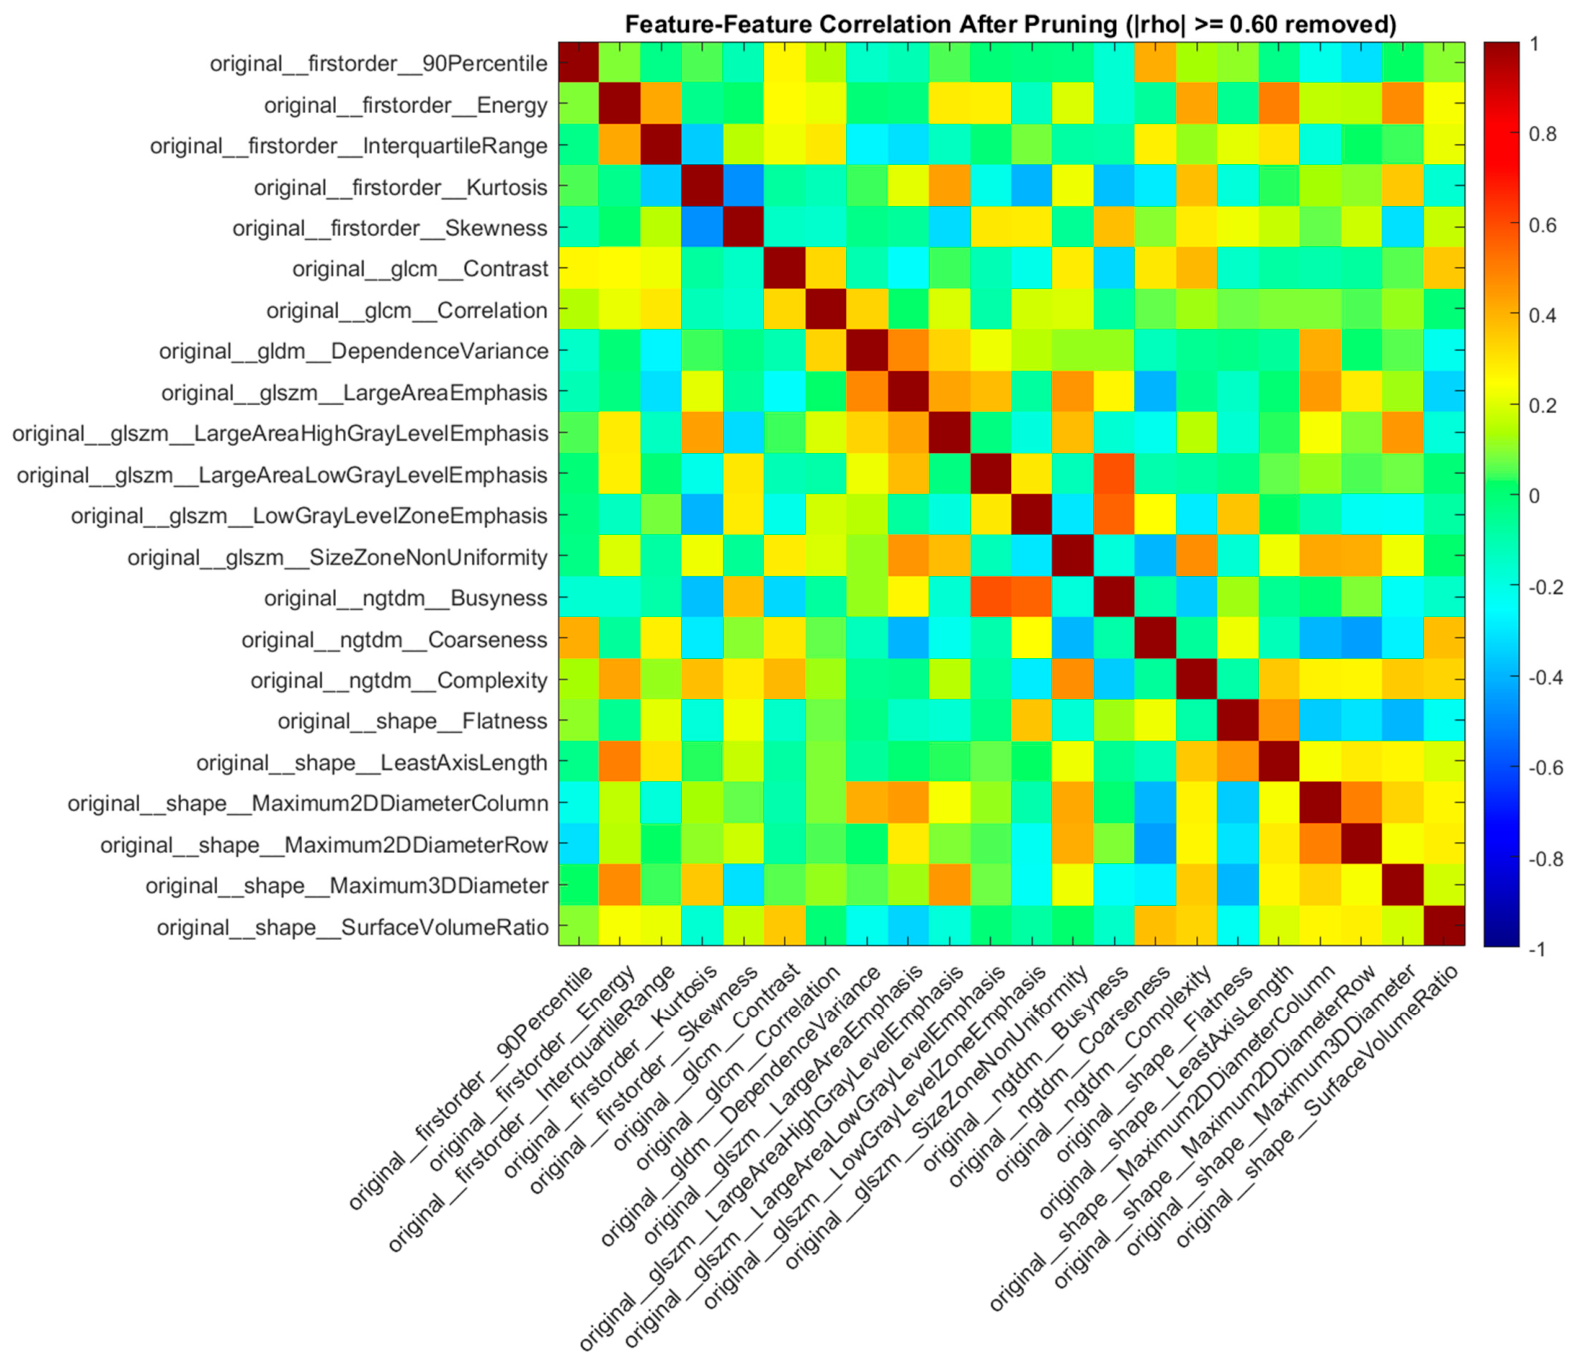
After applying correlation thresholding (
) to eliminate highly correlated features, the correlation structure of the new feature set was obtained, and is shown in
Figure 3. As seen in
Figure 3, the strong linear relationships among features were reduced mainly, thereby minimizing multicollinearity during model training. After selecting 22 features from the original 107 through correlation-based feature selection, the classification results were obtained, and are presented in
Table 5. Overall, the models preserved performance stability after dimensionality reduction, with noticeable improvements in some metrics.
The k-NN model achieved the highest overall performance with 80.2 ± 2.1% accuracy, 77.8 ± 2.0% F1 score, and 0.8592 ± 0.013 ROC-AUC, highlighting its effectiveness in modeling similarity relationships in the reduced radiomic space. The Ensemble model achieved balanced performance with 76.4 ± 2.0% accuracy and 71.7 ± 2.4% sensitivity, excelling in capturing positive cases. The SVM model demonstrated 72.6 ± 2.1% accuracy and 84.9 ± 2.0% specificity, indicating a low false-positive rate. However, its sensitivity remained relatively limited (60.4 ± 2.5%).
The NN achieved 79.2 ± 2.0% accuracy and 92.5 ± 1.7% specificity but lower sensitivity, resulting in higher misclassification among positive cases. The Decision Tree model achieved the lowest performance, with 66.0 ± 2.3% accuracy and 0.6333 ± 0.020 ROC-AUC.
In addition to these performance metrics, the Brier scores reported in
Table 5 provide a quantitative assessment of calibration performance under the reduced feature setting. The results indicate that the k-NN model achieved the lowest Brier score (0.163 ± 0.034), suggesting the most reliable probability estimates among the evaluated models. The NN model also demonstrated relatively favorable calibration (0.186 ± 0.035), whereas higher Brier scores observed in the Ensemble (0.273 ± 0.102) and Decision Tree (0.241 ± 0.016) models indicate less stable and less reliable probability predictions. Notably, the SVM model exhibited moderate calibration performance (0.216 ± 0.034), aligning with its balanced discrimination characteristics.
These findings indicate that correlation-based feature selection maintains model performance while improving generalizability, particularly for k-NN and Ensemble models. Furthermore, the calibration analysis suggests that feature reduction not only preserves classification performance but also contributes to more stable and reliable probability estimation, especially for the k-NN model.
The classification results with 31 selected features are shown in
Table 3. As presented in
Table 6, increasing the number of features from 22 to 31 did not significantly improve performance.
The k-NN model again achieved the best performance, with 78.3 ± 2.0% accuracy, 76.3 ± 2.1% F1 score, and 0.7932 ± 0.014 ROC-AUC, demonstrating strong generalizability across low-dimensional radiomic data. The NN achieved comparable results, with 73.6 ± 2.1% accuracy and 0.7935 ± 0.015 ROC-AUC, partially capturing non-linear feature interactions. The SVM achieved low false-positive rates (86.8 ± 1.9% specificity) but limited sensitivity (56.6 ± 2.5%). The Decision Tree model again showed the weakest results (66.0 ± 2.3% accuracy, 0.7255 ± 0.018 ROC-AUC). The Ensemble model did not improve significantly in this configuration, with weak F1 (56.9 ± 2.5%) and ROC-AUC (0.6778 ± 0.019) scores.
In addition to these performance metrics, the Brier scores reported in
Table 6 provide insight into calibration performance under the expanded feature setting. The k-NN model maintained the lowest Brier score (0.163 ± 0.023), indicating consistently reliable probability estimates. In contrast, the SVM model exhibited the highest Brier score (0.314 ± 0.063), suggesting reduced calibration quality despite reasonable classification performance. The Tree (0.208 ± 0.069), Ensemble (0.211 ± 0.021), and NN (0.213 ± 0.051) models showed moderate calibration performance, with noticeable variability across folds. These findings indicate that increasing the number of features does not necessarily improve the reliability of predicted probabilities.
These results indicate that low-dimensional feature sets remain sufficient for classification, while adding correlated variables does not provide meaningful improvement in either discrimination or calibration performance.
As shown in
Table 7, using 41 features obtained by applying a correlation threshold of 0.8 improved the classification performance compared to the 22- and 31-feature configurations.
The k-NN model achieved 77.4 ± 2.0% accuracy, 77.8 ± 2.0% F1 score, and 0.8523 ± 0.013 ROC-AUC, once again achieving the highest overall performance. The SVM also performed strongly, with 76.4 ± 2.0% accuracy, 83.0 ± 2.3% sensitivity, and 0.8324 ± 0.014 ROC-AUC, showing balanced discriminative ability. The NN demonstrated competitive results (78.3 ± 2.0% accuracy, 79.3 ± 1.9% F1 score). In contrast, the Decision Tree and Ensemble models achieved lower performance, with weaker generalizability.
In addition to discrimination metrics, the Brier scores reported in
Table 7 provide a quantitative assessment of calibration performance for this feature configuration. The k-NN model maintained the lowest Brier score (0.188 ± 0.043), indicating relatively reliable probability estimates. In contrast, the Ensemble model exhibited a substantially higher Brier score (0.495 ± 0.022), suggesting poor calibration despite moderate classification performance. The SVM (0.294 ± 0.058) and NN (0.309 ± 0.053) models showed degraded calibration compared to the lower-dimensional settings, while the Decision Tree (0.231 ± 0.091) demonstrated moderate but unstable calibration behavior. These results indicate that increasing the number of features may negatively affect the reliability of predicted probabilities, even when classification metrics improve.
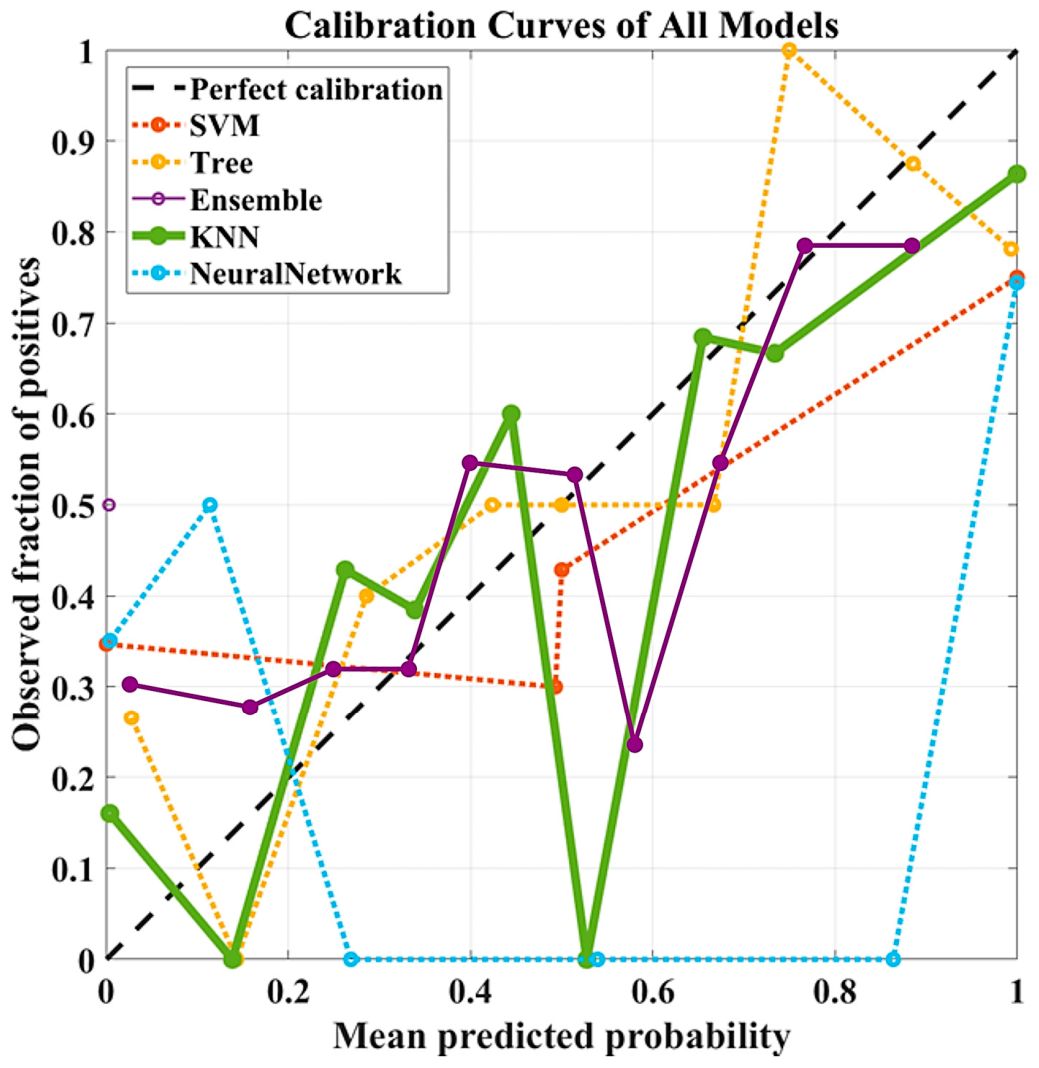
As illustrated in
Figure 4, calibration curves further support these findings by showing that the k-NN model remains closer to the ideal diagonal line, whereas other models exhibit larger deviations and instability across probability ranges.
These findings indicate that selecting 41 features with a correlation threshold of 0.7 improves classification performance while introducing variability in calibration, highlighting a trade-off between discrimination and probability reliability.
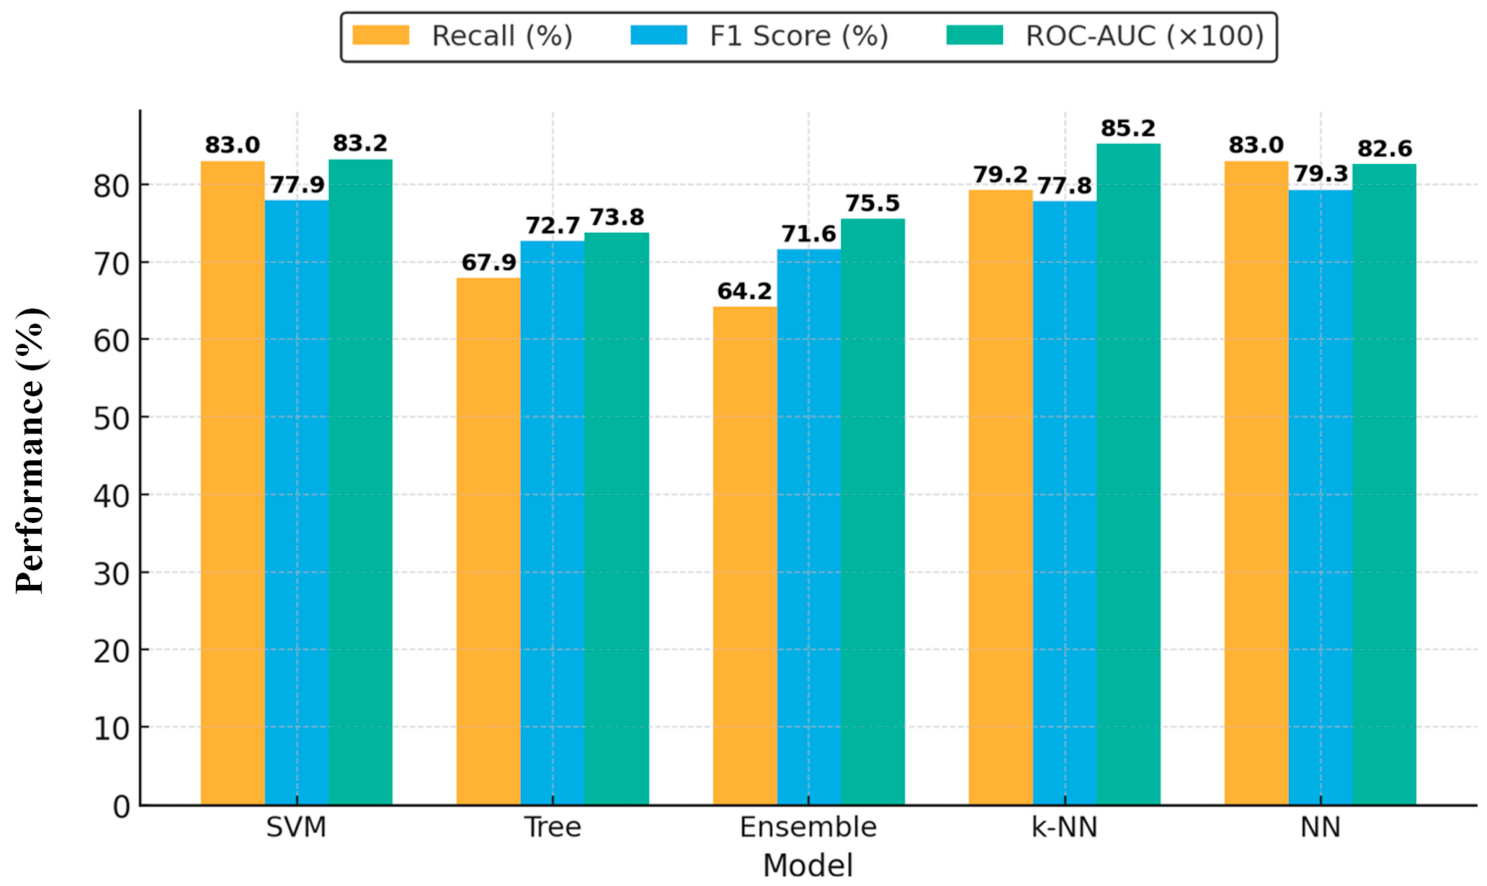
Analysis of classification performance across different feature dimensions demonstrated that models trained with 41 selected features produced the most balanced outcomes. Thus, the scores obtained by the models with 41 features are shown in
Figure 5 as a comparative bar plot.
In the 41-dimensional feature space, k-NN, SVM, and NN models performed best in terms of both overall accuracy and discriminative ability (ROC-AUC). The highest recall (83.0 ± 2.3%) was achieved by SVM and NN models, indicating their effectiveness in capturing positive colon cancer cases. The k-NN model also excelled, achieving 77.8 ± 2.0% F1 score and 0.8523 ± 0.013 ROC-AUC, reflecting a strong balance between sensitivity and specificity. These findings show that k-NN and SVM are particularly effective at correctly identifying the positive class (CEA-positive patients), and that high F1 scores demonstrate their ability to balance sensitivity and specificity. Therefore, the dataset with 41 features selected at a correlation threshold of 0.8 enhanced overall model performance, with significant improvements in recall and ROC-AUC metrics, suggesting clinically meaningful advances.
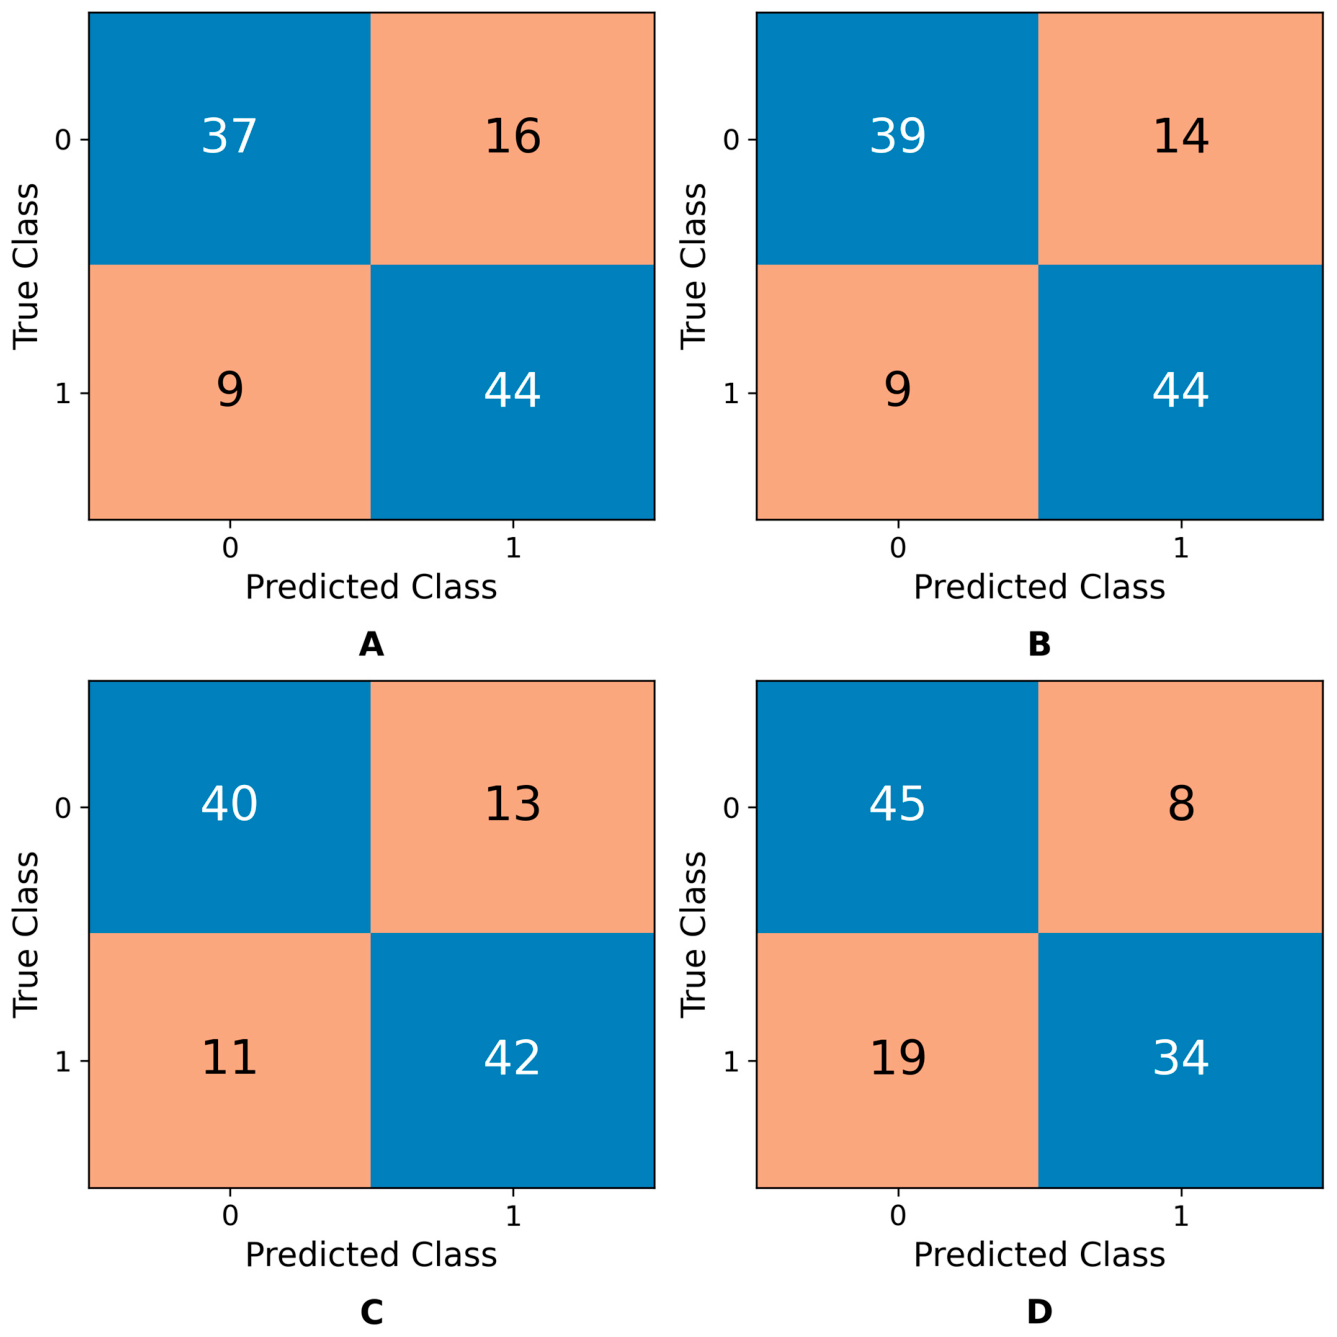
The confusion matrices presented in
Figure 6A–D further support these results. Specifically, the SVM and NN models (
Figure 6A,B) achieved the highest sensitivity, while the k-NN (
Figure 6C) and Ensemble (
Figure 6D) models demonstrated balanced and limited performance, respectively.
This emphasizes their ability to capture positive colon cancer cases and reduce false negatives. The k-NN model also demonstrated stable performance, with 42 true positives and 45 true negatives, achieving a strong balance between recall and specificity. In contrast, the Ensemble model misclassified several positive cases as negatives (19 cases), indicating limited generalizability for the positive class. Overall, the combination of confusion matrices and performance metrics demonstrates that the k-NN, SVM, and NN models yield more stable and reliable results in identifying colon cancer cases. Their superior performance in detecting the positive class highlights an important advantage for clinical applications, particularly by reducing false negatives.
Statistical Comparison of ROC-AUC Using the DeLong Test
The statistical significance of differences in ROC-AUC values between the evaluated models was assessed using the paired DeLong test. The analysis was conducted based on out-of-fold predicted probabilities obtained from stratified 5-fold cross-validation, enabling paired comparisons across models. The AUC values indicate that the k-NN model achieved the highest performance (AUC = 0.8063), followed by the Ensemble (0.7510), Neural Network (0.7351), Decision Tree (0.7204), and SVM (0.6898) models.
The k-NN model was selected as the reference model for statistical comparisons, as it achieved the highest average ROC-AUC among all evaluated models. Pairwise comparisons against this model provide a clearer interpretation of relative performance differences. The results of the DeLong test are summarized in
Table 8. The k-NN model significantly outperformed the SVM model (
p = 0.0287 < 0.05). However, the differences between k-NN and the Decision Tree (
p = 0.0830), Ensemble (
p = 0.2592), and Neural Network (
p = 0.1873) models were not statistically significant at the 0.05 significance level.
These findings indicate that, although the k-NN model achieved the highest average ROC-AUC, its superiority is statistically supported only in comparison with the SVM model. For the remaining model comparisons, no statistically significant differences were observed. This suggests that the observed variations in performance may be attributed to fold-level variability rather than consistent differences in model capability. Accordingly, the results are interpreted in terms of relative performance rather than definitive superiority.
4. Discussion
Recent advances in radiomics have provided new opportunities for quantitative tumor characterization and individualized risk prediction in colorectal cancer. Several studies have reported strong associations between CT-derived radiomic features and tumor aggressiveness, perineural invasion, and survival outcomes [
20,
21]. Consistent with these findings, our study demonstrated that CT-based radiomic features combined with machine learning can effectively differentiate between CEA-positive and CEA-negative colon cancer patients.
Analysis of classification performance across different feature dimensions showed that models trained with 41 selected features achieved the most balanced and stable outcomes. Within this feature space, the k-NN, SVM, and NN classifiers achieved the highest overall accuracy and discriminative power while maintaining an optimal balance between sensitivity and specificity. The SVM and NN models achieved the best recall values, reflecting their superior ability to identify CEA-positive colon cancer cases. This high recall (up to 83.0%) is clinically valuable, as it minimizes the number of false-negative cases—patients who are truly CEA-positive but are missed by the model—which is critical for identifying high-risk individuals requiring stringent postoperative surveillance. These findings indicate that optimal feature selection and algorithmic integration can enhance model generalization and improve predictive consistency across different machine learning approaches. The observed association between radiomic features and serum CEA status suggests that imaging-derived features may provide complementary information regarding tumor biology. Recent studies have suggested that combining imaging-derived quantitative features with biochemical markers may enhance predictive performance beyond either approach alone. For instance, Huang et al. (2018) successfully integrated CT-based radiomic signatures with serum CEA levels to predict perineural invasion in colorectal cancer [
22]. Similarly, Lv et al. (2022) demonstrated that combining radiomic features with clinical and serum data improved survival prediction and recurrence risk assessment [
23]. In line with these reports, our study highlights that CT-based radiomic modeling can effectively distinguish between CEA-positive and CEA-negative colon cancer patients, suggesting potential for biomarker-enhanced risk stratification. These findings indicate that radiomic features may serve as complementary indicators of tumor biology, strengthening the link between image-based analysis and molecular or serum biomarkers.
In the present study, radiomic features were not combined with serum CEA values within a single predictive model; rather, CT-based radiomic analysis was used to differentiate patients according to their CEA status. Therefore, the findings should be interpreted as reflecting an association between imaging-derived features and biomarker status, rather than a comprehensive integrated model.
In the literature, simpler tree-based or ensemble models have been reported to be more sensitive to redundancy and noise within radiomic datasets, whereas distance- and kernel-based classifiers (such as k-NN and SVM) generally provide higher stability and generalization capacity [
24,
25,
26,
27,
28]. Consistent with the literature, our study also demonstrated that k-NN, SVM, and NN classifiers achieved consistently superior results compared with other models. In this context, the multi-algorithmic approach and correlation-based feature selection method employed in our study are in line with methodological principles previously recommended in the literature to enhance model robustness [
29]. Taken together, these findings emphasize the importance of methodological rigor and appropriate algorithm selection to maximize clinical applicability in radiomics-based predictive modeling.
Recent literature has also emphasized both methodological advances and persistent challenges in radiomics and artificial intelligence research. Topics such as bias in AI systems, the reproducibility of radiomic features, and the role of standardized quality frameworks—such as the Radiomics Quality Score (RQS) and METRICS—have been widely discussed [
30]. In our study, a standardized preprocessing workflow and correlation-based feature selection approach were implemented to reduce data redundancy, improve feature stability, and enhance model generalizability. These methodological steps provide significant advantages for achieving reliable and reproducible radiomic analyses.
Although the present study primarily demonstrates a statistical association between radiomic features and CEA status, potential biological explanations may underlie this relationship. Radiomic features are thought to capture intratumoral heterogeneity, which reflects variations in cellular density, necrosis, and stromal composition. More aggressive tumors, often associated with elevated CEA levels, may exhibit increased heterogeneity, irregular vascular architecture, and areas of necrosis, all of which can be reflected in texture-based imaging features. Therefore, radiomic signatures may indirectly represent underlying tumor biology associated with serum biomarker expression, even though they do not directly measure molecular or biochemical processes.
Particularly in oncologic imaging, radiomics has shown considerable potential for tumor characterization and prognostic modeling. Our study extends this perspective by emphasizing that CT-derived radiomic features can complement serum biomarkers such as CEA, contributing to a more comprehensive and personalized approach to tumor assessment and management. Although serum CEA levels can be easily obtained through routine blood testing, imaging-based prediction may provide complementary biological information regarding tumor heterogeneity and aggressiveness. Radiomic features extracted from CT images may reflect intratumoral microstructural characteristics that are not fully captured by circulating biomarkers alone. In this context, radiomics is not intended to replace laboratory testing but rather to provide additional imaging-derived biomarkers that may improve tumor characterization and risk stratification. Therefore, the association between CT-based radiomic signatures and serum CEA status may have potential value in supporting a more comprehensive and biologically informed assessment of colon cancer. From a clinical perspective, the value of imaging-based models may be particularly relevant in cases where serum biomarkers alone provide limited insight into the biological heterogeneity of tumors. Rather than duplicating a laboratory parameter, radiomic analysis may help bridge imaging phenotypes with biochemical tumor characteristics, thereby contributing to multimodal decision-support frameworks in colorectal cancer management.
In the present study, serum CEA levels were found to be significantly higher in smokers, indicating that smoking may act as a confounding factor influencing CEA levels. This finding is consistent with previous reports demonstrating elevated baseline CEA levels in smokers. Therefore, the observed associations between radiomic features and CEA status should be interpreted with consideration of potential confounding effects.
From a clinical perspective, CT-based radiomic models may have potential utility in preoperative risk assessment and decision support. In routine clinical practice, abdominal CT is already widely performed for staging and evaluation of colorectal cancer. Radiomic analysis may provide additional, non-invasive imaging-based information associated with tumor biology and biomarker status, particularly in cases where serum CEA levels are inconclusive or do not fully reflect tumor behavior. Rather than replacing laboratory biomarkers, such models may serve as complementary decision-support tools, contributing to a more comprehensive assessment of patients.
Although the machine learning models demonstrated promising performance in differentiating CEA status, the potential for misclassification should be carefully considered in clinical practice. These models are not intended to function as standalone diagnostic tools but rather as decision-support systems that complement clinical and radiological evaluation. In cases of uncertain or potentially incorrect predictions, re-evaluation of imaging findings and integration with clinical, laboratory, or histopathological data remain essential to ensure accurate diagnosis. Additionally, in the event of misclassification, patients should be informed appropriately with clear explanations and provided with appropriate clinical follow-up to ensure safety. Furthermore, analysis of misclassification patterns may provide valuable insights into model limitations and guide future improvements. Expanding the dataset, refining feature selection strategies, adopting continuous learning pipelines, and optimizing model parameters may further enhance performance. In addition, external validation using independent cohorts and the incorporation of automated segmentation approaches may improve the generalizability and reproducibility of radiomics-based models. Future multicenter studies are warranted to confirm these findings and support the clinical translation of such approaches.