1. Introduction
In the year 2022, 2.3 million women worldwide were diagnosed with breast cancer causing 670,000 deaths [
1]. Due to limitations of the screening method, breast cancer can go undetected due to (i) low sensitivity of mammography in some subgroups, like women with dense breasts; (ii) cancer growth patterns resulting in subtle mammographic presentation or cancers with fast growth rates that outpace screening intervals and are therefore ‘missed’ at screening; and (iii) radiologists’ reading or interpretation errors. Artificial intelligence (AI) has great potential to address these challenges [
2]. However, its use in breast cancer screening and indeed all healthcare [
3] is subject to issues such as trustworthiness, robustness, generalisability, and interpretability. Accuracy and robustness are critical for all AI usage within a clinical setting; however, issues such as bias and poorly constructed training data [
4,
5] are significant barriers to clinical adoption. Another related problem is that of overfitting, with solutions ranging from naively adding more data, to the inclusion of regularisation terms in model training such as weight decay [
6], weight dropout [
7] and online data augmentations [
8,
9,
10]. These methods can mitigate overfitting to a degree, but the lack of generalisability to unseen data is not solely due to model training schemes, but also poor categorisation of the training data where data instances may be inappropriately combined or excluded. This point is pertinent for healthcare data where instances have complex provenance and differences between the characteristics of the data, i.e., different categorisations, can differentiate between data points, e.g., disease progression of risk for age groups [
10,
11,
12,
13,
14] and gender [
15,
16,
17,
18]. The FAIR (Findability, Accessibility, Interoperability, and Reusability) principles [
19] are widely being adopted to tackle reproducibility and data visibility; however, these do not ensure the data are correctly or sufficiently categorised. Data curation with rich metadata is essential for reproducible science [
20] but also confident data categorisation and ultimately identifying or mitigating bias in datasets [
21]. The implication of biased data on trained models is well documented, particularly in health [
22].
A standardised assessment of an AI system’s performance, the readiness of clinicians to trust outputs, and the ethical acceptance by all concerned stakeholders are all essential requirements for the wider use of these systems, particularly in areas where the tools will help with clinical decision making such as for breast cancer detection. Recent standardisation efforts [
23,
24] are resulting in guidance for evaluating and monitoring AI systems. Projects such as ‘Developing a metrological framework for assessment of image-based artificial intelligence systems for disease detection’ (MAIBAI) [
25] are developing impartial frameworks for performance, generalisability, and suitability assessment of AI tools, to ensure the safe use of AI software in a clinical setting. The evaluation of AI systems needs to be tailored to the specific task; for example, a screening system may need different evaluation than other classification tools in diagnostics due to the difference in the data (where we assume significantly more healthy cases in the general population). The associated importance of false positives and negatives also differ with the specific task, impacting the correct choice evaluation metrics and optimal operating point. The balance of referral rate and sufficiently high (in an ethical and financial sense) positive predictive value are all points of careful consideration in medical screening [
26].
Accurate measurement and categorisation of data are critical for the quantitative validation and reliability assessment of AI models in healthcare imaging applications. In medical imaging, and mammography in particular, diverse clinical and technical features introduce significant heterogeneity that can affect the appearance and interpretation of images and ultimately confound the outputs of AI-based decision-support systems. This heterogeneity occurs between scanners, but also within the same scanner following different image processing routines or protocols or software updates. Standardised measurement frameworks for image metadata, acquisition protocols, patient population characteristics, and device-specific imaging parameters are essential to ensure traceable, equitable, and robust model development and evaluation. Recent advances in measurement science emphasise the necessity of systematic, reproducible quantification of image features, acquisition conditions, and population subgroups for AI evaluation in clinical imaging tasks [
27].
Differences between patient subpopulations are observed through healthcare applications, including mammography. Several studies have investigated patient-level features such as association between demographics and breast cancer [
28,
29], or the impact on imaging of factors such as age and density [
30]. Other studies have looked at the factors affecting image acquisition and quality [
31,
32,
33], or how differences can impact AI models, such as mammography systems [
34] and breast density [
2]. However, consistent categorisation of data in studies is lacking and this has a direct impact on AI model training and evaluation, and ultimately the generalisability, reproducibility and fairness of AI models in healthcare.
This paper aims to develop and demonstrate a methodology for comprehensive measurement and categorisation of mammography imaging data, forming the basis for interpretable evaluation of AI systems in breast cancer screening. The approach assesses key measurement dimensions including compressed breast thickness, tissue composition, lesion morphology, technical acquisition settings (including image processing), and demographic variation, with the goal of providing a measurement-centric framework for dataset construction, bias detection, and performance benchmarking. By incorporating measurement science principles into the process of data subcategorisation, this work establishes quantitative protocols to improve the reliability and generalisability of AI models used in mammographic analysis.
Section 2 of this paper introduces a categorisation framework for mammography, distinguishing three groups: clinical, technical, and screening-process-related. It also describes the representative dataset used to evaluate each category.
Section 3 reports the dataset statistics for these categories, while
Section 4 discusses the main results. Finally,
Section 5 provides concluding remarks.
3. Results
This section presents data characterisation statistics from the dataset described in
Section 2.2. Where possible, categories identified in
Section 2 have been analysed, to show how an AI system may be affected by a real-world example dataset. The impact on the AI system may be on the performance, generalisability and fairness of the model, all of which are contingent on the training data. We stress that we are using the previously described dataset from OMI-DB as a representative case study to highlight some of the potential implications in blindly using large datasets without consideration of the metadata (or data provenance) in the context of the specific task or research question. As a large database with well-curated metadata, we can contextualise the real-world implications of the areas listed in
Section 2, applicable to not only mammography or health data, but to all AI models trained on recorded datasets. We also note that this work should be interpreted as acknowledging potential issues in training AI models, as opposed to critical reference to the OMI-DB data specifically.
3.1. Clinical Categories
Table 2 shows the outcome of clients from the dataset. Categories B and B+ refer to benign lesions, M and M+ are malignant lesions. For those with a malignant outcome (M and M+ in
Table 2),
Table 3 lists the highest grade of cancer found per client. Both
Table 2 and
Table 3 show a significant imbalance in the data distribution which is known to impact model training, and some performance metrics can be misleading in some cases. Highly imbalanced data requires carefully selected training, validation and testing data, as well as appropriate training schemes to prevent the majority class from dominating the model’s learning capacity. It is however also important to take into consideration the purpose of the tool. Applications such as screening programmes typically will exhibit a large imbalance in classes as most instances are likely to be ‘normal’, whereas in other applications, e.g., differentiating disease, classes may be more balanced.
Table 2.
Distribution of client outcomes. B = benign; CIP = prior to interval cancer; M = malignant; N = normal; NA = normal with assessment; NAB = normal with assessment and biopsy; ‘+’ indicates annotations are available; cf.
Section 2.1.1.
Table 2.
Distribution of client outcomes. B = benign; CIP = prior to interval cancer; M = malignant; N = normal; NA = normal with assessment; NAB = normal with assessment and biopsy; ‘+’ indicates annotations are available; cf.
Section 2.1.1.
| Client Outcome | Number of Clients | Percentage of Clients (%) |
|---|
| B | 6970 | 17.5 |
| B+ | 971 | 2.4 |
| CIP | 993 | 2.5 |
| M | 4781 | 12.0 |
| M+ | 3197 | 8.0 |
| N | 21,360 | 53.6 |
| NA | 1548 | 3.9 |
| NAB | 67 | <1 |
| Not recorded | 3 | <1 |
Table 3.
Distribution of lesion grades for clients with outcome M or M+. G1 to G3 are invasive cancer grades 1 to 3. NDH = high-risk ductal carcinoma in situ (DCIS) grade, NDI = intermediate-risk DCIS grade, NDL = low-risk DCIS grade (according to NBSS Crystal Report v5.4 [
72]); cf.
Section 2.1.1.
Table 3.
Distribution of lesion grades for clients with outcome M or M+. G1 to G3 are invasive cancer grades 1 to 3. NDH = high-risk ductal carcinoma in situ (DCIS) grade, NDI = intermediate-risk DCIS grade, NDL = low-risk DCIS grade (according to NBSS Crystal Report v5.4 [
72]); cf.
Section 2.1.1.
| Malignant Lesion Grade | Number of Clients | Percentage of Clients |
|---|
| G1 | 984 | 12.3 |
| G2 | 2312 | 29.0 |
| G3 | 752 | 9.4 |
| NDH | 683 | 8.5 |
| NDI | 396 | 5.0 |
| NDL | 109 | 1.4 |
| Not recorded | 2721 | 34.1 |
| Other | 21 | <1 |
The UK breast cancer screening program focuses on women aged 50–70 [
73] with some locations trialing a wider 47–73 age range [
74].
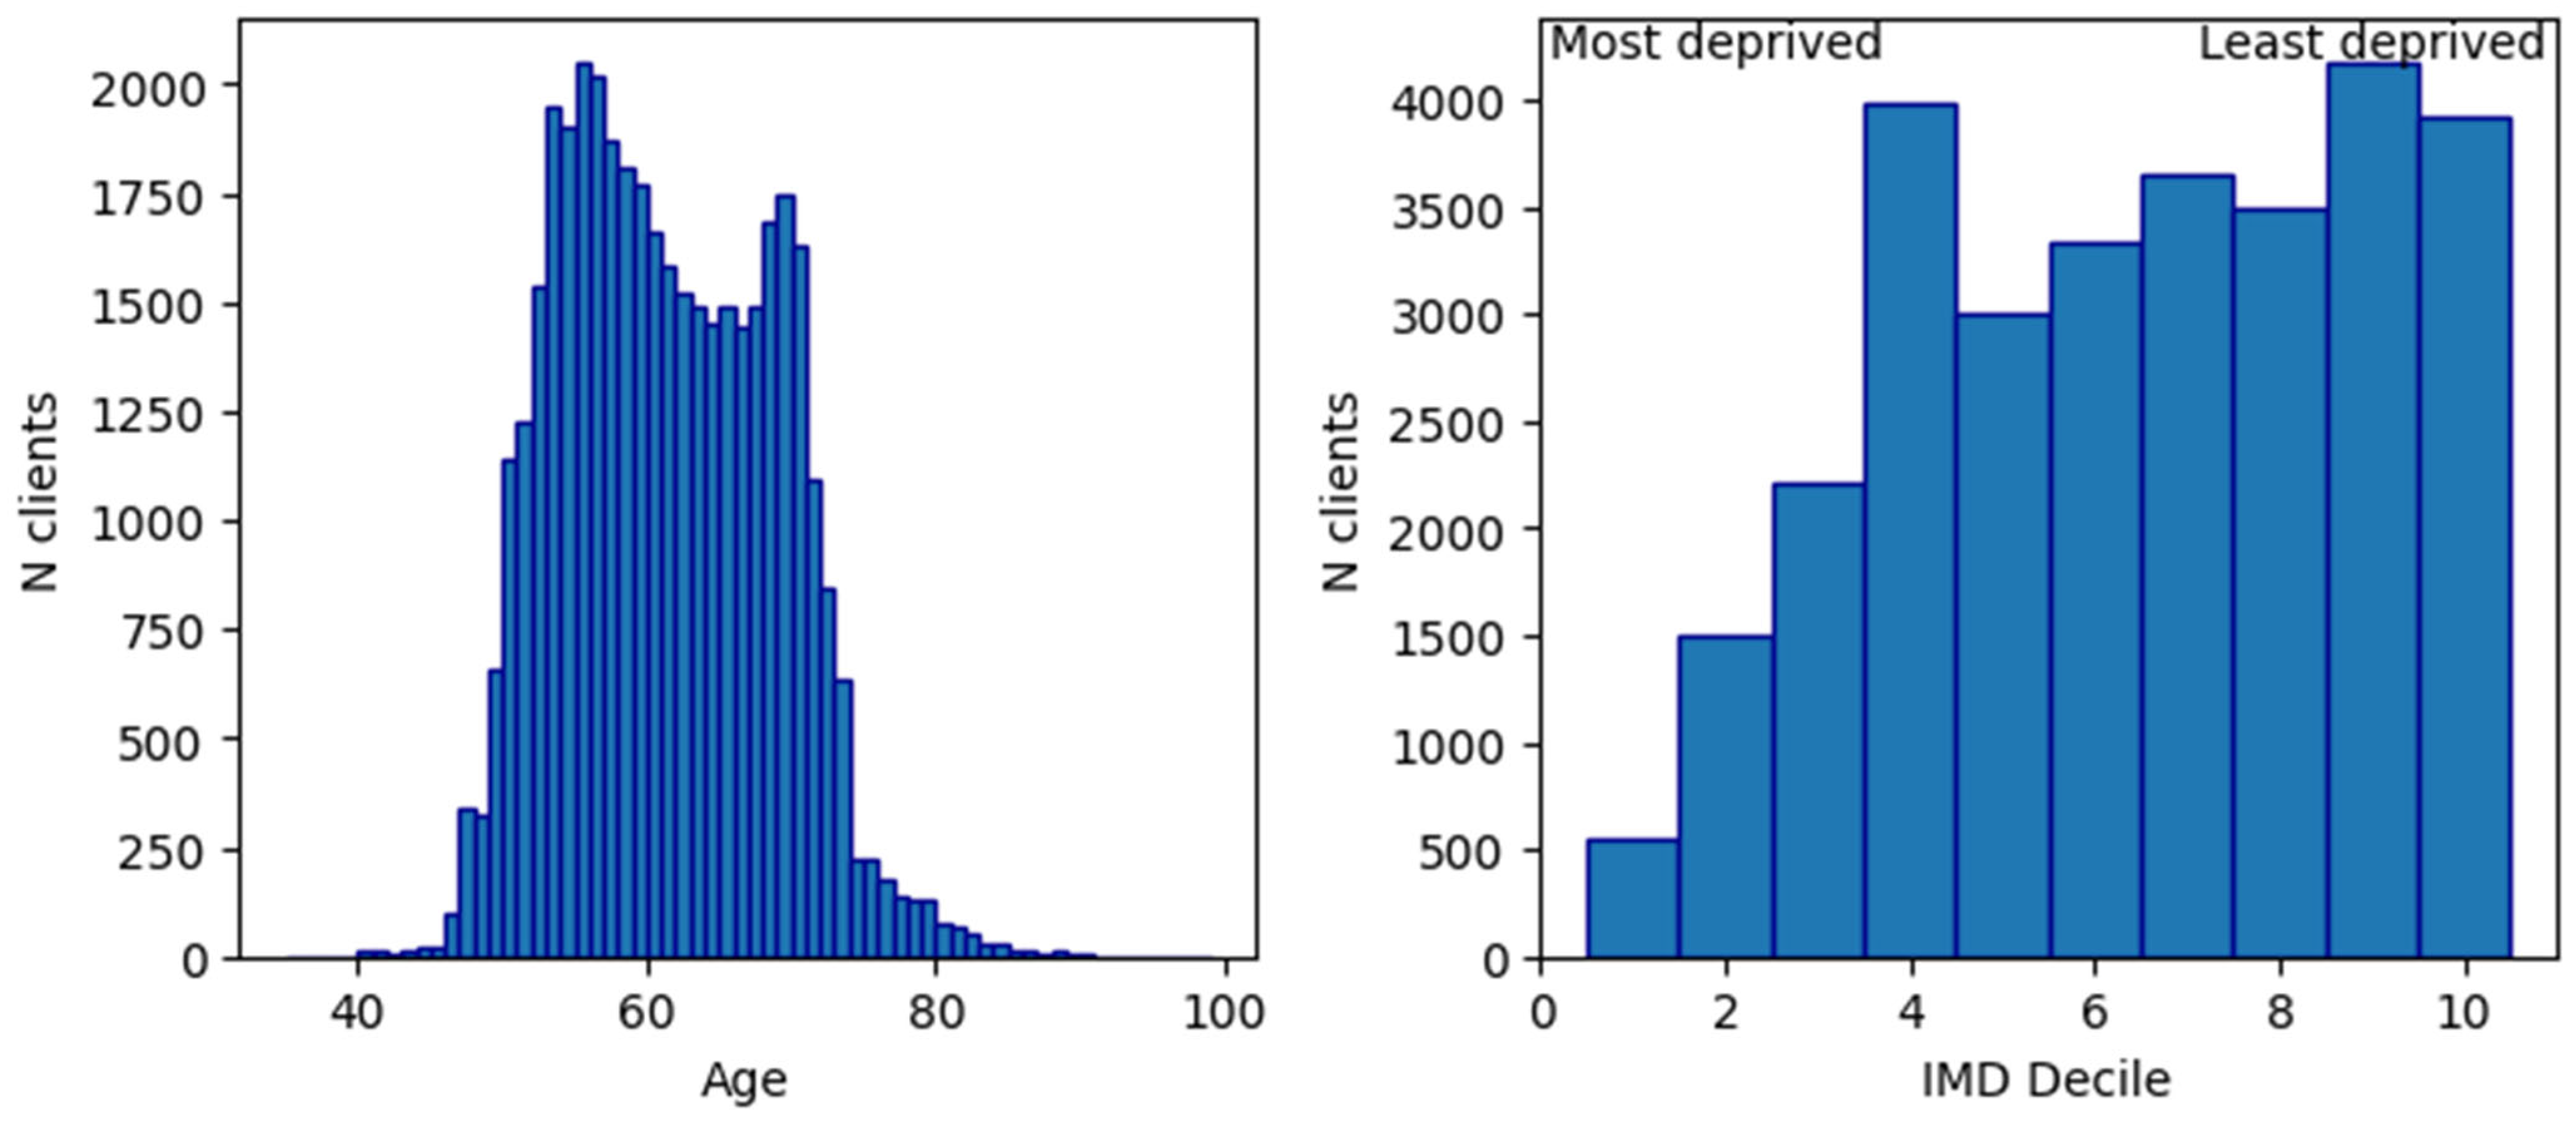
Figure 3 shows the distribution of ages of clients in the dataset, with 86% of the data lying within the national screening focus range. The distribution appears to be bimodal with peaks at 55 and 69 and asymmetric tails due to the different reasons for the screening; for example, clients screened at younger ages are likely to have a family history of cancer. Women older than 70 are not invited to screening but they can self-refer. As cancer and other conditions can increase in prevalence with age, uniform random sampling of data may not be appropriate depending on the specific task.
Figure 3 also shows the distribution of clients by index of multiple deprivation (IMD) decile, where the 10th decile is the 10% of regions in the UK which are least deprived and the 1st decile is the 10% of areas in the UK which are most deprived, using multiple deprivation metrics. The distribution is heavily skewed towards least deprived areas, due to the concentration of clients in the dataset living in the Southeast of England where IMD deciles are higher. This means that people from more deprived areas are under-represented, potentially impacting the fairness of trained models. Moreover, this could have further implications in model fairness, as there is a correlation between deprivation and obesity [
75], and obesity is correlated with breast size [
76] and adverse cancer outcomes [
29].
Figure 3.
Age and deprivation data spreads. (Left) Distribution of client age in the dataset. Total clients = 39,874, missing clients = 16. (Right) Distribution of clients across index of multiple deprivation (IMD) deciles. Total clients = 29,795, missing clients = 10,095.
Figure 3.
Age and deprivation data spreads. (Left) Distribution of client age in the dataset. Total clients = 39,874, missing clients = 16. (Right) Distribution of clients across index of multiple deprivation (IMD) deciles. Total clients = 29,795, missing clients = 10,095.
Table 4 shows the distribution of ethnicities in the dataset. The majority of clients are white, but a significant proportion of clients do not have a recorded ethnicity. Lack of data recording may be an issue for an AI model as it is important to train on representative samples of subgroups in the data being classified. As the physiologies of women can differ between ethnic groups (for instance, the distribution of breast size and density of (white) Western and Asian women are different), image data where ethnicity is not recorded may be excluded from, or be inappropriately used in, an AI training set. Ethnicities are self-declared so there is also some uncertainty in categorisation.
Table 4.
Distribution of clients across ethnic categories.
Table 4.
Distribution of clients across ethnic categories.
| Ethnic Category | Number | Percent |
|---|
| White | 21,777 | 54.6 |
| Not recorded | 13,713 | 34.4 |
| Asian/Asian British | 1637 | 4.1 |
| Black/Black British/Caribbean/African | 978 | 2.5 |
| Not stated | 928 | 2.3 |
| Any other ethnic group | 530 | 1.3 |
| Mixed/Multiple ethnic groups | 327 | <1 |
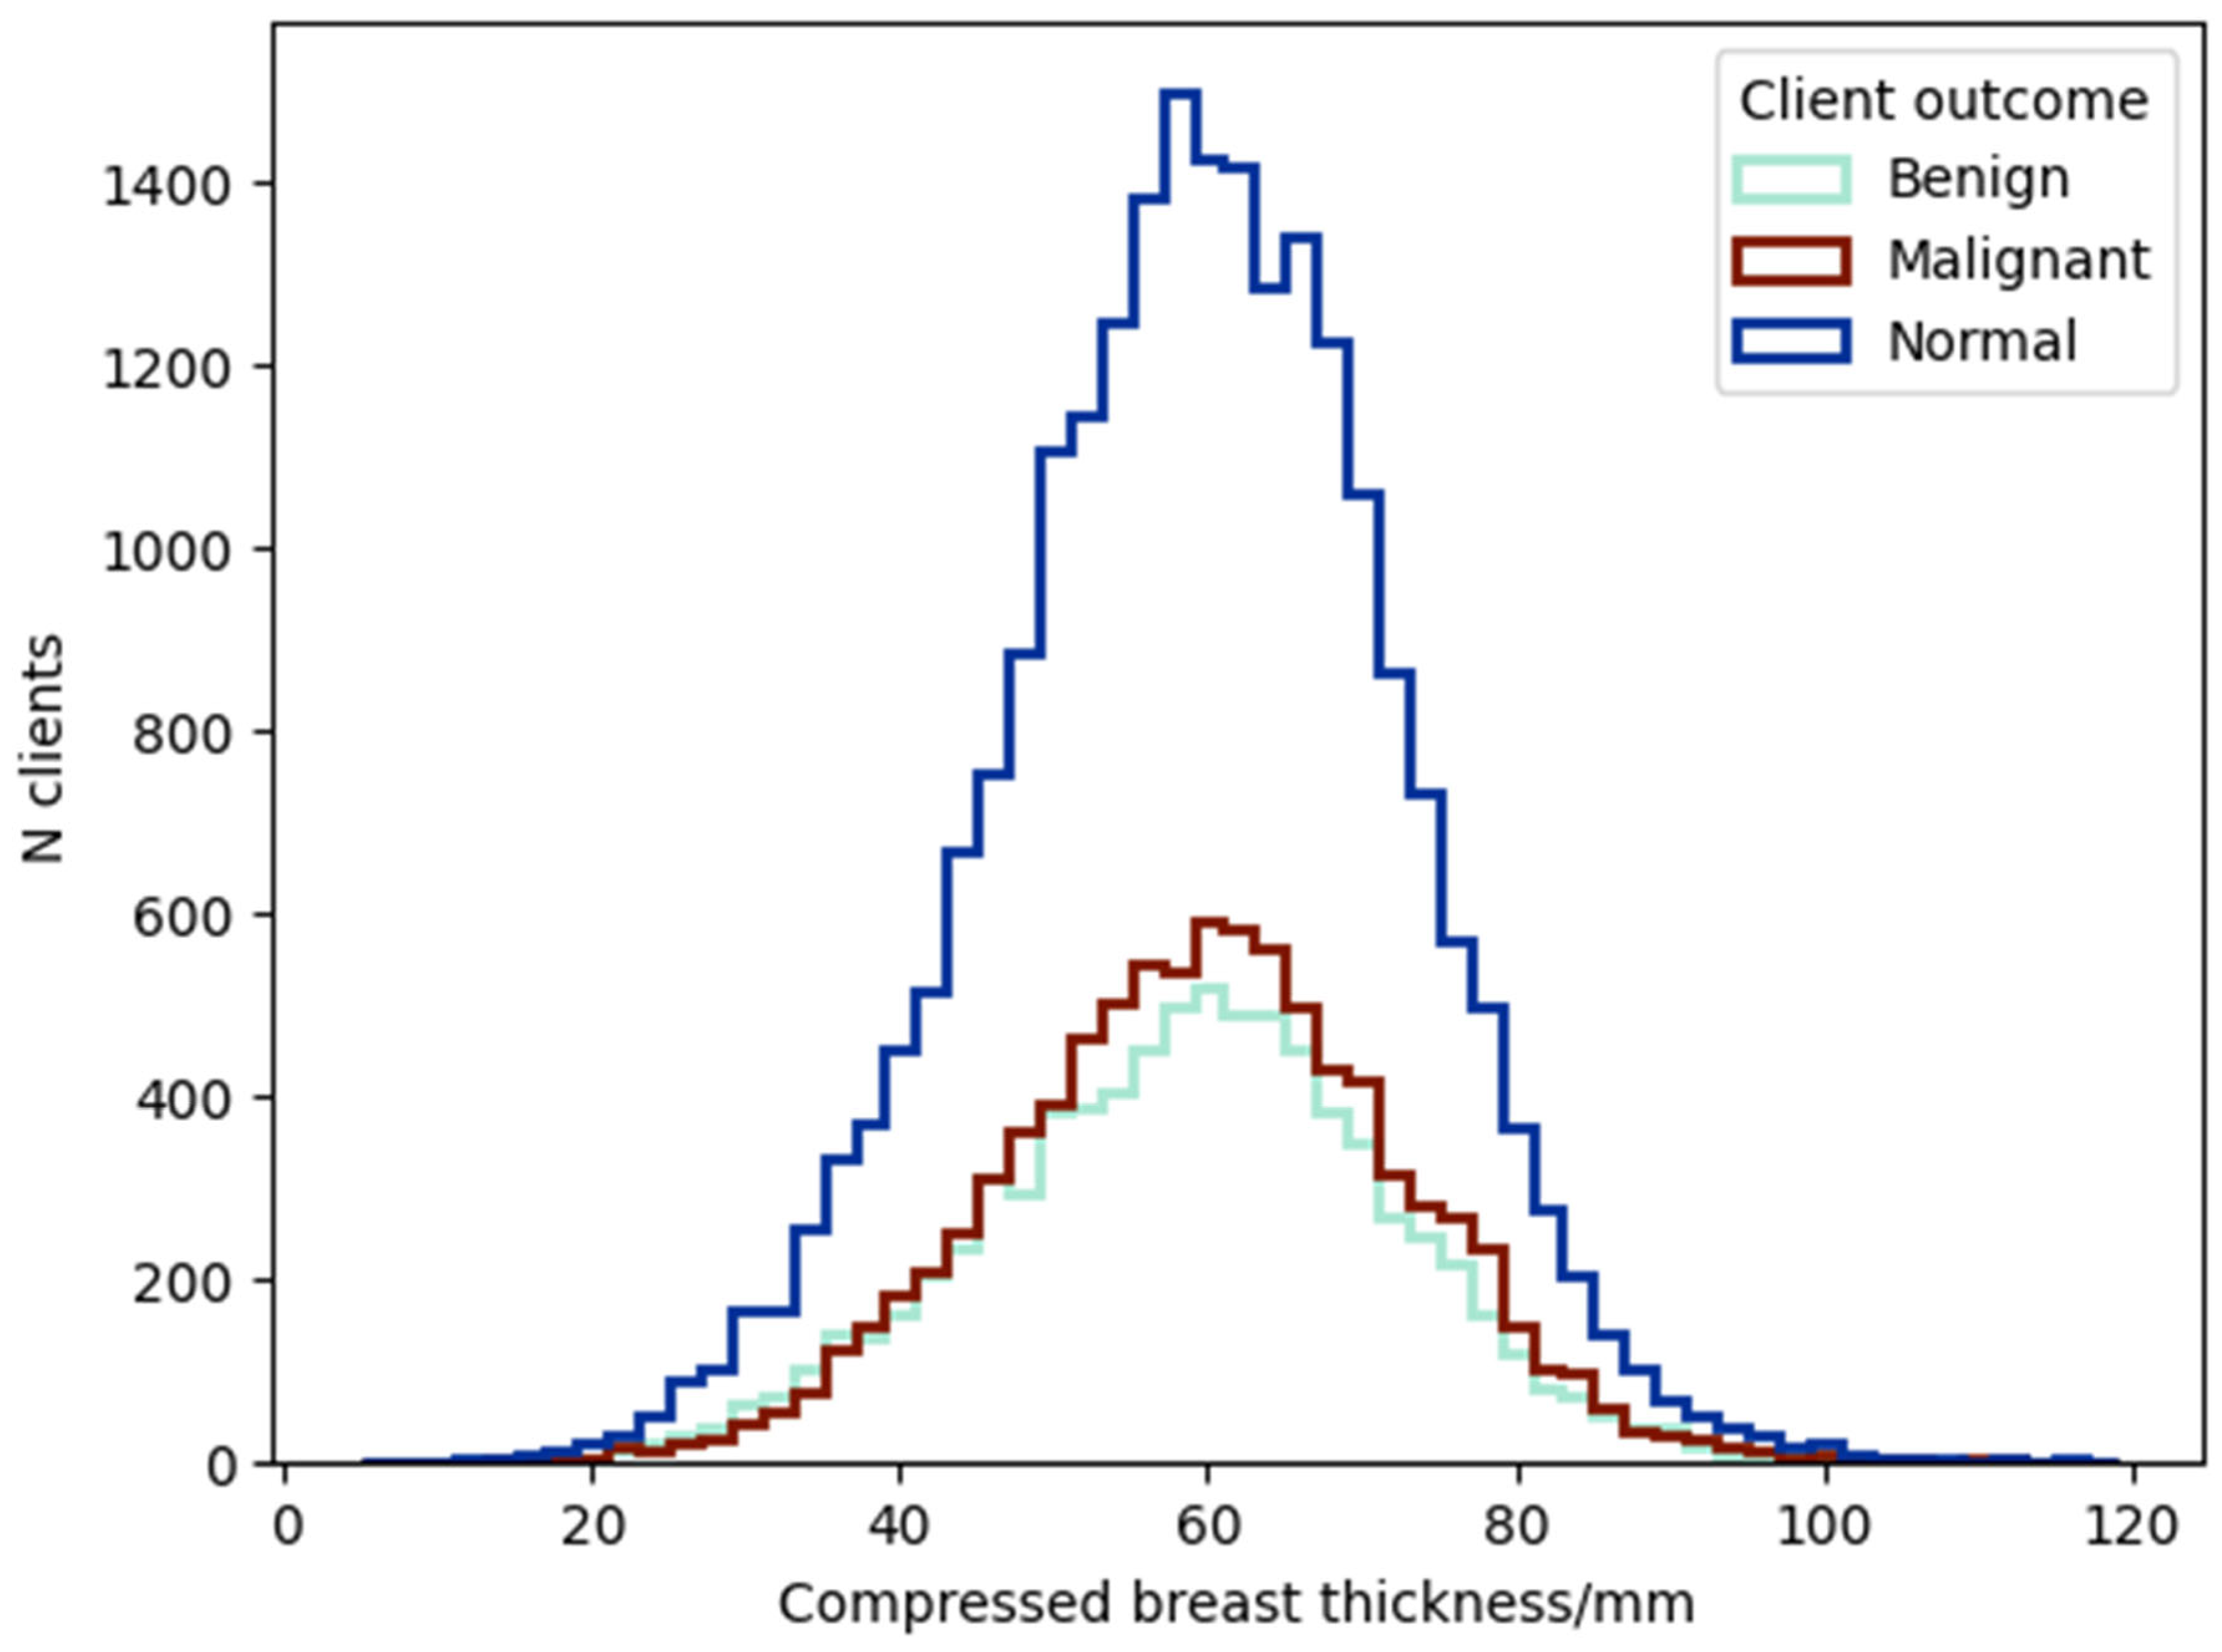
The distribution of compressed breast thickness in clients is given in
Figure 4. A Kolmogorov–Smirnov test indicates that the total distribution for all clients is not Gaussian (test statistic 0.0281,
p-value << 0.0001), supported by low positive excess kurtosis (0.09) indicating a slight deviation from Gaussian. There is also a slight asymmetry in the distribution, which has a negative skewness (−0.07), indicating that the left tail (lower compressed breast thickness) is longer (i.e., larger) than the right tail (higher compressed breast thickness). Due to the non-Gaussian nature of the distributions, we estimate the mean and standard deviation, with the associated uncertainties of these estimates, using the bootstrap method with 200 bootstrap samples with replacement and confidence level 0.9. For all clients we obtain a mean of 58.57 ± 0.07 mm, differing slightly from the median of 59.00 mm due to the marginal asymmetry in the distribution, and standard deviation 13.05 ± 0.05 mm.
Figure 4.
Distribution of compressed breast thickness by outcome. Missing: 0 clients; cf.
Section 2.1.1.
Figure 4.
Distribution of compressed breast thickness by outcome. Missing: 0 clients; cf.
Section 2.1.1.
3.2. Technical Features
Table 5,
Table 6 and
Table 7 show the proportion of studies in the dataset that were imaged with different software versions for different manufacturers. Overall, there are 28,655 Hologic studies (71.3%), 8615 Siemens studies (21.4%) and 2934 GE studies (7.3%). Using different software, or indeed different versions of the same software or different image processing routines, may result in differences in the processing of mammography images and how they appear to clinicians or an AI tool. Different software versions may correlate with time due to systematic updates. It is important when creating a training set that software version, as well as any image processing settings, are considered as the differences in image appearance may affect the performance of the AI tool.
| Software Version | Number of Studies | Percentage of Total Studies |
|---|
| Lorad Selenia 3.4.1.8/1.4.0.7/1.7.3.10 | 18,431 | 45.8 |
| Lorad Selenia 3.4.1.8/1.4.0.7/1.7.4.7 | 906 | 2.3 |
| Lorad Selenia 3.4.1.8/1.4.1.0/1.7.3.10 | 1233 | 3.1 |
| Lorad Selenia 3.4.1.8/2.0.0.2/1.7.3.10 | 958 | 2.4 |
| Lorad Selenia 3.4.2.9/1.4.1.0/1.7.4.7 | 806 | 2.0 |
| Selenia Dimensions 1.3 | 136 | <1 |
| Selenia Dimensions 1.7 | 712 | 1.8 |
| Selenia Dimensions 1.8 | 1015 | 2.5 |
| Selenia Dimensions 1.9 | 2248 | 5.6 |
| Selenia Dimensions 1.10 | 2003 | 5.0 |
| Selenia Dimensions 1.11 | 198 | <1 |
| Other | 13 | <1 |
| Software Version | Number of Studies | Percentage of Total Studies |
|---|
| VB41B | 7434 | 18.5 |
| VC20C | 505 | 1.3 |
| VB60D | 296 | <1 |
| VB60C | 183 | <1 |
| VA20F | 168 | <1 |
| Other | 29 | <1 |
Table 7.
GE mammography systems: software and version numbers; cf.
Section 2.1.2.
Table 7.
GE mammography systems: software and version numbers; cf.
Section 2.1.2.
| Software Version | Number of Studies | Percentage of Total Studies |
|---|
| 54.10 | 1440 | 3.6 |
| 53.40 | 841 | 2.1 |
| 55.30 | 521 | 1.3 |
| 55.41.3 | 99 | <1 |
| Other | 38 | <1 |
3.3. Screening Process
Multi-view mammography AI models, such as [
43,
77,
78,
79], expect four mammography images as input, namely, CC and MLO views of both the left and right breast. Of the 39,890 clients in the dataset, 36,862 clients had exactly four images, 2294 clients had more than four images, and 734 clients had fewer than four images. This means that 3028 clients (7.6%) could be excluded if using the multi-view AI models for mammography images. Of the 2294 clients with more than four images, 606 studies (1.5%) were technical recalls and 634 studies (1.6%) were technical repeats. In principle these clients could be used within a multi-view AI model; however, they would require manual selection of the four images for each study, and additional data processing steps for mosaic images of large breasts.
Table 8 shows the number and percentage of mammography views from studies in the dataset. Almost all studies in the dataset are the standard screening views, with the additional views relating to assessments, such as localisation of lesions. Although these are rare, well-curated data would enable these additional views to be excluded for evaluation with an AI screening tool as these would be out of distribution compared to the training data and hence the AI predictions may be unreliable.
Table 8.
Mammographic views within the dataset. The majority of patients had the standard screening views MLO and CC, with a small fraction having supplementary views, such as the mediolateral (ML) or lateromedial (LM) view, or a CC image with implant displacement (CCID). Views with 10 or fewer studies have been grouped into “other”; cf.
Section 2.1.3.
Table 8.
Mammographic views within the dataset. The majority of patients had the standard screening views MLO and CC, with a small fraction having supplementary views, such as the mediolateral (ML) or lateromedial (LM) view, or a CC image with implant displacement (CCID). Views with 10 or fewer studies have been grouped into “other”; cf.
Section 2.1.3.
| View Position | Number of Studies Containing This View | Percentage of Total Studies |
|---|
| MLO | 40,096 | 99.7 |
| CC | 40,031 | 99.6 |
| CCID | 20 | <1 |
| LM | 18 | <1 |
| ML | 15 | <1 |
| Other | 22 | <1 |
3.4. Medical Devices and Implants
From 39,996 clients, with 808,585 images, 7134 images from 2605 clients (0.9% of images, 6.5% of clients) were found to have an implant or medical device that caused bright areas in the image. Of these 7134 images, 2916 images (40.9%) had the DICOM tag ‘BreastImplantPresent’ as True.
It is important to either remove images with implants or medical devices from any AI training set, or create an appropriate training subset for these images, as they may impact the results of the AI algorithm. The use of DICOM tags to flag the presence of an implant is not consistent which may make identifying implants in large datasets difficult and time consuming.
4. Discussion
The dataset analysed here is a subset of the OMI-DB. It is a relatively large data set using relatively recently acquired images. We showed it is a heterogeneous dataset, but it is possible to characterise the dataset and show where there are subgroups that may not have sufficient cases, e.g., extremes of compressed breast thickness, ethnicities and equipment manufacturers. The advantage of the OMI-DB is that some of these shortages can be improved by including more images, such as equipment. But this cannot be done for all shortages. It is vital that a dataset is characterised, either to indicate the relevance of the training set and/or the image set that the AI will be applied to. It is clear, even with a large dataset such as OMI-DB, there are some sub-groups that have small numbers. There are a number of other publicly available datasets [
66,
80,
81] and reviews of the contents of some of these can be found in [
82]. The largest of the datasets outside of OMI-DB is the Chinese Mammography Database (CMMD) [
66] with 1775 cases, meaning that only broad sub-group analysis may be done. For these sub-groups appropriate strategies must be employed, such as strict inclusion/exclusion criteria, training schemes and tailored evaluation metrics. It should be noted that several of these datasets contain scanned films [
60,
62] which should be avoided for model training in general; these images are intrinsically different in look and quality from digital images.
The ethnicity of the publicly available datasets is primarily Northern European. The main exceptions are VinDr-Mammo [
67] which has a Vietnamese population and CMMD [
66] which has a Chinese population. The EMory BrEast Imaging Dataset (EMBED) [
80] has a large African American population (42%). The physiologies of women can differ between ethnic groups, meaning AI tools trained on one dataset may not be easily applied to another. Ethnicity is important to consider when designing AI models; however, it can be difficult to categorise due to lack of recording, as shown in
Section 3, leading to small subgroup sizes and insufficient data.
We demonstrated the distribution of compressed breast thicknesses in the dataset for three systems. Any differences that exist will be more likely due to the population rather than the imaging system. At the extremes of the range of breast thicknesses in
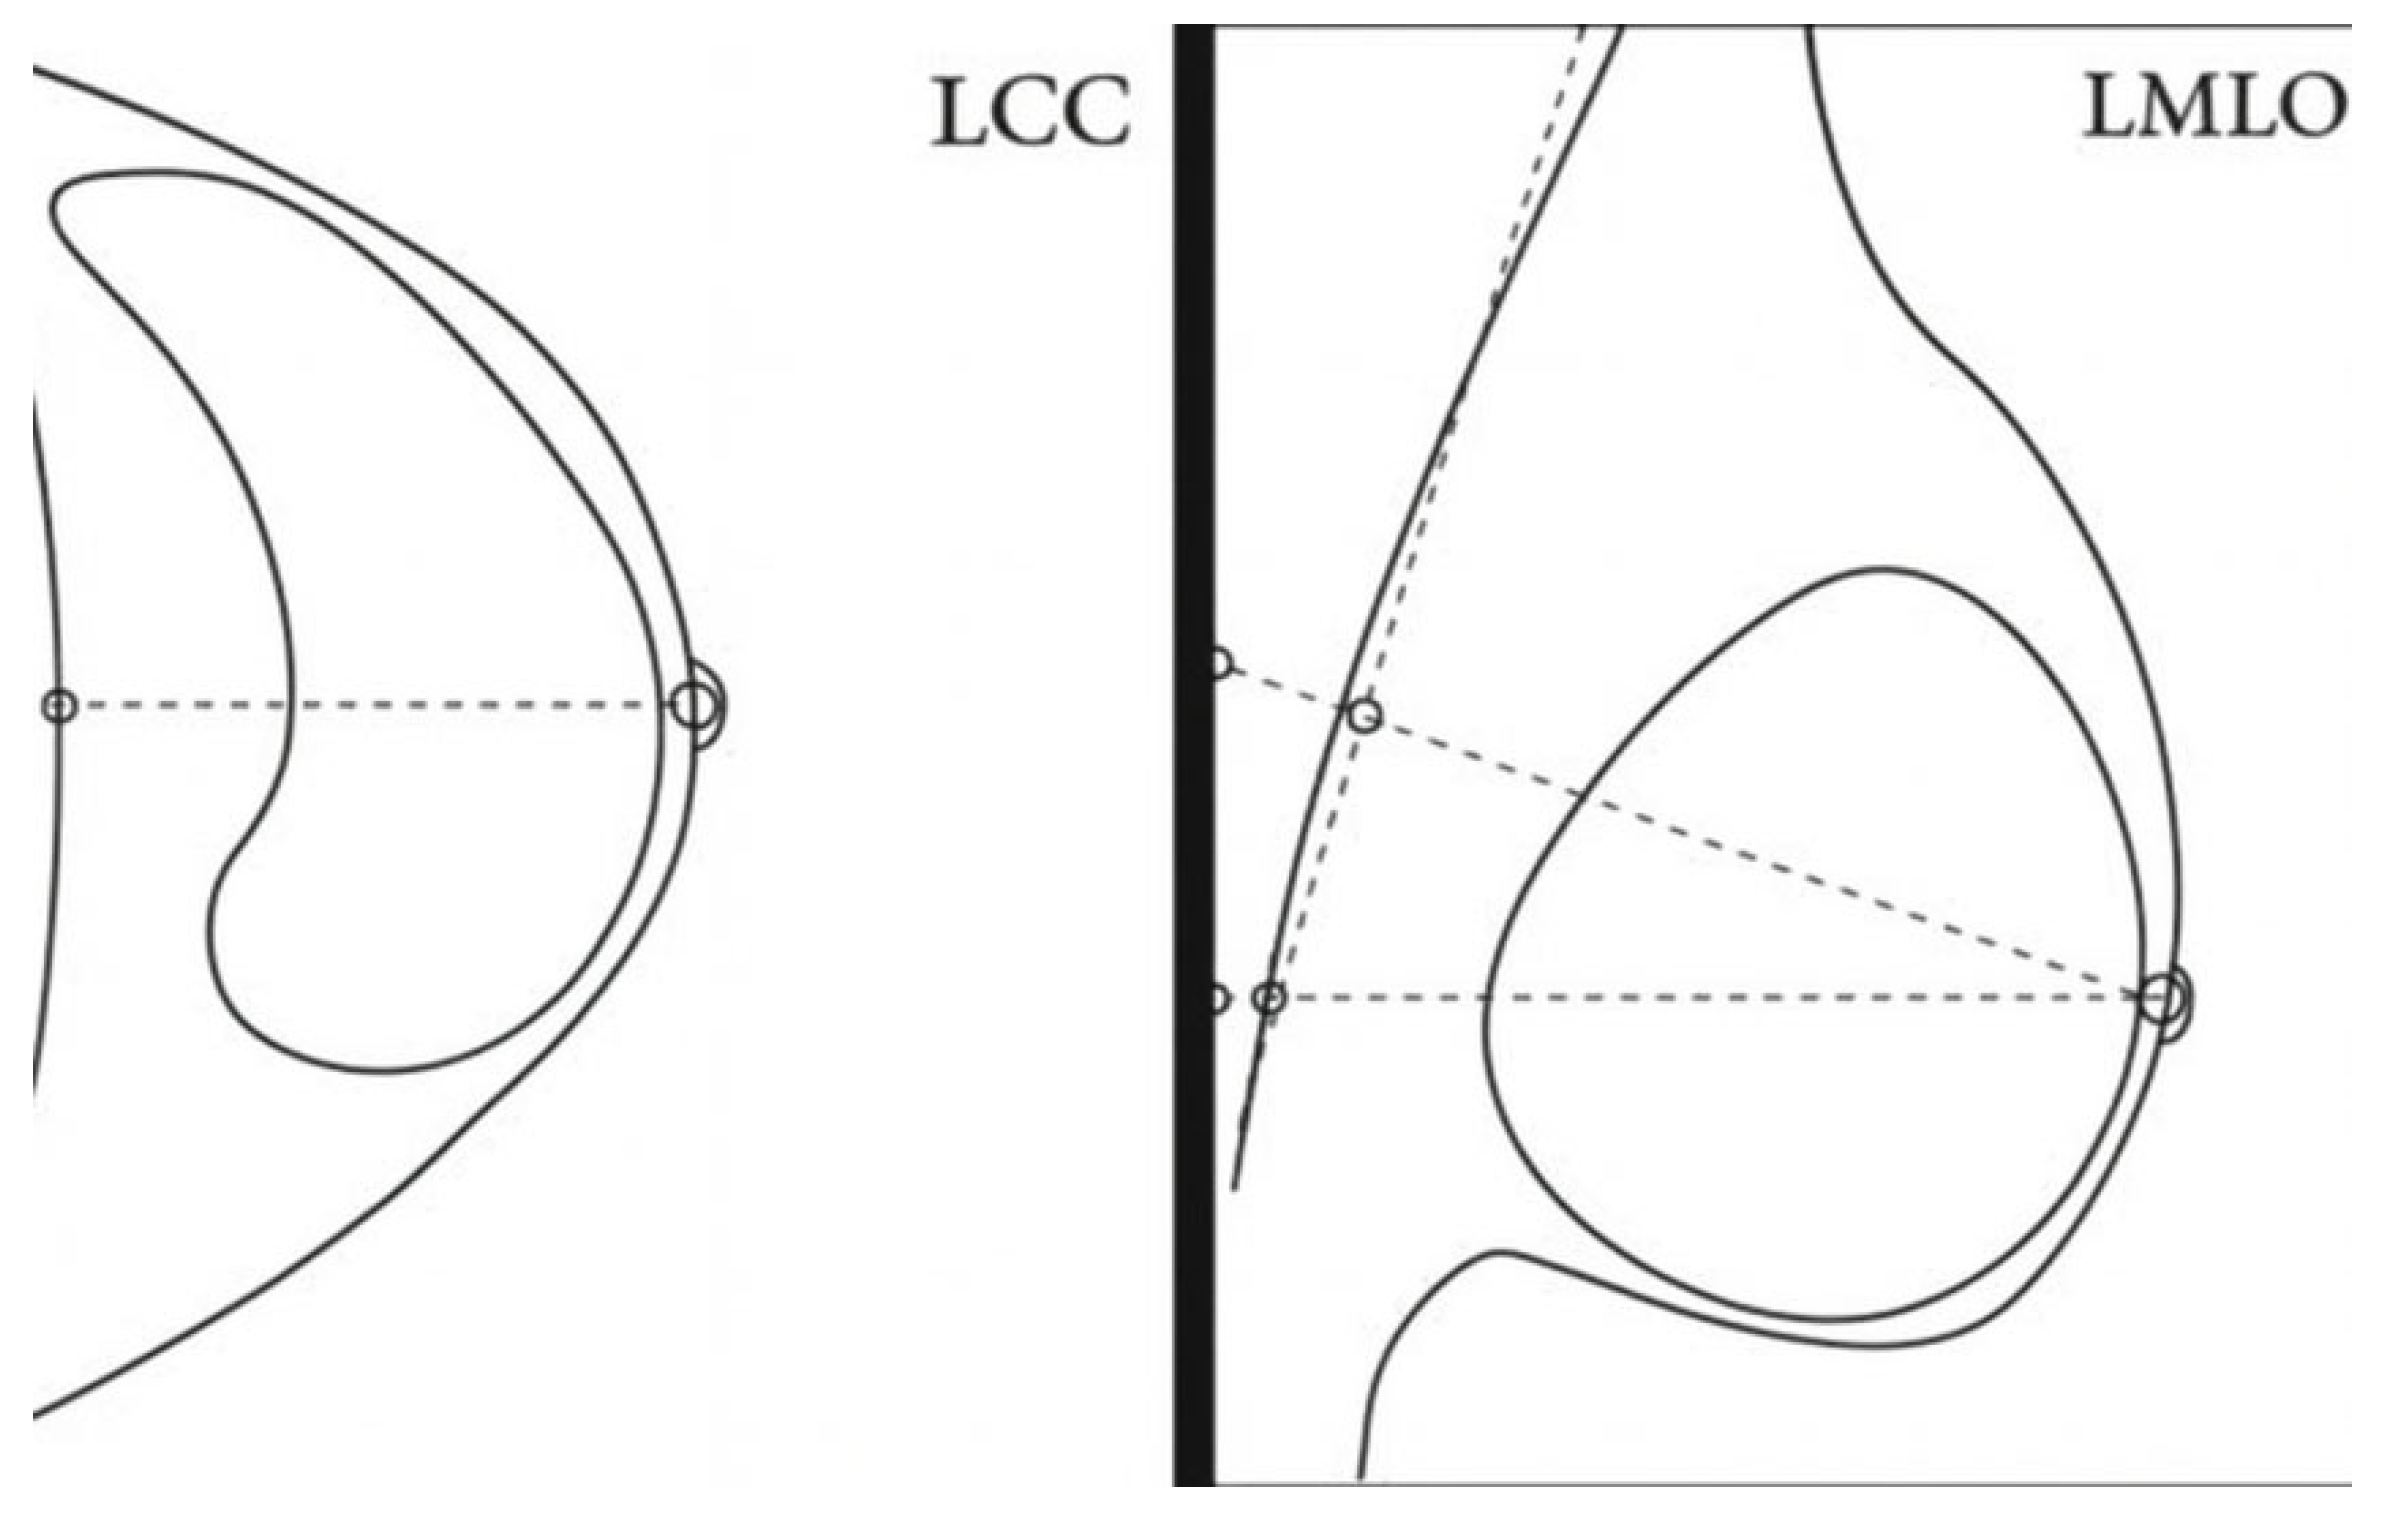
Figure 4, there are some relatively small numbers. It will be difficult to train and evaluate the performance of AI with these numbers. At the extremes, the largest breasts will be more fatty but also many of them will require multiple images to cover the whole breast. The thinner breasts are more glandular and indeed image presentation for compressed breasts less than 20 mm thick have been shown to be poor [
33]. Therefore, there is potential bias against women presenting with smaller or larger breasts than average. The average CBT presented here is 58.57 ± 0.07 mm. If this value is compared to CBTs for data collected between 2016 and 2019 for the whole of the UK, then we see that it is less than the national average of 60.7 mm [
83] (average of reported CC and MLO). The population in the dataset is primarily from the South of England and perhaps indicates regional differences within the UK as there must be areas where the breasts are on average larger.
There is a bias in the data to women in less deprived areas. This may be partly due to the areas of data collection, but it may be difficult to avoid as it has been shown that there is an association between non-attendance at breast screening and deprivation [
28]. The dataset is primarily for women between the ages of 50 and 70 years old, which matches the UK screening population. Many other national screening programmes will have different ranges of age. Age will affect the appearance of the mammograms; for example, the glandularity of women changes as they get older [
30].
The age of the dataset is also important. There is an inevitability that AI will be trained on image sets that are older; firstly, time is required to collect sufficient images, and secondly, a true normal case will require a follow-up screen, in case the woman returns with an interval cancer and/or has an abnormal result following a screening event. The best datasets will still be a few years old at best but many will be considerably older [
65]. It is interesting to note what differences time can make to the datasets. In addition to potential changes in practice or screening staff, it has been shown that the quality of imaging systems has improved over time [
31]. Image processing changes have been made that affect the image presentation [
52]. There are a variety of software versions contained within the database examined in this study. It should be noted that most of these changes will not affect the image presentation but may be changes to the interface or for reasons of security. Image processing settings are likely to produce larger differences in image presentation than software versions, as they can be designed to give images a different look [
52]. We know that AI can be affected by the presentation of the image; for example, Vries et al. [
34] showed recall rate increasing by a factor of four following a change in software version. Equipment type may also change over time; for example, the dataset CMMD [
66] only contains GE Senographe DS, whereas these sets have been obsolete in the UK for over a decade.
Additionally, the population can change over time; it has been shown that the average compressed breast thickness has increased over time in the UK [
83]. Datasets such as CMMD [
66] were acquired prior to 2015. The OMI-DB database [
41] is continually acquired and so the images can be quite recent in the database; however, due to the screening interval in the NHS, we do not know the ground truth of normal cases until three years passes and the woman returns for the next screen.
There can also be limitations on the cases that can be applied to screening images. AI products tend to be trained with four views [
84] and so cases outside of this range may not be acceptable to the AI tool. Most of these are women who require multiple images to fully image the breast. There is a question of bias that there are sub-groups that may be poorly served, if at all, by AI. This is particularly of interest as we know that there are links between deprivation and obesity [
75] and there is already health inequality in screening for deprived areas [
28]. We have shown that 7.6% of clients in the database examined here may not be readable by AI due to not having the standard four views.
5. Conclusions
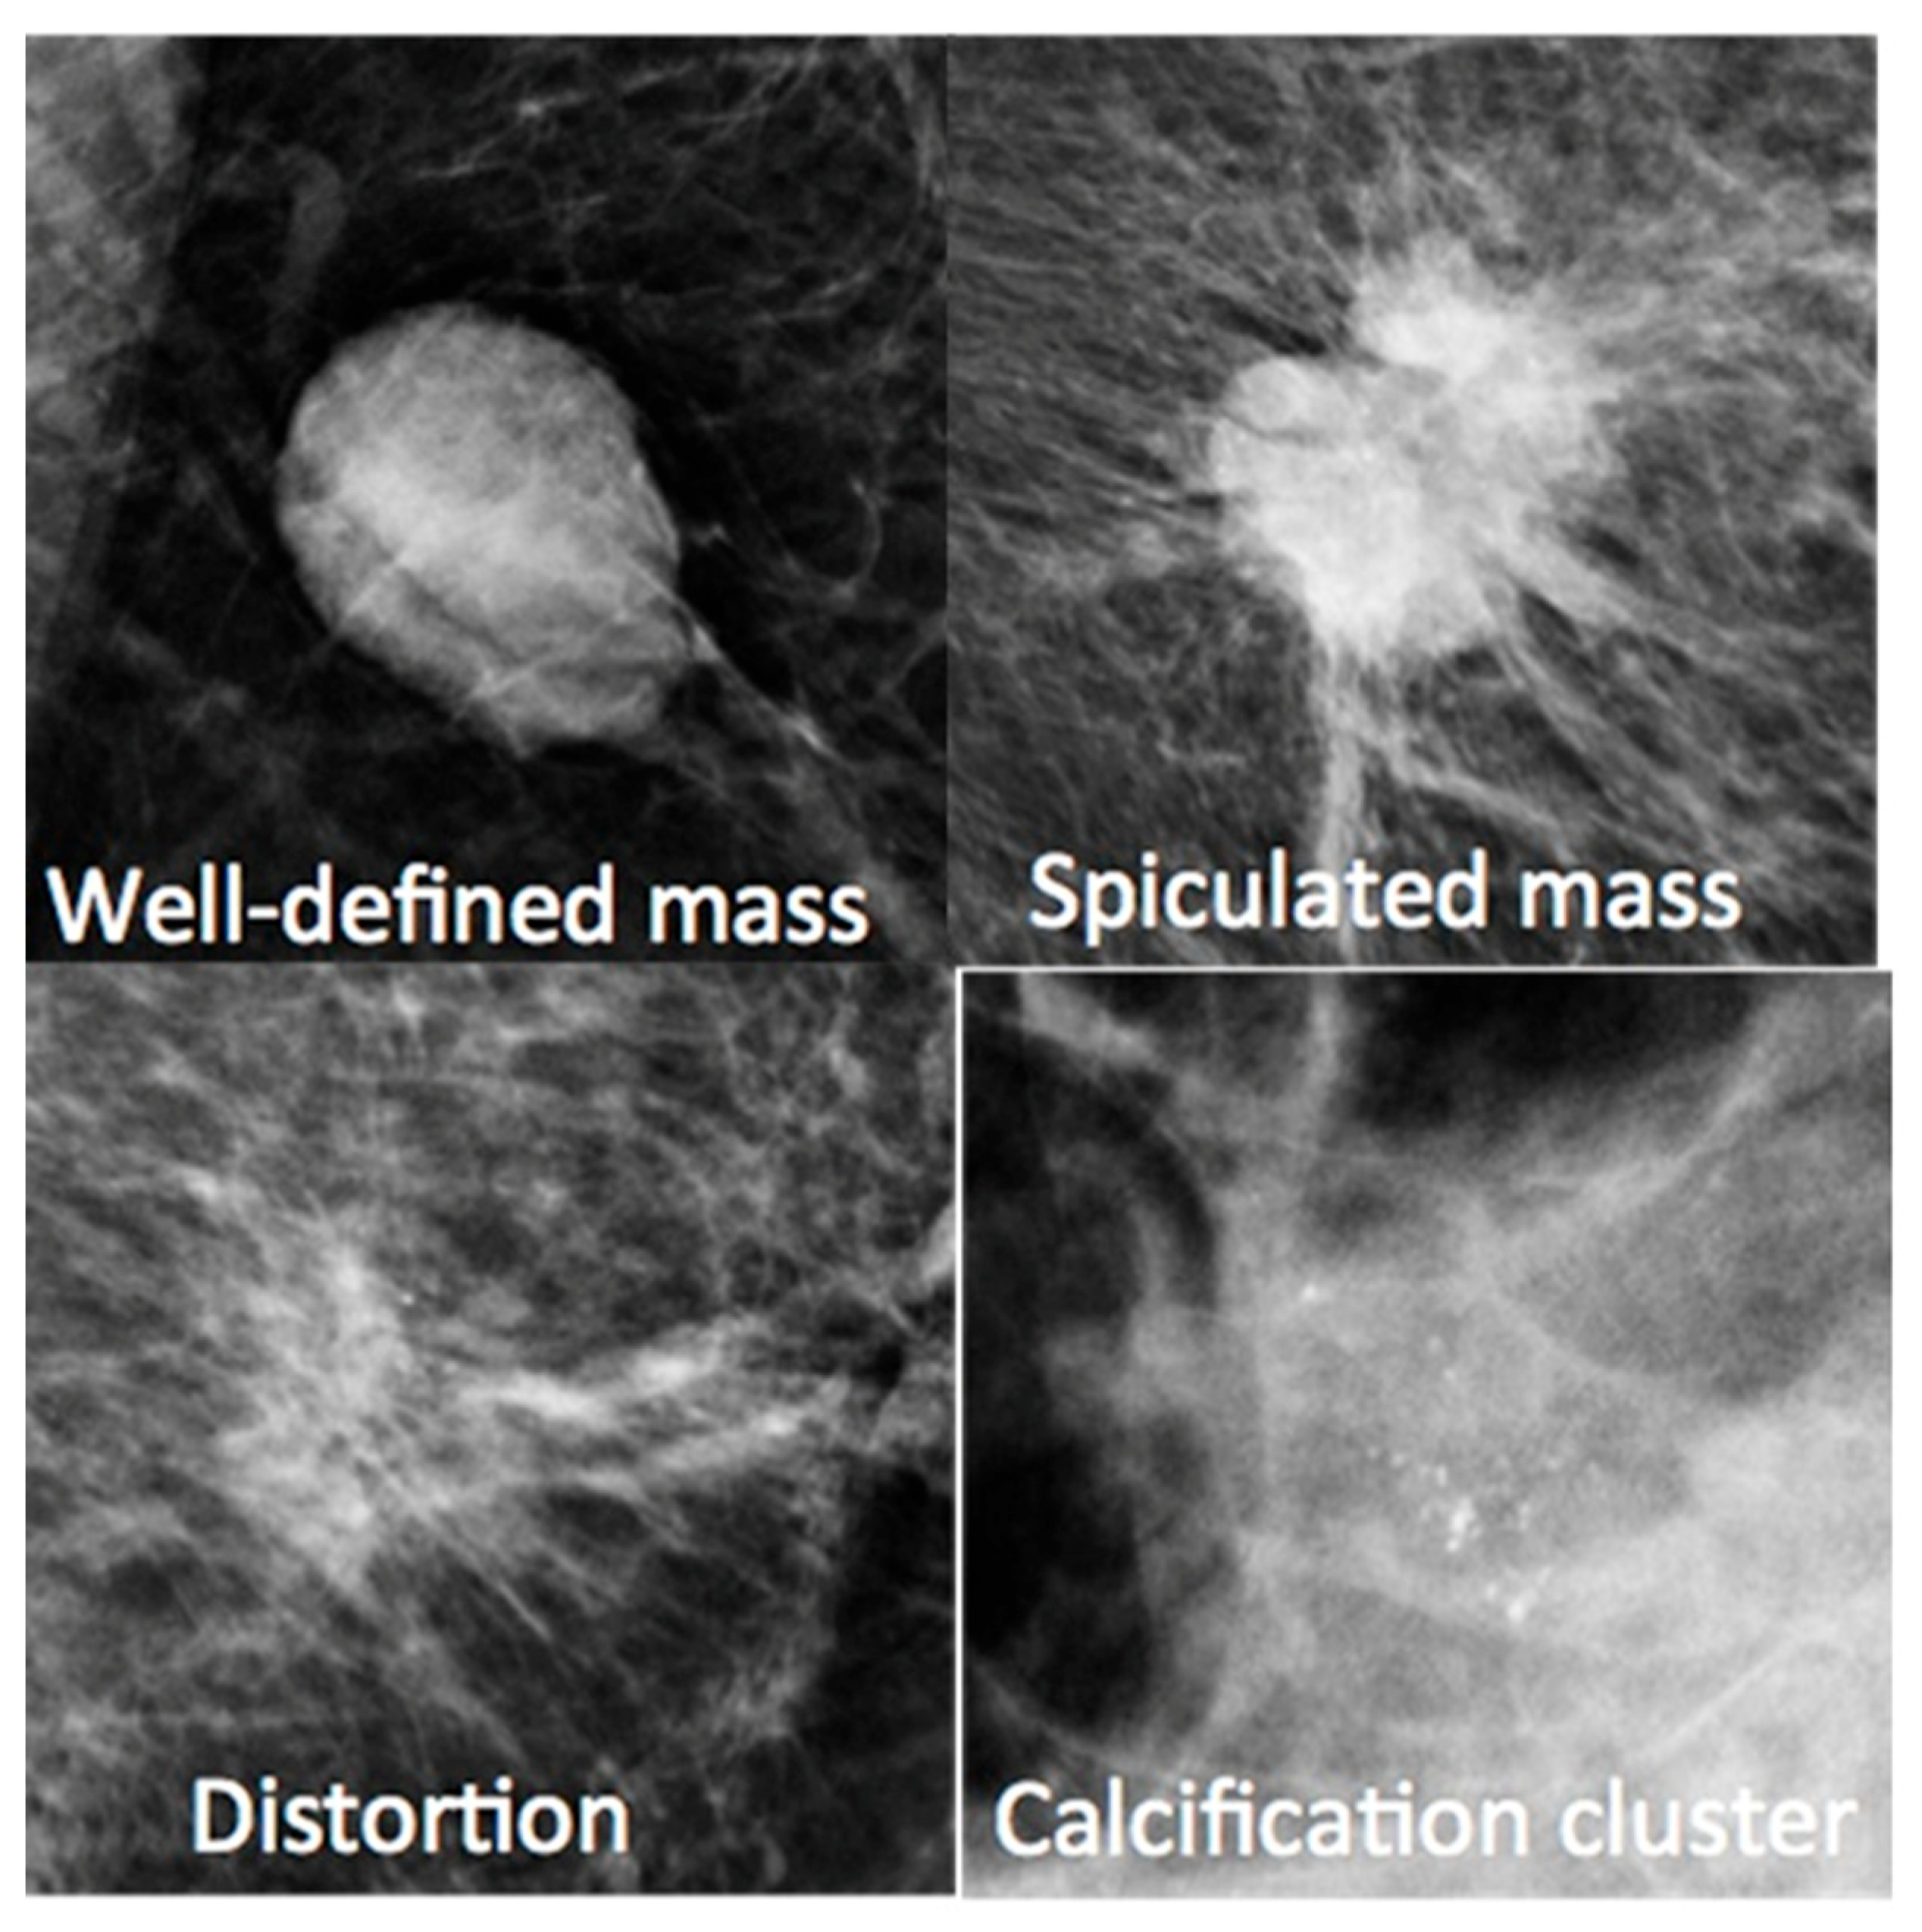
In this paper we have examined several factors affecting mammography imaging data. The specific categorisations discussed were (i) clinical—the types of masses identified; (ii) demographic—the differences between women; (iii) technical—the differences between imaging devices; and (iv) screening processes—the protocols for collecting images; along with other categories. This analysis reveals the complexity of breast screening images and associated metadata and provides a rationale for why AI models trained on datasets inappropriate for the task for which they are being developed may perform poorly and not generalise well. For AI to be fully trustworthy, it must be developed to be able to overcome these limitations. Work to this end has been carried out in the form of [
85] and the New York University (NYU) model [
48] where they use training data from different manufacturers.
We have described a wide range of factors that can be used to categorise an image set. There may be differences in the categories between image sets used for training of AI and in the field due to population and equipment setup. These differences may result in an AI product not working as optimally in the field as it did in its training and validation. While groups developing AI products may have their own private source of data they have collected [
78,
86], it is a difficult process to undertake securely and ethically, as shown by the methods required described in [
87]. Therefore, it is easier to use other datasets that are publicly available. In this work, we have characterised the publicly available (under licence) OMI-DB dataset licenced to the MAIBAI project. We have shown that the dataset covers a wide range of sub-groups; however, there are still weaknesses in areas such as ethnicity (where the vast majority of women are white) and range of X-ray equipment (only three manufacturers with the majority being Hologic).
The importance of specific subcategories will vary depending on the task the AI is applied to, and the model. Some models may be more sensitive to some categories than others. We argue that it is important to test any model fully on available categories alongside a sensitivity analysis before deployment.
This concept will apply to other medical domains where AI models are trained on available, rather than appropriate, data for a given task. Work has already put into practice our findings by purposely selecting balanced datasets for training [
27,
88]. Further work will develop these ideas and directly measure differences in accuracy.




 ,
,