Elevated Corpus Callosum T1rho Reflects Disease Burden and Structural Atrophy in Multiple Sclerosis

 , , , ,
  , and
, and
Abstract
1. Introduction
2. Materials and Methods
2.1. Study Participants
2.2. MRI Protocol
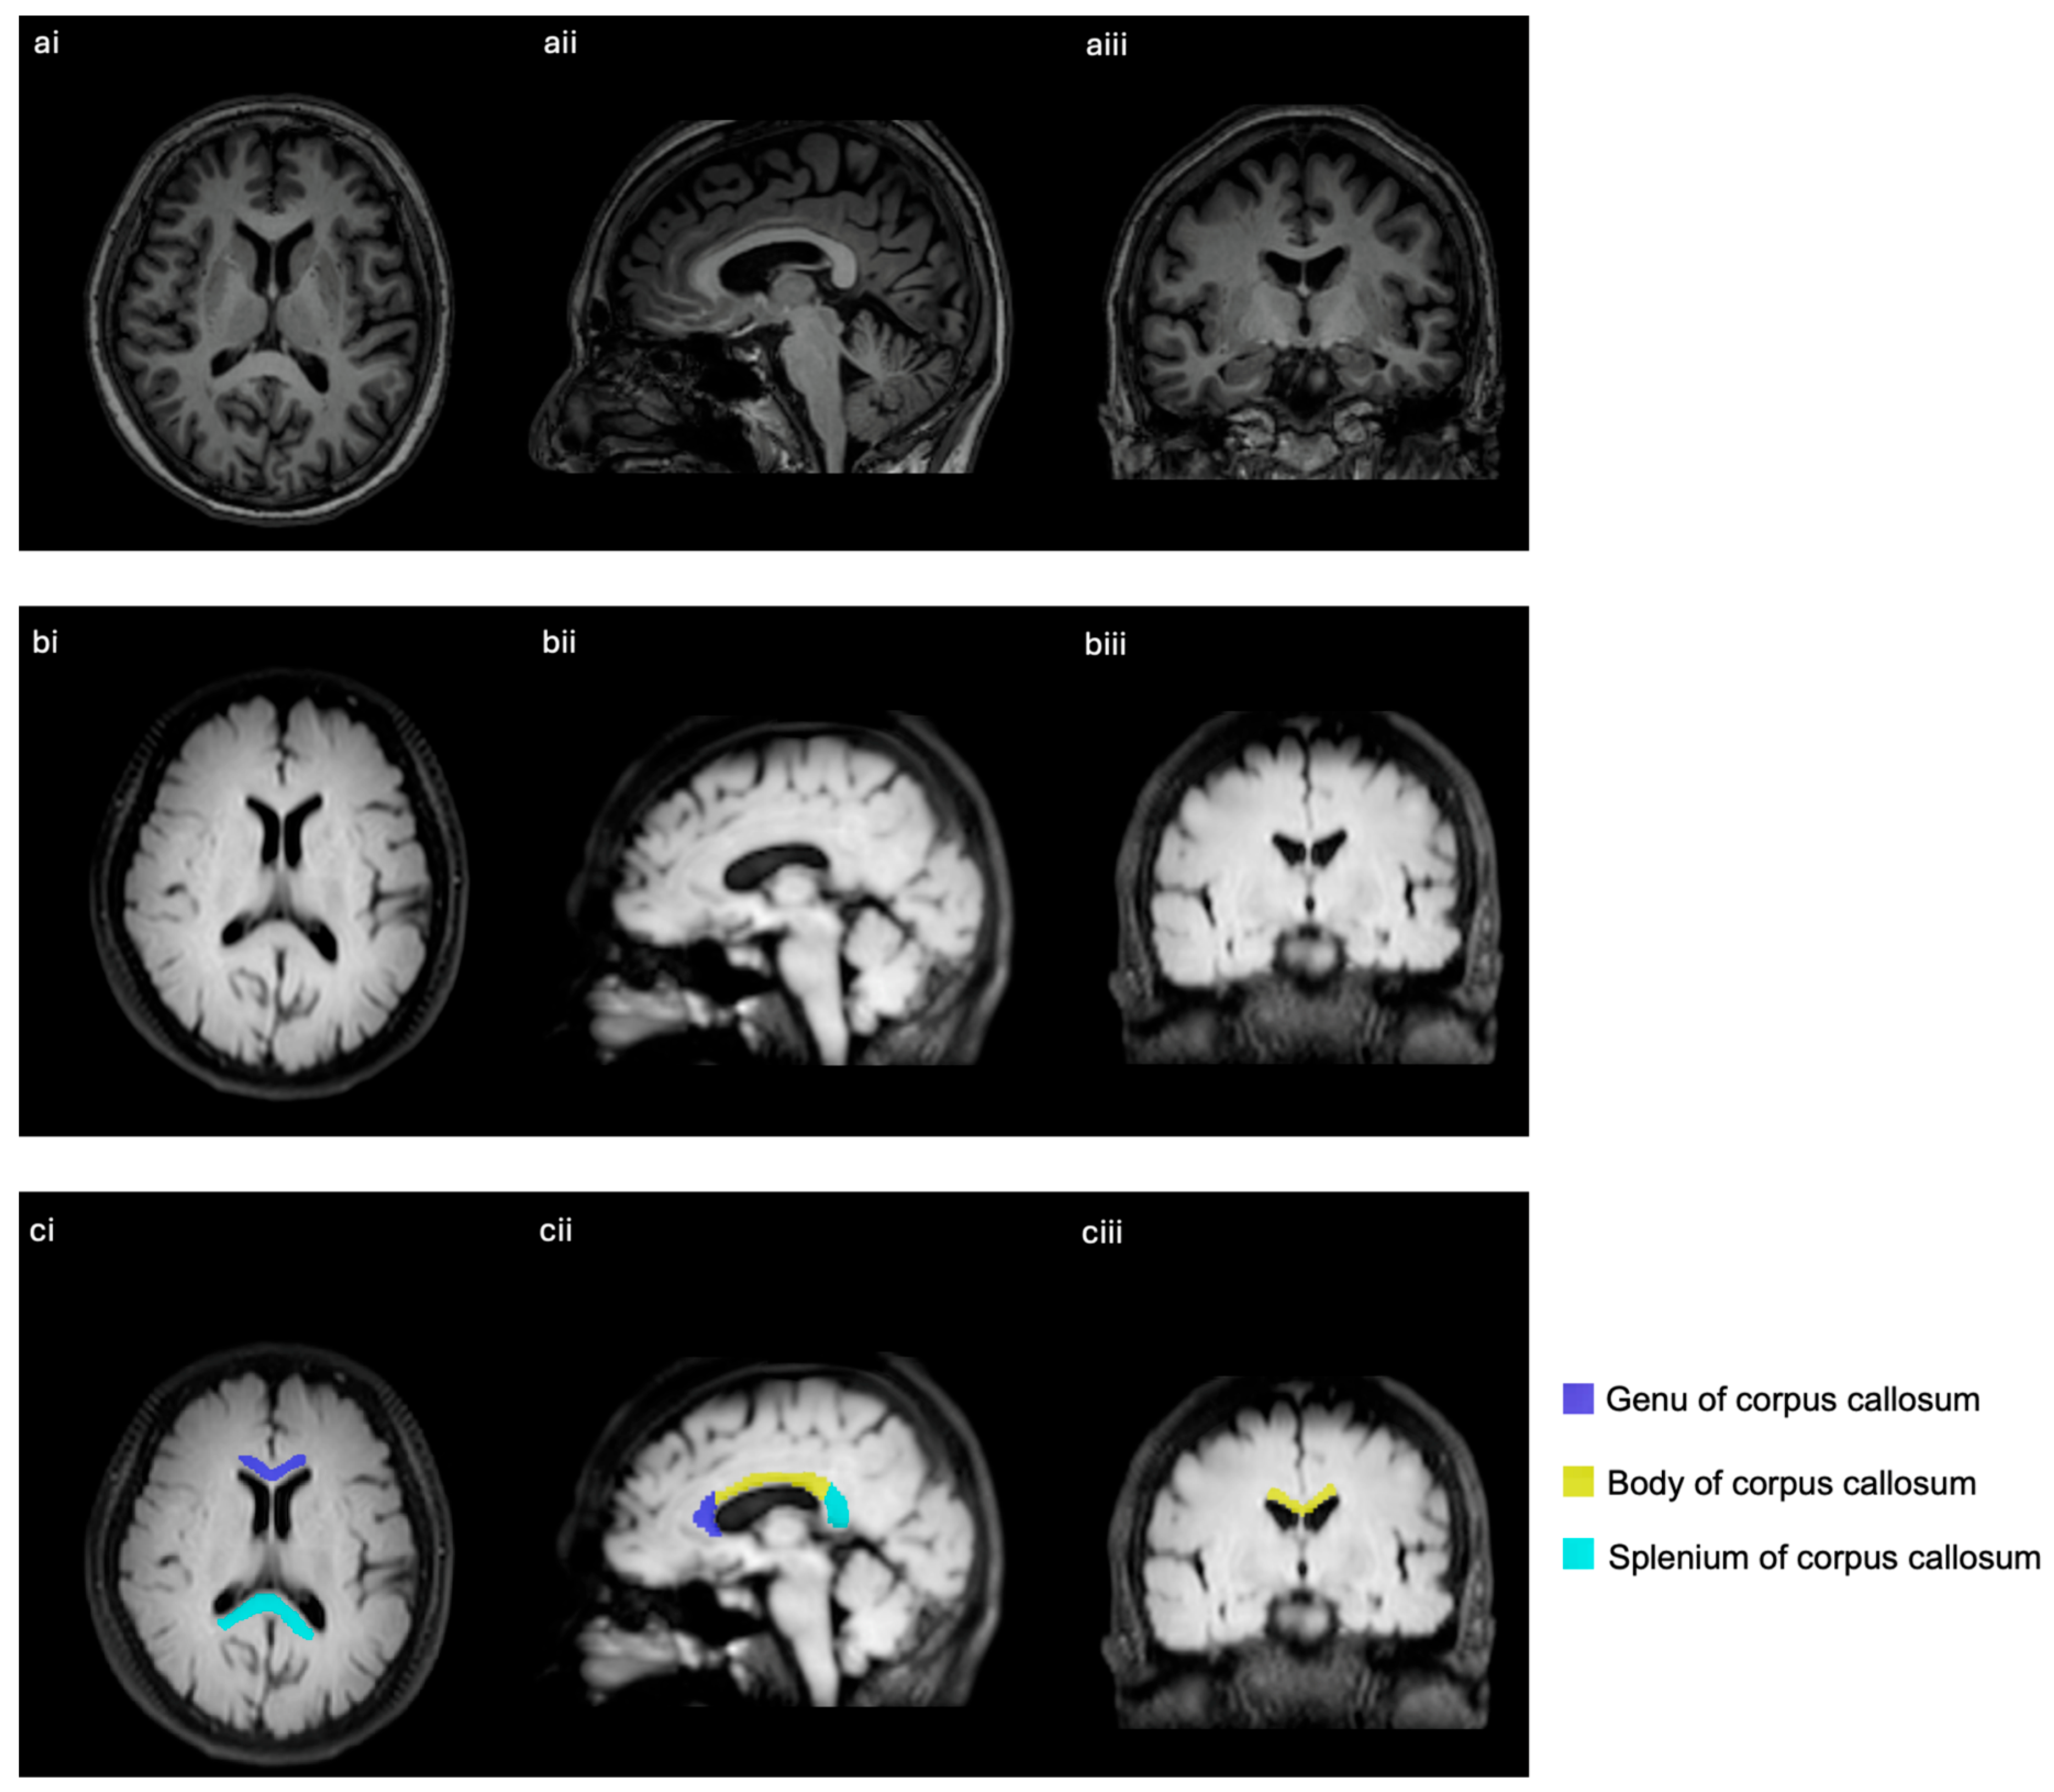
2.3. Imaging Analysis
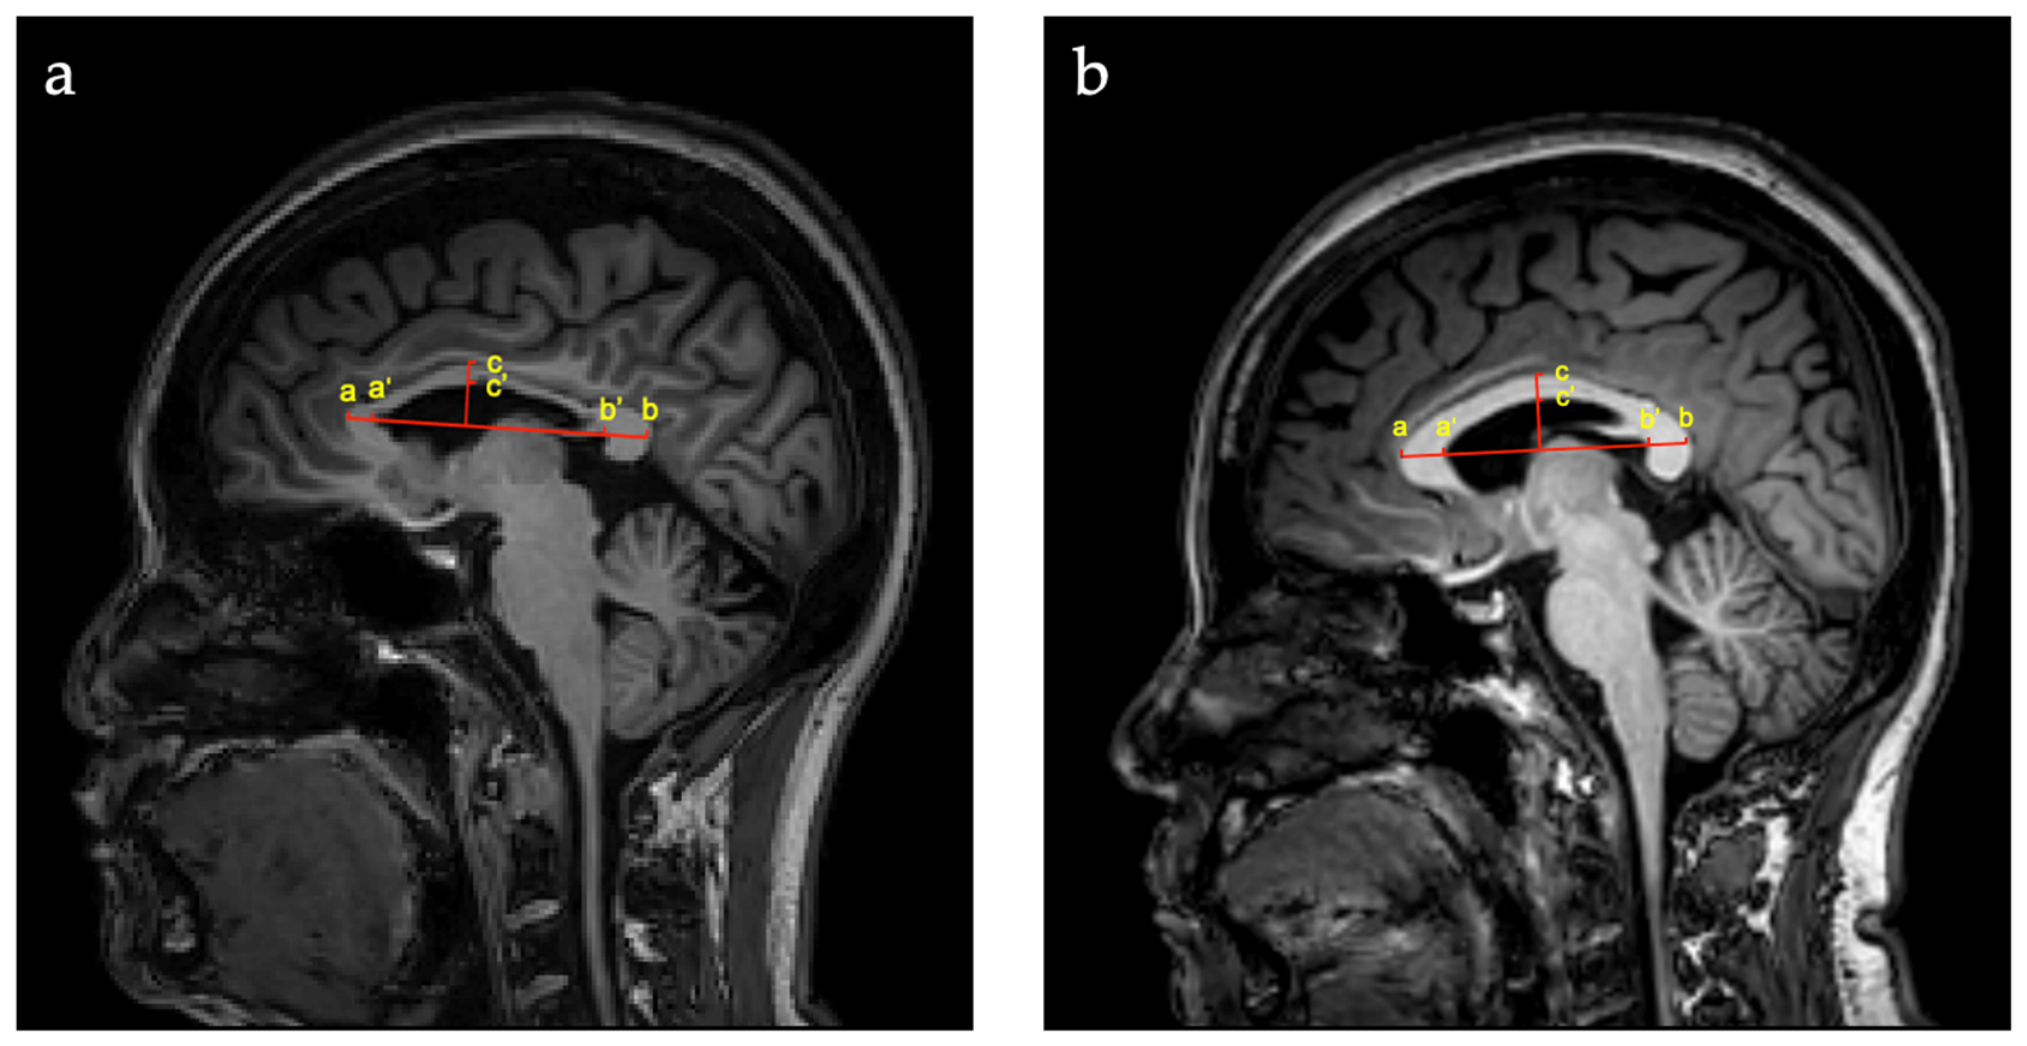
2.4. Corpus Callosum Index
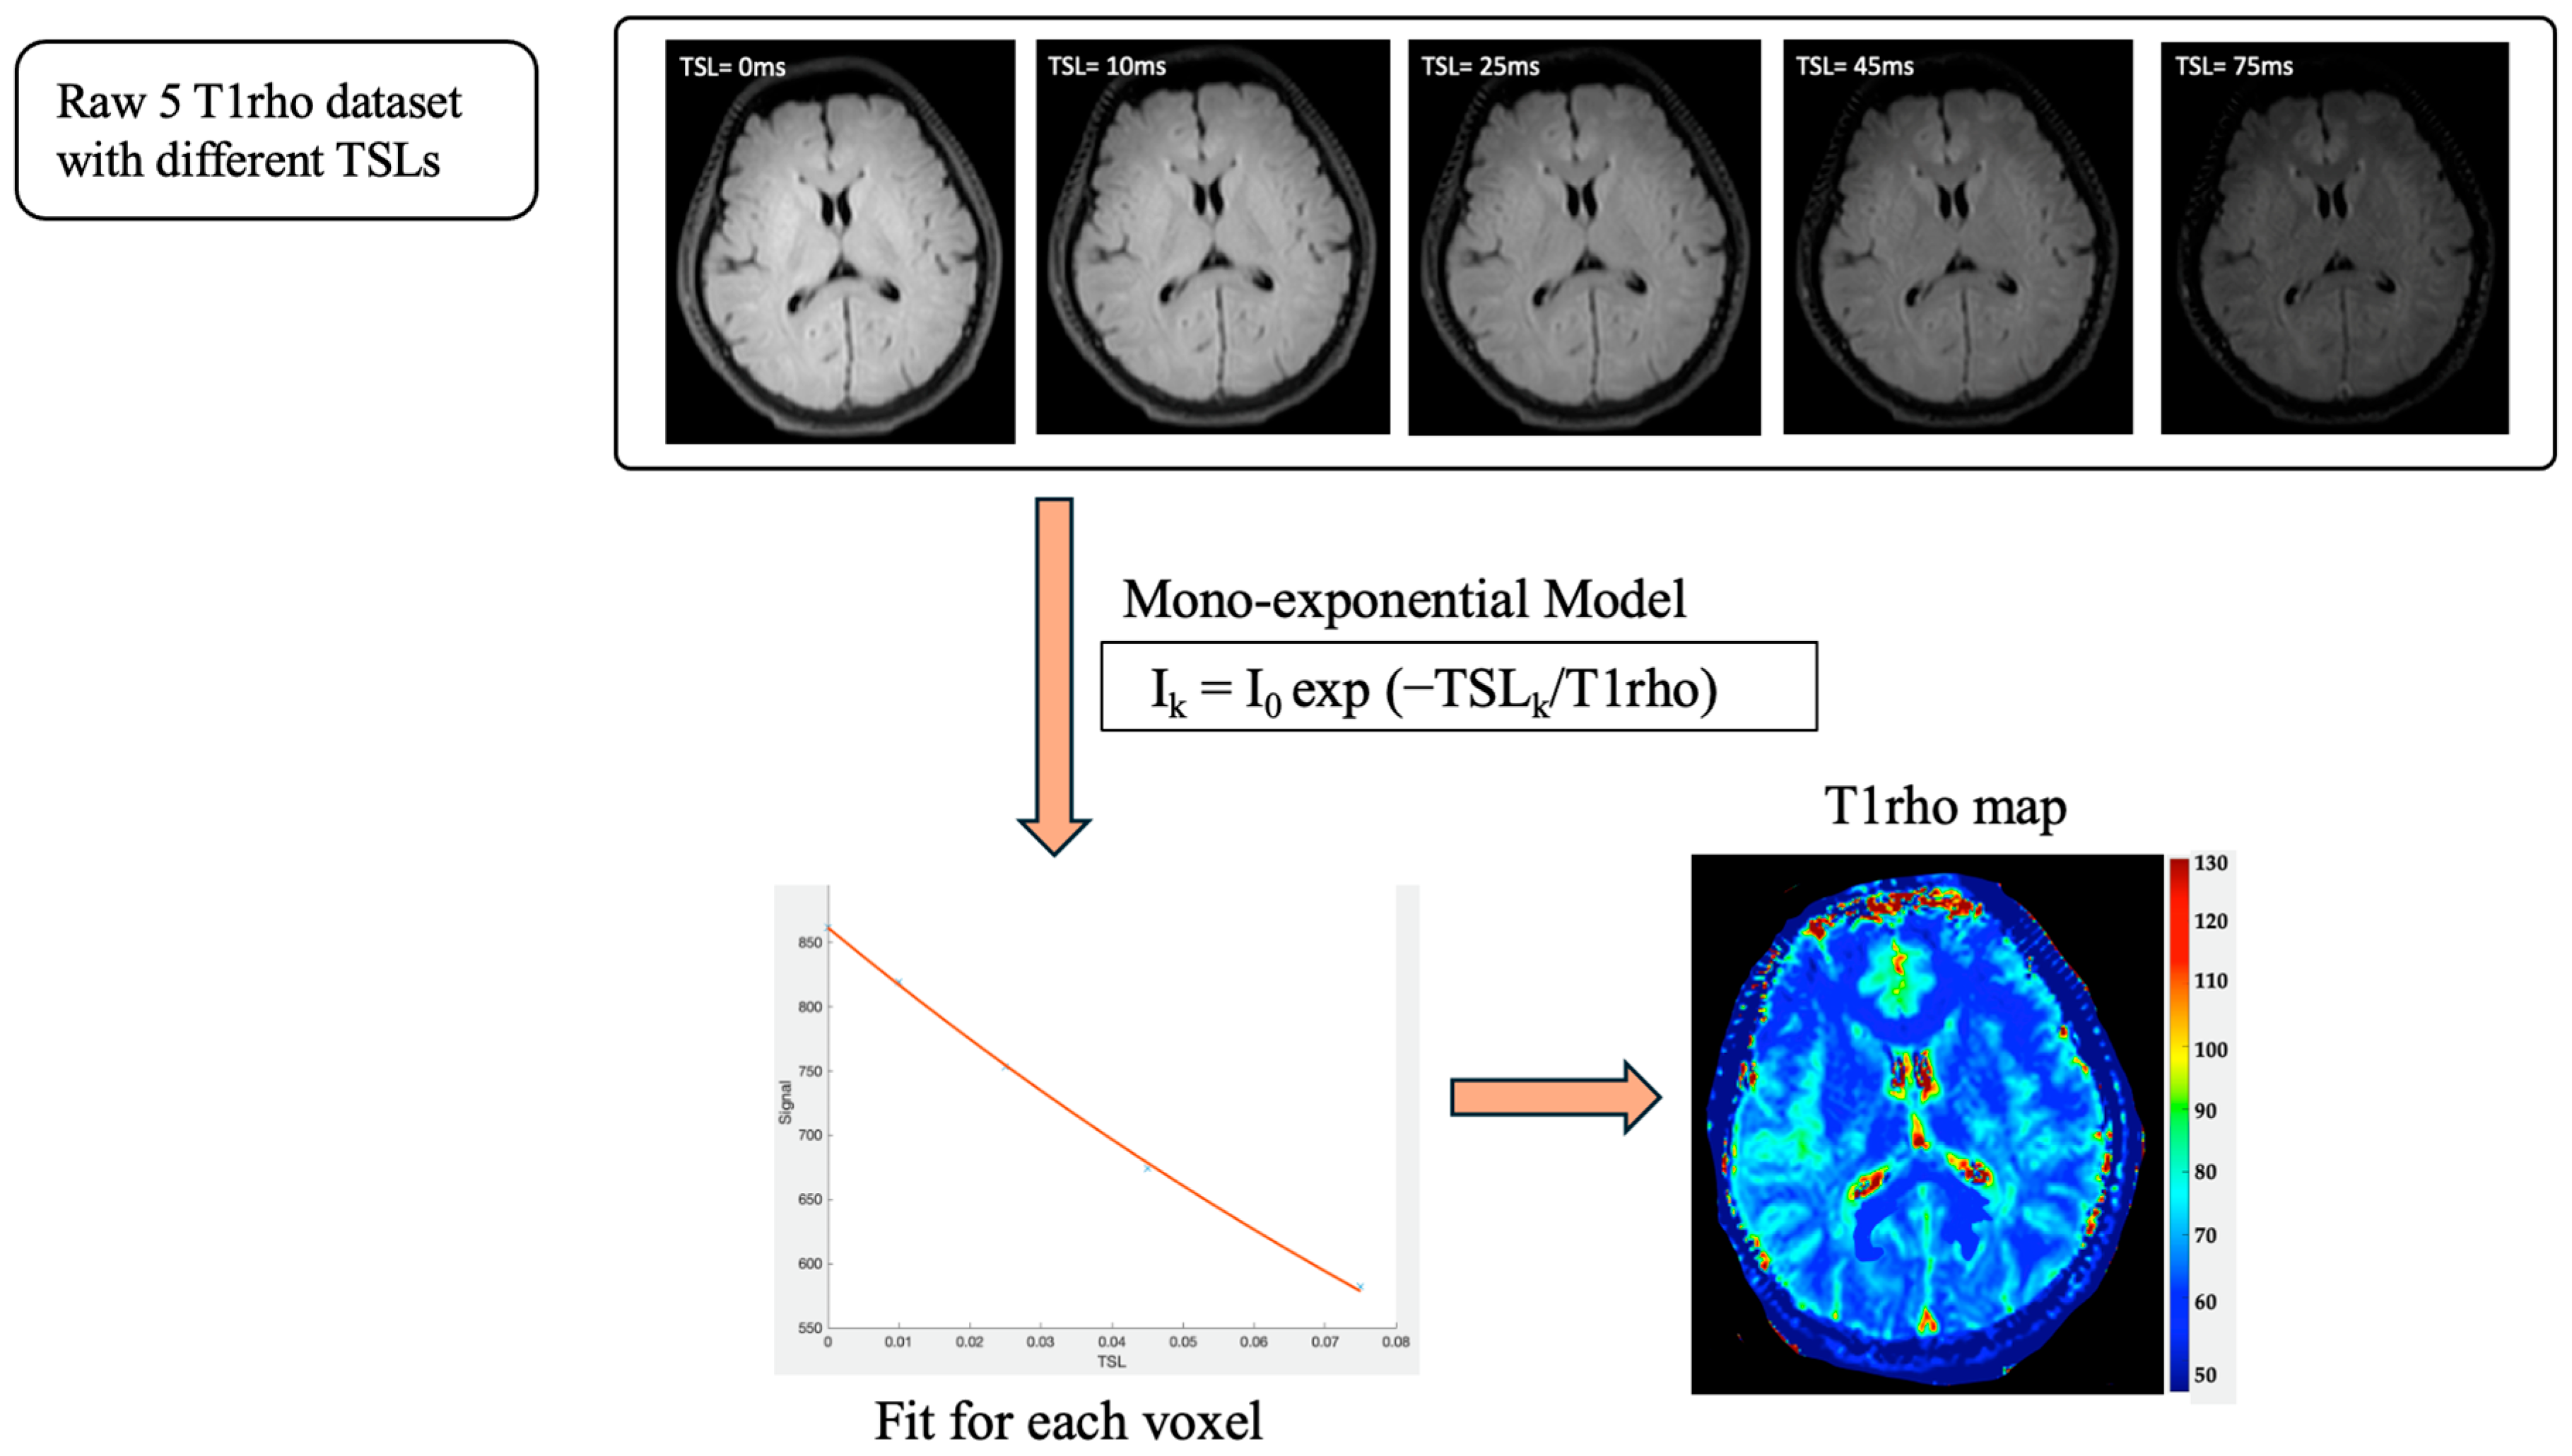
2.5. T1rho Quantification
2.6. Estimation of Total Brain White and Gray Matter Volume
2.7. Estimation of Total Lesion Load
2.8. Statistical Analysis
3. Results
4. Discussion
5. Conclusions
Author Contributions
Funding
Institutional Review Board Statement
Informed Consent Statement
Data Availability Statement
Conflicts of Interest
Abbreviations
| BET | Brain extraction tool |
| CCI | Corpus callosum index |
| CCV | Corpus callosum volume |
| CI | Confidence interval |
| DMTs | Disease modifying therapies |
| EDSS | Expanded disability status scale |
| FFE | Fast field echo |
| FSL | FMRIB software library |
| LGA | Lesion growth algorithm |
| MS | Multiple sclerosis |
| NAWM | Normal-appearing white matter |
| JHU-ICBM | Johns Hopkins University–International Consortium for Brain Mapping |
| RF | Radiofrequency |
| ROI | Region of interest |
| RRMS | Relapsing-remitting multiple sclerosis |
| SL | Spin-lock |
| SPM | Statistical parametric mapping |
| TSE | Turbo spin echo |
| TSL | Spin-lock time |
References
- Wallin, M.T.; Culpepper, W.J.; Nichols, E.; Bhutta, Z.A.; Gebrehiwot, T.T.; Hay, S.I.; Khalil, I.A.; Krohn, K.J.; Liang, X.; Naghavi, M.; et al. Global, regional, and national burden of multiple sclerosis 1990–2016: A systematic analysis for the Global Burden of Disease Study 2016. Lancet Neurol. 2019, 18, 269–285. [Google Scholar] [CrossRef]
- Lassmann, H. The contribution of neuropathology to multiple sclerosis research. Eur. J. Neurol. 2022, 29, 2869–2877. [Google Scholar] [CrossRef] [PubMed]
- Ford, H. Clinical presentation and diagnosis of multiple sclerosis. Clin. Med. 2020, 20, 380–383. [Google Scholar] [CrossRef]
- Klineova, S.; Lublin, F.D. Clinical Course of Multiple Sclerosis. Cold Spring Harb. Perspect. Med. 2018, 8, a028928. [Google Scholar] [CrossRef] [PubMed]
- Bhatt, R.R.; Gadewar, S.P.; Shetty, A.; Ba Gari, I.; Haddad, E.; Javid, S.; Ramesh, A.; Nourollahimoghadam, E.; Zhu, A.H.; de Leeuw, C.; et al. The Genetic Architecture of the Human Corpus Callosum and its Subregions. Nat. Commun. 2025, 16, 9708. [Google Scholar] [CrossRef] [PubMed]
- Platten, M.; Ouellette, R.; Herranz, E.; Barletta, V.; Treaba, C.A.; Mainero, C.; Granberg, T. Cortical and white matter lesion topology influences focal corpus callosum atrophy in multiple sclerosis. J. Neuroimaging 2022, 32, 471–479. [Google Scholar] [CrossRef] [PubMed]
- Evangelou, N.; Konz, D.; Esiri, M.M.; Smith, S.; Palace, J.; Matthews, P.M. Regional axonal loss in the corpus callosum correlates with cerebral white matter lesion volume and distribution in multiple sclerosis. Brain 2000, 123, 1845–1849. [Google Scholar] [CrossRef] [PubMed]
- Dietemann, J.L.; Beigelman, C.; Rumbach, L.; Vouge, M.; Tajahmady, T.; Faubert, C.; Jeung, M.Y.; Wackenheim, A. Multiple sclerosis and corpus callosum atrophy: Relationship of MRI findings to clinical data. Neuroradiology 1988, 30, 478–480. [Google Scholar] [CrossRef] [PubMed]
- Papathanasiou, A.; Messinis, L.; Zampakis, P.; Papathanasopoulos, P. Corpus callosum atrophy as a marker of clinically meaningful cognitive decline in secondary progressive multiple sclerosis. Impact on employment status. J. Clin. Neurosci. 2017, 43, 170–175. [Google Scholar] [CrossRef] [PubMed]
- Figueira, F.F.A.; Santos, V.S.d.; Figueira, G.M.A.; Silva, Â.C.M.d. Corpus callosum index: A practical method for long-term follow-up in multiple sclerosis. Arq. Neuro-Psiquiatr. 2007, 65, 931–935. [Google Scholar] [CrossRef]
- Sugijono, S.E.; Mulyadi, R.; Firdausia, S.; Prihartono, J.; Estiasari, R. Corpus callosum index correlates with brain volumetry and disability in multiple sclerosis patients. Neurosciences 2020, 25, 193–199. [Google Scholar] [CrossRef] [PubMed]
- Serai, S.D. Basics of magnetic resonance imaging and quantitative parameters T1, T2, T2*, T1rho and diffusion-weighted imaging. Pediatr. Radiol. 2022, 52, 217–227. [Google Scholar] [PubMed]
- Gilani, I.A.; Sepponen, R. Quantitative rotating frame relaxometry methods in MRI. NMR Biomed. 2016, 29, 841–861. [Google Scholar] [CrossRef] [PubMed]
- Jambor, I.; Steiner, A.; Pesola, M.; Liimatainen, T.; Sucksdorff, M.; Rissanen, E.; Airas, L.; Aronen, H.J.; Merisaari, H. Whole Brain Adiabatic T1rho and Relaxation Along a Fictitious Field Imaging in Healthy Volunteers and Patients With Multiple Sclerosis: Initial Findings. J. Magn. Reson. Imaging. 2021, 54, 866–879. [Google Scholar] [CrossRef] [PubMed]
- Tereshchenko, A.V.; Schultz, J.L.; Kunnath, A.J.; Bruss, J.E.; Epping, E.A.; Magnotta, V.A.; Nopoulos, P.C. Subcortical T1-Rho MRI Abnormalities in Juvenile-Onset Huntington’s Disease. Brain Sci. 2020, 10, 533. [Google Scholar] [CrossRef] [PubMed]
- Wang, L.; Chen, W.; Qian, Y.; So, T.Y. Repeatability of quantitative T1rho magnetic resonance imaging in normal brain tissues at 3.0T. Phys. Med. 2023, 112, 102641. [Google Scholar] [CrossRef] [PubMed]
- Wang, L.; So, T.Y.; Choi, J.C.H.; Lau, A.Y.L.; Yu, Z.; Yeung, D.K.W.; Abrigo, J.; King, A.D.; Wáng, Y.X.J.; Ai, Q.H.; et al. Evaluation of the perilesional normal-appearing white matter (NAWM) microenvironment in relapsing-remitting multiple sclerosis with quantitative T1rho magnetic resonance imaging. Quant. Imaging Med. Surg. 2025, 15, 9479–9491. [Google Scholar] [CrossRef] [PubMed]
- Ma, S.; Wang, N.; Fan, Z.; Kaisey, M.; Sicotte, N.L.; Christodoulou, A.G.; Li, D. Three-dimensional whole-brain simultaneous T1, T2, and T1ρ quantification using MR Multitasking: Method and initial clinical experience in tissue characterization of multiple sclerosis. Magn. Reson. Med. 2021, 85, 1938–1952. [Google Scholar] [PubMed]
- Thompson, A.J.; Banwell, B.L.; Barkhof, F.; Carroll, W.M.; Coetzee, T.; Comi, G.; Correale, J.; Fazekas, F.; Filippi, M.; Freedman, M.S.; et al. Diagnosis of multiple sclerosis: 2017 revisions of the McDonald criteria. Lancet Neurol. 2018, 17, 162–173. [Google Scholar] [CrossRef] [PubMed]
- Witschey, W.R.T.; Borthakur, A.; Elliott, M.A.; Mellon, E.; Niyogi, S.; Wallman, D.J.; Wang, C.; Reddy, R. Artifacts in T1ρ-weighted imaging: Compensation for B1 and B0 field imperfections. J. Magn. Reson. 2007, 186, 75–85. [Google Scholar] [CrossRef] [PubMed]
- Smith, S.M.; Jenkinson, M.; Woolrich, M.W.; Beckmann, C.F.; Behrens, T.E.; Johansen-Berg, H.; Bannister, P.R.; De Luca, M.; Drobnjak, I.; Flitney, D.E.; et al. Advances in functional and structural MR image analysis and implementation as FSL. Neuroimage 2004, 23, S208–S219. [Google Scholar] [CrossRef] [PubMed]
- Mori, S.; Wakana, S.; Nagae-Poetscher, L.; Van Zijl, P. MRI atlas of human white matter. Am. J. Neuroradiol. 2006, 27, 1384. [Google Scholar]
- Smith, S.M.; Zhang, Y.; Jenkinson, M.; Chen, J.; Matthews, P.M.; Federico, A.; De Stefano, N. Accurate, robust, and automated longitudinal and cross-sectional brain change analysis. Neuroimage 2002, 17, 479–489. [Google Scholar] [CrossRef] [PubMed]
- Schmidt, P.; Gaser, C.; Arsic, M.; Buck, D.; Förschler, A.; Berthele, A.; Hoshi, M.; Ilg, R.; Schmid, V.J.; Zimmer, C.; et al. An automated tool for detection of FLAIR-hyperintense white-matter lesions in Multiple Sclerosis. NeuroImage 2012, 59, 3774–3783. [Google Scholar] [CrossRef] [PubMed]
- Rissanen, E.; Tuisku, J.; Vahlberg, T.; Sucksdorff, M.; Paavilainen, T.; Parkkola, R.; Rokka, J.; Gerhard, A.; Hinz, R.; Talbot, P.S.; et al. Microglial activation, white matter tract damage, and disability in MS. Neurol. Neuroimmunol. Neuroinflamm. 2018, 5, e443. [Google Scholar] [CrossRef] [PubMed]
- Filip, P.; Svatkova, A.; Carpenter, A.F.; Eberly, L.E.; Nestrasil, I.; Nissi, M.J.; Michaeli, S.; Mangia, S. Rotating frame MRI relaxations as markers of diffuse white matter abnormalities in multiple sclerosis. NeuroImage Clin. 2020, 26, 102234. [Google Scholar] [CrossRef] [PubMed]
- Hofer, S.; Wang, X.; Roeloffs, V.; Frahm, J. Single-shot T1 mapping of the corpus callosum: A rapid characterization of fiber bundle anatomy. Front. Neuroanat. 2015, 9, 57. [Google Scholar] [CrossRef] [PubMed]
- Horowitz, A.; Barazany, D.; Tavor, I.; Bernstein, M.; Yovel, G.; Assaf, Y. In vivo correlation between axon diameter and conduction velocity in the human brain. Brain Struct. Funct. 2015, 220, 1777–1788. [Google Scholar] [PubMed]
- Aboitiz, F.; Scheibel, A.B.; Fisher, R.S.; Zaidel, E. Fiber composition of the human corpus callosum. Brain Res. 1992, 598, 143–153. [Google Scholar] [CrossRef] [PubMed]
- Boutitah-Benyaich, I.; Eixarch, H.; Villacieros-Álvarez, J.; Hervera, A.; Cobo-Calvo, Á.; Montalban, X.; Espejo, C. Multiple sclerosis: Molecular pathogenesis and therapeutic intervention. Signal Transduct. Target. Ther. 2025, 10, 324. [Google Scholar] [CrossRef] [PubMed]
- Gonçalves, L.I.; dos Passos, G.R.; Conzatti, L.P.; Burger, J.L.P.; Tomasi, G.H.; Zandoná, M.É.; Azambuja, L.S.; Gomes, I.; Franco, A.; Sato, D.K.; et al. Correlation between the corpus callosum index and brain atrophy, lesion load, and cognitive dysfunction in multiple sclerosis. Mult. Scler. Relat. Disord. 2018, 20, 154–158. [Google Scholar] [CrossRef] [PubMed]
- Fujimori, J.; Uryu, K.; Fujihara, K.; Wattjes, M.P.; Suzuki, C.; Nakashima, I. Measurements of the corpus callosum index and fractional anisotropy of the corpus callosum and their cutoff values are useful to assess global brain volume loss in multiple sclerosis. Mult. Scler. Relat. Disord. 2020, 45, 102388. [Google Scholar] [CrossRef] [PubMed]
- Van Munster, C.E.; Uitdehaag, B.M. Outcome measures in clinical trials for multiple sclerosis. CNS Drugs 2017, 31, 217–236. [Google Scholar] [CrossRef] [PubMed]
- Van Munster, C.E.P.; Jessica, B.; Steinheimer, S.; Kamm, C.P.; D’Souza, M.; Diederich, M.; Dorn, J.; Walsh, L.; Dahlke, F.; Kappos, L.; et al. Assessment of Multiple Aspects of Upper Extremity Function Independent From Ambulation in Patients With Multiple Sclerosis. Int. J. MS Care 2023, 25, 226–232. [Google Scholar] [CrossRef] [PubMed]
- Saccà, F.; Costabile, T.; Carotenuto, A.; Lanzillo, R.; Moccia, M.; Pane, C.; Russo, C.V.; Barbarulo, A.M.; Casertano, S.; Rossi, F.; et al. The EDSS integration with the Brief International Cognitive Assessment for Multiple Sclerosis and orientation tests. Mult. Scler. J. 2017, 23, 1289–1296. [Google Scholar]
- Fogarty, E.; Schmitz, S.; Tubridy, N.; Walsh, C.; Barry, M. Comparative efficacy of disease-modifying therapies for patients with relapsing remitting multiple sclerosis: Systematic review and network meta-analysis. Mult. Scler. Relat. Disord. 2016, 9, 23–30. [Google Scholar] [CrossRef] [PubMed]
- Robertson, D.; Moreo, N. Disease-Modifying Therapies in Multiple Sclerosis: Overview and Treatment Considerations. Fed. Pr. 2016, 33, 28–34. [Google Scholar]
- Claflin, S.B.; Broadley, S.; Taylor, B.V. The effect of disease modifying therapies on disability progression in multiple sclerosis: A systematic overview of meta-analyses. Front. Neurol. 2019, 9, 1150. [Google Scholar] [CrossRef] [PubMed]
- Bross, M.; Hackett, M.; Bernitsas, E. Approved and Emerging Disease Modifying Therapies on Neurodegeneration in Multiple Sclerosis. Int. J. Mol. Sci. 2020, 21, 4312. [Google Scholar] [CrossRef] [PubMed]



| | Patients (n = 30) | Controls (n = 30) | p-Value |
|---|---|---|---|
| Age, years (Mean ± SD) | 37.93 ± 8.23 | 37.73 ± 9.92 | 0.68 |
| Gender | 24 females, 6 males | 18 females, 12 males | 0.23 |
| EDSS score (Mean ± SD) | 1.68 ± 1.89 | N/A | N/A |
| Disease duration, years (Mean ± SD) | 9.79 ± 7.74 | N/A | N/A |
| CCI (Mean ± SD) | 0.35 ± 0.08 | 0.42 ± 0.04 | <0.01 * |
| Lesion load, mL (Mean ± SD) | 8.89 ± 9.60 | N/A | N/A |
| Total gray matter volume, mL (Mean ± SD) | 754.18 ± 32.33 | 742.04 ± 35.43 | 0.06 |
| Total white matter volume, mL (Mean ± SD) | 683.42 ± 39.97 | 733.43 ± 27.87 | <0.01 * |
| Whole brain volume, mL (Mean ± SD) | 1437.59 ± 60.17 | 1475.47 ± 42.12 | <0.01 * |
| | Patients (n = 30) | Controls (n = 30) | p-Value | Cohen’s d |
|---|---|---|---|---|
| T1rho value (ms) | ||||
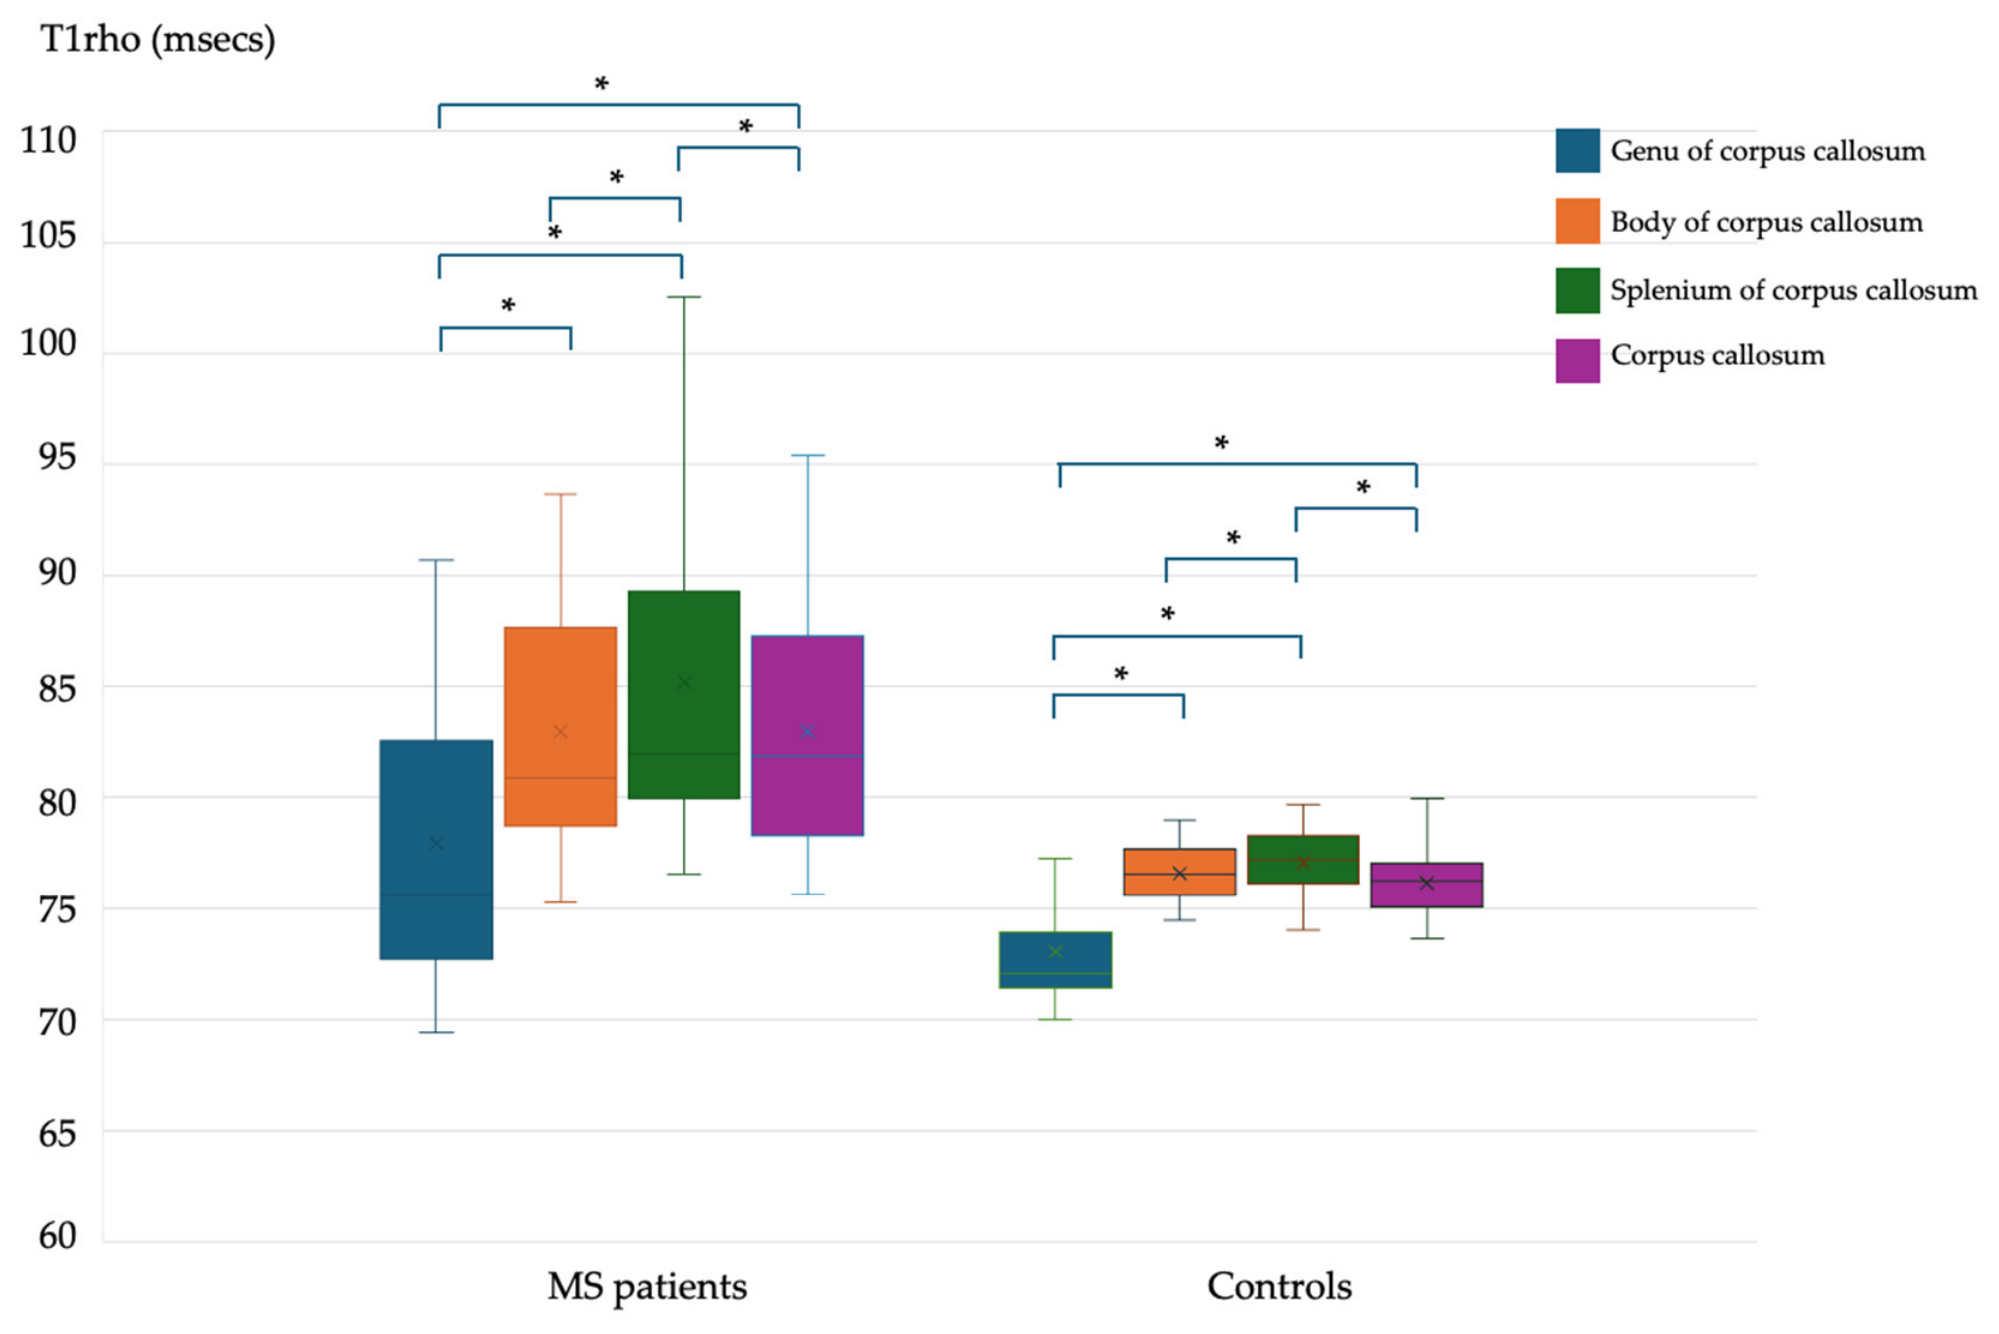
| Genu of corpus callosum | 77.95 ± 6.72 | 73.03 ± 3.11 | <0.01 * | 0.94 |
| Body of corpus callosum | 82.97 ± 5.27 | 76.57 ± 1.24 | <0.01 * | 1.68 |
| Splenium of corpus callosum | 85.17 ± 7.96 | 77.07 ± 1.50 | <0.01 * | 1.41 |
| Whole corpus callosum | 82.97 ± 5.53 | 76.16 ± 1.48 | <0.01 * | 1.68 |
| Age (Years) | EDSS Score | Disease Duration Time (Years) | Lesion Load (mL) | Corpus Callosum Index (CCI) | Total Gray Matter Volume (mL) | Total White Matter Volume (mL) | Whole Brain Volume (mL) | |||||||||
|---|---|---|---|---|---|---|---|---|---|---|---|---|---|---|---|---|
| Correlation Coefficient 95% CI) | p-Value | Correlation Coefficient (95% CI) | p-Value | Correlation Coefficient (95% CI) | p-Value | Correlation Coefficient (95% CI) | p-Value | Correlation Coefficient (95% CI) | p-Value | Correlation Coefficient (95% CI) | p-Value | Correlation Coefficient (95% CI) | p-Value | Correlation Coefficient (95% CI) | p-Value | |
| T1rho Value (ms) | ||||||||||||||||
| Genu of corpus callosum | 0.177 (−0.196–0.505) | 0.350 | 0.249 (−0.122–0.559) | 0.184 | 0.276 (−0.094–0.578) | 0.140 | 0.728 (0.499–0.862) | <0.001 * | −0.727 (−0.861– −0.497) | <0.001 * | 0.313 (0.054–0.605) | 0.093 | −0.350 (−0.631–0.012) | 0.058 | −0.040 (−0.394–0.325) | 0.835 |
| Body of corpus callosum | 0.140 (−0.232–0.476) | 0.461 | 0.009 (−0.353–0.368) | 0.964 | 0.392 (0.037–0.659) | 0.032 * | 0.781 (0.585–0.890) | <0.001 * | −0.640 (−0.813– −0.363) | <0.001 * | 0.341 (−0.022–0.625) | 0.065 | −0.464 (−0.706– −0.124) | 0.010 * | −0.134 (−0.471–0.238) | 0.481 |
| Splenium of corpus callosum | 0.122 (−0.250–0.462) | 0.522 | −0.041 (−0.395–0.324) | 0.830 | 0.375 (0.017–0.648) | 0.041 * | 0.726 (0.496–0.861) | <0.001 * | −0.644 (−0.815– −0.370) | <0.001 * | 0.358 (−0.002–0.636) | 0.052 | −0.246 (−0.557– 0.125) | 0.190 | 0.051 (−0.315–0.404) | 0.789 |
| Whole corpus callosum | 0.169 (−0.204–0.499) | 0.372 | 0.068 (−0.300–0.418) | 0.722 | 0.408 (0.056–0.670) | 0.025 * | 0.810 (0.634–0.906) | <0.001 * | −0.731 (−0.864– −0.504) | <0.001 * | 0.366 (0.006–0.641) | 0.047 * | −0.399 (−0.664–−0.046) | 0.029 * | −0.069 (−0.419–0.299) | 0.718 |
| EDSS Score | Disease Duration Time (Years) | Lesion Load (mL) | Corpus Callosum Index (CCI) | Total White Matter Volume (mL) | Total Gray Matter Volume (mL) | Whole Brain Volume (mL) | ||||||||
|---|---|---|---|---|---|---|---|---|---|---|---|---|---|---|
| Correlation Coefficient (95% CI) | p-Value | Correlation Coefficient (95% CI) | p-Value | Correlation Coefficient (95% CI) | p-Value | Correlation Coefficient (95% CI) | p-Value | Correlation Coefficient (95% CI) | p-Value | Correlation Coefficient (95% CI) | p-Value | Correlation Coefficient (95% CI) | p-Value | |
| EDSS score | – | – | – | – | – | – | – | – | – | – | – | – | – | – |
| Disease duration time (years) | 0.365 (0.005–0.641) | 0.048 * | – | – | – | – | – | – | – | – | – | – | – | – |
| Lesion load (mL) | 0.183 (0.189–0.510) | 0.332 | 0.308 (−0.059–0.601) | 0.098 | – | – | – | – | – | – | – | – | – | – |
| Corpus callosum index (CCI) | −0.186 (−0.512–0.187) | 0.326 | −0.421 (−0.616–−0.036) | 0.021 * | −0.739 (−0.868- −0.517) | <0.001 * | – | – | – | – | – | – | – | – |
| Total white matter volume (mL) | −0.348 (−0.630–0.014) | 0.059 | −0.336 (−0.486–−0.220) | 0.070 | −0.541 (−0.754– −0.224) | 0.002 * | 0.487 (0.153–0.721) | 0.006 * | – | – | – | – | – | – |
| Total gray matter volume (mL) | −0.211 (−0.531–0.161) | 0.262 | −0.152 (−0.578–0.095) | 0.421 | 0.192 (−0.180–0.517) | 0.308 | −0.203 (−0.525–0.170) | 0.282 | 0.086 (−0.286–0.433) | 0.651 | – | – | – | – |
| Whole brain volume (mL) | −0.304 (−0.598–0.064) | 0.103 | −0.239 (−0.552–0.133) | 0.204 | −0.271 (−0.575–0.099) | 0.148 | 0.205 (−0.167–0.527) | 0.276 | 0.778 (0.580–0.889) | <0.001 * | 0.636 (0.357–0.810) | <0.001 * | – | – |
Disclaimer/Publisher’s Note: The statements, opinions and data contained in all publications are solely those of the individual author(s) and contributor(s) and not of MDPI and/or the editor(s). MDPI and/or the editor(s) disclaim responsibility for any injury to people or property resulting from any ideas, methods, instructions or products referred to in the content. |
© 2026 by the authors. Licensee MDPI, Basel, Switzerland. This article is an open access article distributed under the terms and conditions of the Creative Commons Attribution (CC BY) license.
Share and Cite
Wang, L.; So, T.Y.; Yu, Z.; Chen, W.; Choi, J.C.H.; Ai, Q.H.; Chan, Q.; Lau, A.Y.L. Elevated Corpus Callosum T1rho Reflects Disease Burden and Structural Atrophy in Multiple Sclerosis. Diagnostics 2026, 16, 2368. https://doi.org/10.3390/diagnostics16152368
Wang L, So TY, Yu Z, Chen W, Choi JCH, Ai QH, Chan Q, Lau AYL. Elevated Corpus Callosum T1rho Reflects Disease Burden and Structural Atrophy in Multiple Sclerosis. Diagnostics. 2026; 16(15):2368. https://doi.org/10.3390/diagnostics16152368
Chicago/Turabian StyleWang, Lei, Tiffany Y. So, Ziqiang Yu, Weitian Chen, Joseph C. H. Choi, Qiyong H. Ai, Queenie Chan, and Alexander Y. L. Lau. 2026. "Elevated Corpus Callosum T1rho Reflects Disease Burden and Structural Atrophy in Multiple Sclerosis" Diagnostics 16, no. 15: 2368. https://doi.org/10.3390/diagnostics16152368
APA StyleWang, L., So, T. Y., Yu, Z., Chen, W., Choi, J. C. H., Ai, Q. H., Chan, Q., & Lau, A. Y. L. (2026). Elevated Corpus Callosum T1rho Reflects Disease Burden and Structural Atrophy in Multiple Sclerosis. Diagnostics, 16(15), 2368. https://doi.org/10.3390/diagnostics16152368