Author Contributions
Conceptualization, M.R. and K.N.; methodology, M.R. and K.N.; software, M.R.; validation, K.N., G.V.B. and I.S.M.; formal analysis, K.N. and G.V.B.; investigation, I.S.M., G.V.B. and V.G.; resources, M.R.; data curation, M.R.; writing—original draft preparation, M.R.; writing—review and editing, M.R., K.N., G.V.B., I.S.M. and V.G.; visualization, M.R.; supervision, K.N.; project administration, K.N.; funding acquisition, K.N., G.V.B. and I.S.M. All authors have read and agreed to the published version of the manuscript.
Figure 1.
The overall process of the GlioSurvQNet for the classification and survival prediction using DuelContextAttn DQN with Metaheuristic Feature Selection.
Figure 1.
The overall process of the GlioSurvQNet for the classification and survival prediction using DuelContextAttn DQN with Metaheuristic Feature Selection.
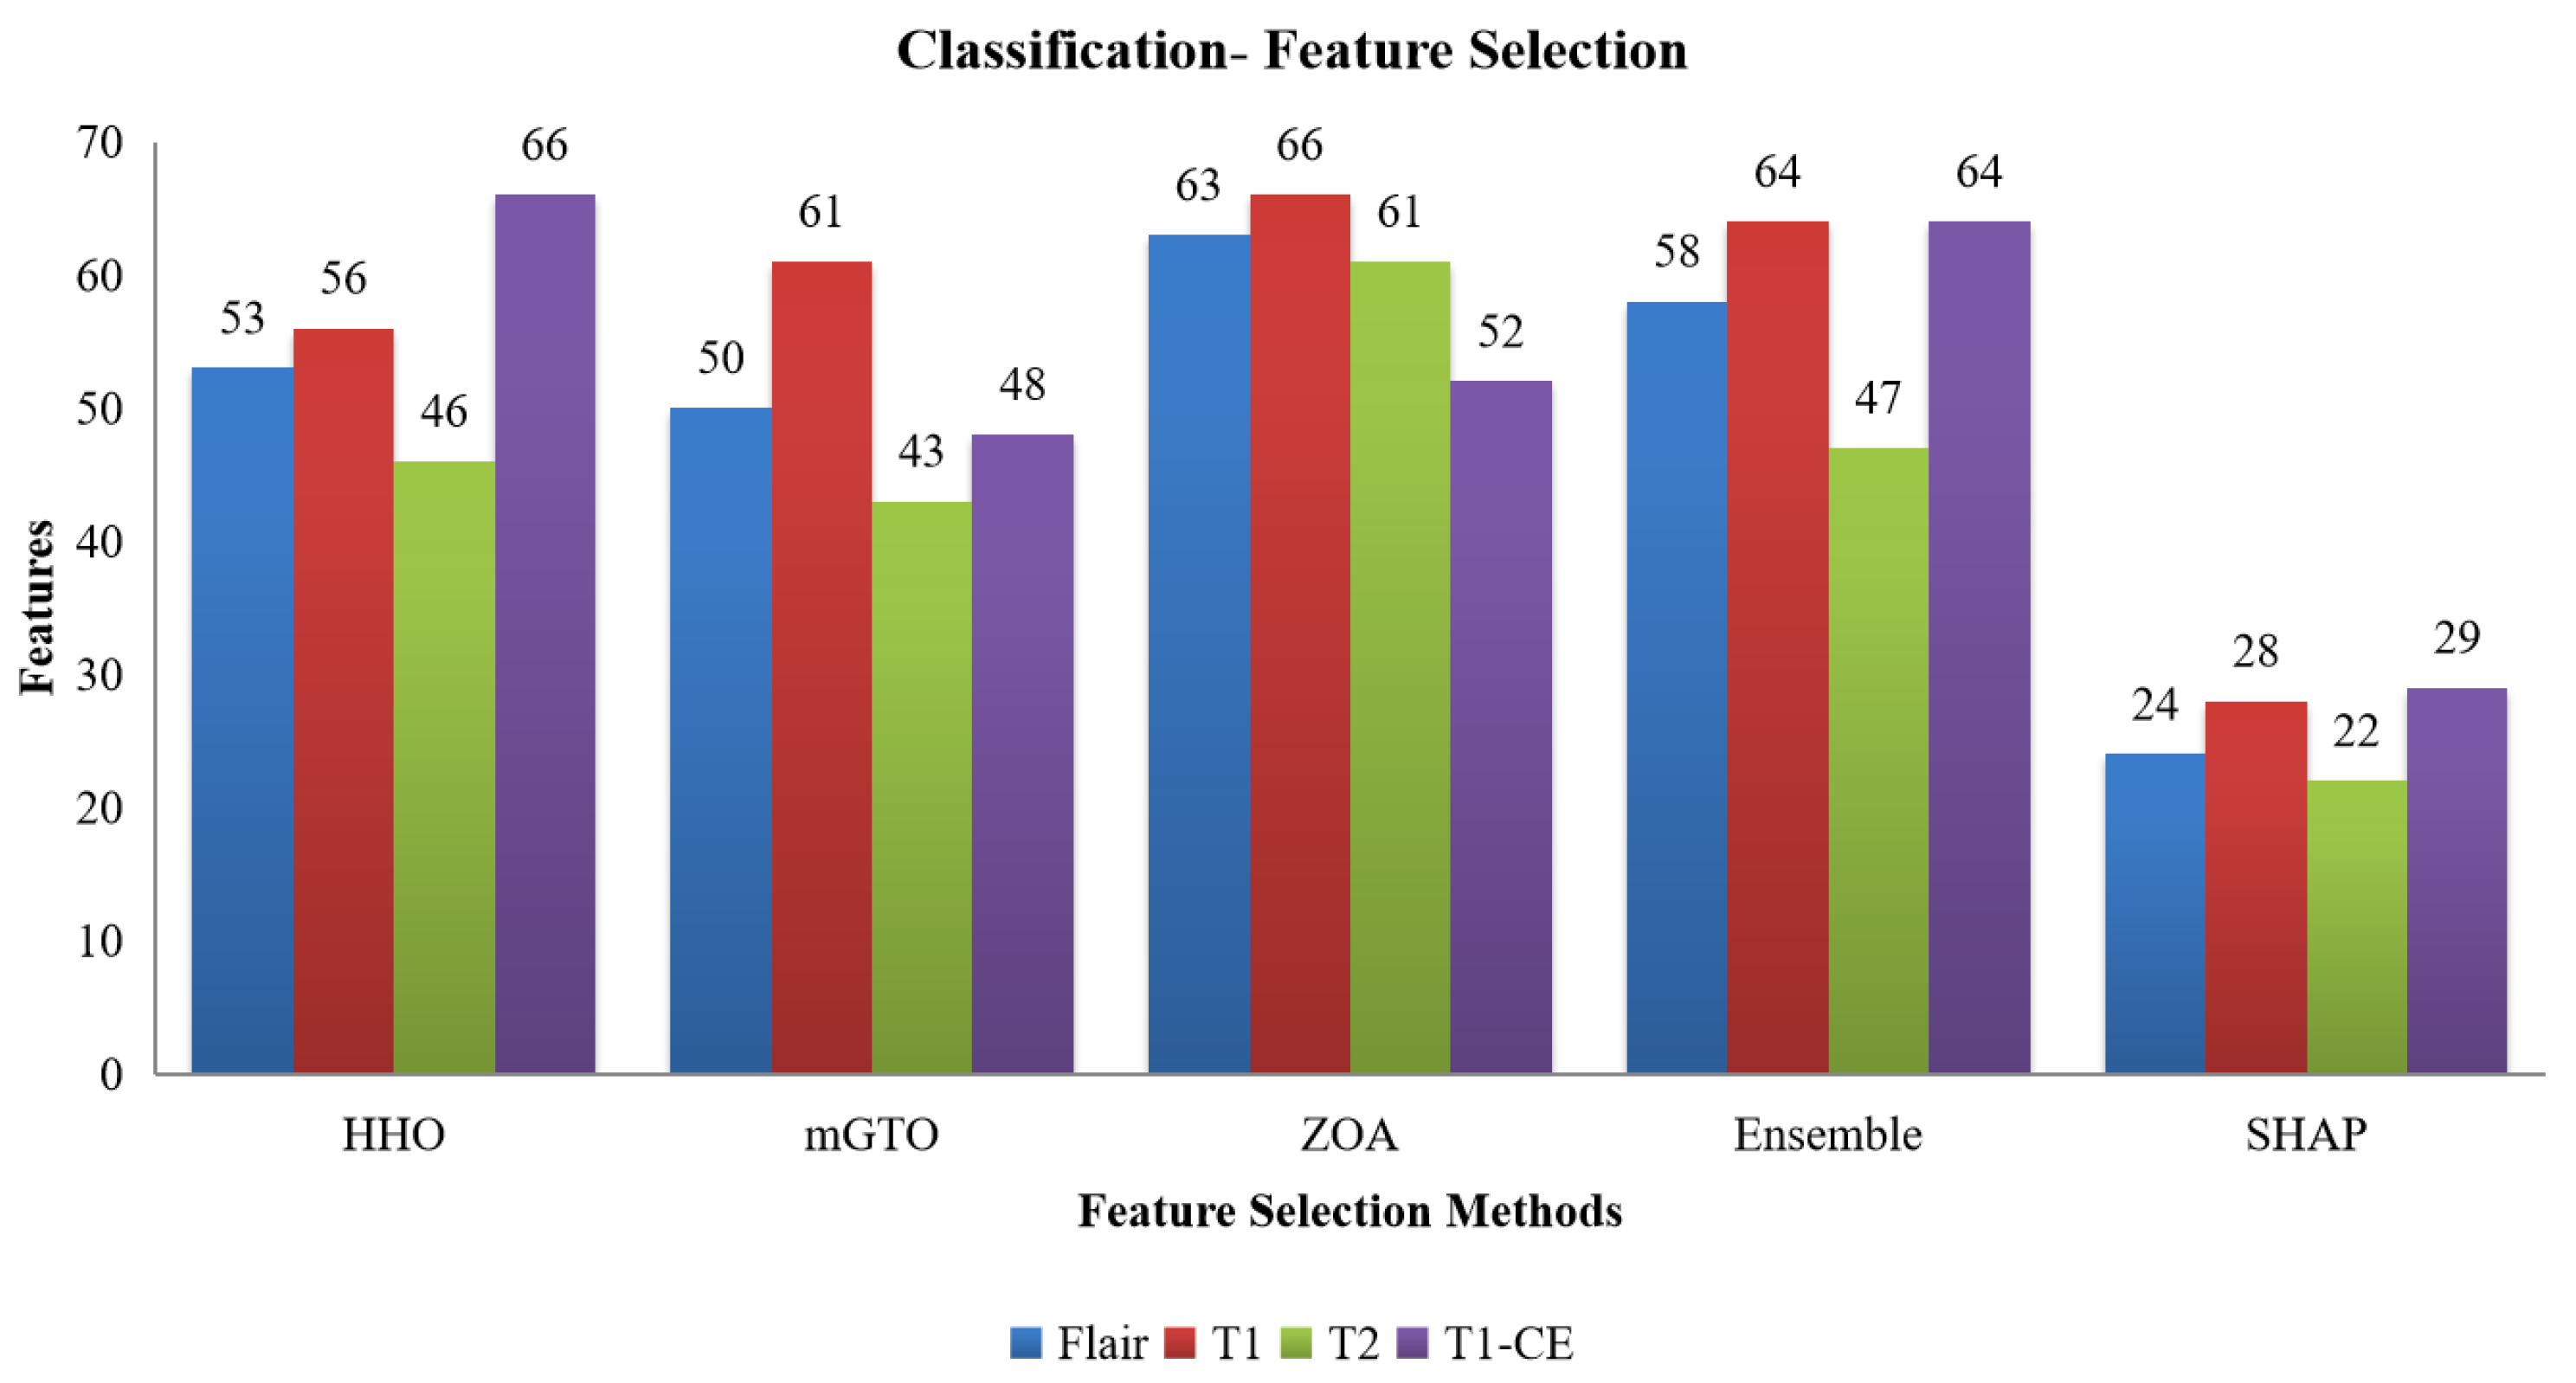
Figure 2.
Number of features selected from the HHO, mGTO, ZOA, Ensemble Metaheuristic Optimization Algorithm, and SHAP for each modality used in Classification.
Figure 2.
Number of features selected from the HHO, mGTO, ZOA, Ensemble Metaheuristic Optimization Algorithm, and SHAP for each modality used in Classification.
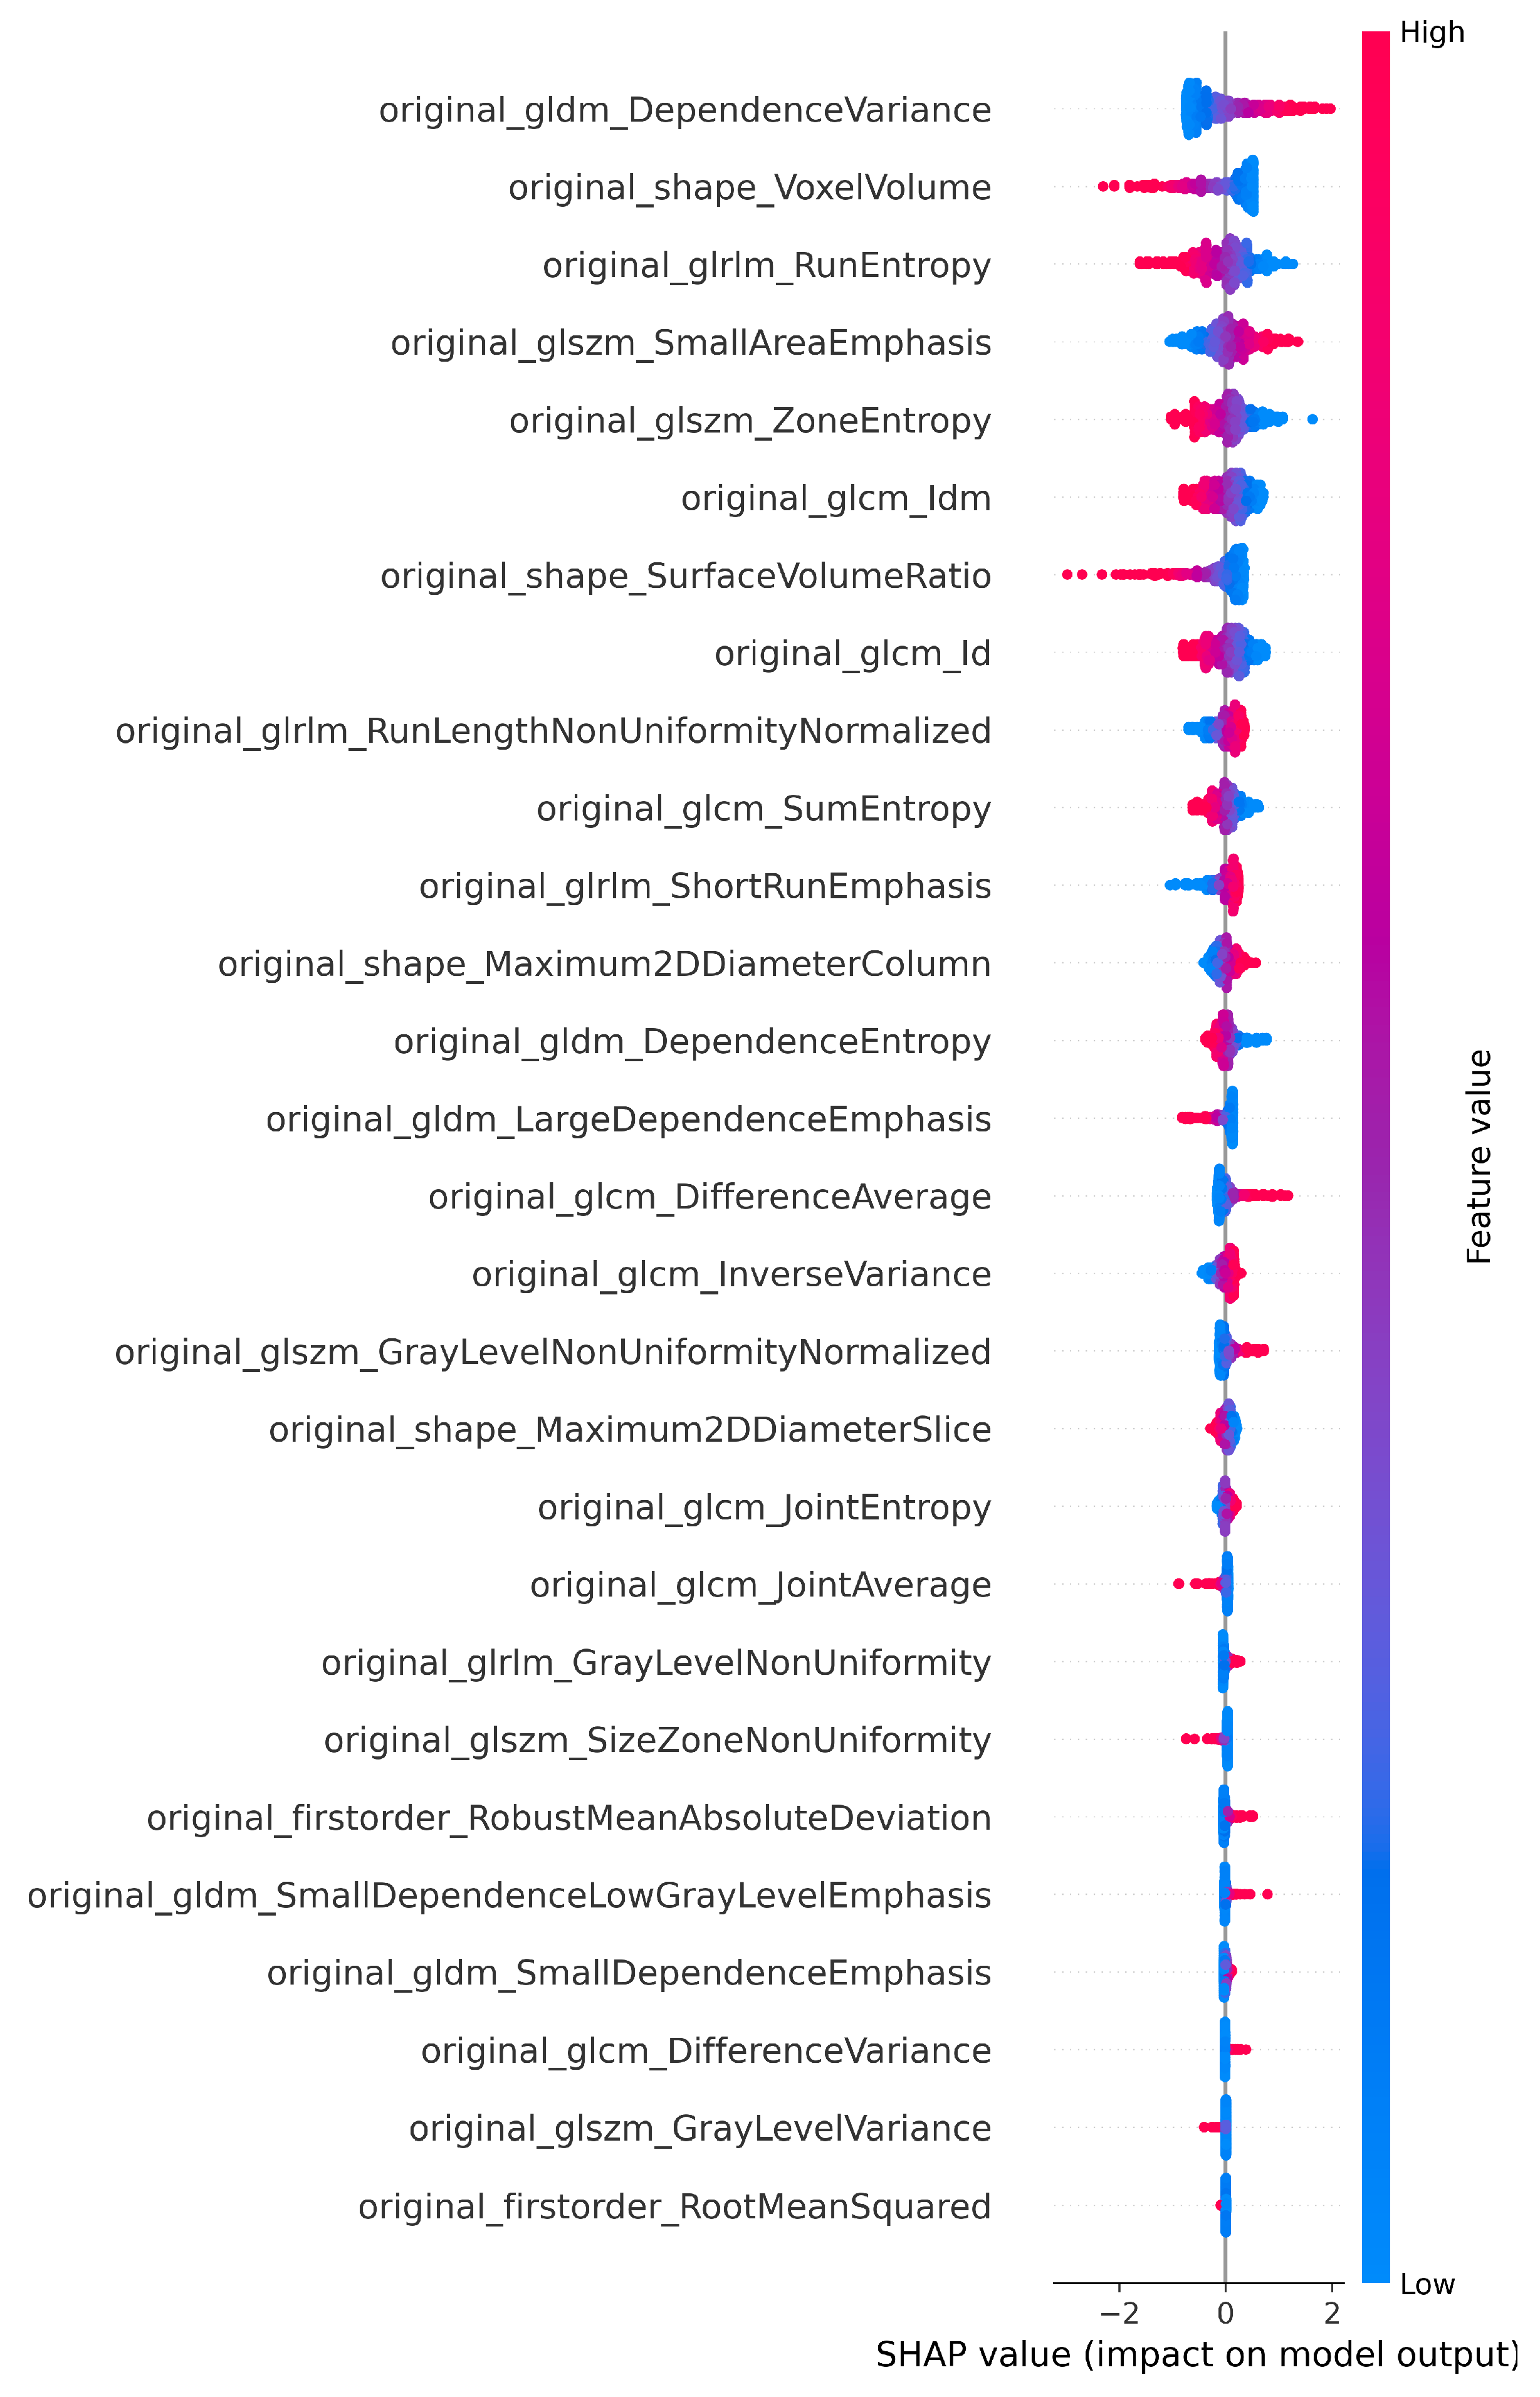
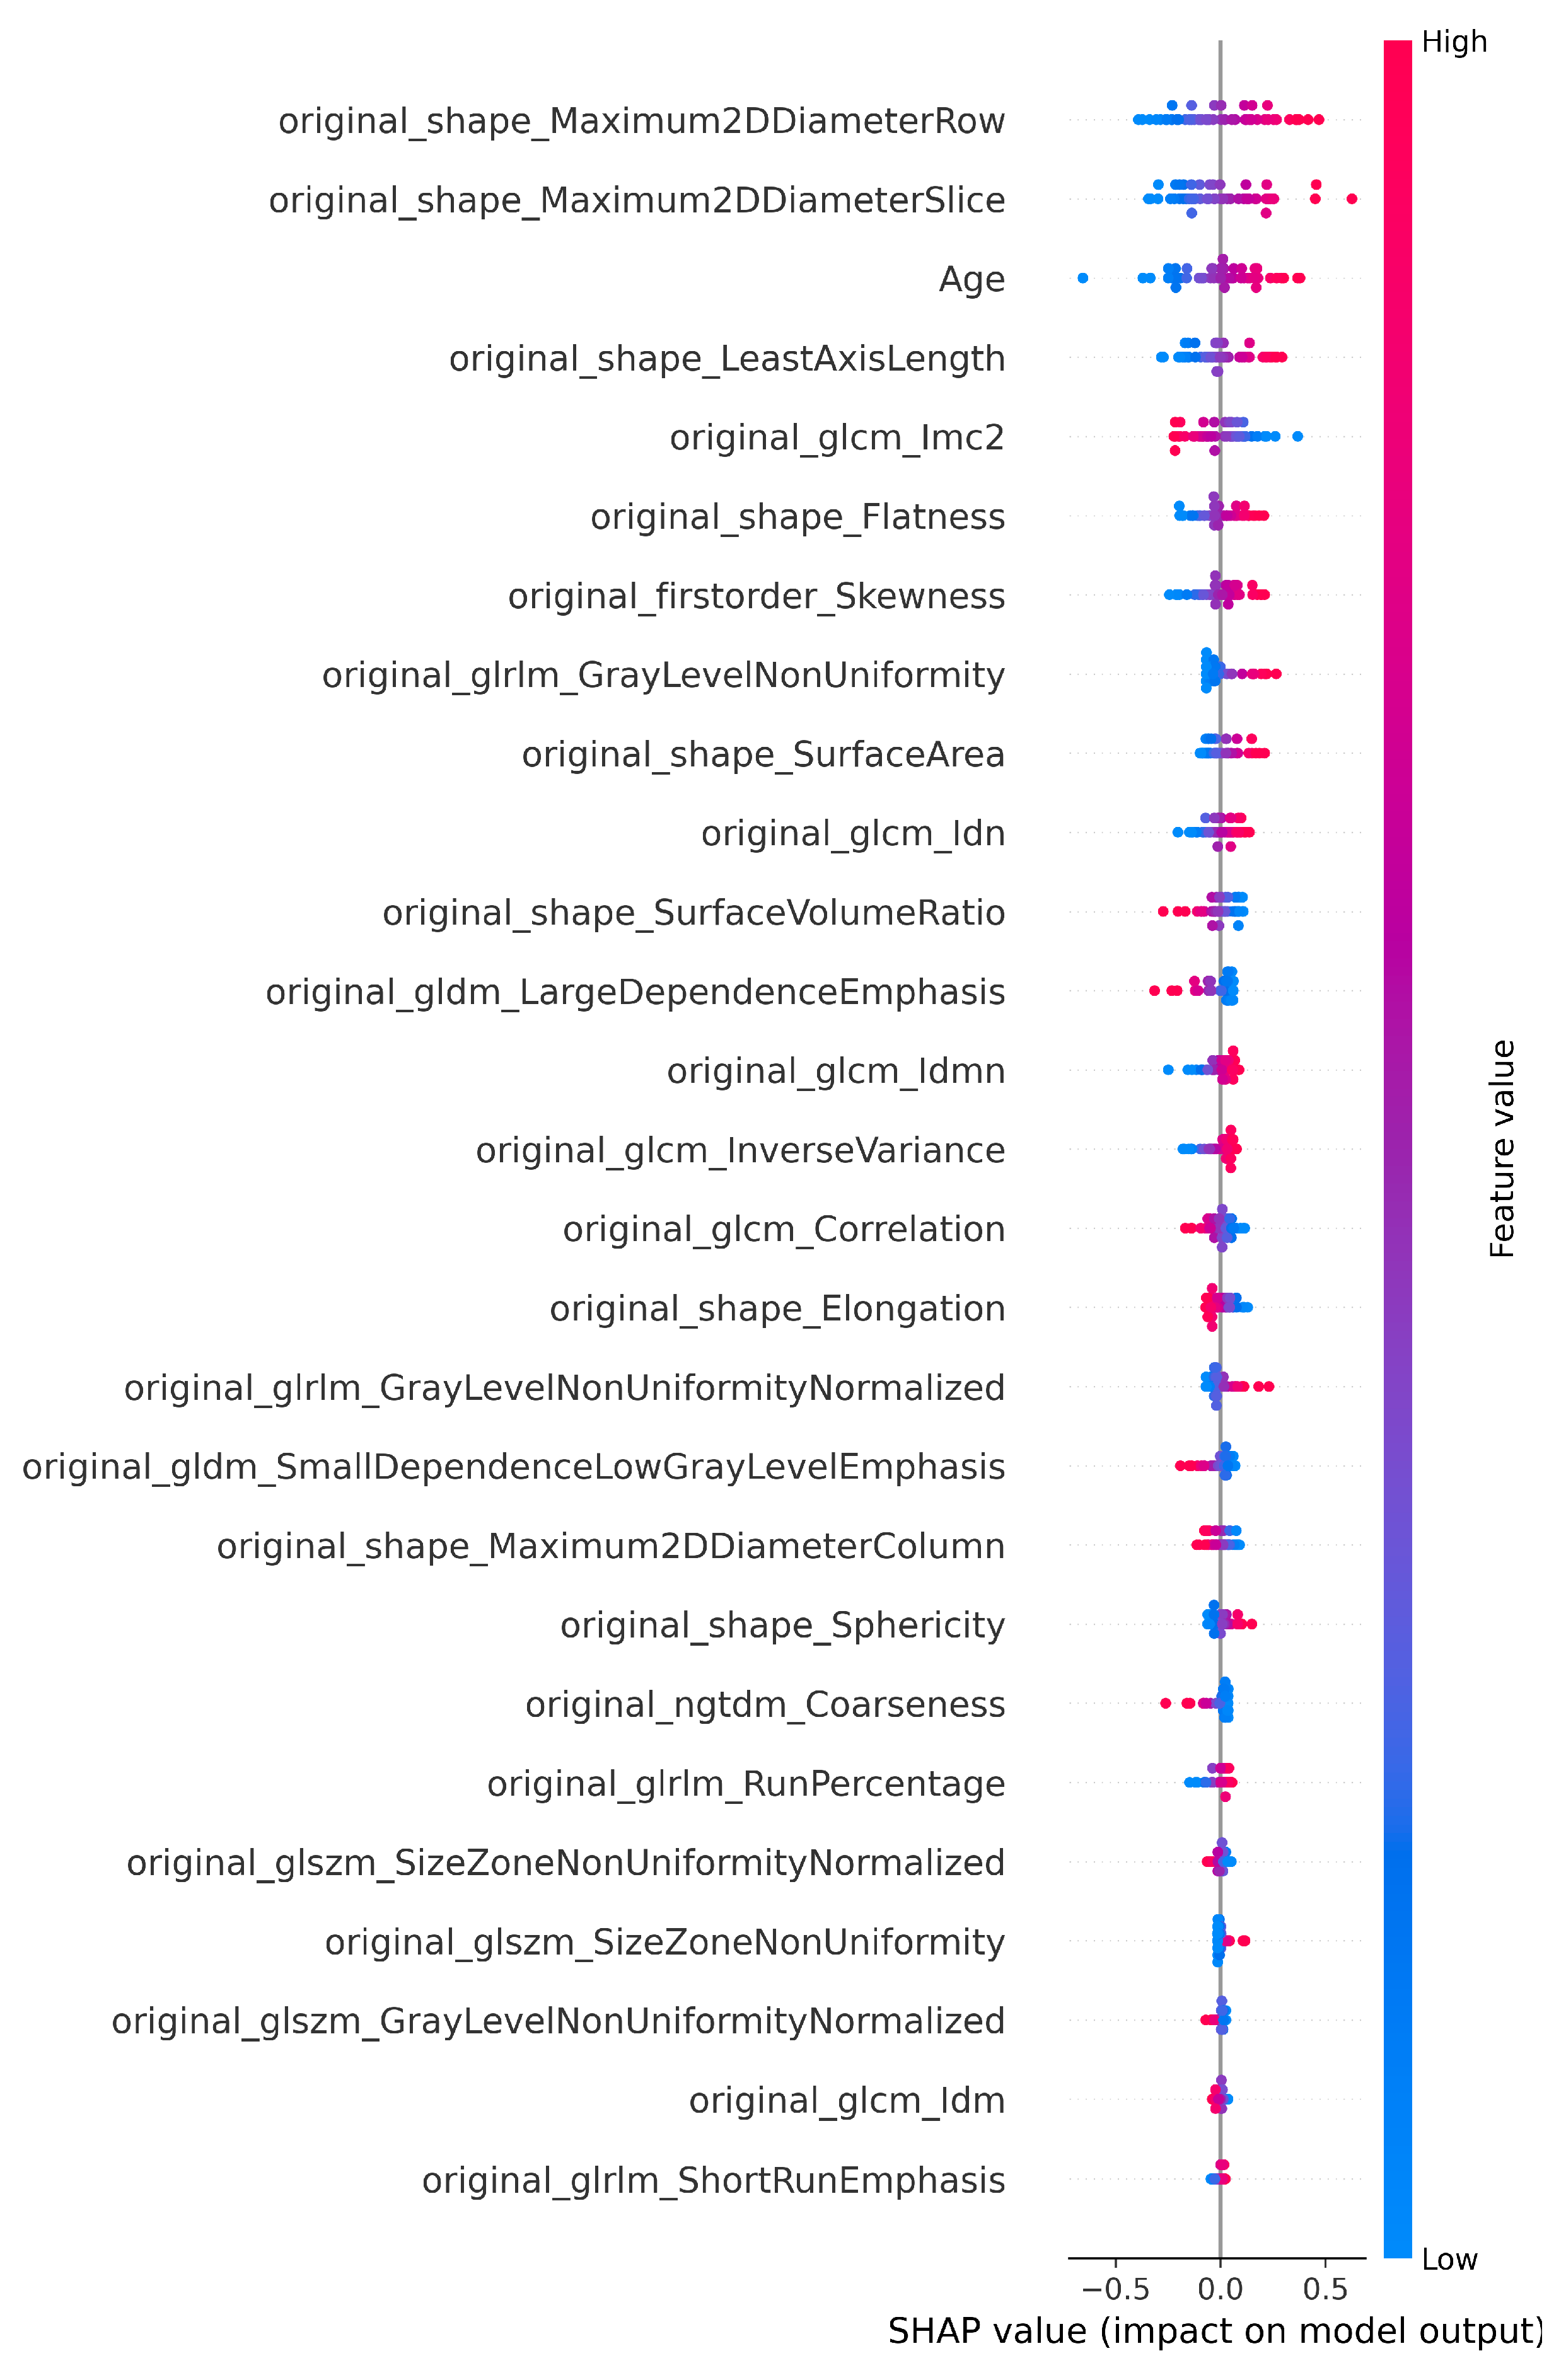
Figure 3.
SHAP plot showing the selected features of T1 for the classification.
Figure 3.
SHAP plot showing the selected features of T1 for the classification.
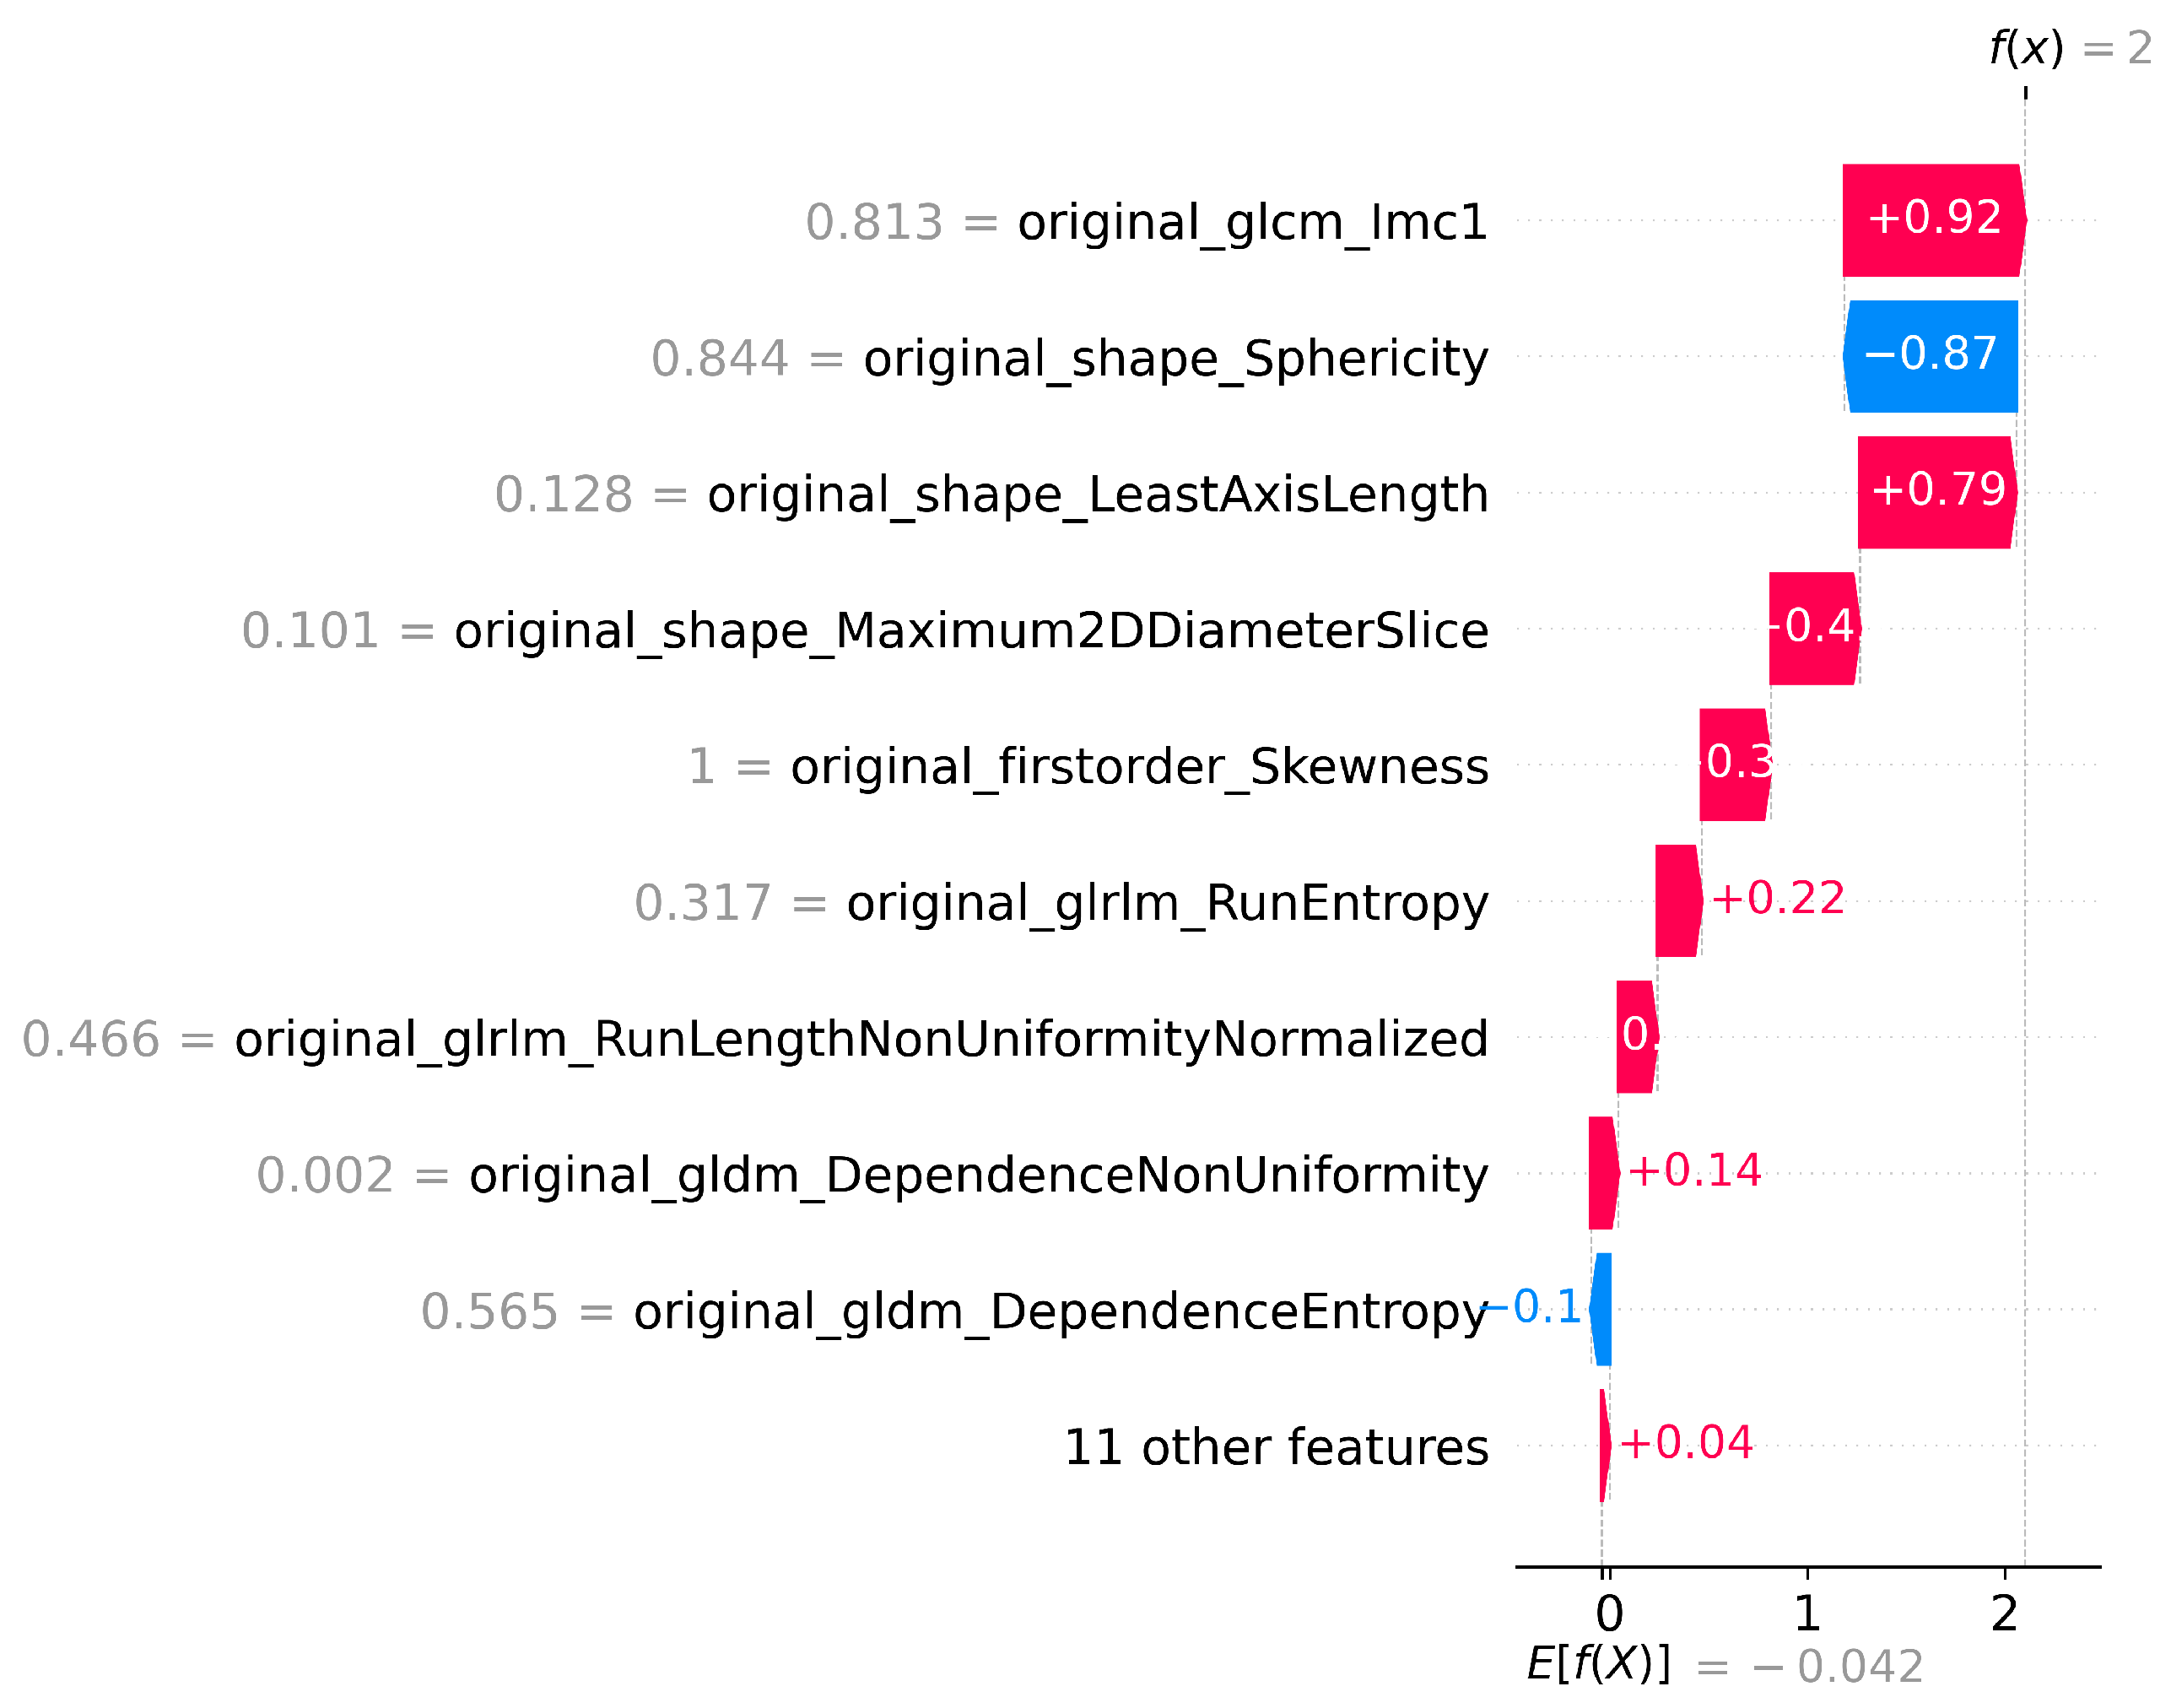
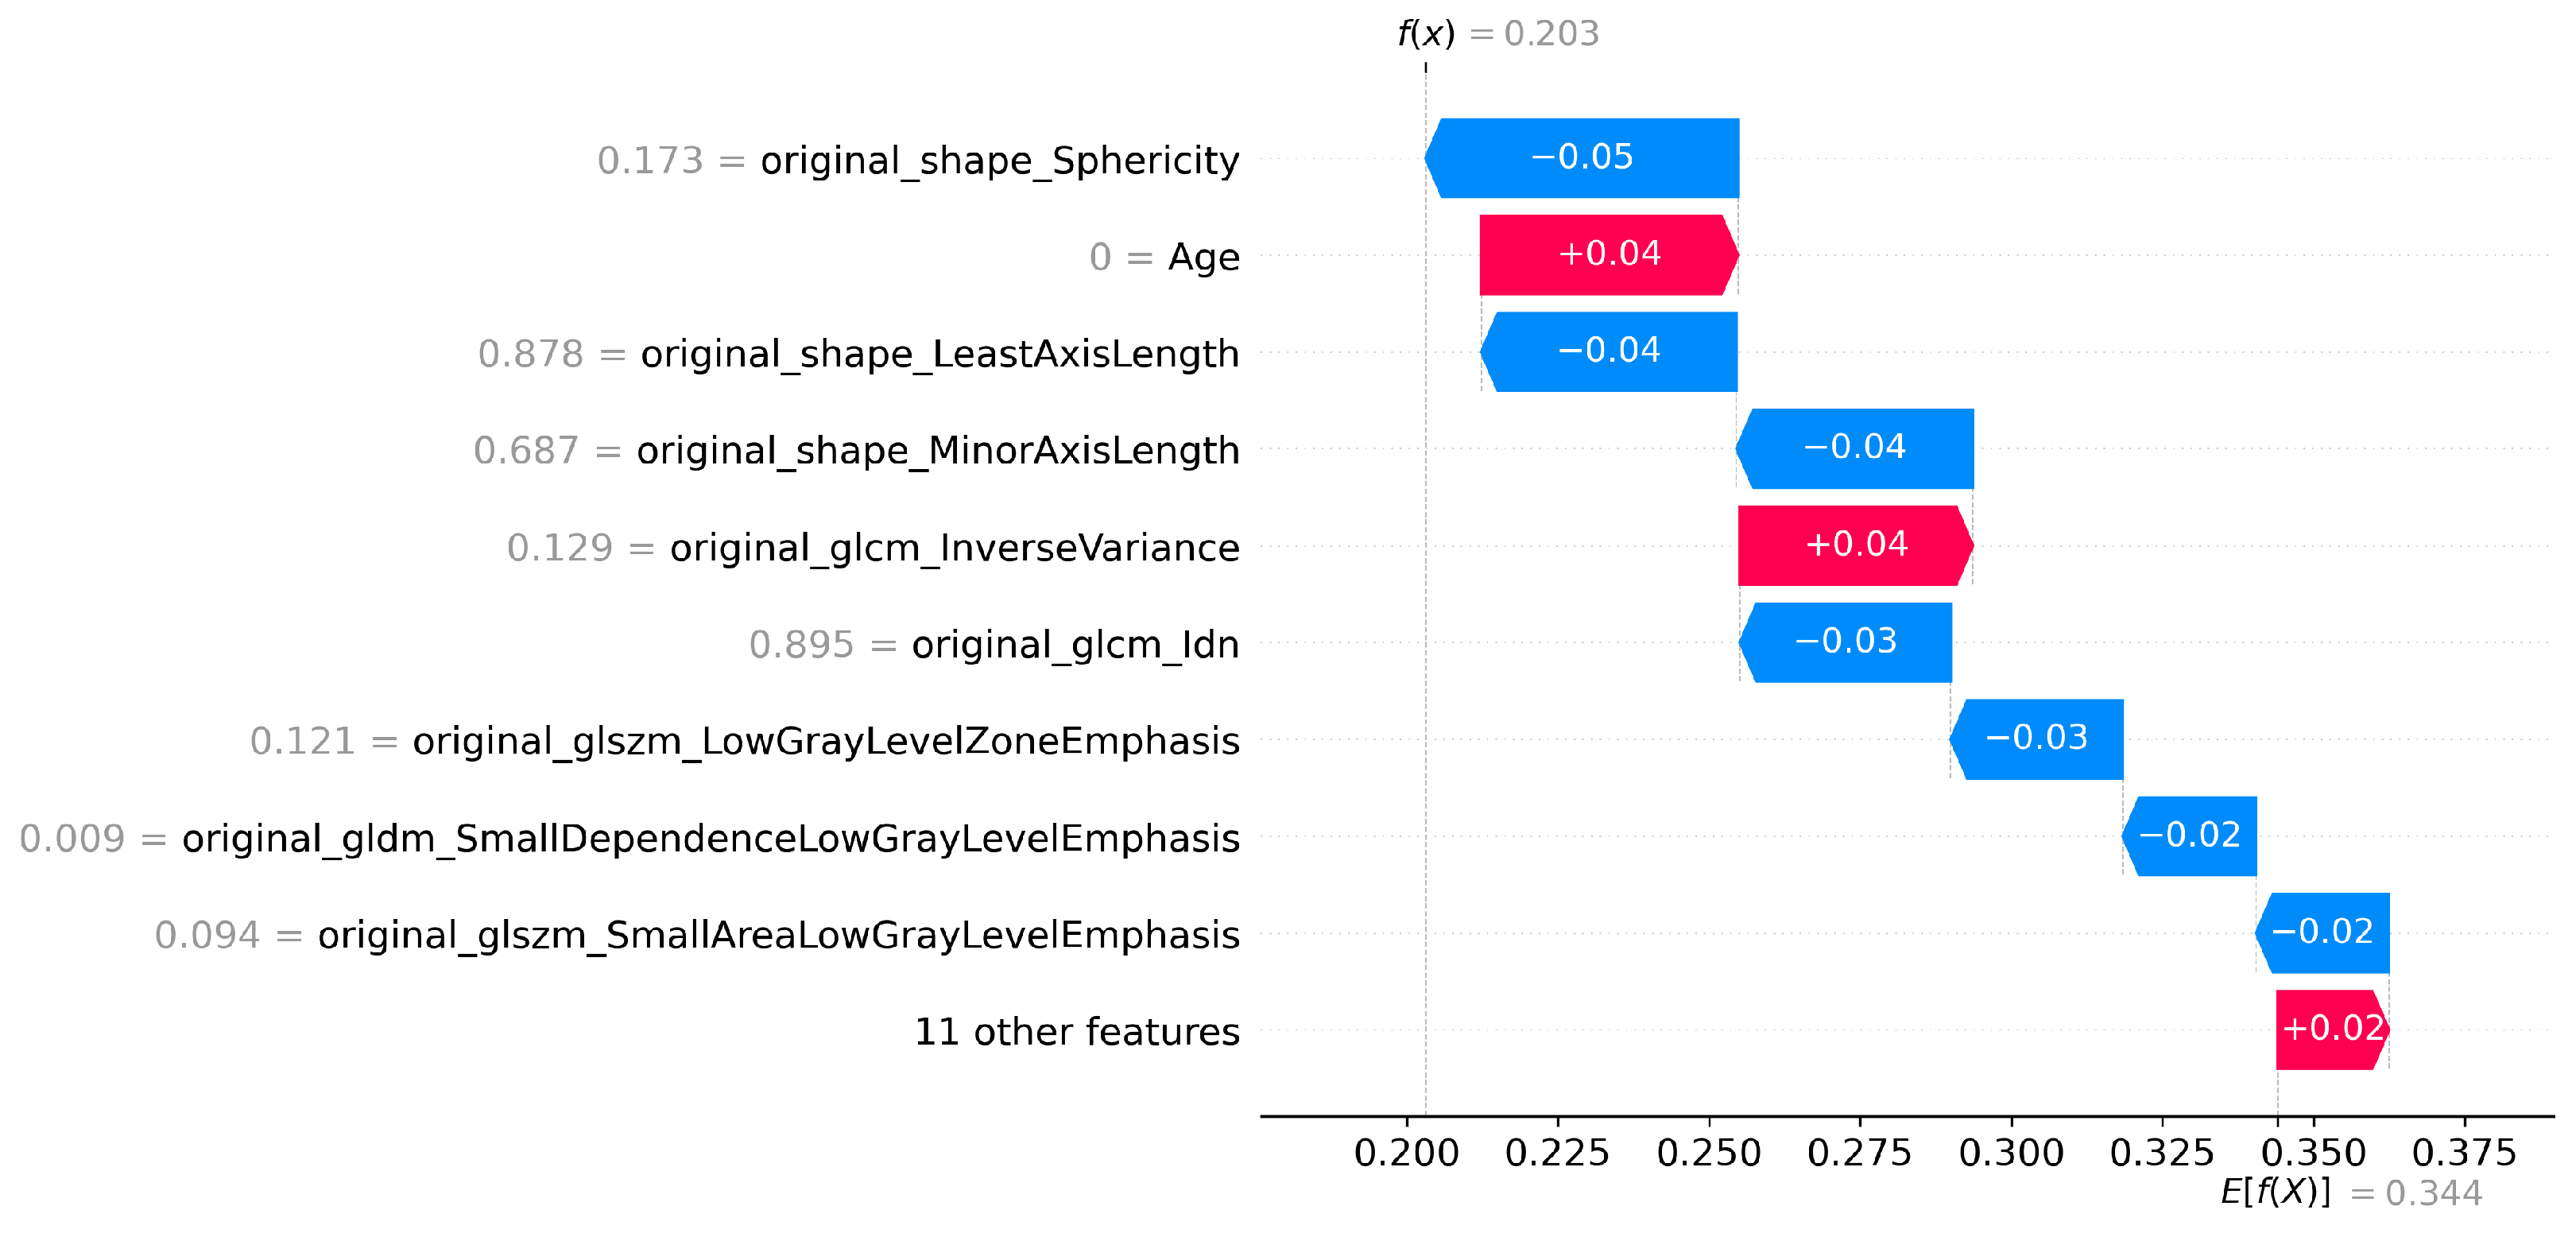
Figure 4.
SHAP waterfall plot for T1 Features for LGG vs HGG classification.
Figure 4.
SHAP waterfall plot for T1 Features for LGG vs HGG classification.
Figure 5.
Architecture of the DuelContextAttn DQN model for Classification and Survival Prediction.
Figure 5.
Architecture of the DuelContextAttn DQN model for Classification and Survival Prediction.
Figure 6.
Histogram view for the survival class category short (0–250 days), medium (251–500 days), and long (501–1800 days).
Figure 6.
Histogram view for the survival class category short (0–250 days), medium (251–500 days), and long (501–1800 days).
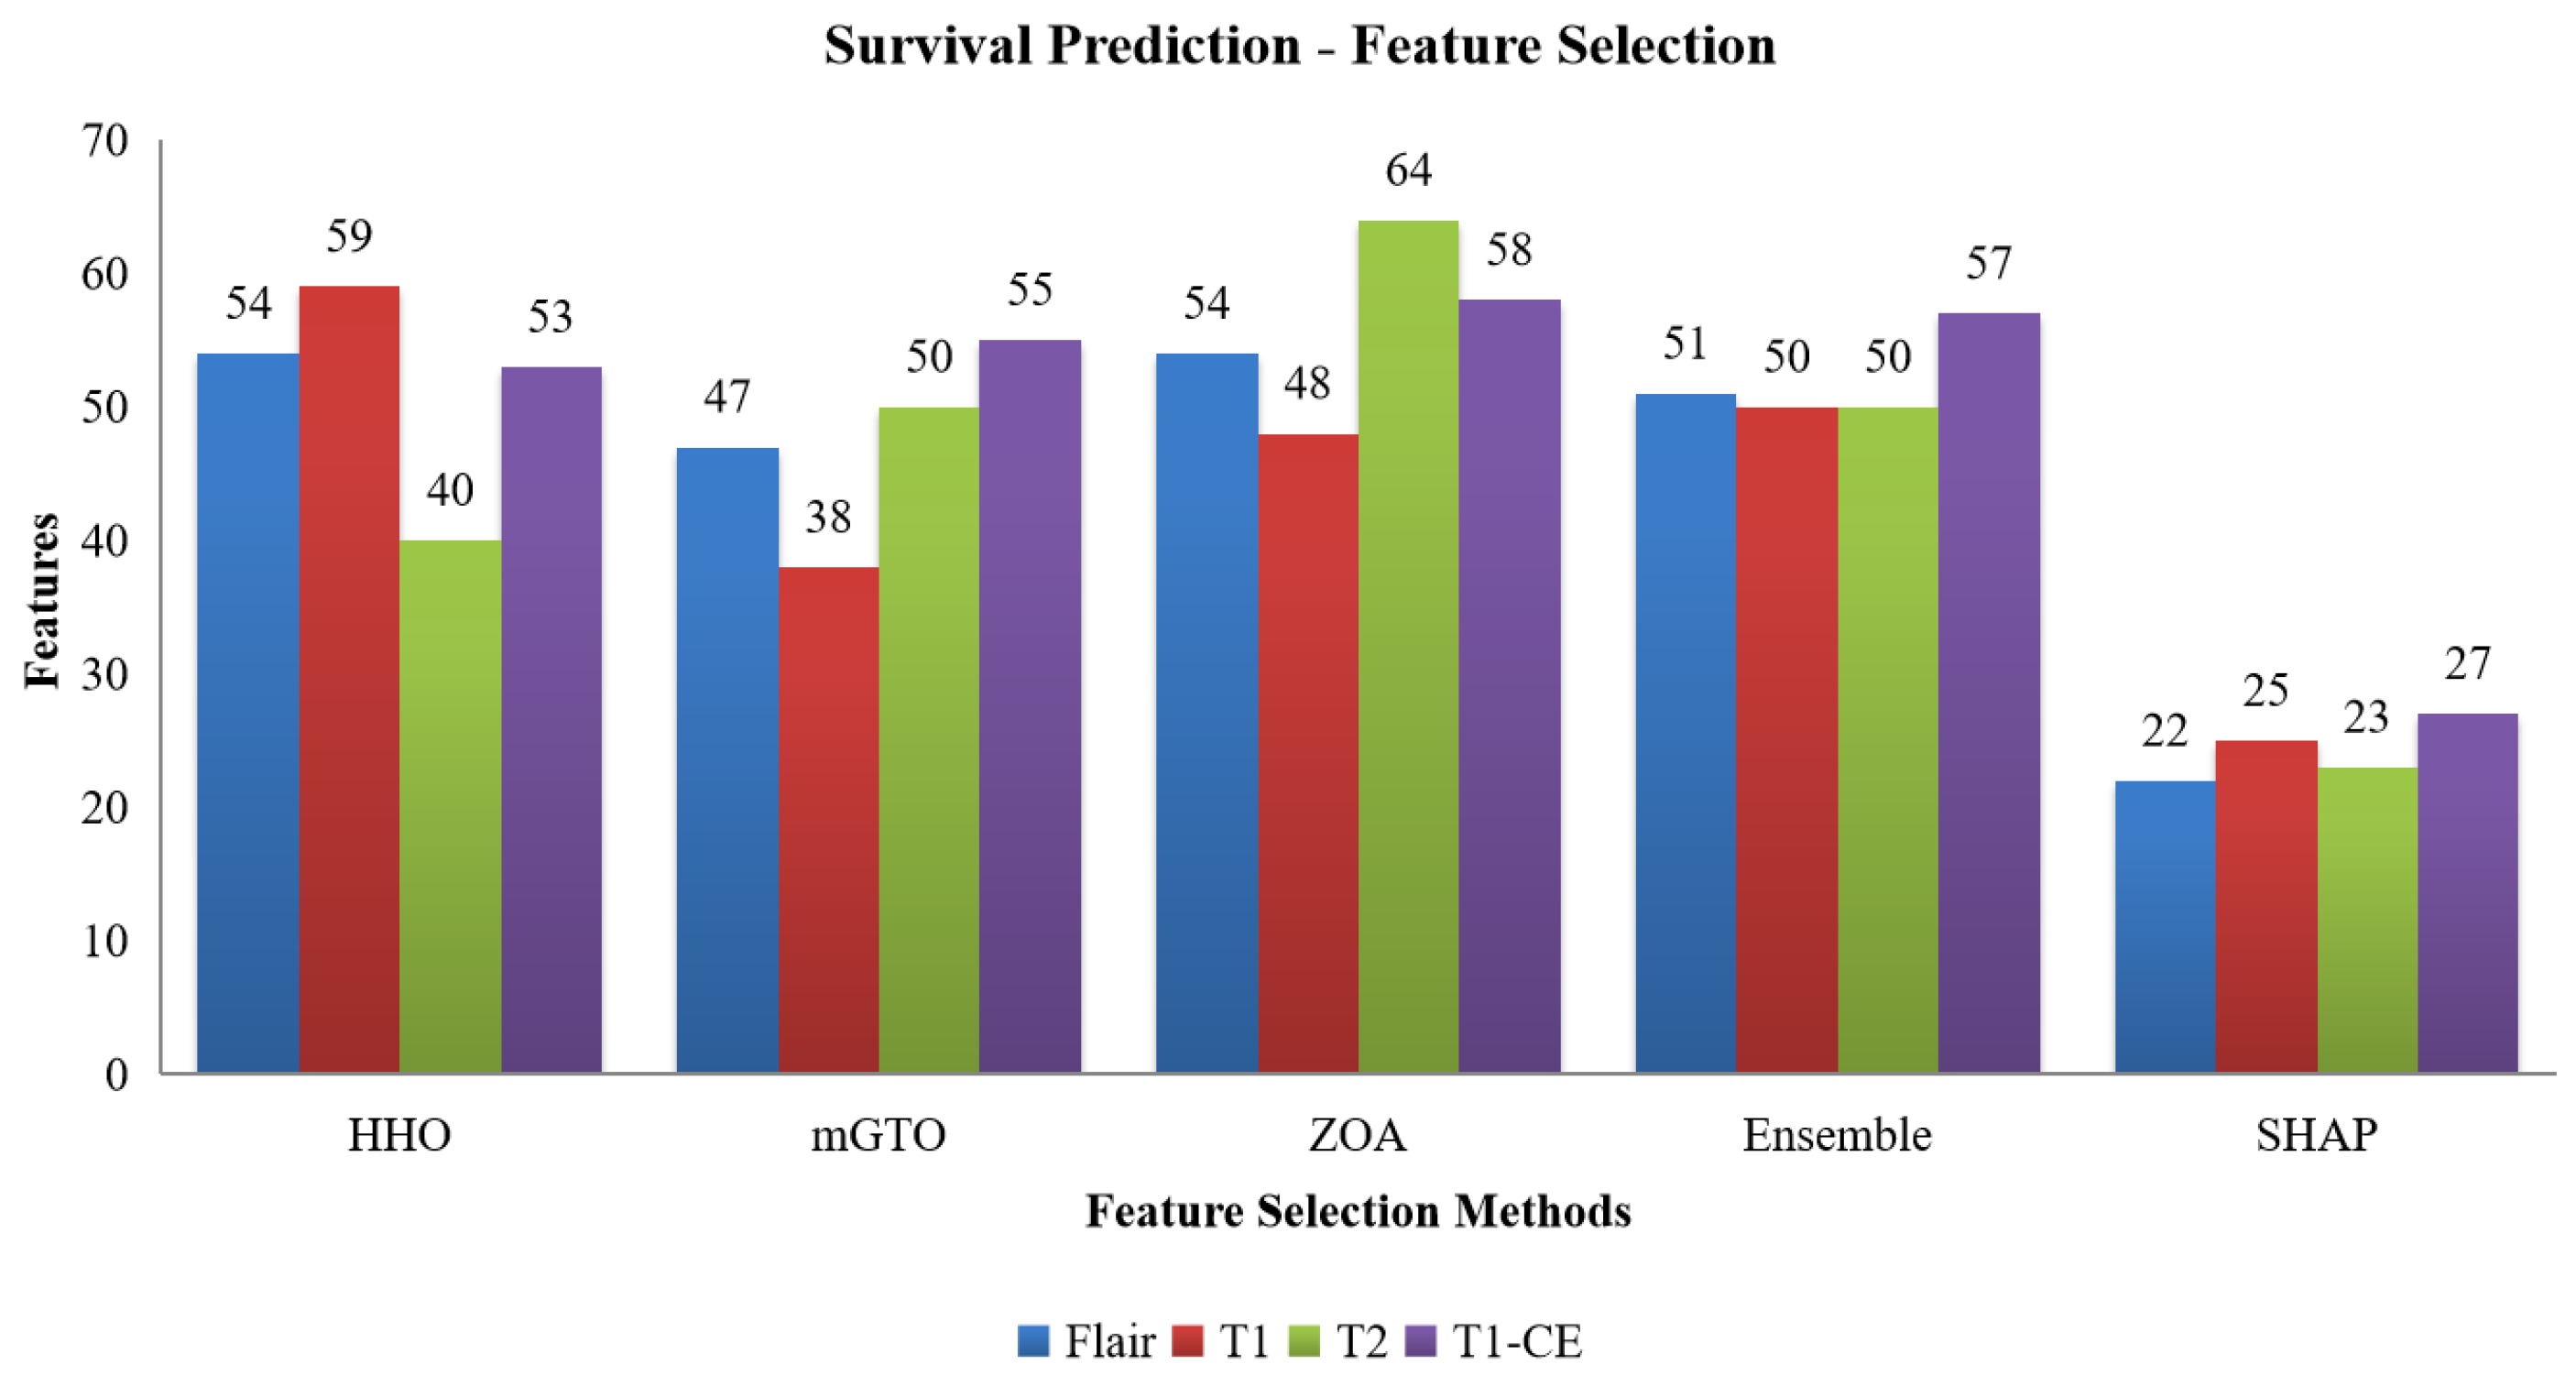
Figure 7.
Number of features selected by HHO, mGTO, ZOA, Ensemble Metaheuristic Optimization Algorithm and SHAP for each modality used in survival prediction.
Figure 7.
Number of features selected by HHO, mGTO, ZOA, Ensemble Metaheuristic Optimization Algorithm and SHAP for each modality used in survival prediction.
Figure 8.
SHAP plot highlighting the contribution of T1-CE selected features to survival prediction.
Figure 8.
SHAP plot highlighting the contribution of T1-CE selected features to survival prediction.
Figure 9.
SHAP waterfall plot for T1CE (Survival prediction).
Figure 9.
SHAP waterfall plot for T1CE (Survival prediction).
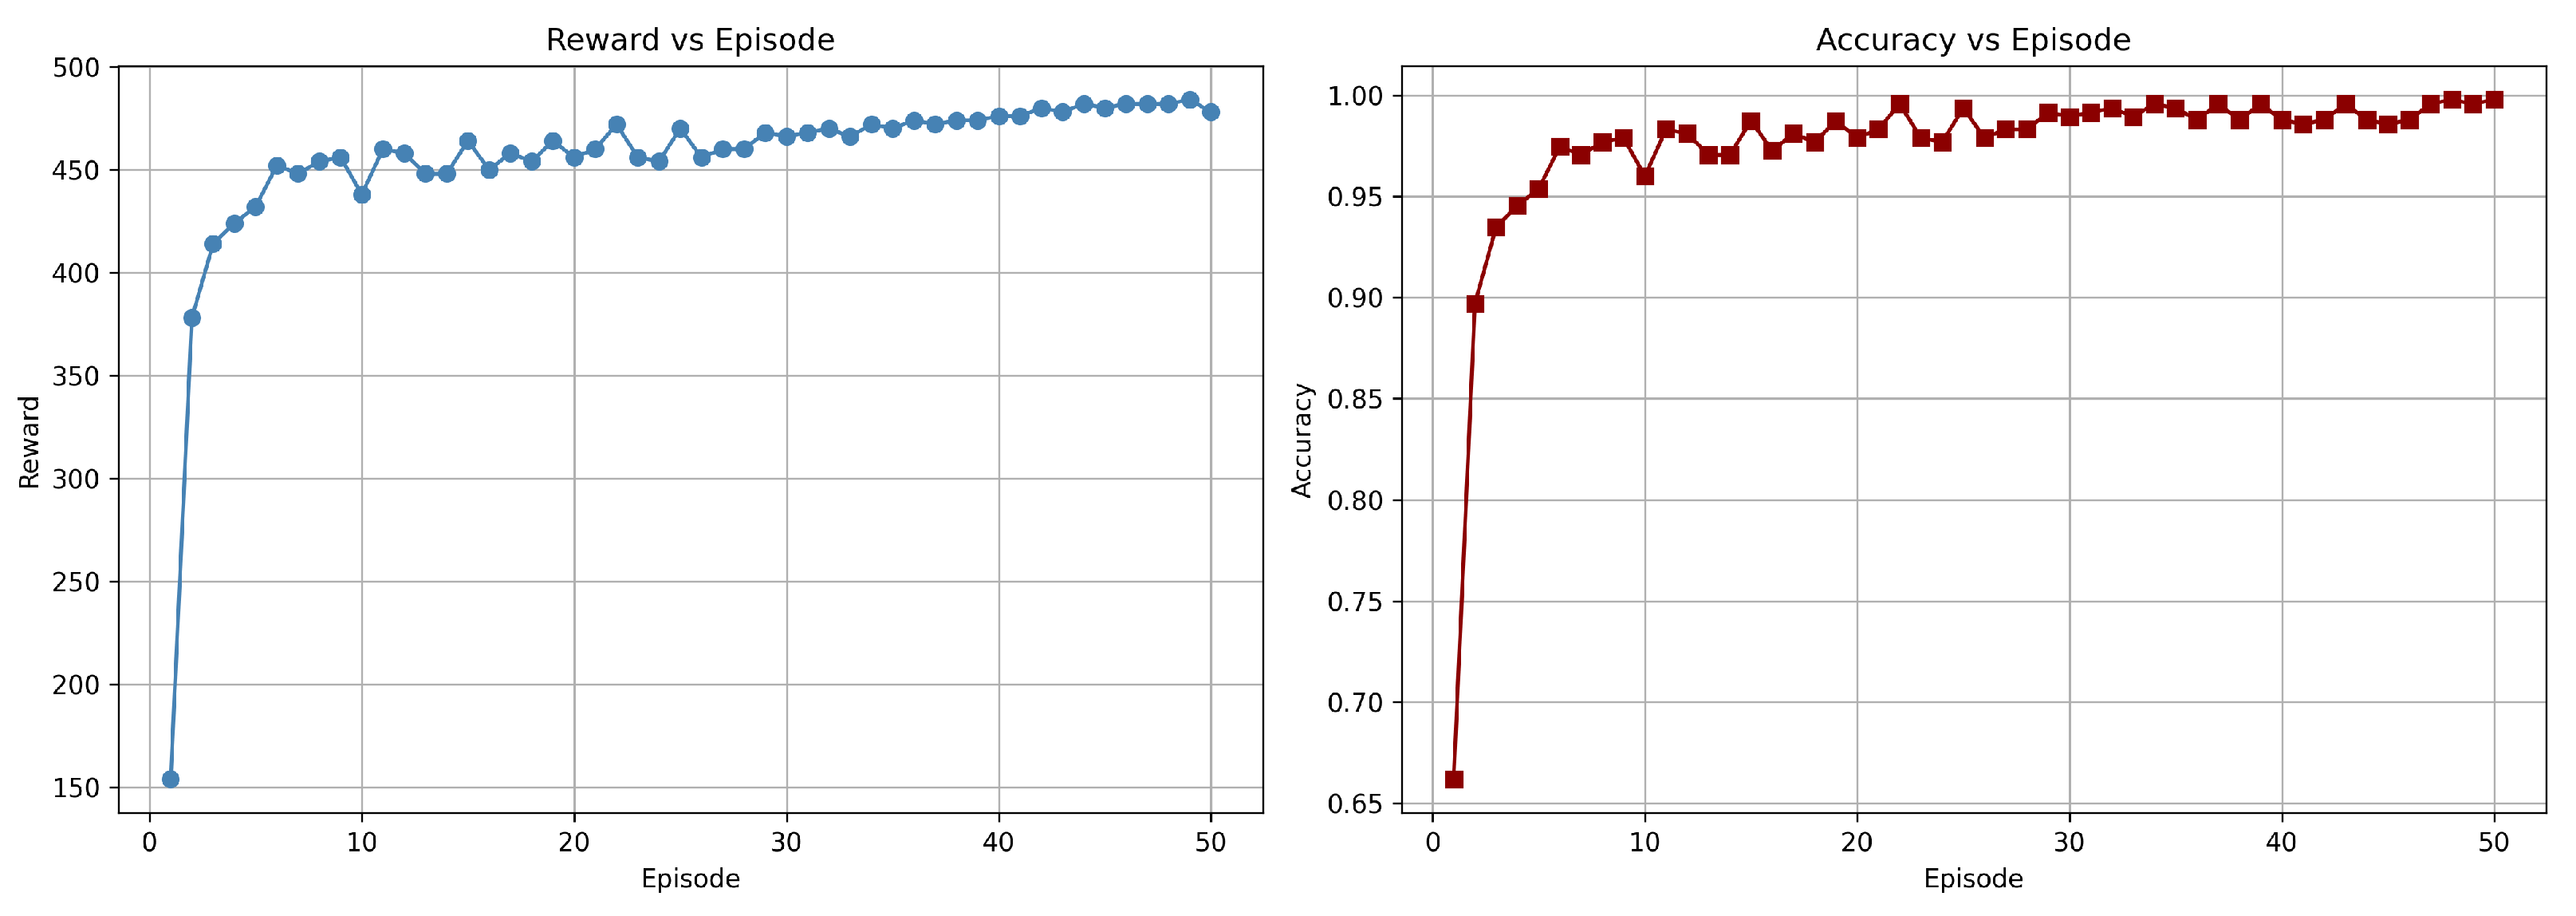
Figure 10.
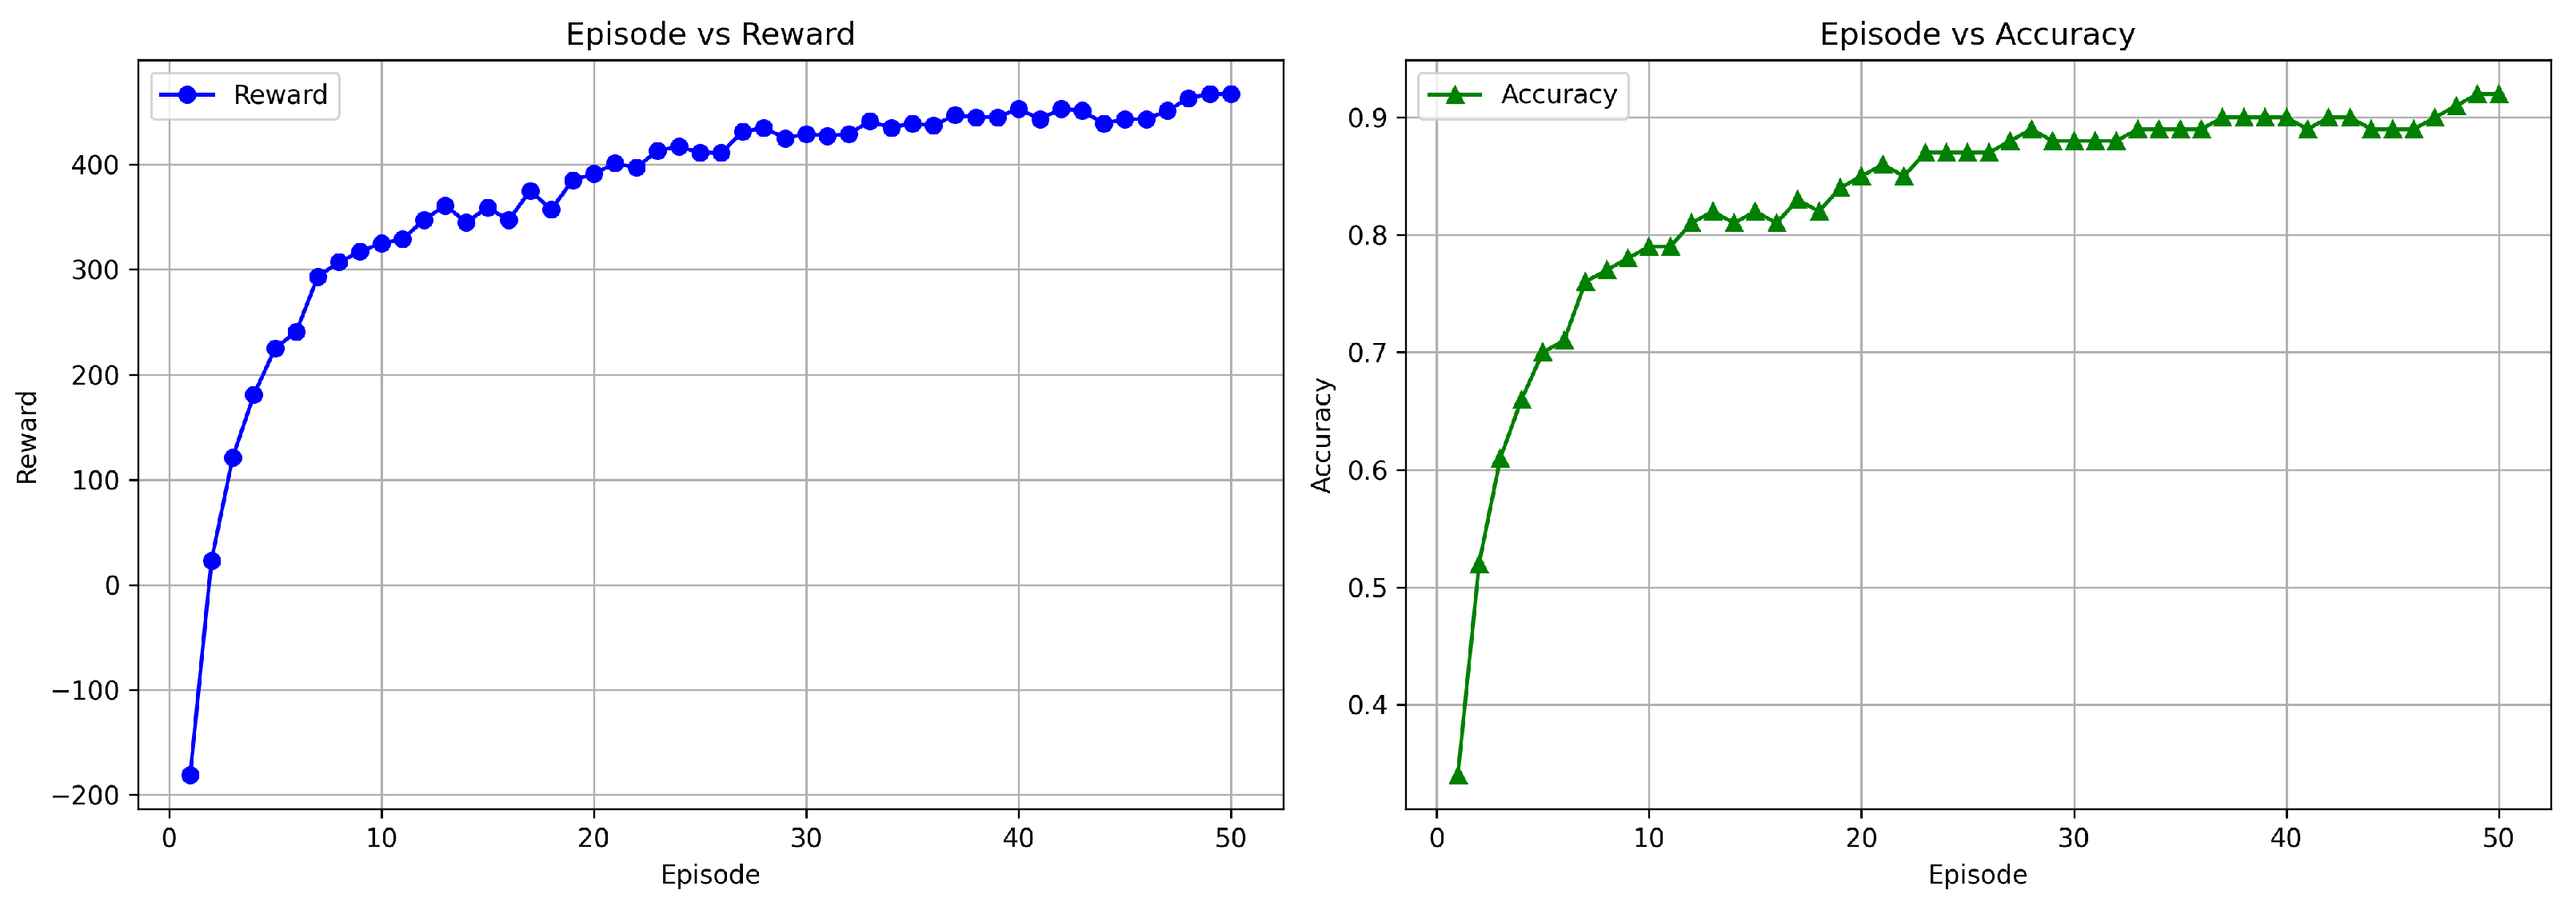
Training graph showing the progress of rewards and accuracy per episode for the DuelContextAttn DQN model in LGG/HGG classification using Flair + T1CE modality.
Figure 10.
Training graph showing the progress of rewards and accuracy per episode for the DuelContextAttn DQN model in LGG/HGG classification using Flair + T1CE modality.
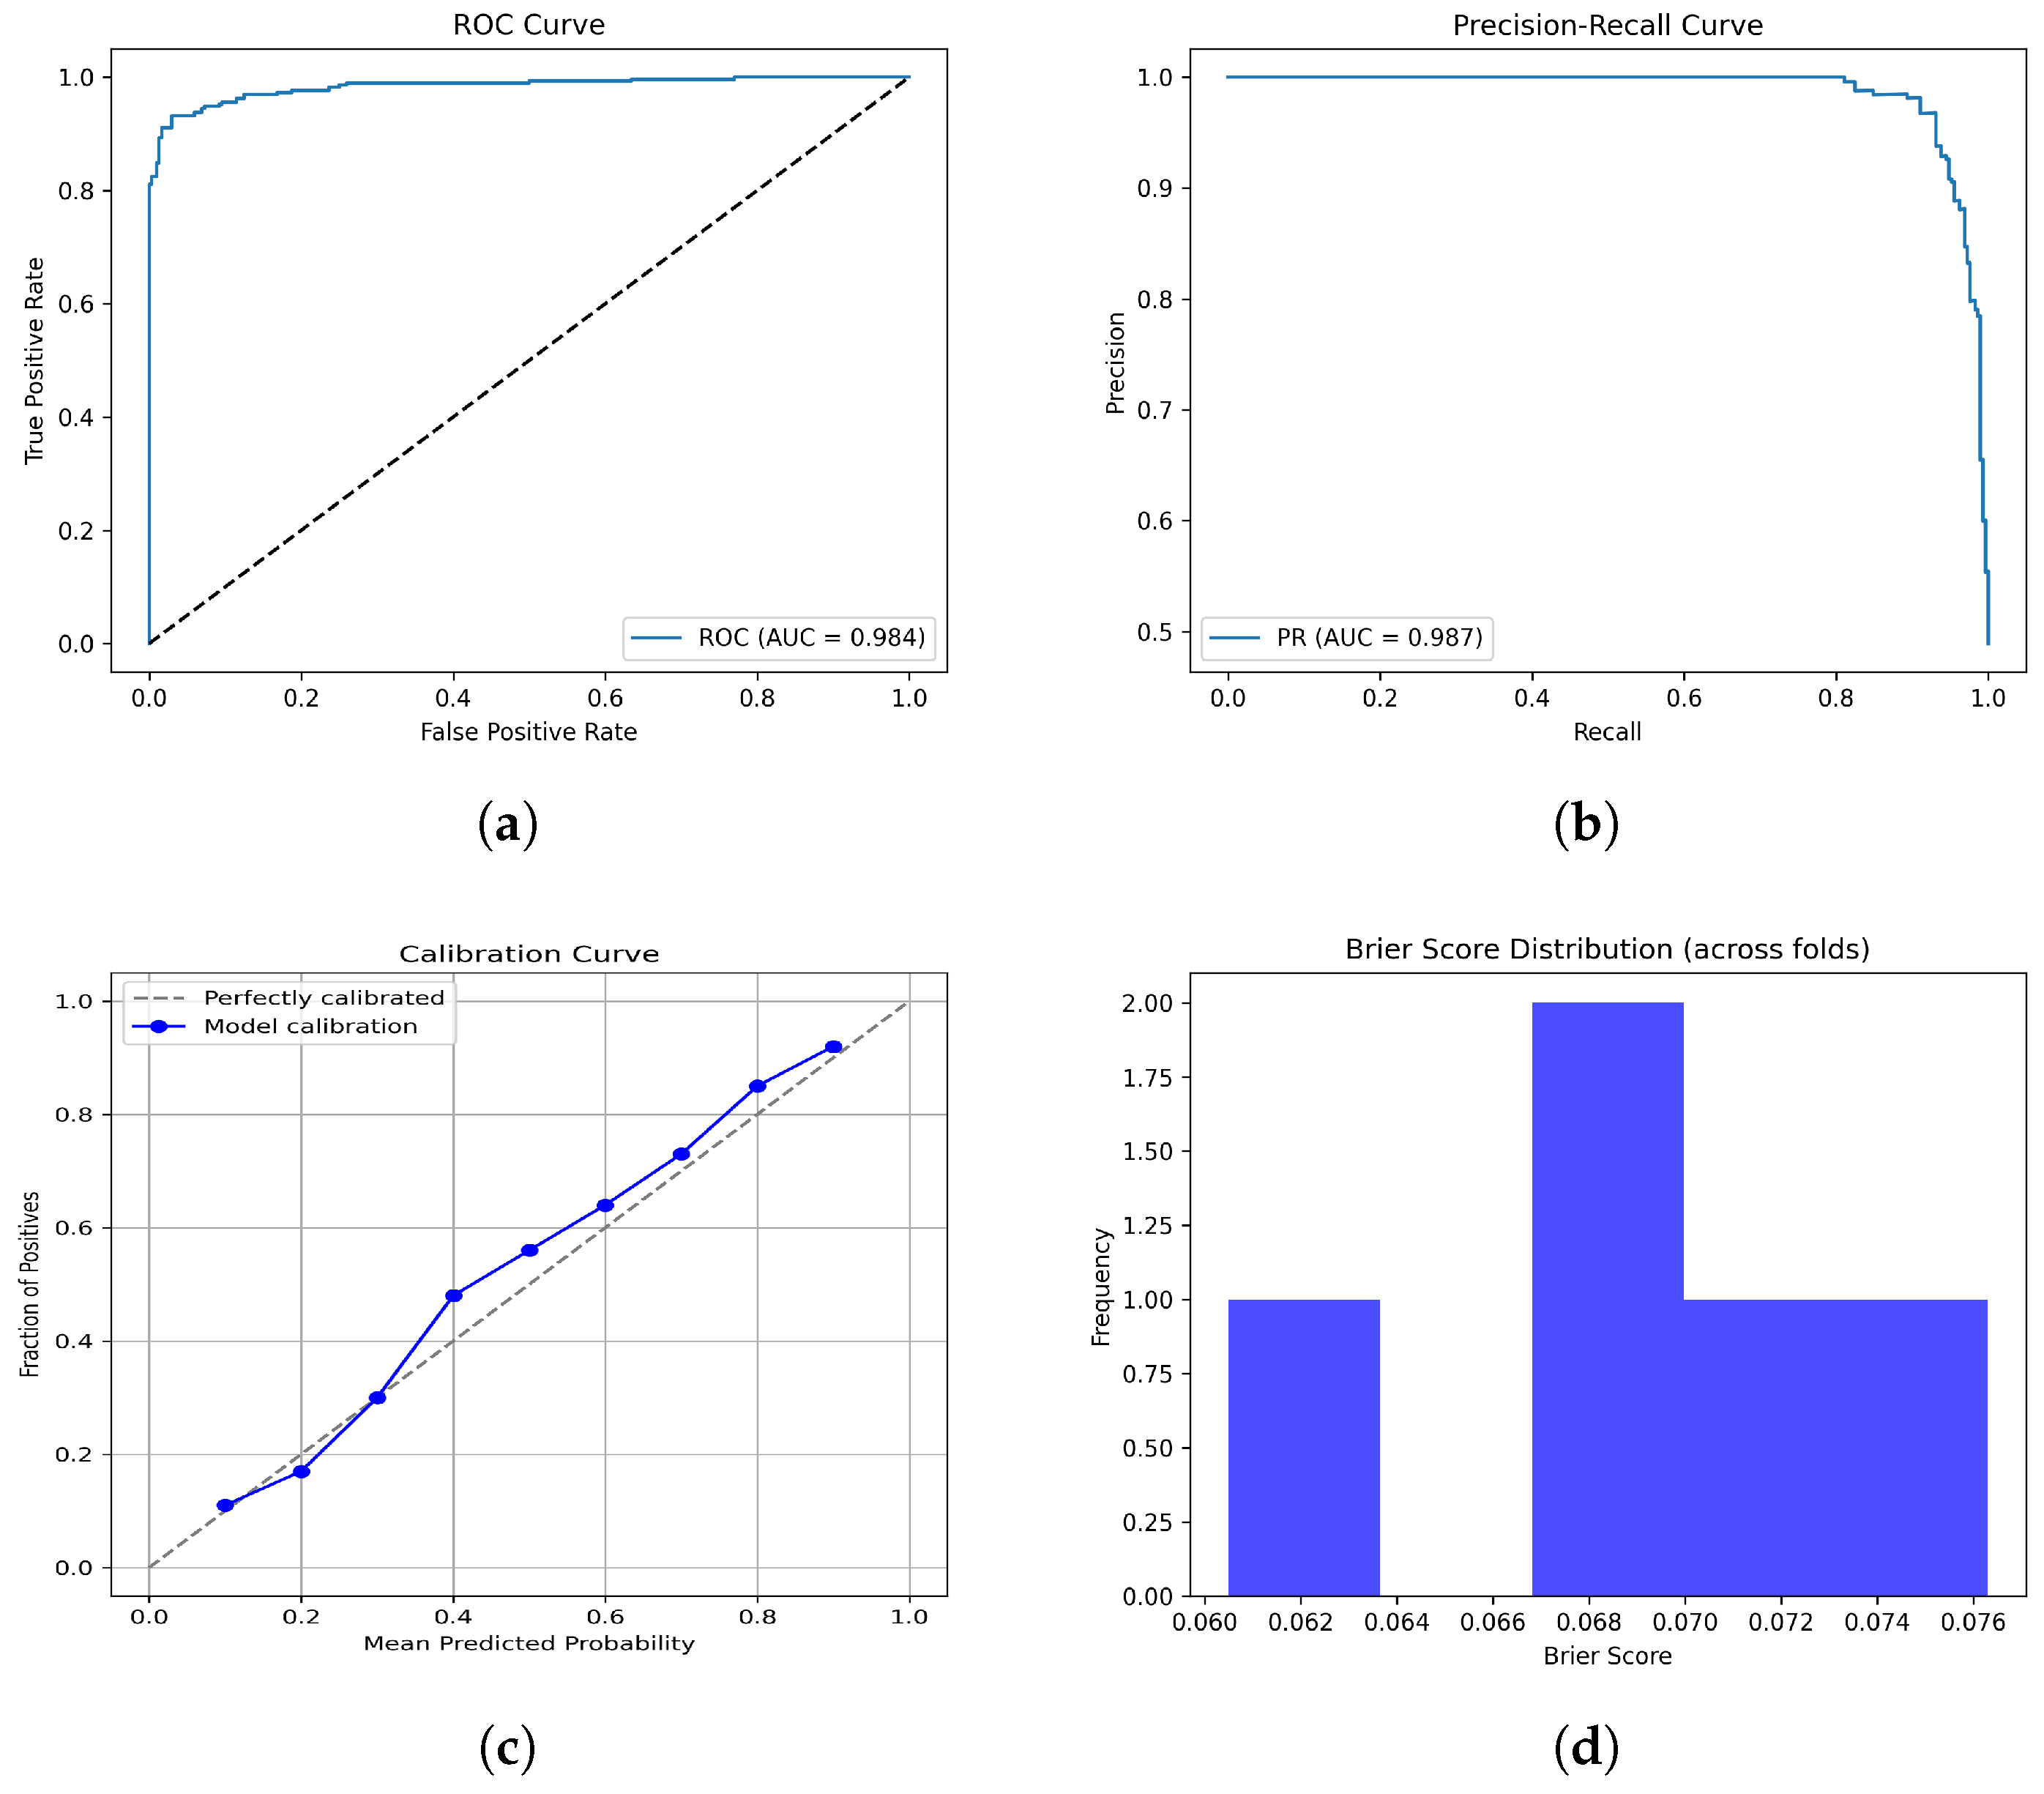
Figure 11.
Performance since they have already been explained in the caption. Please confirm this revision. evaluation plots of the F + T1CE fusion model: (a) ROC curve, (b) PR curve, (c) Calibration curve, and (d) Brier scores.
Figure 11.
Performance since they have already been explained in the caption. Please confirm this revision. evaluation plots of the F + T1CE fusion model: (a) ROC curve, (b) PR curve, (c) Calibration curve, and (d) Brier scores.
Figure 12.
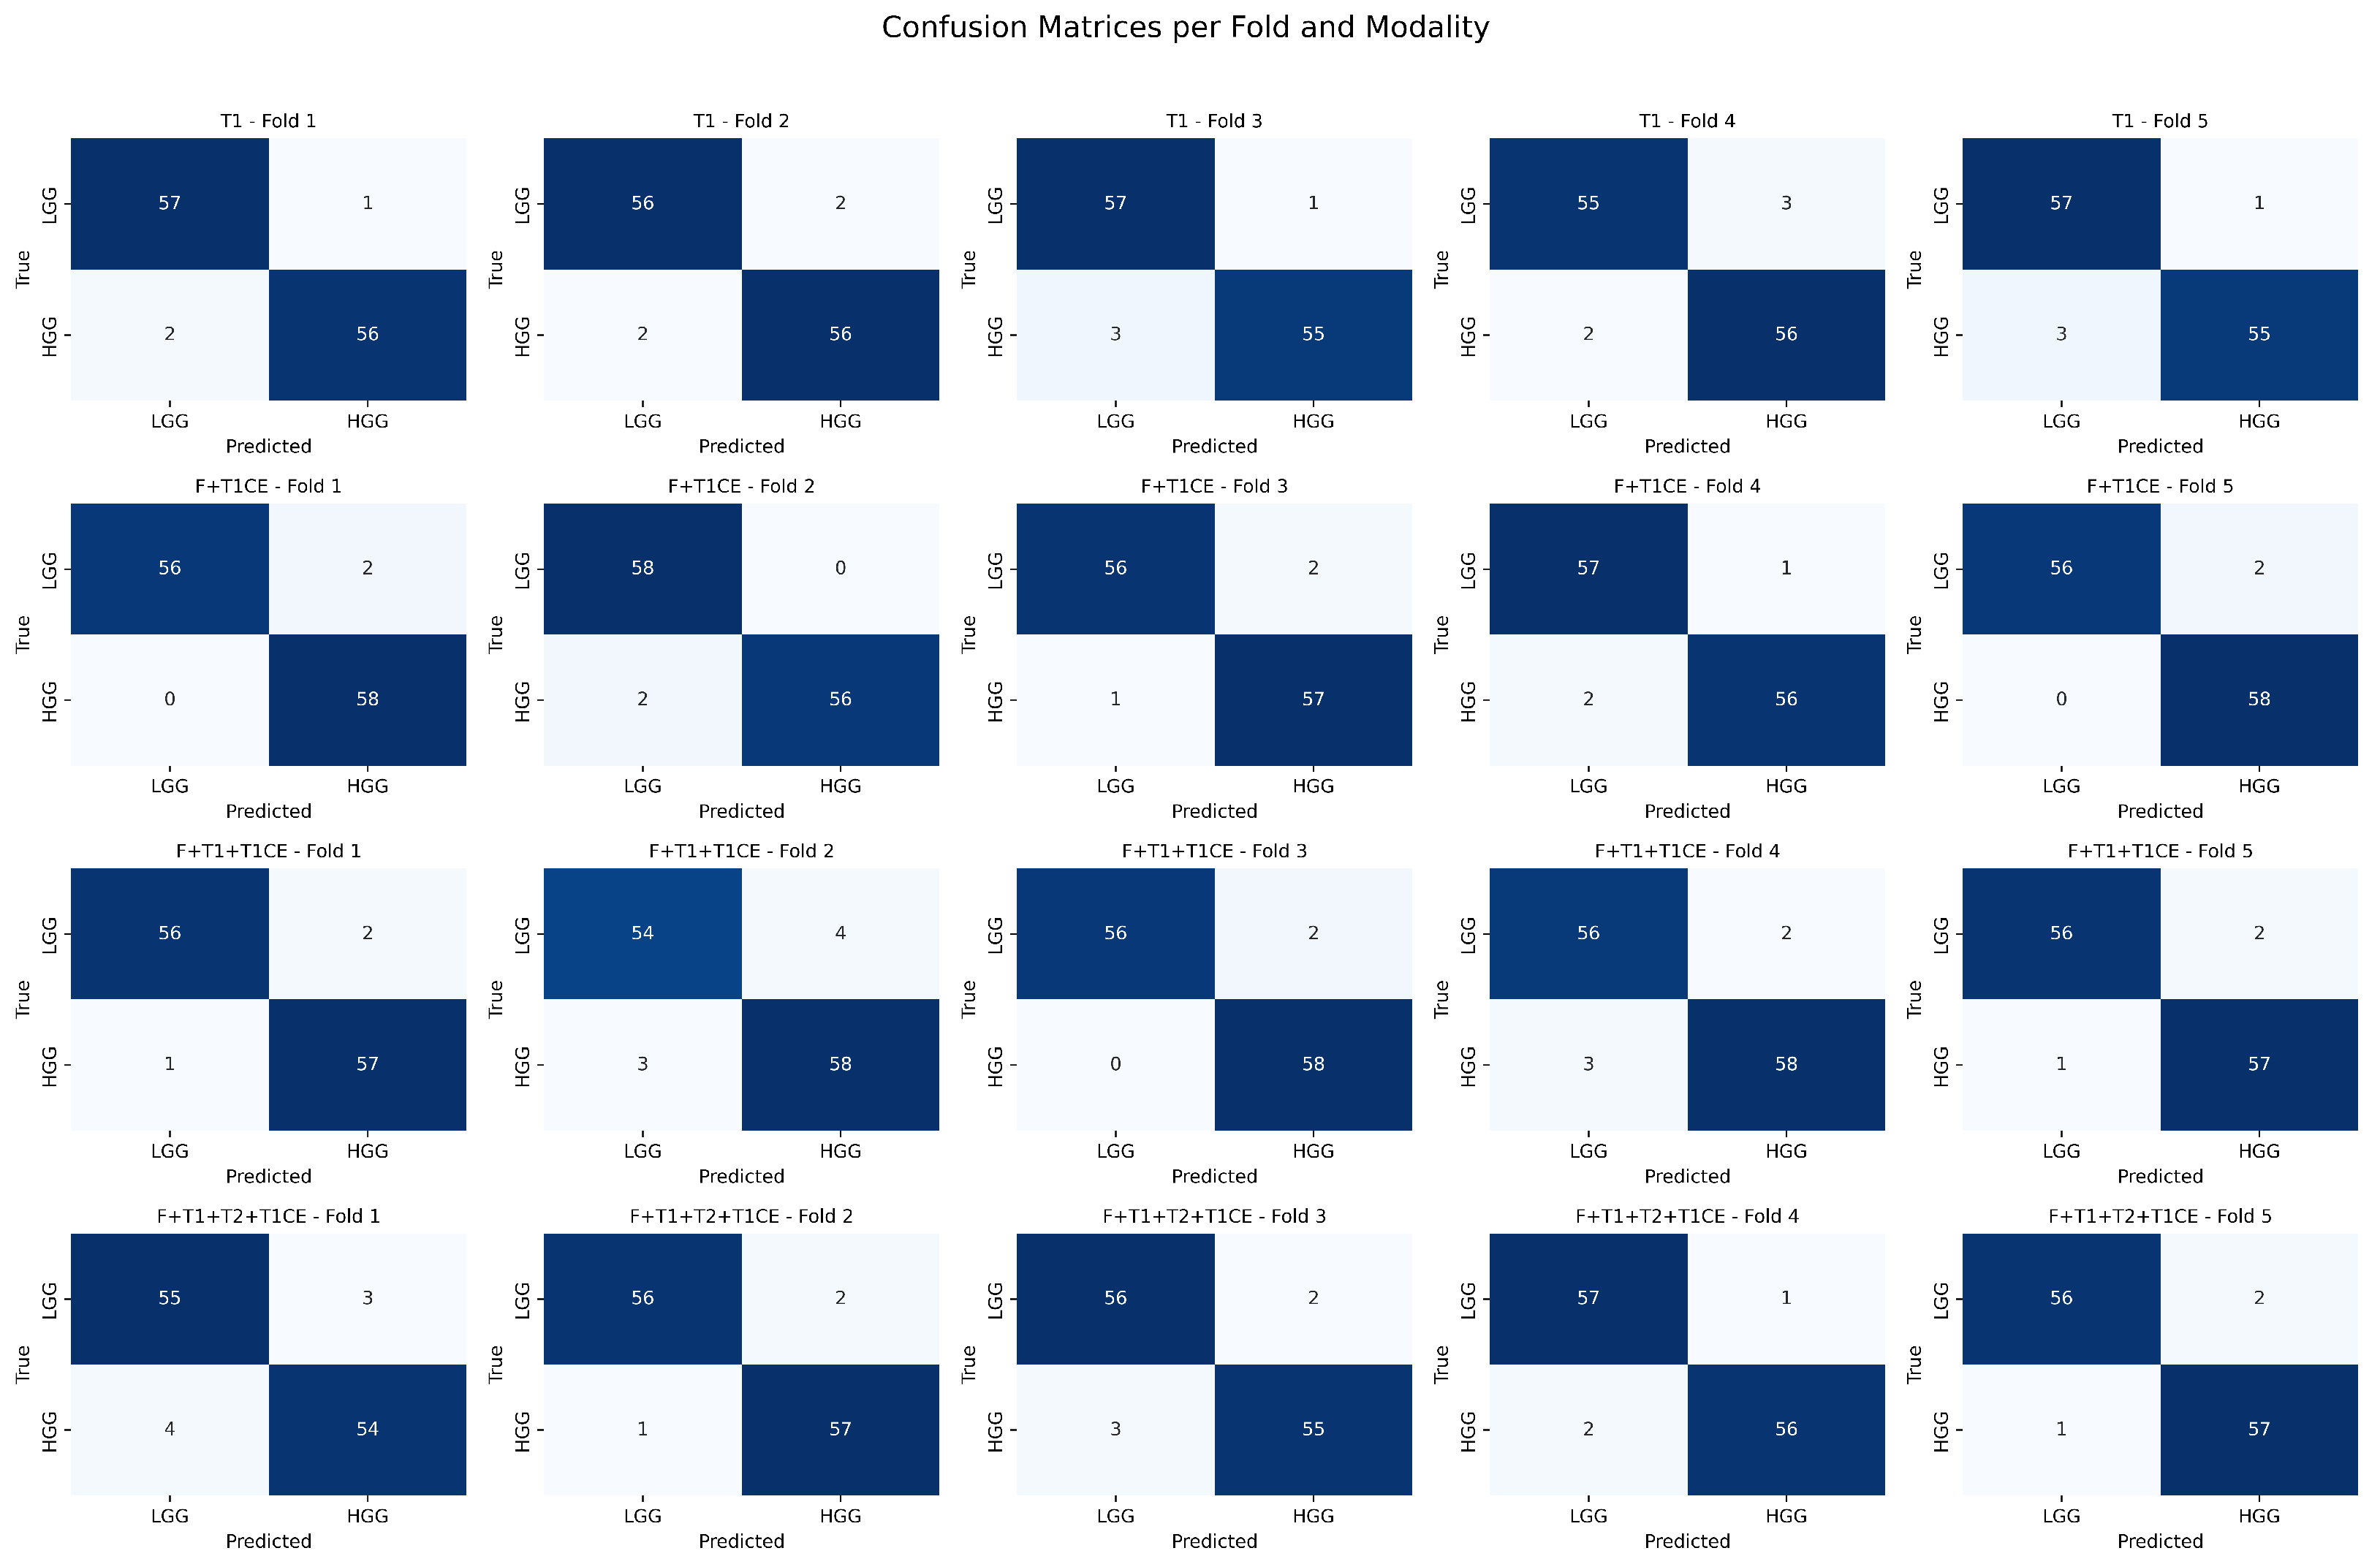
Confusion matrices per fold and modality for binary tumor grading classification. Each row corresponds to a modality combination (T1, F + T1CE, F + T1 + T1CE, F + T1 + T2 + T1CE), and each column corresponds to a cross-validation fold.
Figure 12.
Confusion matrices per fold and modality for binary tumor grading classification. Each row corresponds to a modality combination (T1, F + T1CE, F + T1 + T1CE, F + T1 + T2 + T1CE), and each column corresponds to a cross-validation fold.
Figure 13.
Training graph showing the progress of rewards and accuracy per episode for the DuelContextAttn DQN model in survival prediction using Flair + T1 + T1CE modality.
Figure 13.
Training graph showing the progress of rewards and accuracy per episode for the DuelContextAttn DQN model in survival prediction using Flair + T1 + T1CE modality.
Figure 14.
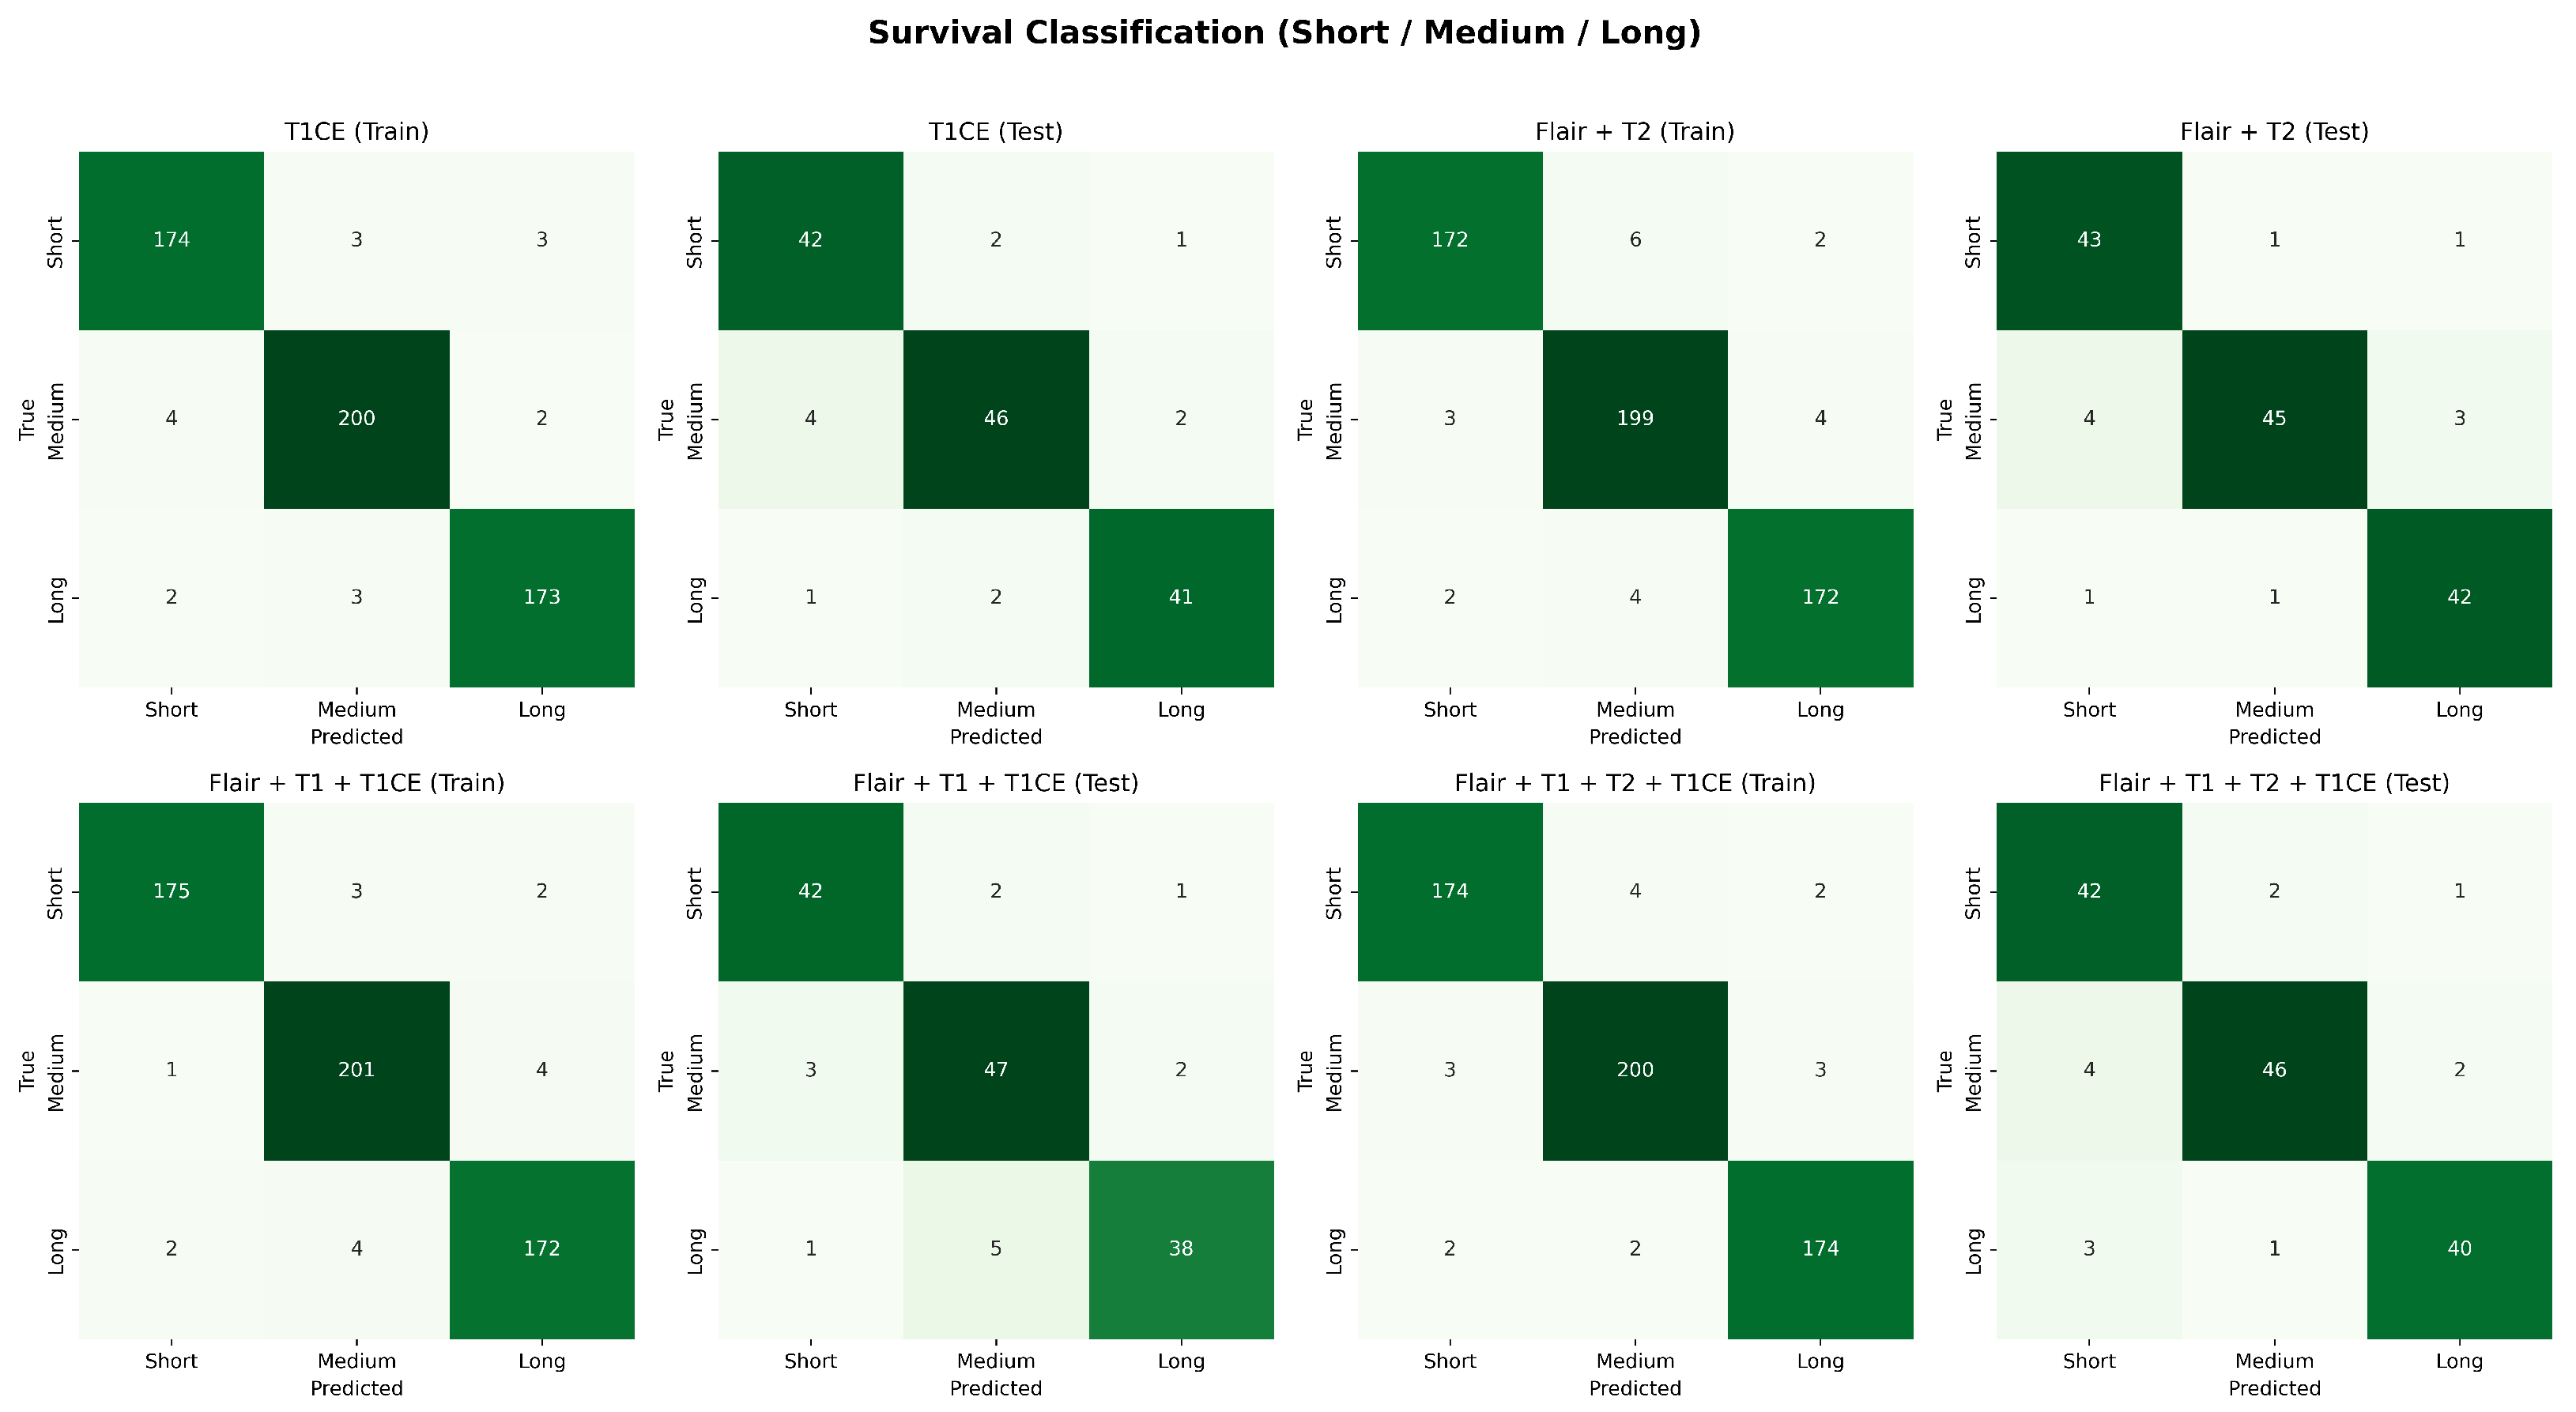
Confusion matrices for survival classification with best-performing modality combinations. The top row shows training results and testing results for T1CE, F + T2 and the bottom row shows for F + T1 + T1CE, and F + T1 + T2 + T1CE.
Figure 14.
Confusion matrices for survival classification with best-performing modality combinations. The top row shows training results and testing results for T1CE, F + T2 and the bottom row shows for F + T1 + T1CE, and F + T1 + T2 + T1CE.
Figure 15.
Convergence curves of HHO, ZOA, and mGTO compared with GA, PSO, and ABC, showing faster convergence and better fitness.
Figure 15.
Convergence curves of HHO, ZOA, and mGTO compared with GA, PSO, and ABC, showing faster convergence and better fitness.
Table 1.
Number of radiomics features extracted from each category.
Table 1.
Number of radiomics features extracted from each category.
| Feature Category | Count |
|---|
| Shape-Based Features | 14 |
| First-Order Statistics | 18 |
| GLCM (Gray Level Co-occurrence Matrix) | 24 |
| GLDM (Gray Level Dependence Matrix) | 13 |
| GLRLM (Gray Level Run Length Matrix) | 16 |
| GLSZM (Gray Level Size Zone Matrix) | 15 |
| NGTDM (Neighboring Gray Tone Difference Matrix) | 5 |
| Total | 105 |
Table 2.
Hyperparameters and Objective Function Settings for Metaheuristic Feature Selection.
Table 2.
Hyperparameters and Objective Function Settings for Metaheuristic Feature Selection.
| Parameter | Value |
|---|
| Population Size | 20 |
| Number of Iterations | 50 |
| Optimization Type | Minimization |
| Search Space | Binary over 105 features |
| Fitness Function | 1 − accuracy_score |
| Classifier | SVM |
| Cross-validation | Stratified k-fold |
| Runs per Algorithm | 10 (average accuracy reported) |
| Random Seeds | Different seeds for each run |
Table 3.
Training parameters of the DuelContextAttn DQN model.
Table 3.
Training parameters of the DuelContextAttn DQN model.
| Parameter | Value |
|---|
| State size | Number of patients cases (one state per patient sample) |
| Action size | 2 (Classification), 3 (Survival Prediction) |
| Gamma (Discount Factor) | 0.99 |
| Epsilon (Initial Exploration Rate) | 0.5 |
| Epsilon_min | 0.01 |
| Epsilon_decay | 0.995 |
| Episodes | 50 |
| Batch size | 16 |
| Optimizer | Adam |
| Learning rate | 0.001 |
| Loss function | Mean Square Error |
Table 4.
Performance comparison with different hyperparameter settings.
Table 4.
Performance comparison with different hyperparameter settings.
| Gamma | Epsilon | Epsilonmin | Epsilondecay | Avg. Time (s) | Accuracy |
|---|
| 0.99 | 0.5 | 0.0001 | 0.0001 | 1392.05 | 0.58 |
| 0.95 | 1.0 | 0.01 | 0.995 | 1260.33 | 0.92 |
| 0.90 | 0.7 | 0.05 | 0.01 | 684.37 | 0.94 |
| 0.85 | 0.3 | 0.1 | 0.003 | 732.56 | 0.94 |
| 0.99 | 1.0 | 0.01 | 0.995 | 654.74 | 0.98 |
| 0.99 | 0.5 | 0.01 | 0.995 | 617.26 | 0.99 |
Table 5.
Classification Performance of DualContextAttn DQN with 5-Fold Cross-Validation.
Table 5.
Classification Performance of DualContextAttn DQN with 5-Fold Cross-Validation.
| Modality | Precision | Recall | F1-Score | Accuracy (%) |
|---|
| Single-Modality
|
| Flair (F) | 0.99 ± 0.00 (0.99–0.99) | 0.95 ± 0.01 (0.94–0.96) | 0.97 ± 0.00 (0.97–0.97) | 98.76 ± 0.10 (98.68–98.84) |
| T1 | 0.97 ± 0.00 (0.97–0.97) | 0.96 ± 0.01 (0.95–0.97) | 0.94 ± 0.01 (0.93–0.95) | 99.02 ± 0.08 (98.95–99.09)
|
| T2 | 0.97 ± 0.00 (0.97–0.97) | 0.95 ± 0.01 (0.94–0.96) | 0.94 ± 0.01 (0.93–0.95) | 98.94 ± 0.10 (98.86–99.02) |
| T1CE | 0.96 ± 0.01 (0.95–0.97) | 0.94 ± 0.01 (0.93–0.95) | 0.95 ± 0.00 (0.95–0.95) | 98.50 ± 0.08 (98.42–98.58) |
| Dual–Modality |
| F + T1 | 0.99 ± 0.00 (0.99–0.99) | 0.94 ± 0.01 (0.93–0.95) | 0.96 ± 0.01 (0.95–0.97) | 98.53 ± 0.04 (98.49–98.57) |
| F + T2 | 0.98 ± 0.00 (0.98–0.98) | 0.92 ± 0.01 (0.91–0.93) | 0.95 ± 0.01 (0.94–0.96) | 99.12 ± 0.08 (99.04–99.20) |
| F + T1CE | 0.99 ± 0.00 (0.99–0.99) | 0.95 ± 0.01 (0.94–0.96) | 0.96 ± 0.01 (0.95–0.97) | 99.27 ± 0.05 (99.22–99.32) |
| T1 + T2 | 0.98 ± 0.00 (0.98–0.98) | 0.97 ± 0.01 (0.96–0.98) | 0.97 ± 0.00 (0.97–0.97) | 94.33 ± 0.08 (94.26–94.40) |
| T1 + T1CE | 0.96 ± 0.01 (0.95–0.97) | 0.96 ± 0.01 (0.96–0.97) | 0.96 ± 0.00 (0.96–0.96) | 97.69 ± 0.05 (97.64–97.74) |
| T2 + T1CE | 0.99 ± 0.00 (0.99–0.99) | 0.96 ± 0.01 (0.95–0.97) | 0.97 ± 0.00 (0.97–0.97) | 98.95 ± 0.05 (98.90–99.00) |
| Triple–Modality |
| F + T1 + T2 | 0.97 ± 0.01 (0.97–0.99) | 0.93 ± 0.01 (0.92–0.94) | 0.95 ± 0.00 (0.95–0.95) | 98.53 ± 0.04 (98.49–98.57) |
| F + T1 + T1CE | 0.99 ± 0.00 (0.99–0.99) | 0.96 ± 0.00 (0.96–0.96) | 0.97 ± 0.00 (0.97–0.97) | 98.95 ± 0.03 (98.92–98.98) |
| F + T2 + T1CE | 0.98 ± 0.00 (0.98–0.98) | 0.94 ± 0.01 (0.92–0.95) | 0.95 ± 0.01 (0.94–0.96) | 98.74 ± 0.05 (98.69–98.79) |
| T1 + T2 + T1CE | 0.98 ± 0.00 (0.98–0.98) | 0.91 ± 0.01 (0.90–0.92) | 0.94 ± 0.01 (0.93–0.95) | 97.69 ± 0.05 (97.64–97.74) |
| All Four Modalities |
| F + T1 + T2 + T1CE | 0.99 ± 0.00 (0.99–0.99) | 0.91 ± 0.01 (0.90–0.93) | 0.95 ± 0.00 (0.95–0.95) | 98.32 ± 0.05 (98.27–98.37) |
Table 6.
Performance comparison across different models.
Table 6.
Performance comparison across different models.
| Model | Precision | Recall | F1-Score | Accuracy (%) |
|---|
| Logistic Regression | 0.92 | 0.88 | 0.91 | 90.55 |
| Linear SVM | 0.95 | 0.93 | 0.94 | 94.12 |
| XGBoost | 0.96 | 0.95 | 0.95 | 95.31 |
| LightGBM | 0.97 | 0.94 | 0.95 | 96.18 |
| Random Forest | 0.95 | 0.92 | 0.93 | 94.88 |
| Gradient Boosting | 0.96 | 0.93 | 0.94 | 95.07 |
| MLP | 0.97 | 0.96 | 0.94 | 95.51 |
| Proposed Method | 0.99 | 0.94 | 0.96 | 99.27 |
Table 7.
Comparative accuracy of existing models and the proposed method.
Table 7.
Comparative accuracy of existing models and the proposed method.
| Method | Model | Accuracy (%) |
|---|
| Cho et al. [24] | Random Forest | 88.70 |
| Kumar et al. [25] | Random Forest | 97.48 |
| Varghese et al. [26] | SVM | 97.00 |
| Uvaneshwari et al. [27] | XGBoost | 97.83 |
| Khan et al. [28] | VGG | 94.06 |
| Rehman et al. [29] | CNN | 98.32 |
| Ferdous et al. [30] | LCDEIT | 93.69 |
| Montaha et al. [31] | TD-CNN-LSTM | 98.90 |
| Stember et al. [7] | DQL-TD | 100.00 (200 episodes) |
| Proposed Method | DuelContextAttn DQN | 99.27 (50 episodes) |
Table 8.
Performance of the DuelContextAttn DQN model for the Overall Survival Prediction.
Table 8.
Performance of the DuelContextAttn DQN model for the Overall Survival Prediction.
| Modality | Precision | Recall | F1-Score | AUC | Accuracy (%) |
|---|
| Single-Modality |
| Flair | 0.96 | 0.94 | 0.95 | 0.95 | 91.08 |
| T1 | 0.91 | 0.95 | 0.92 | 0.94 | 93.03 |
| T2 | 0.93 | 0.91 | 0.90 | 0.92 | 92.19 |
| T1CE | 0.92 | 0.94 | 0.95 | 0.96 | 93.28 |
| Dual-Modality |
| Flair + T1 | 0.95 | 0.91 | 0.93 | 0.94 | 91.92 |
| Flair + T2 | 0.96 | 0.94 | 0.93 | 0.96 | 93.71 |
| Flair + T1CE | 0.93 | 0.91 | 0.90 | 0.94 | 92.76 |
| T1 + T2 | 0.92 | 0.93 | 0.94 | 0.94 | 92.96 |
| T1 + T1CE | 0.90 | 0.91 | 0.91 | 0.91 | 90.76 |
| T2 + T1CE | 0.92 | 0.94 | 0.91 | 0.94 | 91.60 |
| Triple-Modality |
| Flair + T1 + T2 | 0.92 | 0.93 | 0.92 | 0.95 | 91.24 |
| Flair + T1 + T1CE | 0.96 | 0.91 | 0.94 | 0.95 | 93.82 |
| Flair + T2 + T1CE | 0.95 | 0.92 | 0.93 | 0.94 | 92.08 |
| T1 + T2 + T1CE | 0.94 | 0.92 | 0.93 | 0.94 | 91.71 |
| All Four Modalities |
| Flair + T1 + T2 + T1CE | 0.93 | 0.94 | 0.95 | 0.95 | 93.39 |
Table 10.
Ablation study comparing different DQN variants on the F + T1CE modality.
Table 10.
Ablation study comparing different DQN variants on the F + T1CE modality.
| Model | Precision | Recall | F1-Score | Accuracy (%) |
|---|
| DQN | 0.95 | 0.96 | 0.95 | 95.10 |
| Double DQN | 0.97 | 0.98 | 0.96 | 97.32 |
| Dueling DQN | 0.97 | 0.96 | 0.98 | 97.76 |
| Dueling Double DQN | 0.98 | 0.96 | 0.98 | 97.95 |
| Dueling Double DQN-A | 0.98 | 0.96 | 0.98 | 98.68 |
| DuelContextAttn DQN (Proposed) | 0.99 | 0.97 | 0.98 | 99.27 |

