Parkinson’s Disease Diagnosis and Severity Assessment from Gait Signals via Bayesian-Optimized Deep Learning
Abstract
1. Introduction
2. Materials and Methods
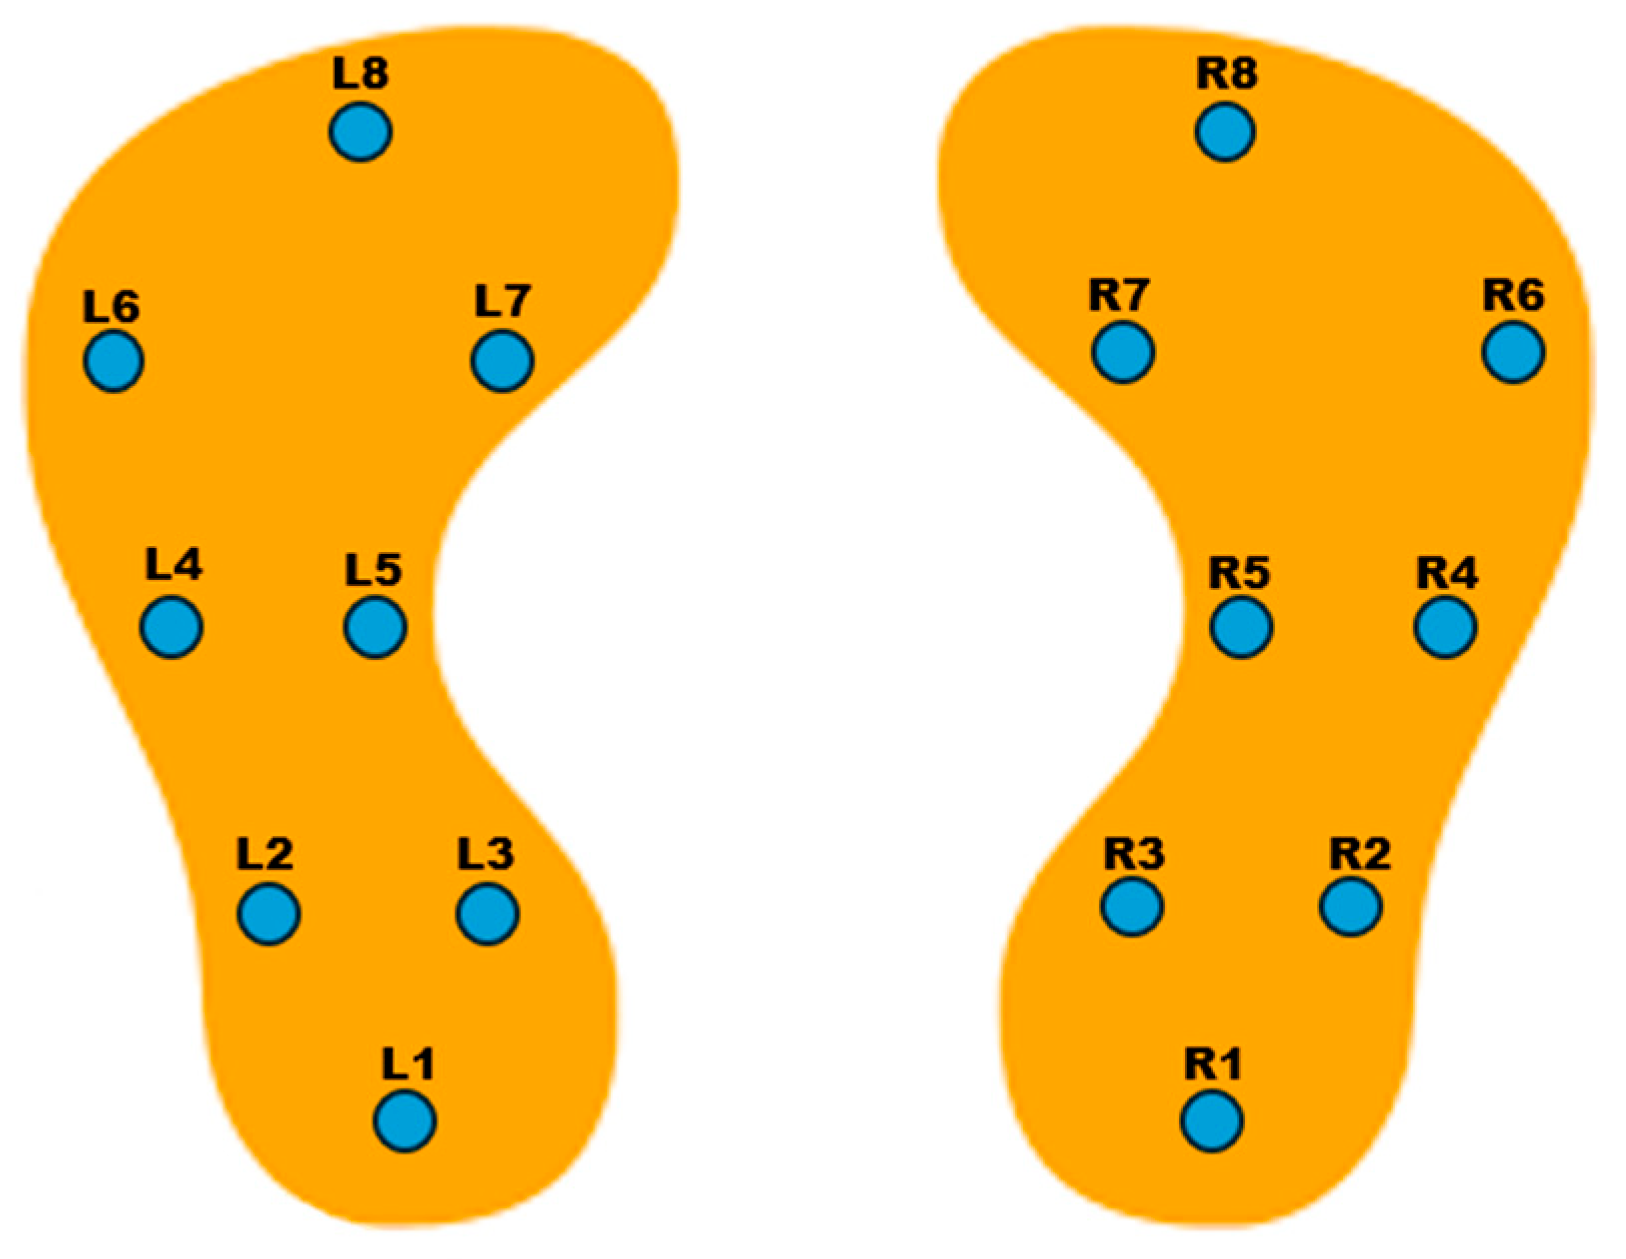
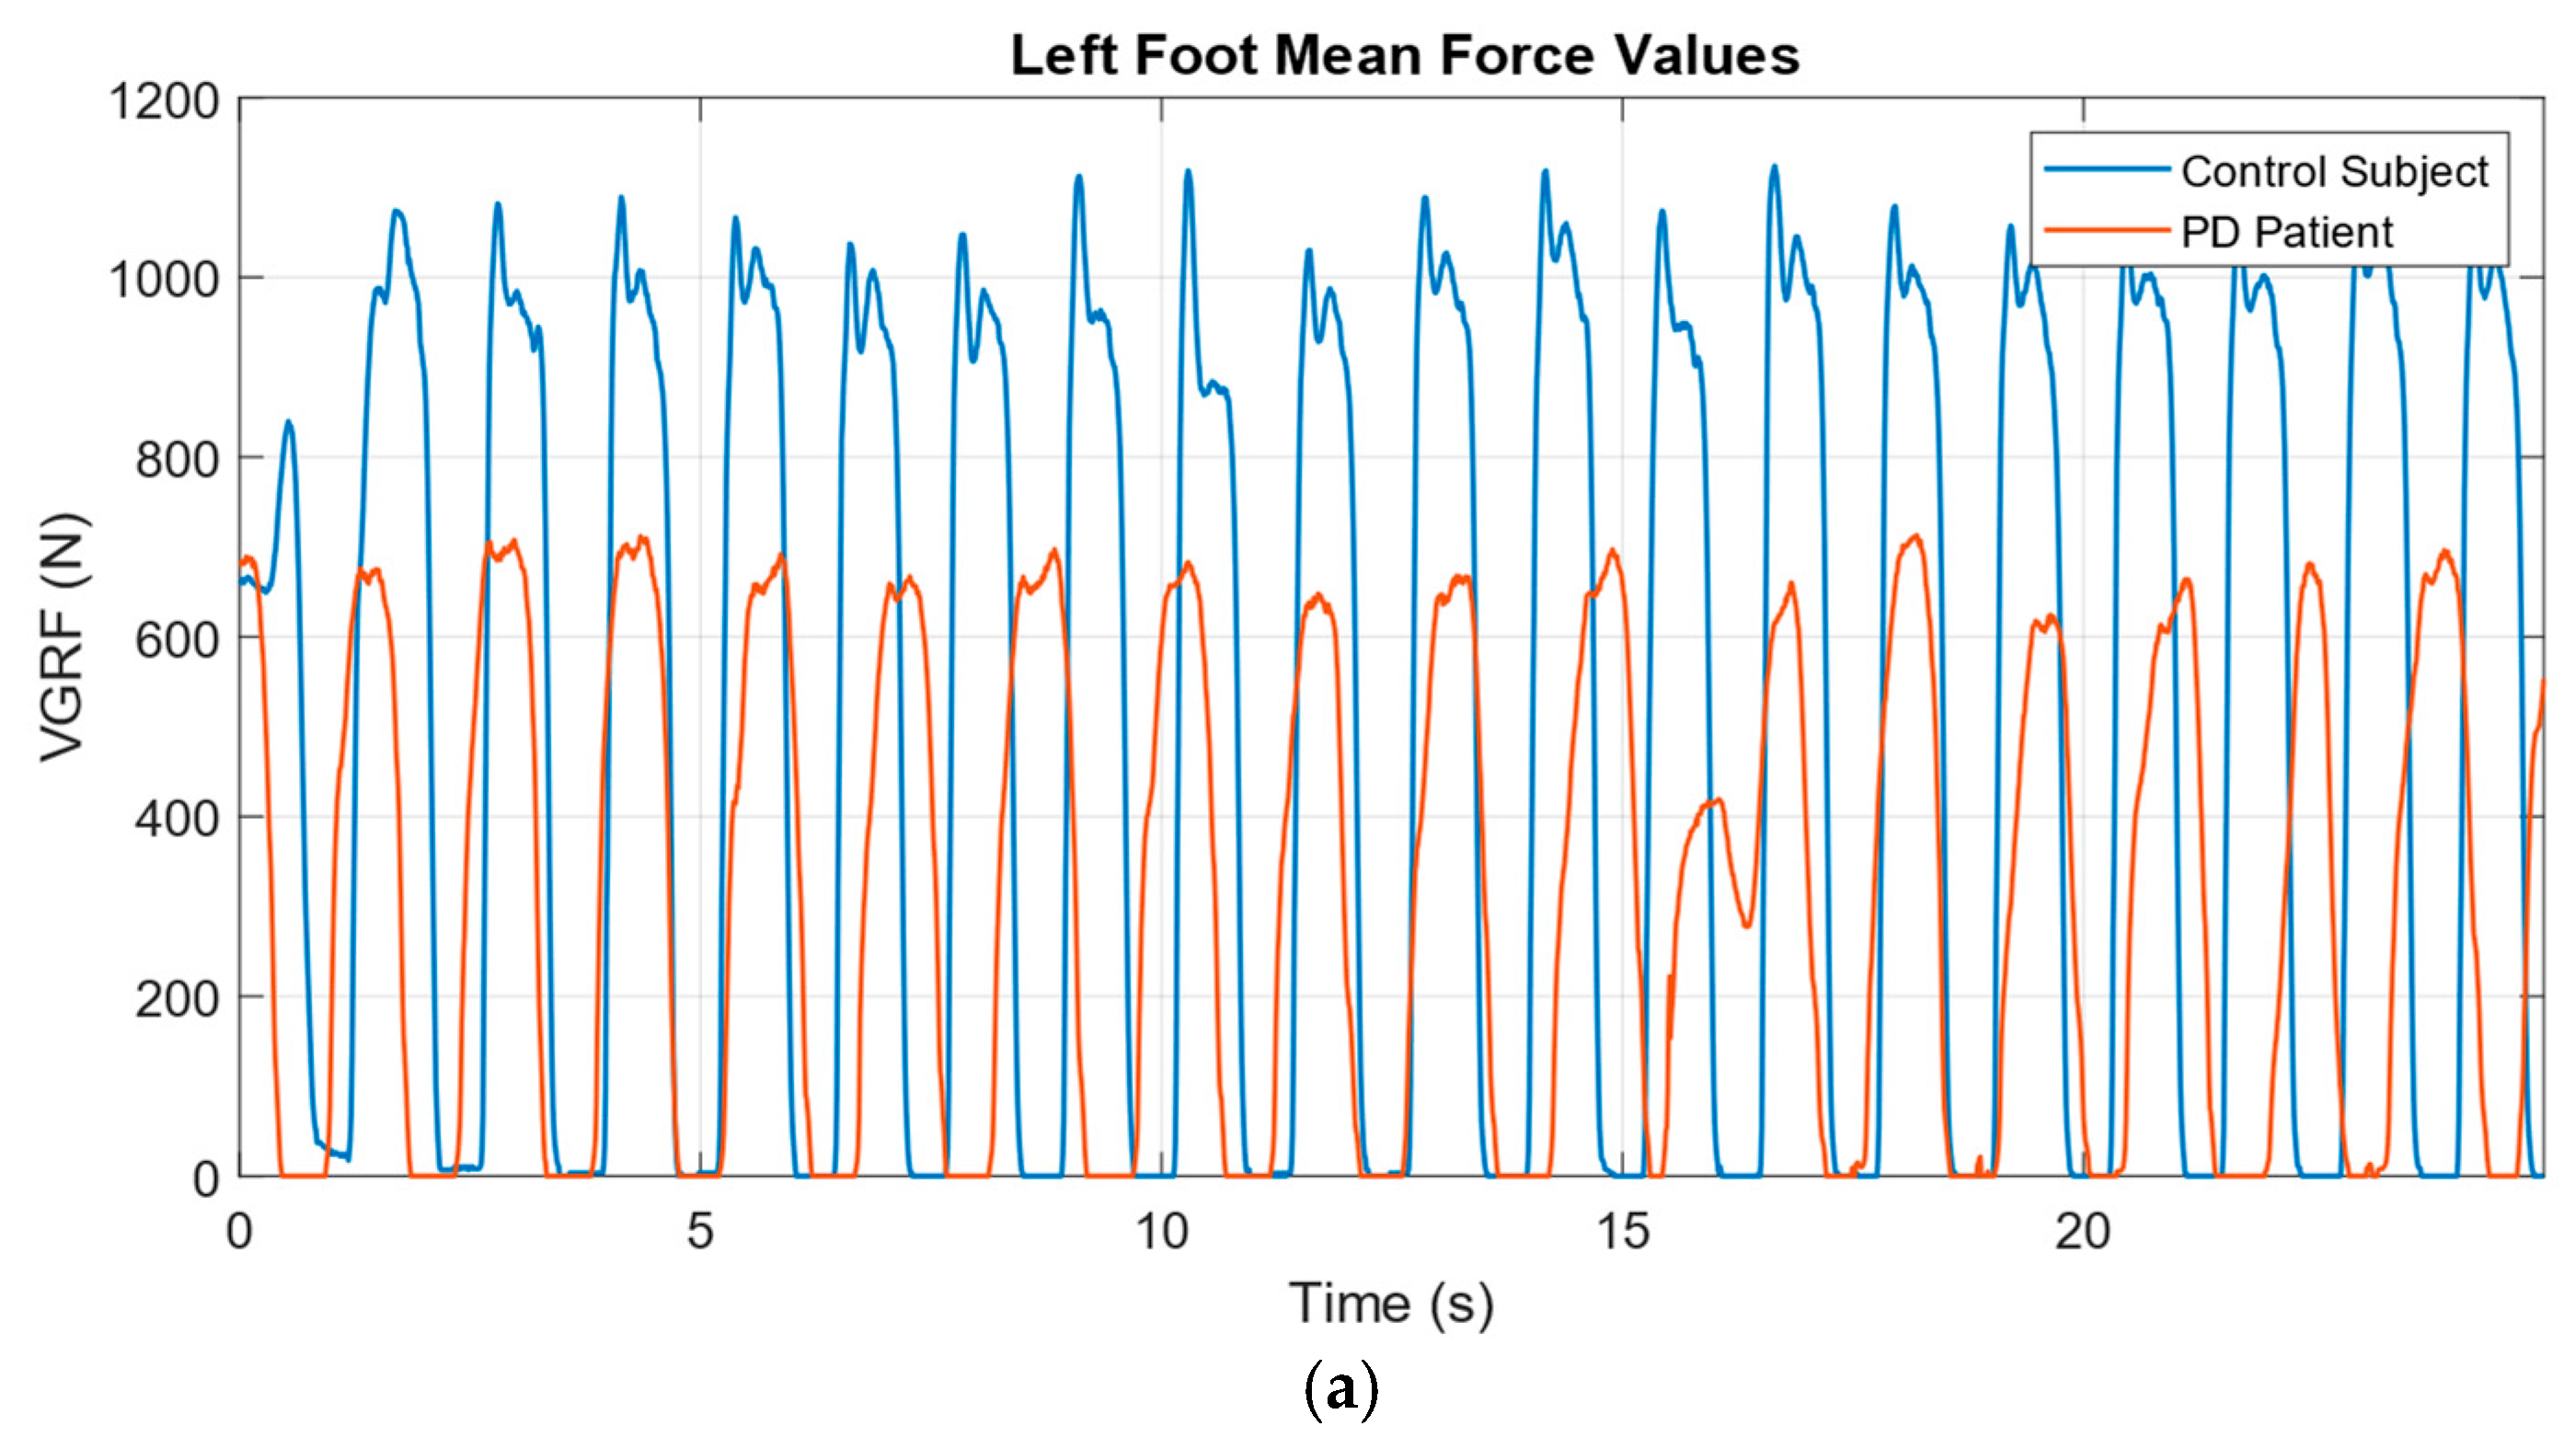
2.1. Dataset
2.2. Data Normalization and Windowing
2.3. Deep Learning
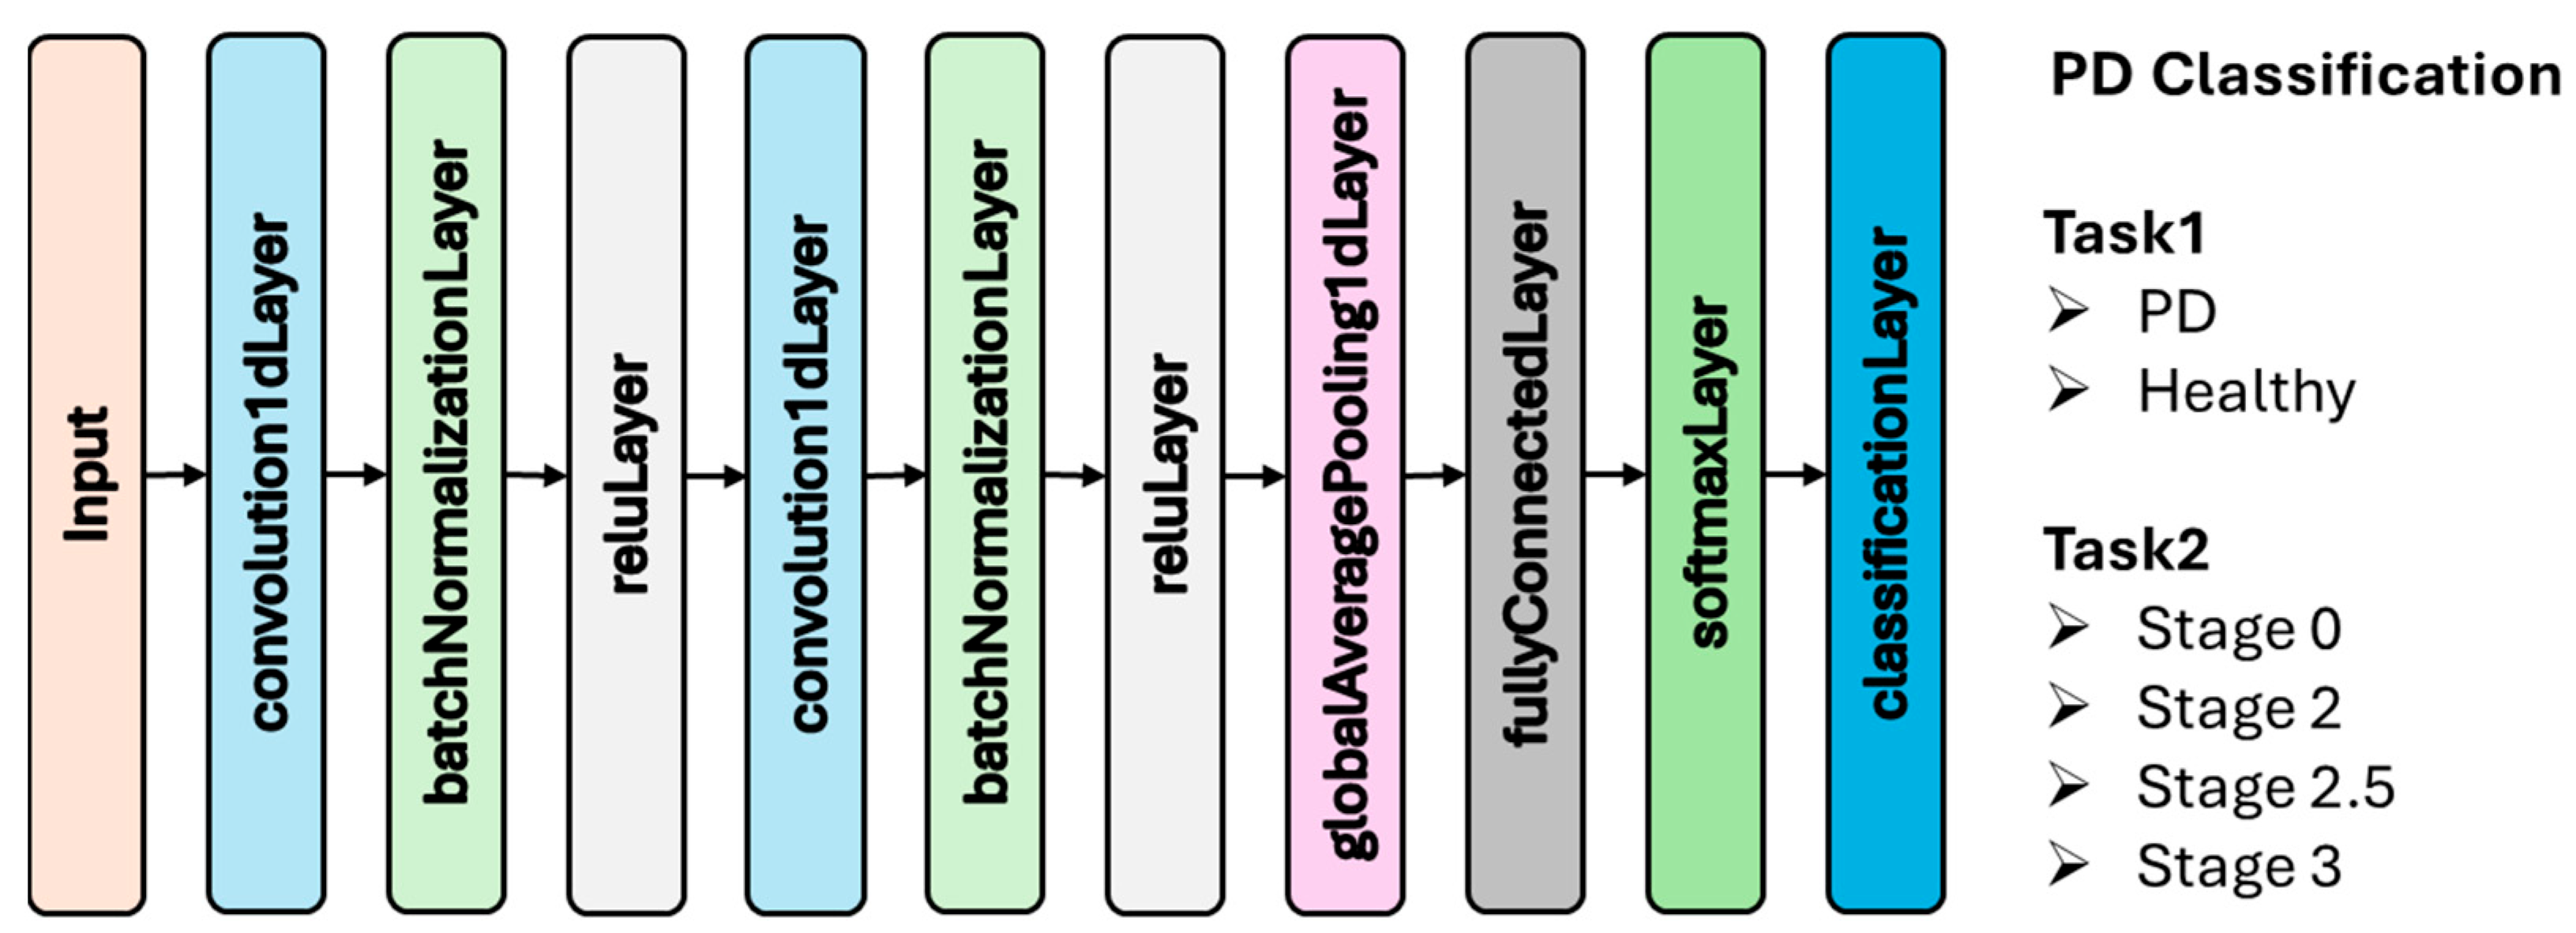
2.3.1. Convolutional Neural Network (CNN)
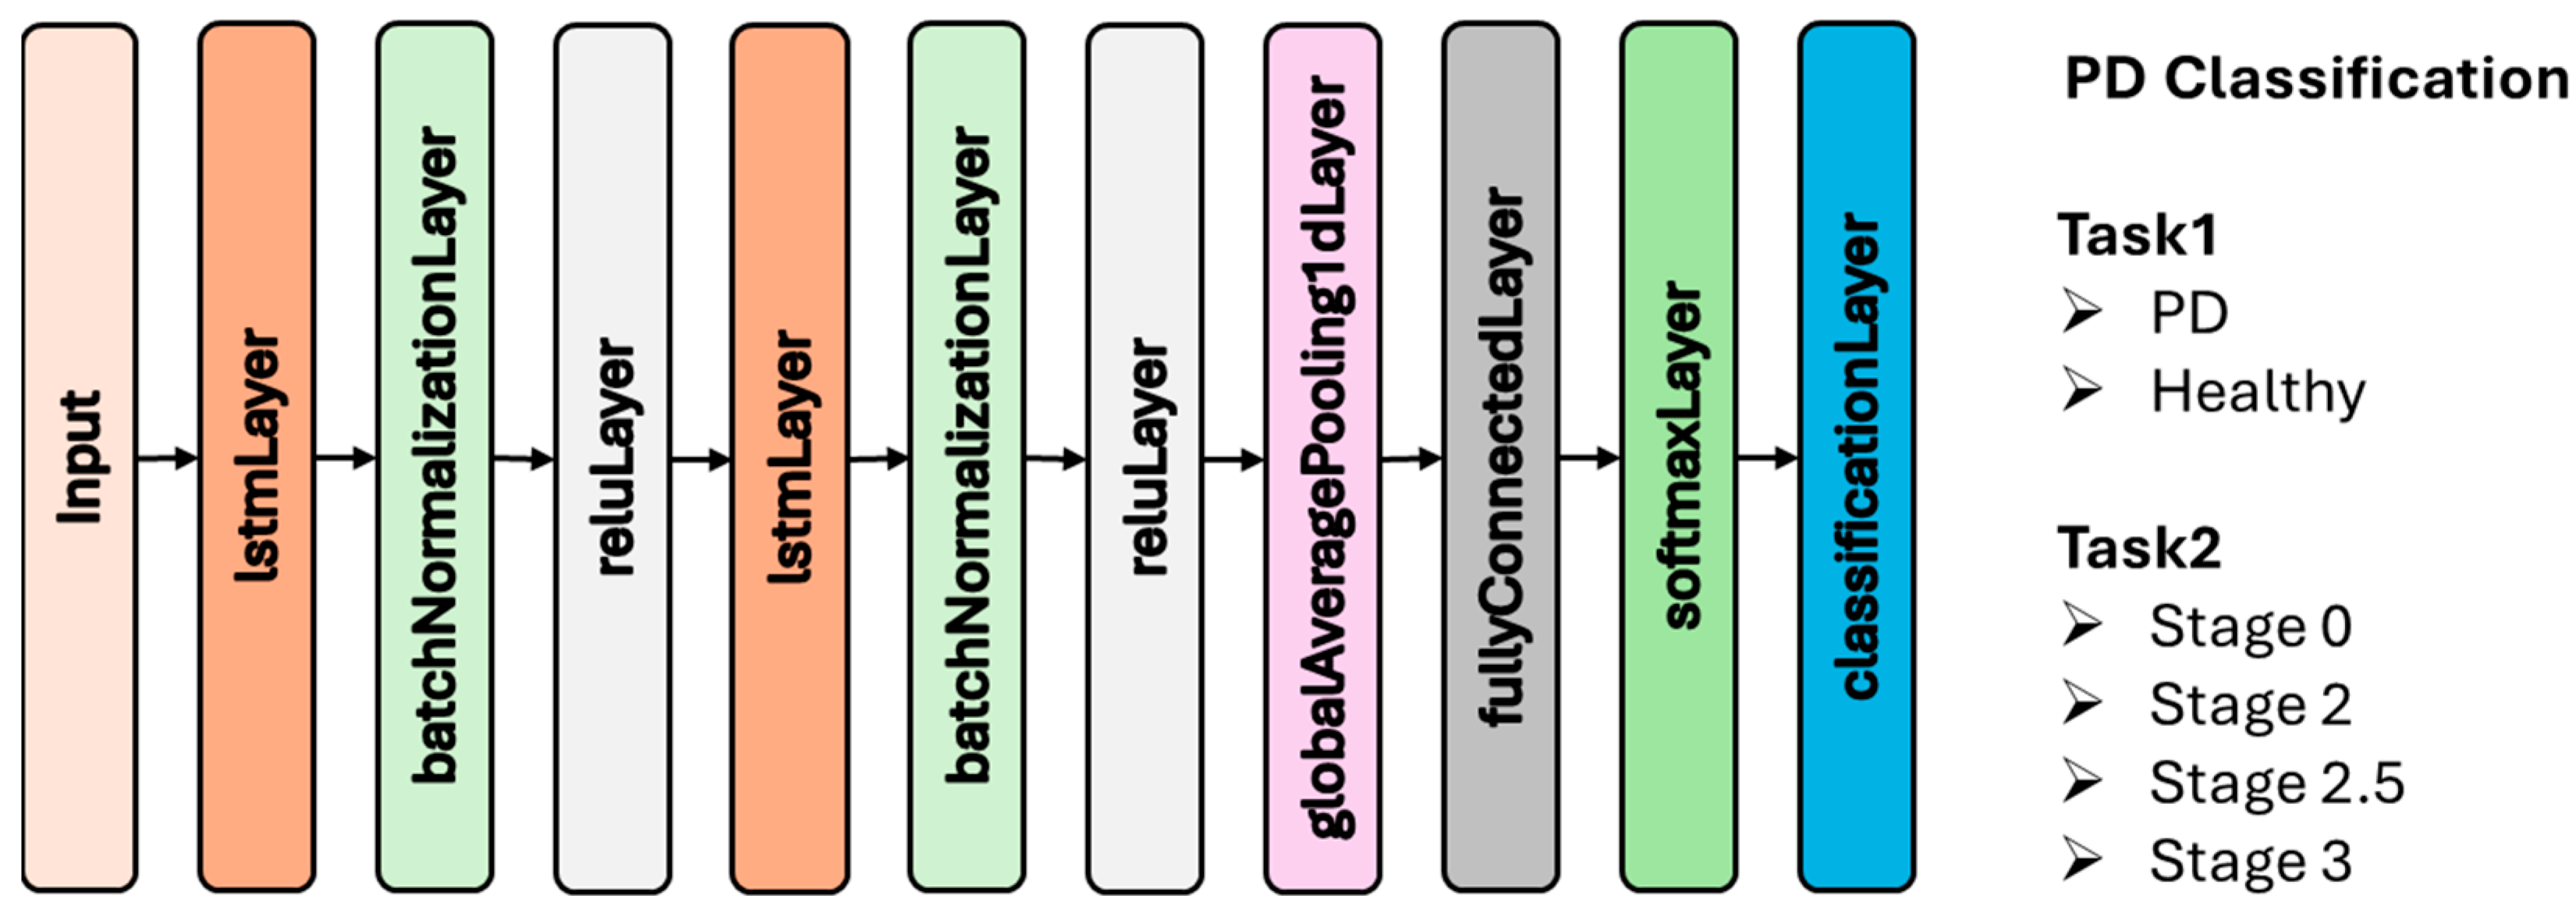
2.3.2. Long Short-Term Memory (LSTM)
2.4. Bayesian Optimization
- Building a posterior distribution over using observations
- Selecting the next point by maximizing the acquisition function:
2.5. Performance Evaluation
3. Results
4. Discussion
| References | Feature Extraction Method | Machine/Deep Learning Model | Performance |
|---|---|---|---|
| [11] | VMD based 5 statistical features | CNN | The model achieved an accuracy of 99.1%, with sensitivity and specificity both reaching 100%. |
| [46] | 7 statistical parameters belonging to the time and frequency domain | CNN | The models achieved AUC scores between 0.65 and 0.94, with sensitivity ranging from 52% to 92%, specificity from 51% to 95%, and precision between 30% and 62%. |
| [52] | Spatiotemporal gait features | Random Forest | The Random Forest model achieved 76% accuracy, 79% sensitivity, 70% specificity, %79 F1 score, and an AUC of 0.75. |
| [51] | Static and Dynamic Spatiotemporal Gait 66 Features | FNN | The FNN model attained an overall accuracy of 99.11%, along with a recall of 98.78%, a precision of 99.96%, and an F1-score of 99.23%. |
| [47] | Spatiotemporal gait features, polynomial transformation, 3D representation | PD-ResNet | The model achieved 95.51% accuracy overall, and 92.03% accuracy in classifying PD severity, with precision, recall, specificity, and F1-scores above 90% in both tasks. |
| [48] | Multiple Feature Evaluation Approach | Darknet CNN | The proposed DarkNet-CNN model achieved outstanding performance with 97.54% accuracy, 94.35% sensitivity, 89.67% specificity, 92.45% precision, and an F1-score of 91.45%. |
| [49] | Force-domain statistical features | CNN | The proposed method achieved up to 97.32% accuracy with XGBoost and 98.41% with deep learning. |
| [50] | Gait signals | LSTM | The Adam-optimized LSTM achieved 98.6% accuracy for binary classification and 96.6% for multi-class classification. |
| This Study | Gait signals | LSTM and CNN | The LSTM model, optimized via Bayesian optimization, achieved 99.42% accuracy for binary classification and 98.24% accuracy for multi-class classification of PD severity. CNN and LSTM architectures were evaluated across different time windows ranging from 5 to 25 s. |
5. Conclusions
Author Contributions
Funding
Institutional Review Board Statement
Informed Consent Statement
Data Availability Statement
Acknowledgments
Conflicts of Interest
Abbreviations
| AUC | Area Under the Receiver Operating Characteristic Curve |
| CNN | Convolutional Neural Network |
| DL | Deep Learning |
| EMD | Empirical Mode Decomposition |
| FFT | Fast Fourier Transform |
| HY | Hoehn and Yahr |
| LBP | Local Binary Pattern |
| LS-SVM | Least Squares Support Vector Machines |
| LSTM | Long Short-Term Memory |
| ML | Machine Learning |
| PCA | Principal Component Analysis |
| PD | Parkinson’s Disease |
| UPDRS | Unified Parkinson’s Disease Rating Scale |
| VGRF | Vertical Ground Reaction Force |
References
- Dorsey, E.R.; Elbaz, A.; Nichols, E.; Abbasi, N.; Abd-Allah, F.; Abdelalim, A.; Adsuar, J.C.; Ansha, M.G.; Brayne, C.; Choi, J.-Y.J. Global, regional, and national burden of Parkinson’s disease, 1990–2016: A systematic analysis for the Global Burden of Disease Study 2016. Lancet Neurol. 2018, 17, 939–953. [Google Scholar] [CrossRef]
- Tysnes, O.-B.; Storstein, A. Epidemiology of Parkinson’s disease. J. Neural Transm. 2017, 124, 901–905. [Google Scholar] [CrossRef]
- Goetz, C.G.; Tilley, B.C.; Shaftman, S.R.; Stebbins, G.T.; Fahn, S.; Martinez-Martin, P.; Poewe, W.; Sampaio, C.; Stern, M.B.; Dodel, R. Movement Disorder Society-sponsored revision of the Unified Parkinson’s Disease Rating Scale (MDS-UPDRS): Scale presentation and clinimetric testing results. Mov. Disord. Off. J. Mov. Disord. Soc. 2008, 23, 2129–2170. [Google Scholar] [CrossRef]
- Hoehn, M.M.; Yahr, M.D. Parkinsonism: Onset, progression, and mortality. Neurology 1967, 17, 427. [Google Scholar] [CrossRef]
- De Lau, L.M.; Breteler, M.M. Epidemiology of Parkinson’s disease. Lancet Neurol. 2006, 5, 525–535. [Google Scholar] [CrossRef]
- Krupička, R.; Malá, C.; Neťuková, S.; Hubená, T.; Havlík, F.; Bezdicek, O.; Dušek, P.; Růžička, E. Impaired dual-task gait in Parkinson’s disease is associated with brain morphology changes. J. Neural Transm. 2024, 131, 1389–1395. [Google Scholar] [CrossRef]
- Özbilgin, F.; Kurnaz, C.; Aydın, E. Non-invasive coronary artery disease identification through the iris and bio-demographic health profile features using stacking learning. Image Vis. Comput. 2024, 146, 105046. [Google Scholar] [CrossRef]
- Ozbilgin, F.; Kurnaz, C. An alternative approach for determining the cholesterol level: Iris analysis. Int. J. Imaging Syst. Technol. 2022, 32, 1159–1171. [Google Scholar] [CrossRef]
- Özbilgin, F.; Kurnaz, C.; Aydın, E. Prediction of coronary artery disease using machine learning techniques with iris analysis. Diagnostics 2023, 13, 1081. [Google Scholar] [CrossRef] [PubMed]
- Meral, M.; Ozbilgin, F.; Durmus, F. Fine-Tuned Machine Learning Classifiers for Diagnosing Parkinson’s Disease Using Vocal Characteristics: A Comparative Analysis. Diagnostics 2025, 15, 645. [Google Scholar] [CrossRef]
- Priya, S.J.; Durai, C.A.D.; Subathra, M.; George, S.T.; Jeyabose, A. Automated Parkinson’s Disease Diagnosis Using Decomposition Techniques and Deep Learning for Accurate Gait Analysis. IEEE Access 2025, 13, 74078–74091. [Google Scholar] [CrossRef]
- Białek, K.; Potulska-Chromik, A.; Jakubowski, J.; Nojszewska, M.; Kostera-Pruszczyk, A. Analysis of Handwriting for Recognition of Parkinson’s Disease: Current State and New Study. Electronics 2024, 13, 3962. [Google Scholar] [CrossRef]
- Jang, S.-W.; Lee, S.-H. Neuro-fuzzy system for detecting PD patients based on Euclid distance, FFT, and PCA. J. Mech. Med. Biol. 2020, 20, 2040017. [Google Scholar] [CrossRef]
- Wu, Y.; Krishnan, S. Statistical analysis of gait rhythm in patients with Parkinson’s disease. IEEE Trans. Neural Syst. Rehabil. Eng. 2009, 18, 150–158. [Google Scholar] [CrossRef] [PubMed]
- Lee, S.-H.; Lim, J.S. Parkinson’s disease classification using gait characteristics and wavelet-based feature extraction. Expert Syst. Appl. 2012, 39, 7338–7344. [Google Scholar] [CrossRef]
- Daliri, M.R. Chi-square distance kernel of the gaits for the diagnosis of Parkinson’s disease. Biomed. Signal Process. Control 2013, 8, 66–70. [Google Scholar] [CrossRef]
- Zeng, W.; Yuan, C.; Wang, Q.; Liu, F.; Wang, Y. Classification of gait patterns between patients with Parkinson’s disease and healthy controls using phase space reconstruction (PSR), empirical mode decomposition (EMD) and neural networks. Neural Netw. 2019, 111, 64–76. [Google Scholar] [CrossRef] [PubMed]
- Ertuğrul, Ö.F.; Kaya, Y.; Tekin, R.; Almalı, M.N. Detection of Parkinson’s disease by shifted one dimensional local binary patterns from gait. Expert Syst. Appl. 2016, 56, 156–163. [Google Scholar] [CrossRef]
- Nandy, A. Statistical methods for analysis of Parkinson’s disease gait pattern and classification. Multimed. Tools Appl. 2019, 78, 19697–19734. [Google Scholar] [CrossRef]
- Yurdakul, O.C.; Subathra, M.; George, S.T. detection of parkinson’s disease from gait using neighborhood representation local binary patterns. Biomed. Signal Process. Control 2020, 62, 102070. [Google Scholar] [CrossRef]
- Jane, Y.N.; Nehemiah, H.K.; Arputharaj, K. A Q-backpropagated time delay neural network for diagnosing severity of gait disturbances in Parkinson’s disease. J. Biomed. Inform. 2016, 60, 169–176. [Google Scholar] [CrossRef]
- El Maachi, I.; Bilodeau, G.-A.; Bouachir, W. Deep 1D-Convnet for accurate Parkinson disease detection and severity prediction from gait. Expert Syst. Appl. 2020, 143, 113075. [Google Scholar] [CrossRef]
- Zhao, A.; Qi, L.; Li, J.; Dong, J.; Yu, H. A hybrid spatio-temporal model for detection and severity rating of Parkinson’s disease from gait data. Neurocomputing 2018, 315, 1–8. [Google Scholar] [CrossRef]
- Aşuroğlu, T.; Oğul, H. A deep learning approach for parkinson’s disease severity assessment. Health Technol. 2022, 12, 943–953. [Google Scholar] [CrossRef]
- Goldberger, A.L.; Amaral, L.A.; Glass, L.; Hausdorff, J.M.; Ivanov, P.C.; Mark, R.G.; Mietus, J.E.; Moody, G.B.; Peng, C.-K.; Stanley, H.E. PhysioBank, PhysioToolkit, and PhysioNet: Components of a new research resource for complex physiologic signals. Circulation 2000, 101, e215–e220. [Google Scholar] [CrossRef]
- Navita; Mittal, P.; Sharma, Y.K.; Rai, A.K.; Simaiya, S.; Lilhore, U.K.; Kumar, V. Gait-based Parkinson’s disease diagnosis and severity classification using force sensors and machine learning. Sci. Rep. 2025, 15, 328. [Google Scholar]
- Setiawan, F.; Lin, C.-W. Implementation of a deep learning algorithm based on vertical ground reaction force time–frequency features for the detection and severity classification of Parkinson’s disease. Sensors 2021, 21, 5207. [Google Scholar] [CrossRef]
- Patro, S.; Sahu, K.K. Normalization: A preprocessing stage. arXiv 2015, arXiv:1503.06462. [Google Scholar] [CrossRef]
- O’shea, K.; Nash, R. An introduction to convolutional neural networks. arXiv 2015, arXiv:1511.08458. [Google Scholar]
- Wu, J. Introduction to convolutional neural networks. Natl. Key Lab. Nov. Softw. Technol. Nanjing Univ. China 2017, 5, 495. [Google Scholar]
- Graves, A. Long short-term memory. In Supervised Sequence Labelling with Recurrent Neural Networks; Springer: Berlin/Heidelberg, Germany, 2012; pp. 37–45. [Google Scholar]
- Hochreiter, S.; Schmidhuber, J. Long short-term memory. Neural Comput. 1997, 9, 1735–1780. [Google Scholar] [CrossRef]
- Shahriari, B.; Swersky, K.; Wang, Z.; Adams, R.P.; De Freitas, N. Taking the human out of the loop: A review of Bayesian optimization. Proc. IEEE 2015, 104, 148–175. [Google Scholar] [CrossRef]
- Snoek, J.; Larochelle, H.; Adams, R.P. Practical bayesian optimization of machine learning algorithms. arXiv 2012, arXiv:1206.2944. [Google Scholar] [CrossRef]
- Karakaya, J. Evaluation of binary diagnostic tests accuracy for medical researches. Turk. J. Biochem. 2021, 46, 103–113. [Google Scholar] [CrossRef]
- Narkhede, S. Understanding auc-roc curve. Towards Data Sci. 2018, 26, 220–227. [Google Scholar]
- Hossin, M.; Sulaiman, M.N. A review on evaluation metrics for data classification evaluations. Int. J. Data Min. Knowl. Manag. Process 2015, 5, 1–11. [Google Scholar]
- Jankovic, J. Parkinson’s disease: Clinical features and diagnosis. J. Neurol. Neurosurg. Psychiatry 2008, 79, 368–376. [Google Scholar] [CrossRef]
- Morris, M.E. Movement disorders in people with Parkinson disease: A model for physical therapy. Phys. Ther. 2000, 80, 578–597. [Google Scholar] [CrossRef]
- JM, H. Gait variability and basal ganglia disorders: Stride-to-stride variations of gait cycle timing in Parkinson’s disease and Huntington’s disease. Mov. Disord. 1998, 13, 428–437. [Google Scholar]
- Toledo, S. Effect of gait speed on gait rhythmicity in Parkinson’s disease: Variability of stride time and swing time respond differently. J. Neuroeng. Rehabil. 2005, 2, 23. [Google Scholar] [CrossRef]
- Del Din, S.; Godfrey, A.; Mazzà, C.; Lord, S.; Rochester, L. Free-living monitoring of Parkinson’s disease: Lessons from the field. Mov. Disord. 2016, 31, 1293–1313. [Google Scholar] [CrossRef]
- Rovini, E.; Maremmani, C.; Cavallo, F. Automated systems based on wearable sensors for the management of Parkinson’s disease at home: A systematic review. Telemed. e-Health 2019, 25, 167–183. [Google Scholar] [CrossRef] [PubMed]
- Rodríguez-Martín, D.; Cabestany, J.; Pérez-López, C.; Pie, M.; Calvet, J.; Samà, A.; Capra, C.; Català, A.; Rodríguez-Molinero, A. A new paradigm in Parkinson’s disease evaluation with wearable medical devices: A review of STAT-ON™. Front. Neurol. 2022, 13, 912343. [Google Scholar] [CrossRef]
- Rovini, E.; Maremmani, C.; Cavallo, F. How wearable sensors can support Parkinson’s disease diagnosis and treatment: A systematic review. Front. Neurosci. 2017, 11, 555. [Google Scholar] [CrossRef]
- Sigcha, L.; Borzì, L.; Olmo, G. Deep learning algorithms for detecting freezing of gait in Parkinson’s disease: A cross-dataset study. Expert Syst. Appl. 2024, 255, 124522. [Google Scholar] [CrossRef]
- Yang, X.; Ye, Q.; Cai, G.; Wang, Y.; Cai, G. PD-ResNet for classification of Parkinson’s disease from gait. IEEE J. Transl. Eng. Health Med. 2022, 10, 2200111. [Google Scholar] [CrossRef] [PubMed]
- Mary, G.; Suganthi, N. Detection of Parkinson’s Disease with Multiple Feature Extraction Models and Darknet CNN Classification. Comput. Syst. Sci. Eng. 2022, 43, 333–345. [Google Scholar] [CrossRef]
- Ma, Y.-W.; Chen, J.-L.; Chen, Y.-J.; Lai, Y.-H. Explainable deep learning architecture for early diagnosis of Parkinson’s disease. Soft Comput. 2023, 27, 2729–2738. [Google Scholar] [CrossRef]
- Balaji, E.; Brindha, D.; Vikrama, R. Automatic and non-invasive Parkinson’s disease diagnosis and severity rating using LSTM network. Appl. Soft Comput. 2021, 108, 107463. [Google Scholar]
- Srinivasan, S.; Ramadass, P.; Mathivanan, S.K.; Panneer Selvam, K.; Shivahare, B.D.; Shah, M.A. Detection of Parkinson disease using multiclass machine learning approach. Sci. Rep. 2024, 14, 13813. [Google Scholar] [CrossRef]
- Watts, J.; Niethammer, M.; Khojandi, A.; Ramdhani, R. Machine learning model comparison for freezing of gait prediction in advanced Parkinson’s disease. Front. Aging Neurosci. 2024, 16, 1431280. [Google Scholar] [CrossRef] [PubMed]


| Stage 0 | Stage 2 | Stage 2.5 | Stage 3 |
|---|---|---|---|
| 73 | 56 | 27 | 10 |
| Task | Window (s) | Model | Initial Learn Rate | Mini Batch Size | Num Filters | Filter Size | Hidden Size |
|---|---|---|---|---|---|---|---|
| PD Binary Classification | 5 | LSTM | 0.0010 | 32 | - | - | 64 |
| CNN | 0.0010 | 32 | 64 | 5 | - | ||
| 10 | LSTM | 0.0008 | 48 | - | - | 96 | |
| CNN | 0.0009 | 48 | 96 | 7 | - | ||
| 15 | LSTM | 0.0012 | 32 | - | - | 128 | |
| CNN | 0.0012 | 32 | 128 | 9 | - | ||
| 20 | LSTM | 0.0015 | 64 | - | - | 100 | |
| CNN | 0.0014 | 48 | 128 | 11 | - | ||
| 25 | LSTM | 0.0011 | 48 | - | - | 128 | |
| CNN | 0.0010 | 64 | 96 | 7 | - | ||
| PD Multi Class Classification | 5 | LSTM | 0.0013 | 32 | - | - | 80 |
| CNN | 0.0012 | 32 | 64 | 5 | - | ||
| 10 | LSTM | 0.0010 | 48 | - | - | 100 | |
| CNN | 0.0009 | 64 | 48 | 7 | - | ||
| 15 | LSTM | 0.0017 | 64 | - | - | 64 | |
| CNN | 0.0015 | 32 | 32 | 9 | - | ||
| 20 | LSTM | 0.0022 | 32 | - | - | 96 | |
| CNN | 0.0021 | 64 | 128 | 11 | - | ||
| 25 | LSTM | 0.0011 | 48 | - | - | 128 | |
| CNN | 0.0010 | 48 | 96 | 7 | - |
| Time Window (s) | Classifier | Accuracy | Precision | Recall | F1-Score | AUC |
|---|---|---|---|---|---|---|
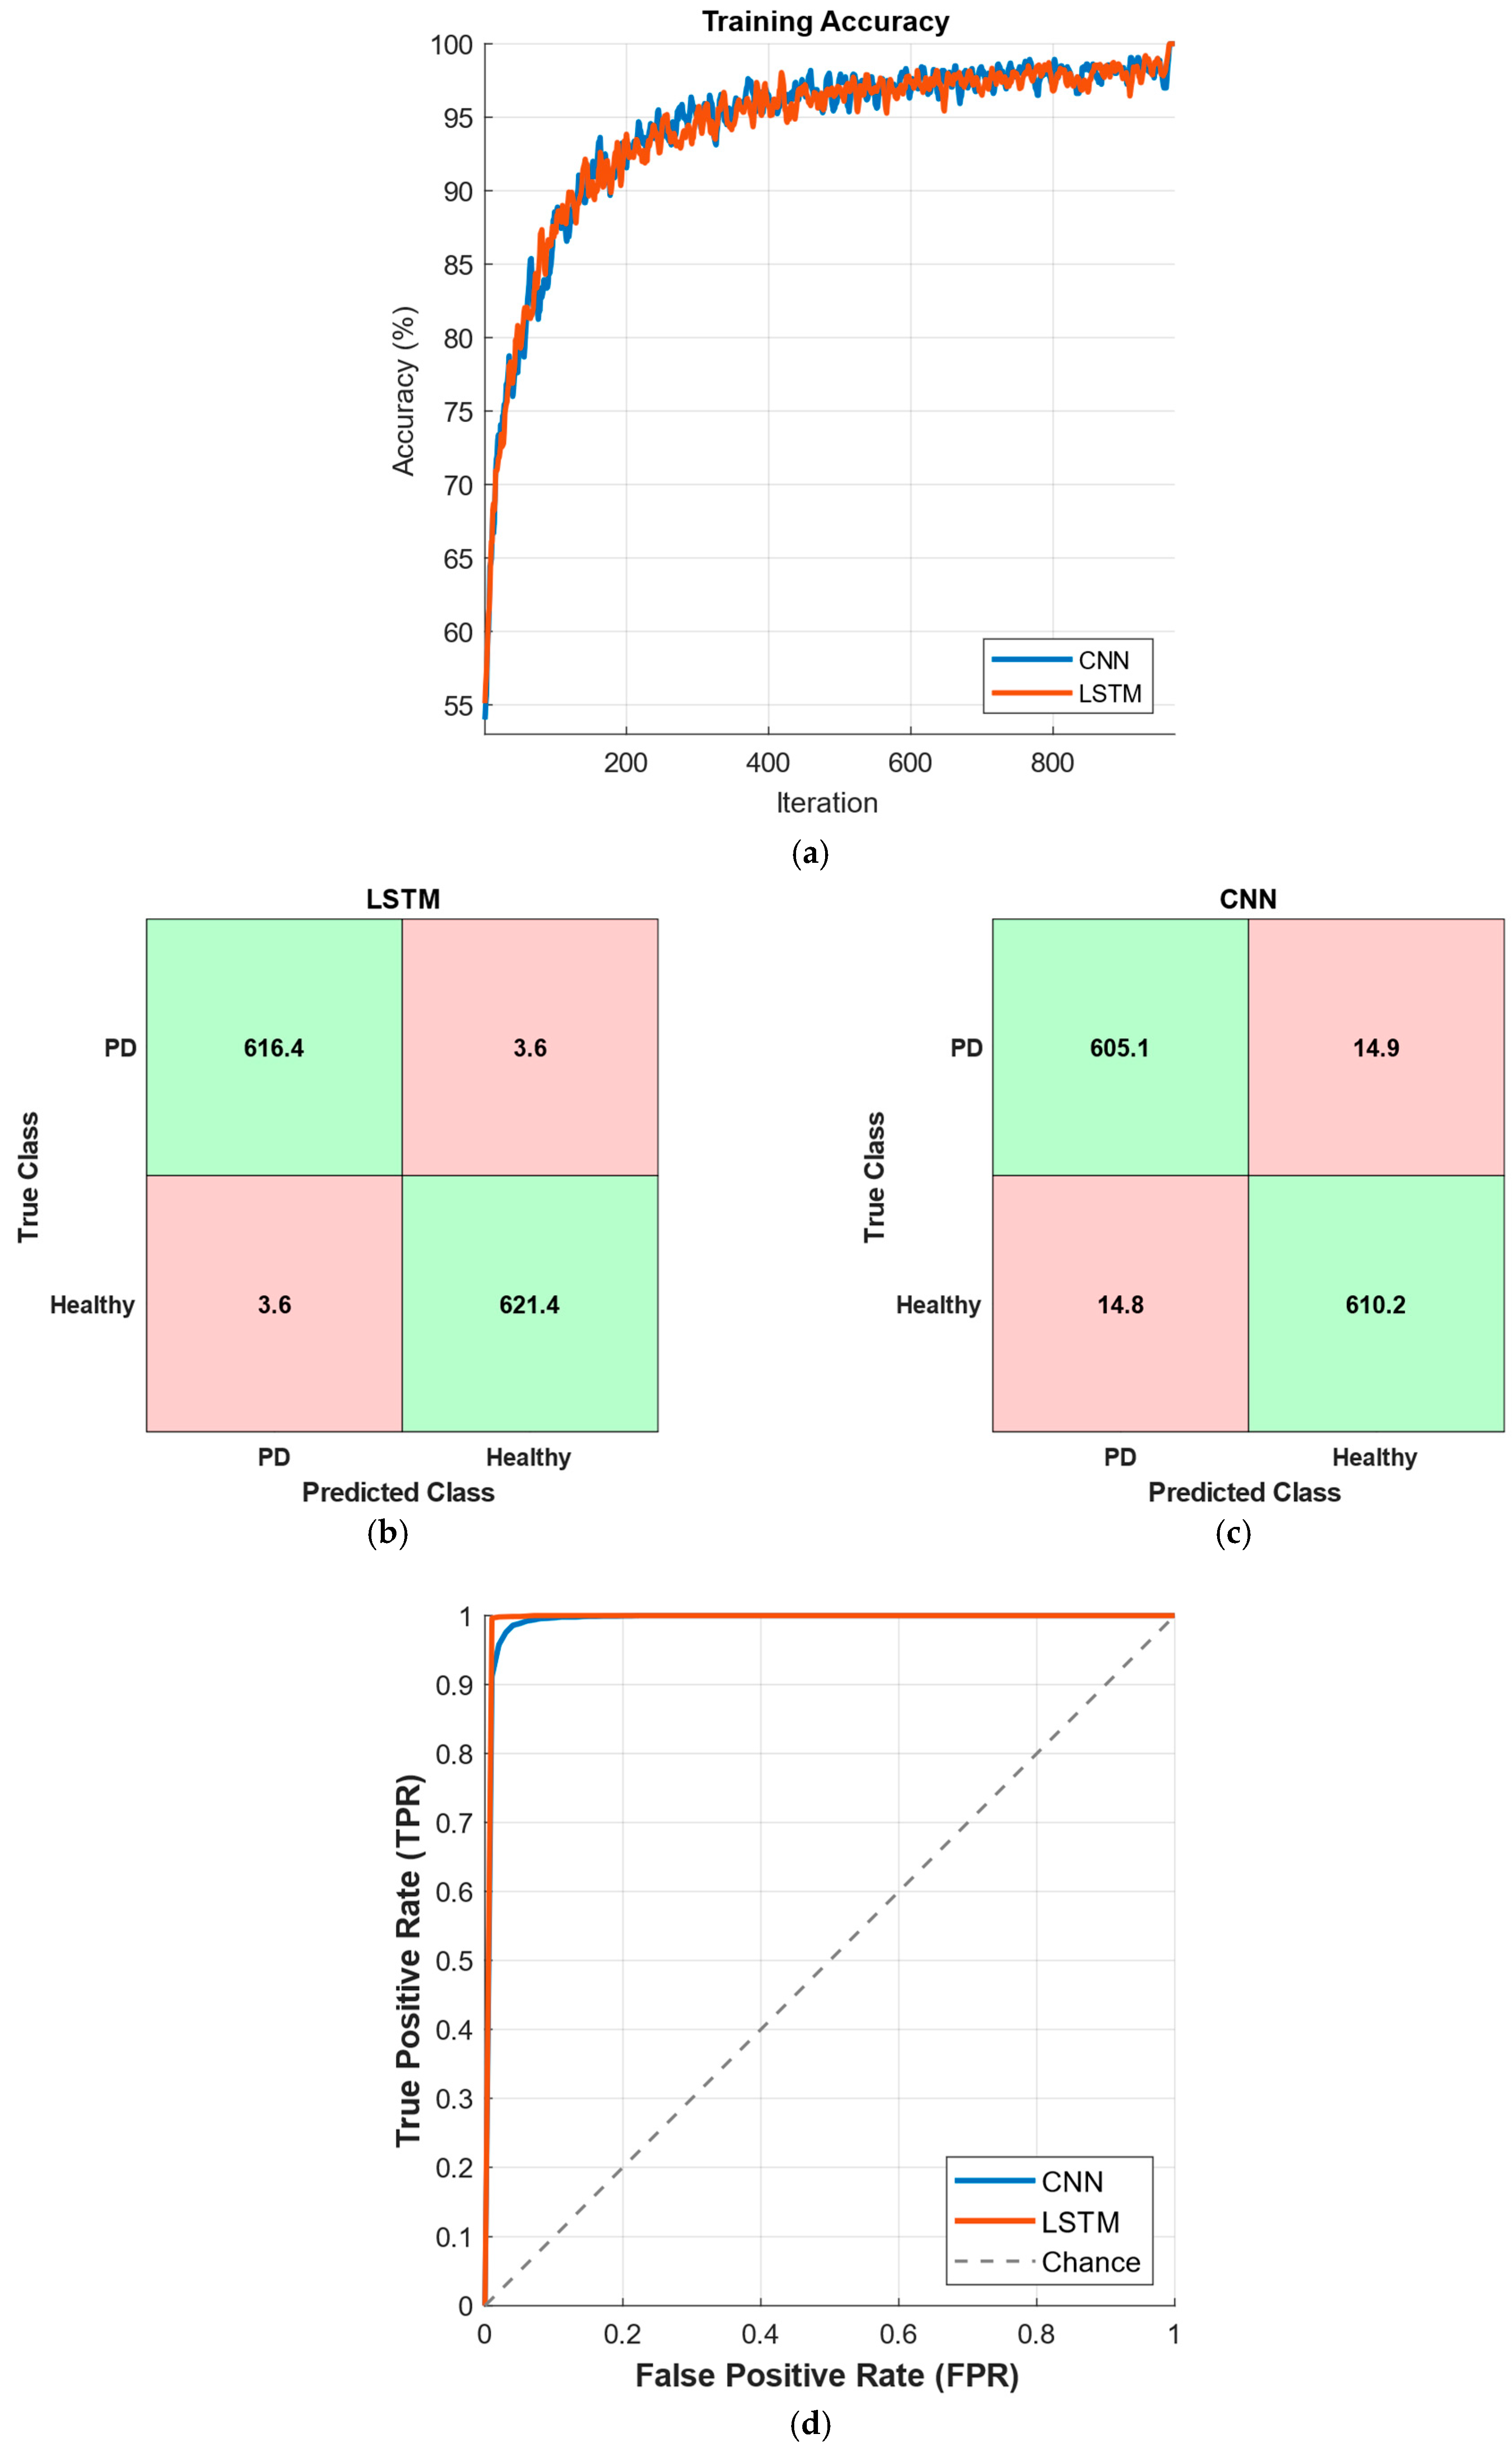
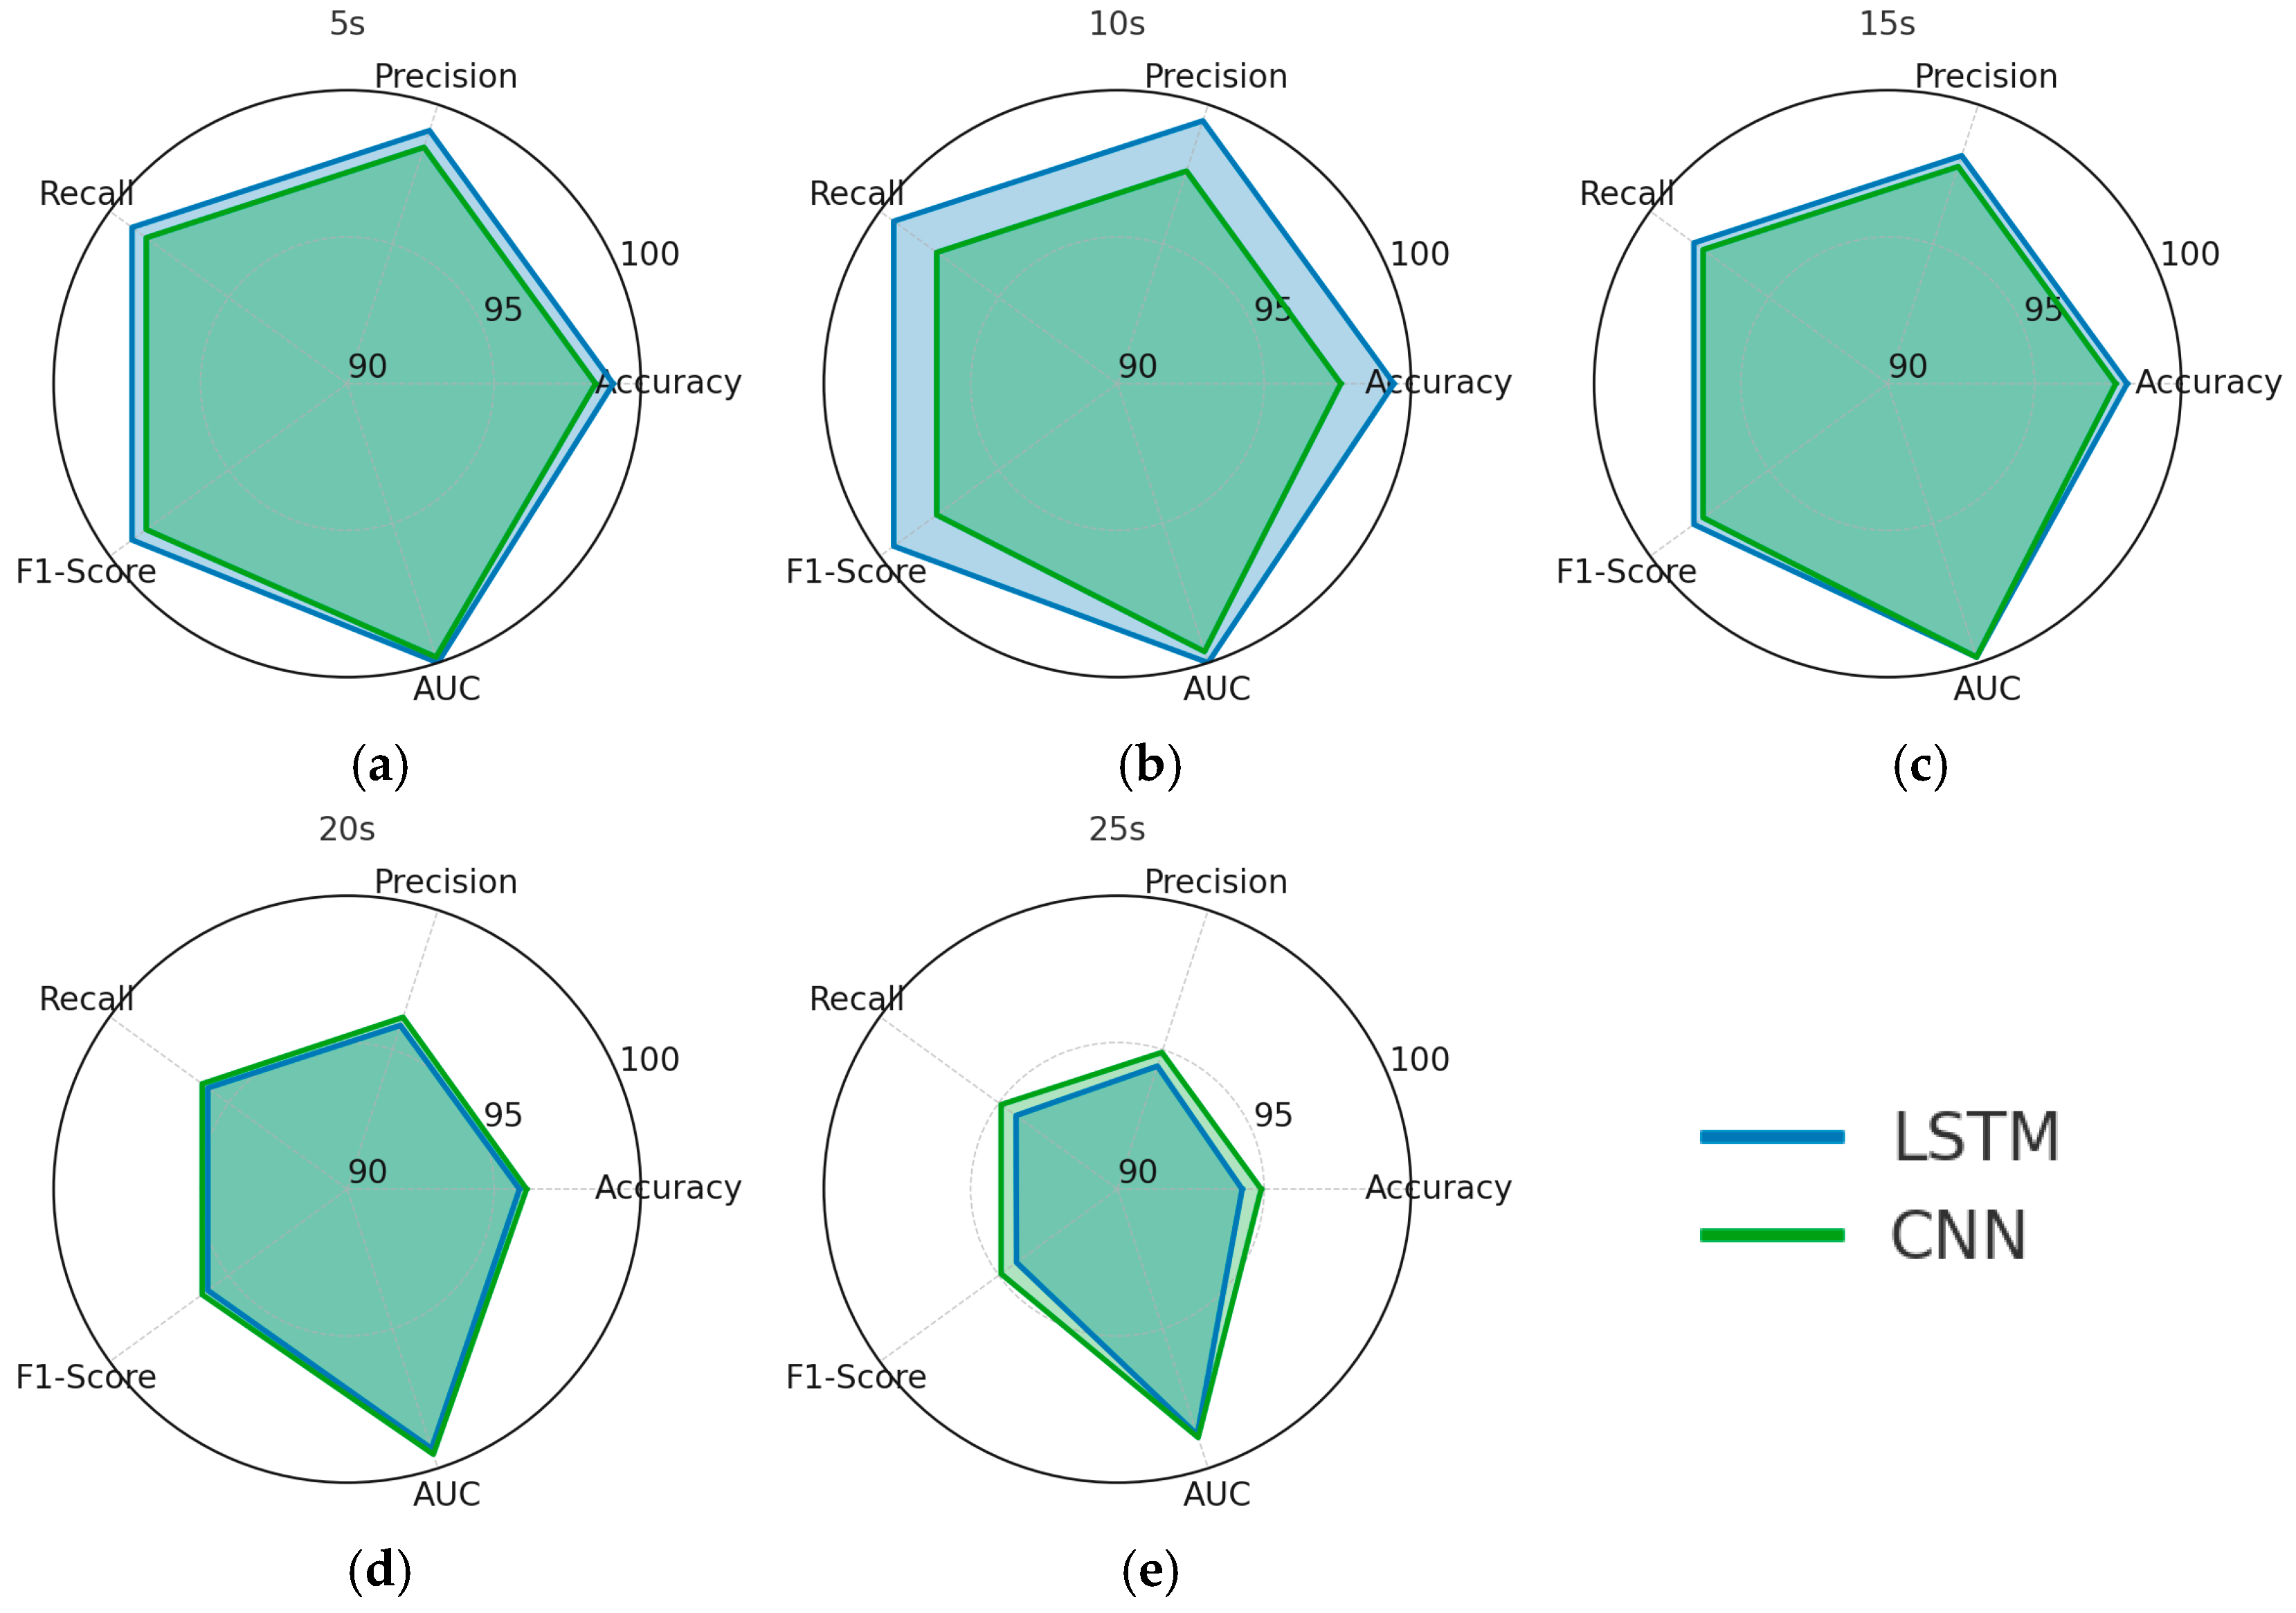
| 5 | LSTM | 99.06% ± 0.24 | 99.07% ± 0.24 | 99.06% ± 0.24 | 99.06% ± 0.24 | 1.000 ± 0.000 |
| CNN | 98.46% ± 0.54 | 98.47% ± 0.54 | 98.46% ± 0.54 | 98.46% ± 0.54 | 0.998 ± 0.001 | |
| 10 | LSTM | 99.42% ± 0.29 | 99.42% ± 0.29 | 99.42% ± 0.29 | 99.42% ± 0.29 | 1.000 ± 0.000 |
| CNN | 97.61% ± 1.16 | 97.62% ± 1.15 | 97.61% ± 1.16 | 97.61% ± 1.16 | 0.996 ± 0.003 | |
| 15 | LSTM | 98.16% ± 0.64 | 98.17% ± 0.64 | 98.16% ± 0.64 | 98.16% ± 0.64 | 0.998 ± 0.001 |
| CNN | 97.77% ± 0.66 | 97.78% ± 0.65 | 97.77% ± 0.66 | 97.77% ± 0.66 | 0.998 ± 0.001 | |
| 20 | LSTM | 95.87% ± 2.90 | 95.87% ± 2.90 | 95.87% ± 2.90 | 95.87% ± 2.90 | 0.993 ± 0.008 |
| CNN | 96.11% ± 1.27 | 96.16% ± 1.27 | 96.11% ± 1.27 | 96.11% ± 1.27 | 0.995 ± 0.003 | |
| 25 | LSTM | 94.25% ± 1.22 | 94.41% ± 1.26 | 94.27% ± 1.20 | 94.25% ± 1.21 | 0.988 ± 0.010 |
| CNN | 94.90% ± 2.19 | 94.90% ± 2.19 | 94.90% ± 2.19 | 94.90% ± 2.19 | 0.989 ± 0.007 |
| Time Window (s) | Classifier | Accuracy | Precision | Recall | F1-Score | AUC |
|---|---|---|---|---|---|---|
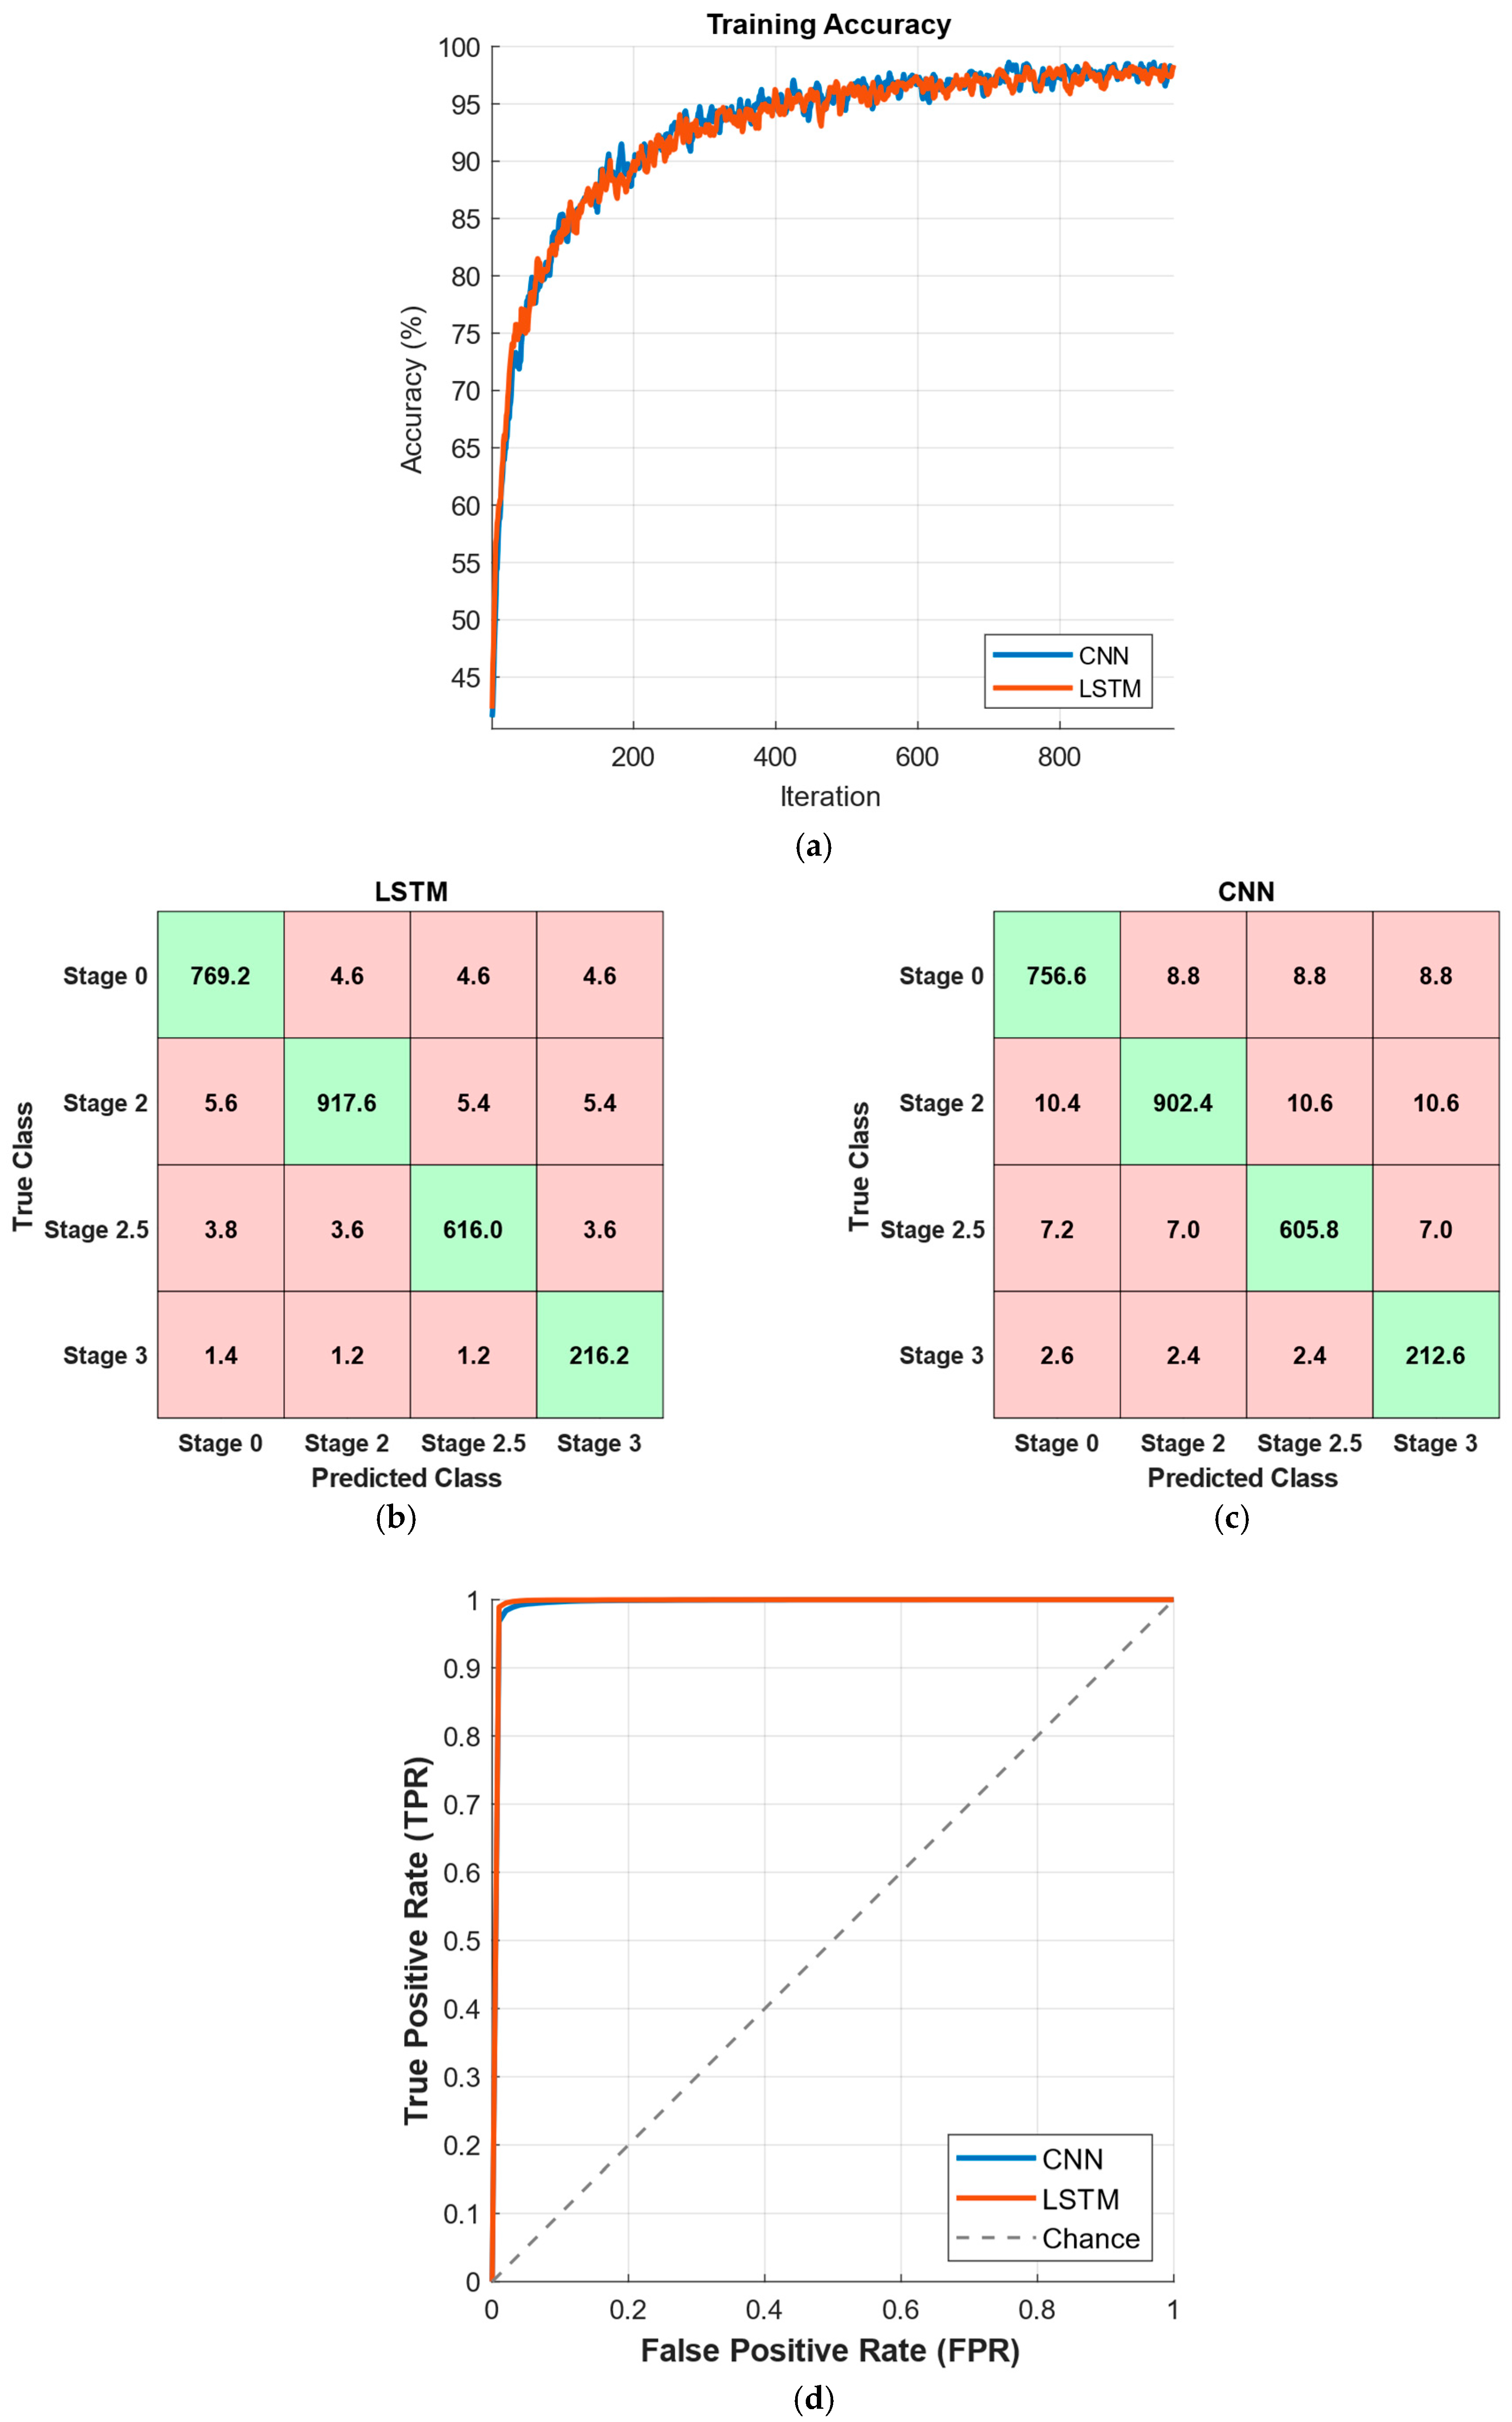
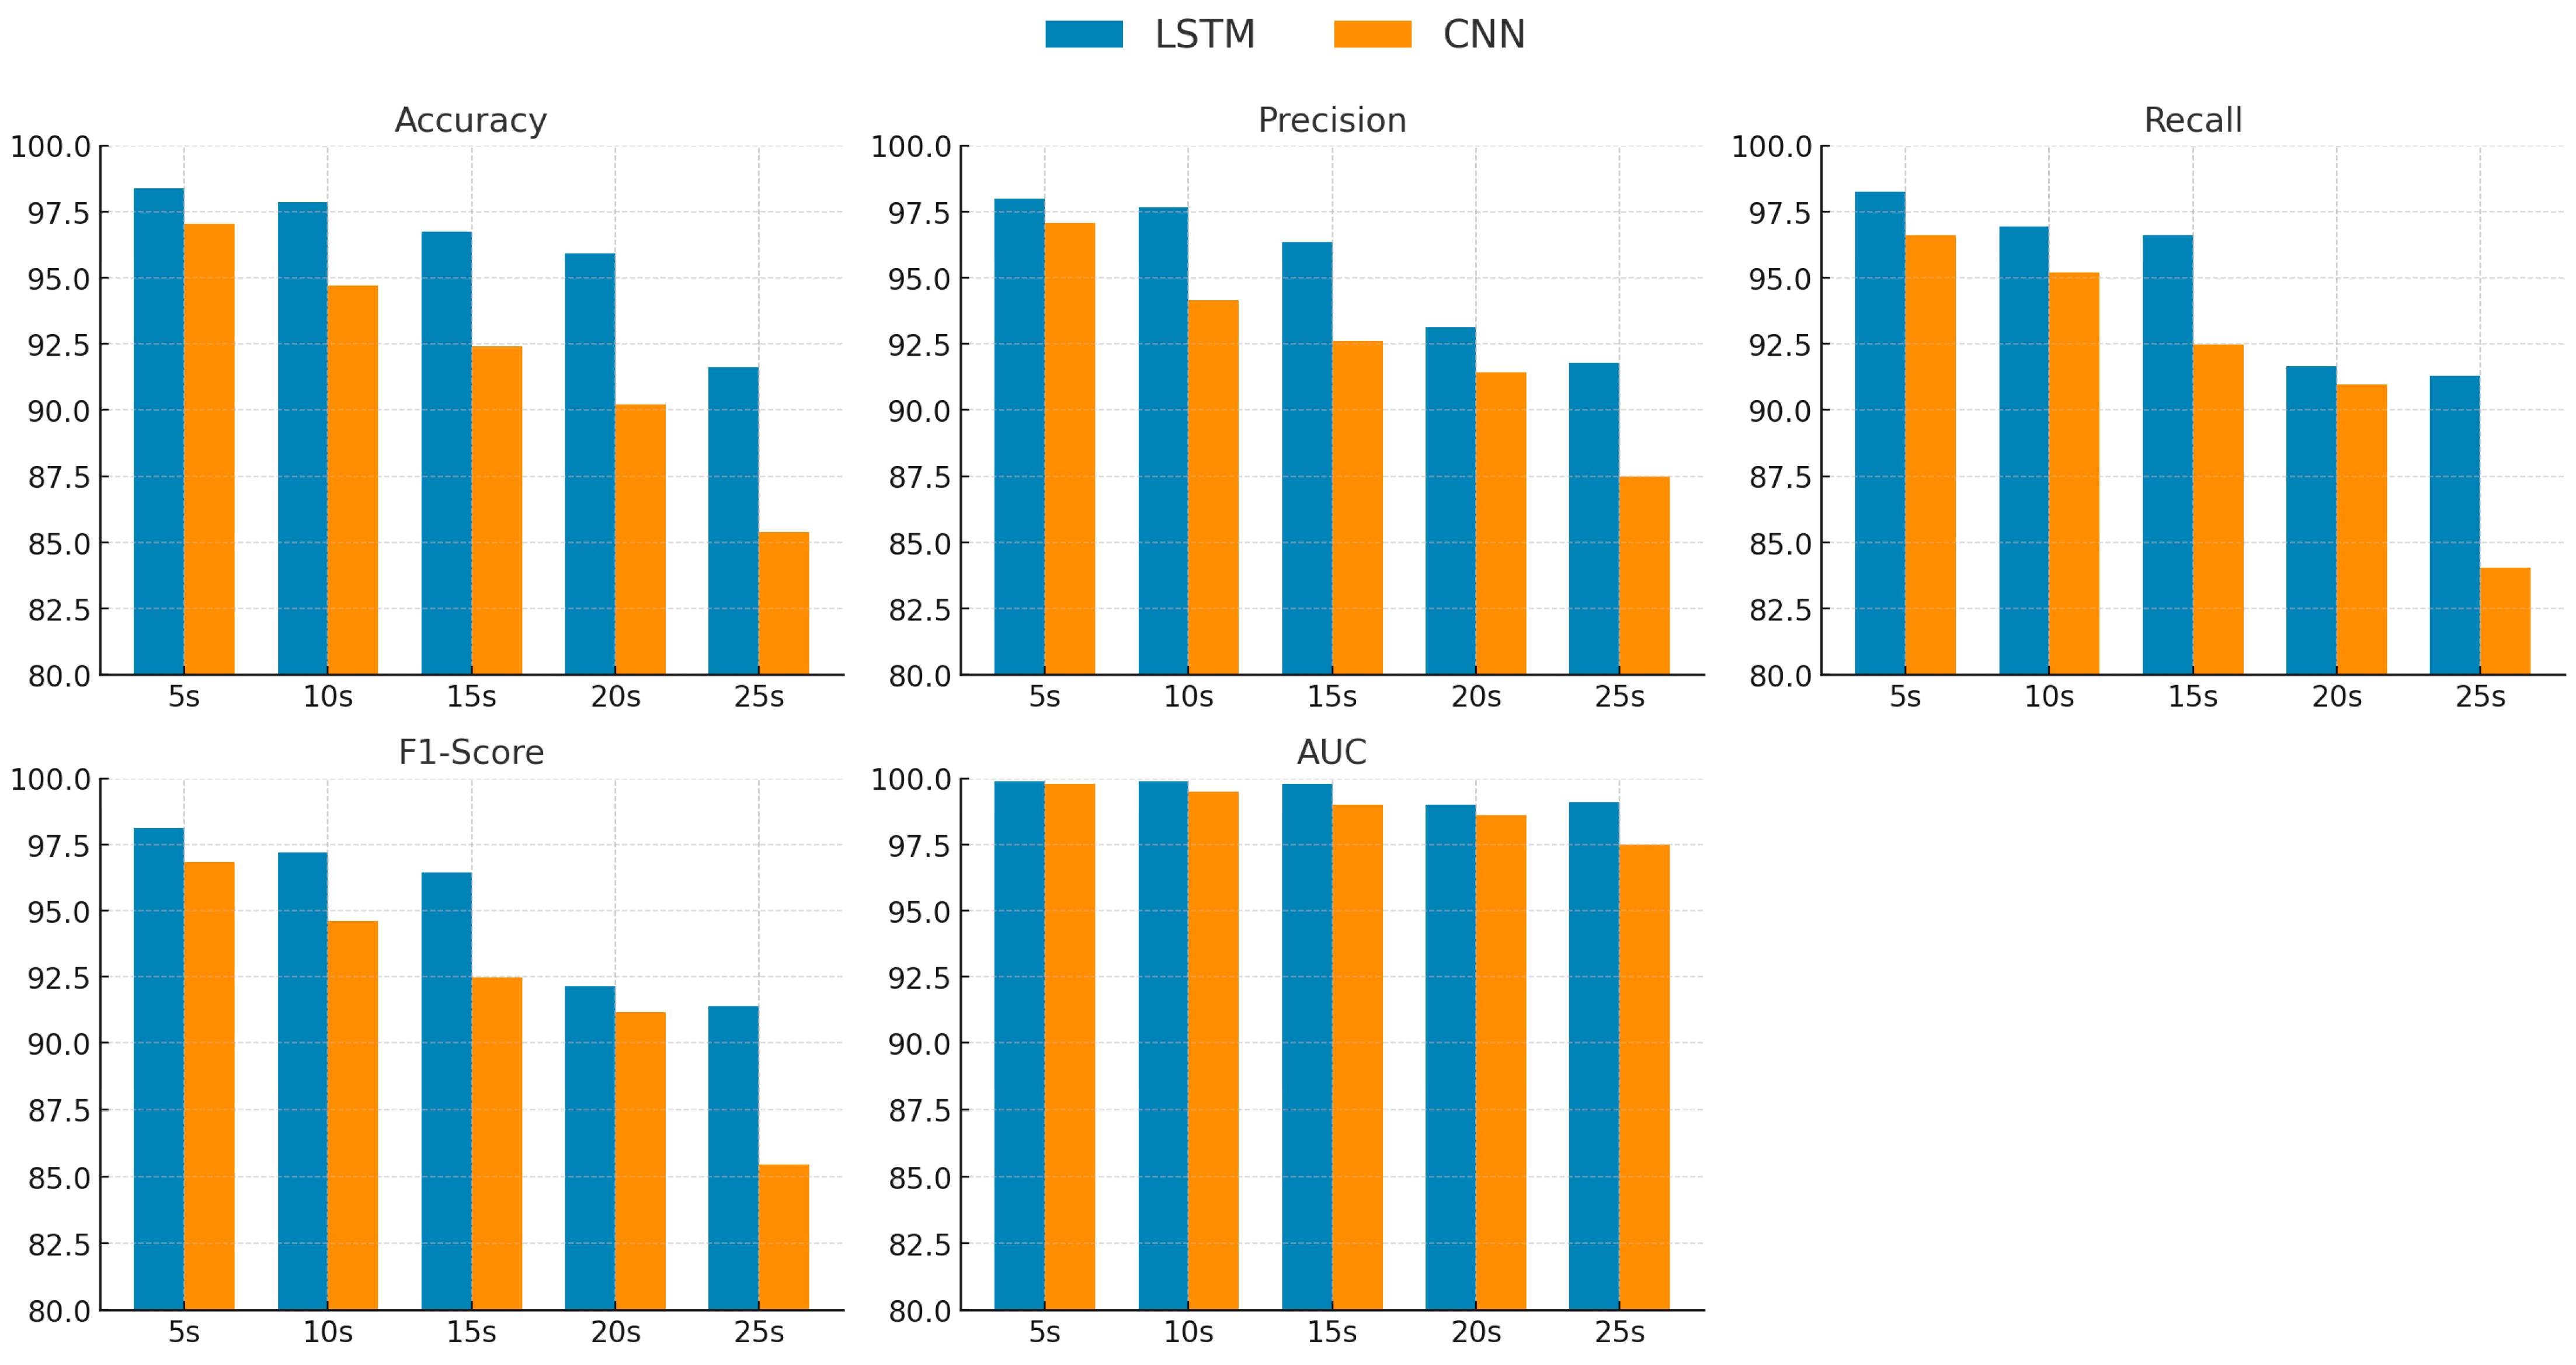
| 5 | LSTM | 98.24% ± 0.48 | 97.47% ± 0.54 | 98.25% ± 0.78 | 97.85% ± 0.53 | 0.999 ± 0.000 |
| CNN | 96.62% ± 0.39 | 95.23% ± 0.44 | 96.63% ± 0.53 | 95.88% ± 0.37 | 0.998 ± 0.001 | |
| 10 | LSTM | 97.85% ± 0.67 | 97.67% ± 0.29 | 96.93% ± 2.29 | 97.21% ± 1.32 | 0.999 ± 0.000 |
| CNN | 94.70% ± 1.30 | 94.16% ± 1.74 | 95.19% ± 1.24 | 94.61% ± 1.45 | 0.995 ± 0.001 | |
| 15 | LSTM | 96.75% ± 1.25 | 96.34% ± 0.94 | 96.60% ± 0.73 | 96.45% ± 0.84 | 0.998 ± 0.001 |
| CNN | 92.40% ± 1.71 | 92.60% ± 1.35 | 92.49% ± 1.99 | 92.47% ± 1.50 | 0.990 ± 0.003 | |
| 20 | LSTM | 92.90% ± 4.15 | 93.12% ± 4.04 | 91.65% ± 6.03 | 92.15% ± 5.30 | 0.990 ± 0.012 |
| CNN | 90.20% ± 1.95 | 91.44% ± 1.58 | 90.98% ± 1.41 | 91.16% ± 1.49 | 0.986 ± 0.003 | |
| 25 | LSTM | 91.61% ± 1.77 | 91.78% ± 2.02 | 91.29% ± 2.27 | 91.38% ± 1.58 | 0.991 ± 0.002 |
| CNN | 85.39% ± 3.34 | 87.49% ± 3.47 | 84.04% ± 3.65 | 85.47% ± 3.57 | 0.975 ± 0.008 |
Disclaimer/Publisher’s Note: The statements, opinions and data contained in all publications are solely those of the individual author(s) and contributor(s) and not of MDPI and/or the editor(s). MDPI and/or the editor(s) disclaim responsibility for any injury to people or property resulting from any ideas, methods, instructions or products referred to in the content. |
© 2025 by the authors. Licensee MDPI, Basel, Switzerland. This article is an open access article distributed under the terms and conditions of the Creative Commons Attribution (CC BY) license (https://creativecommons.org/licenses/by/4.0/).
Share and Cite
Meral, M.; Ozbilgin, F. Parkinson’s Disease Diagnosis and Severity Assessment from Gait Signals via Bayesian-Optimized Deep Learning. Diagnostics 2025, 15, 2046. https://doi.org/10.3390/diagnostics15162046
Meral M, Ozbilgin F. Parkinson’s Disease Diagnosis and Severity Assessment from Gait Signals via Bayesian-Optimized Deep Learning. Diagnostics. 2025; 15(16):2046. https://doi.org/10.3390/diagnostics15162046
Chicago/Turabian StyleMeral, Mehmet, and Ferdi Ozbilgin. 2025. "Parkinson’s Disease Diagnosis and Severity Assessment from Gait Signals via Bayesian-Optimized Deep Learning" Diagnostics 15, no. 16: 2046. https://doi.org/10.3390/diagnostics15162046
APA StyleMeral, M., & Ozbilgin, F. (2025). Parkinson’s Disease Diagnosis and Severity Assessment from Gait Signals via Bayesian-Optimized Deep Learning. Diagnostics, 15(16), 2046. https://doi.org/10.3390/diagnostics15162046


