

A Novel Diagnostic Framework with an Optimized Ensemble of Vision Transformers and Convolutional Neural Networks for Enhanced Alzheimer’s Disease Detection in Medical Imaging

 , , ,
, , ,  ,
,  ,
,
Abstract
1. Introduction
- (1)
- An extensive literature study has been performed where related works have been thoroughly studied to know about the existing state-of-the-art techniques and to identify current research gaps.
- (2)
- A classification framework has been designed based on vision transformer (ViT-B16) and three fine-tuned CNN models (VGG19, ResNet152V2, and EfficientNetV2B3) with modified dense layer architecture trained with almost 0.234 million brain MRI images.
- (3)
- A weighted ensemble approach with Grasshopper optimization algorithm applied on developed vision transformer and CNN models to build an efficient, robust, and remarkable framework for multiclass classification of Alzheimer’s level.
- (4)
- An innovative model of AI integrated IoMT architecture has been designed and proposed where the designed classification framework applied in cloud server can play a significant role in telemedicine where one can access smart diagnosis service remotely.
- (5)
- A comparative analysis with proper facts and figures has been performed with the existing state-of-the-art work that ensures the strengths and novelty of the framework in terms of architecture design and performance.
2. Related Work
3. Proposed Methodology
3.1. Dataset Description
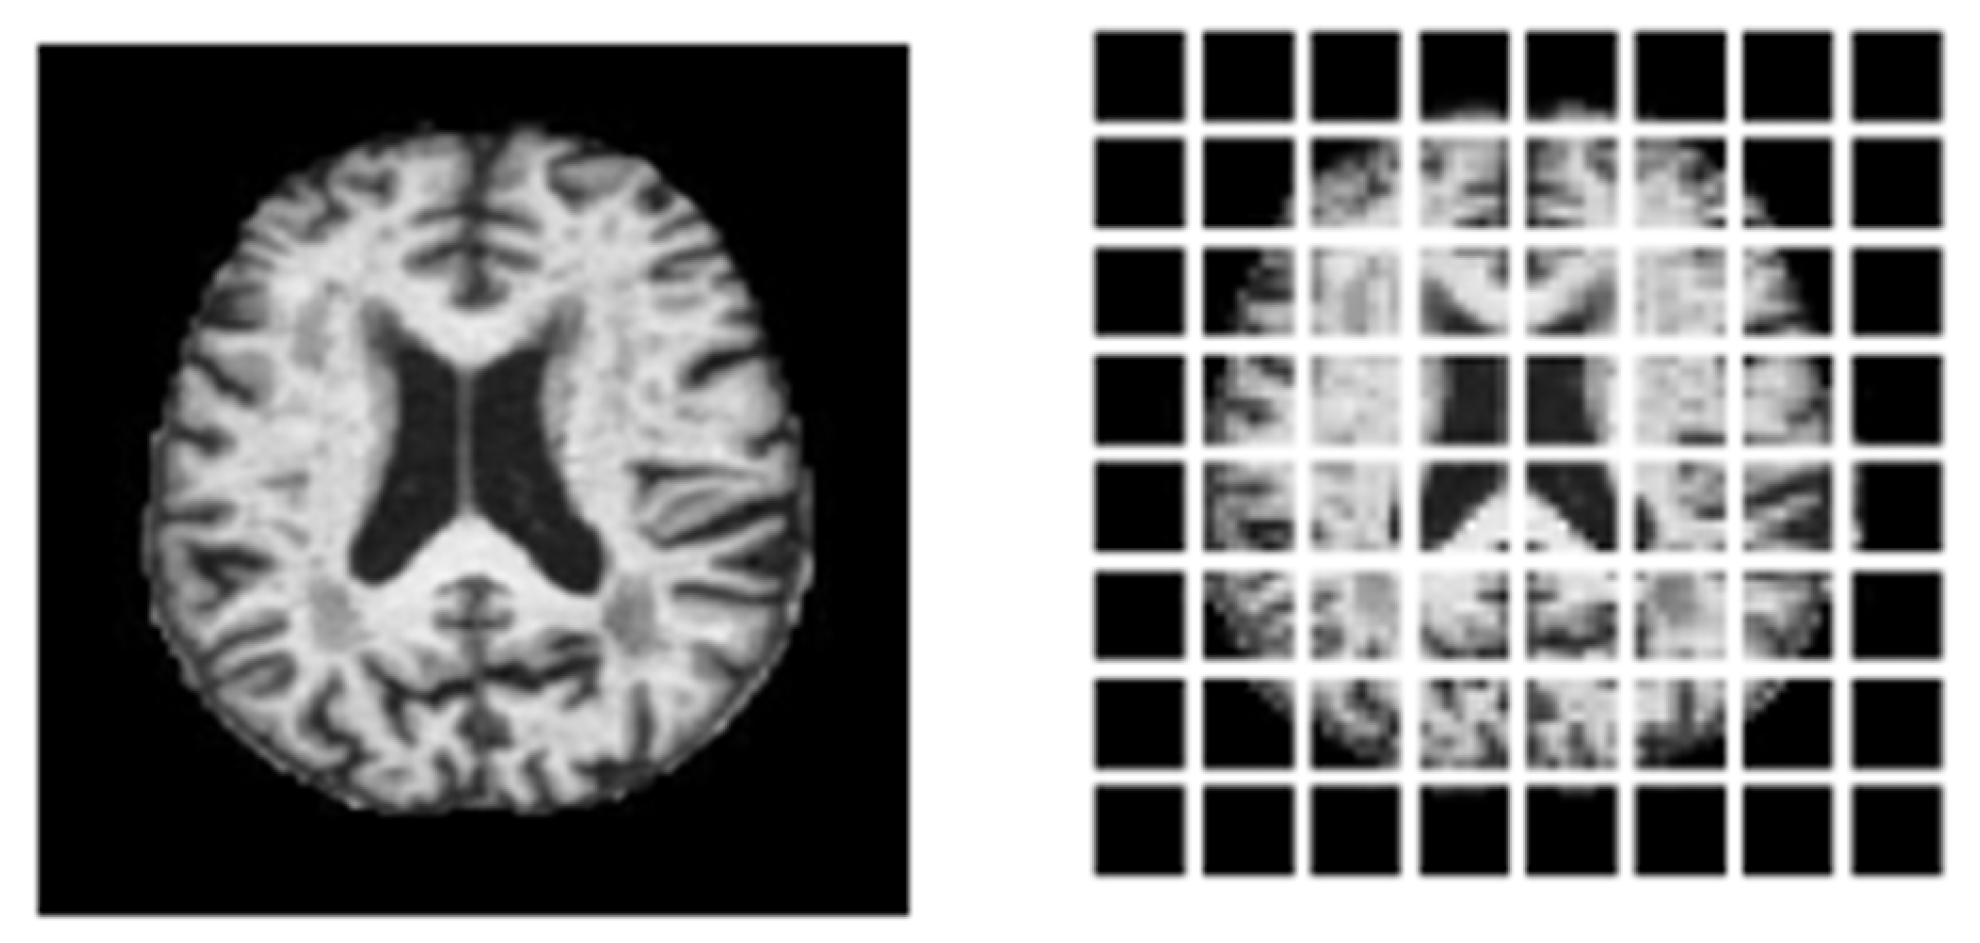
3.2. Preprocessing
3.3. CNN-Based Classification
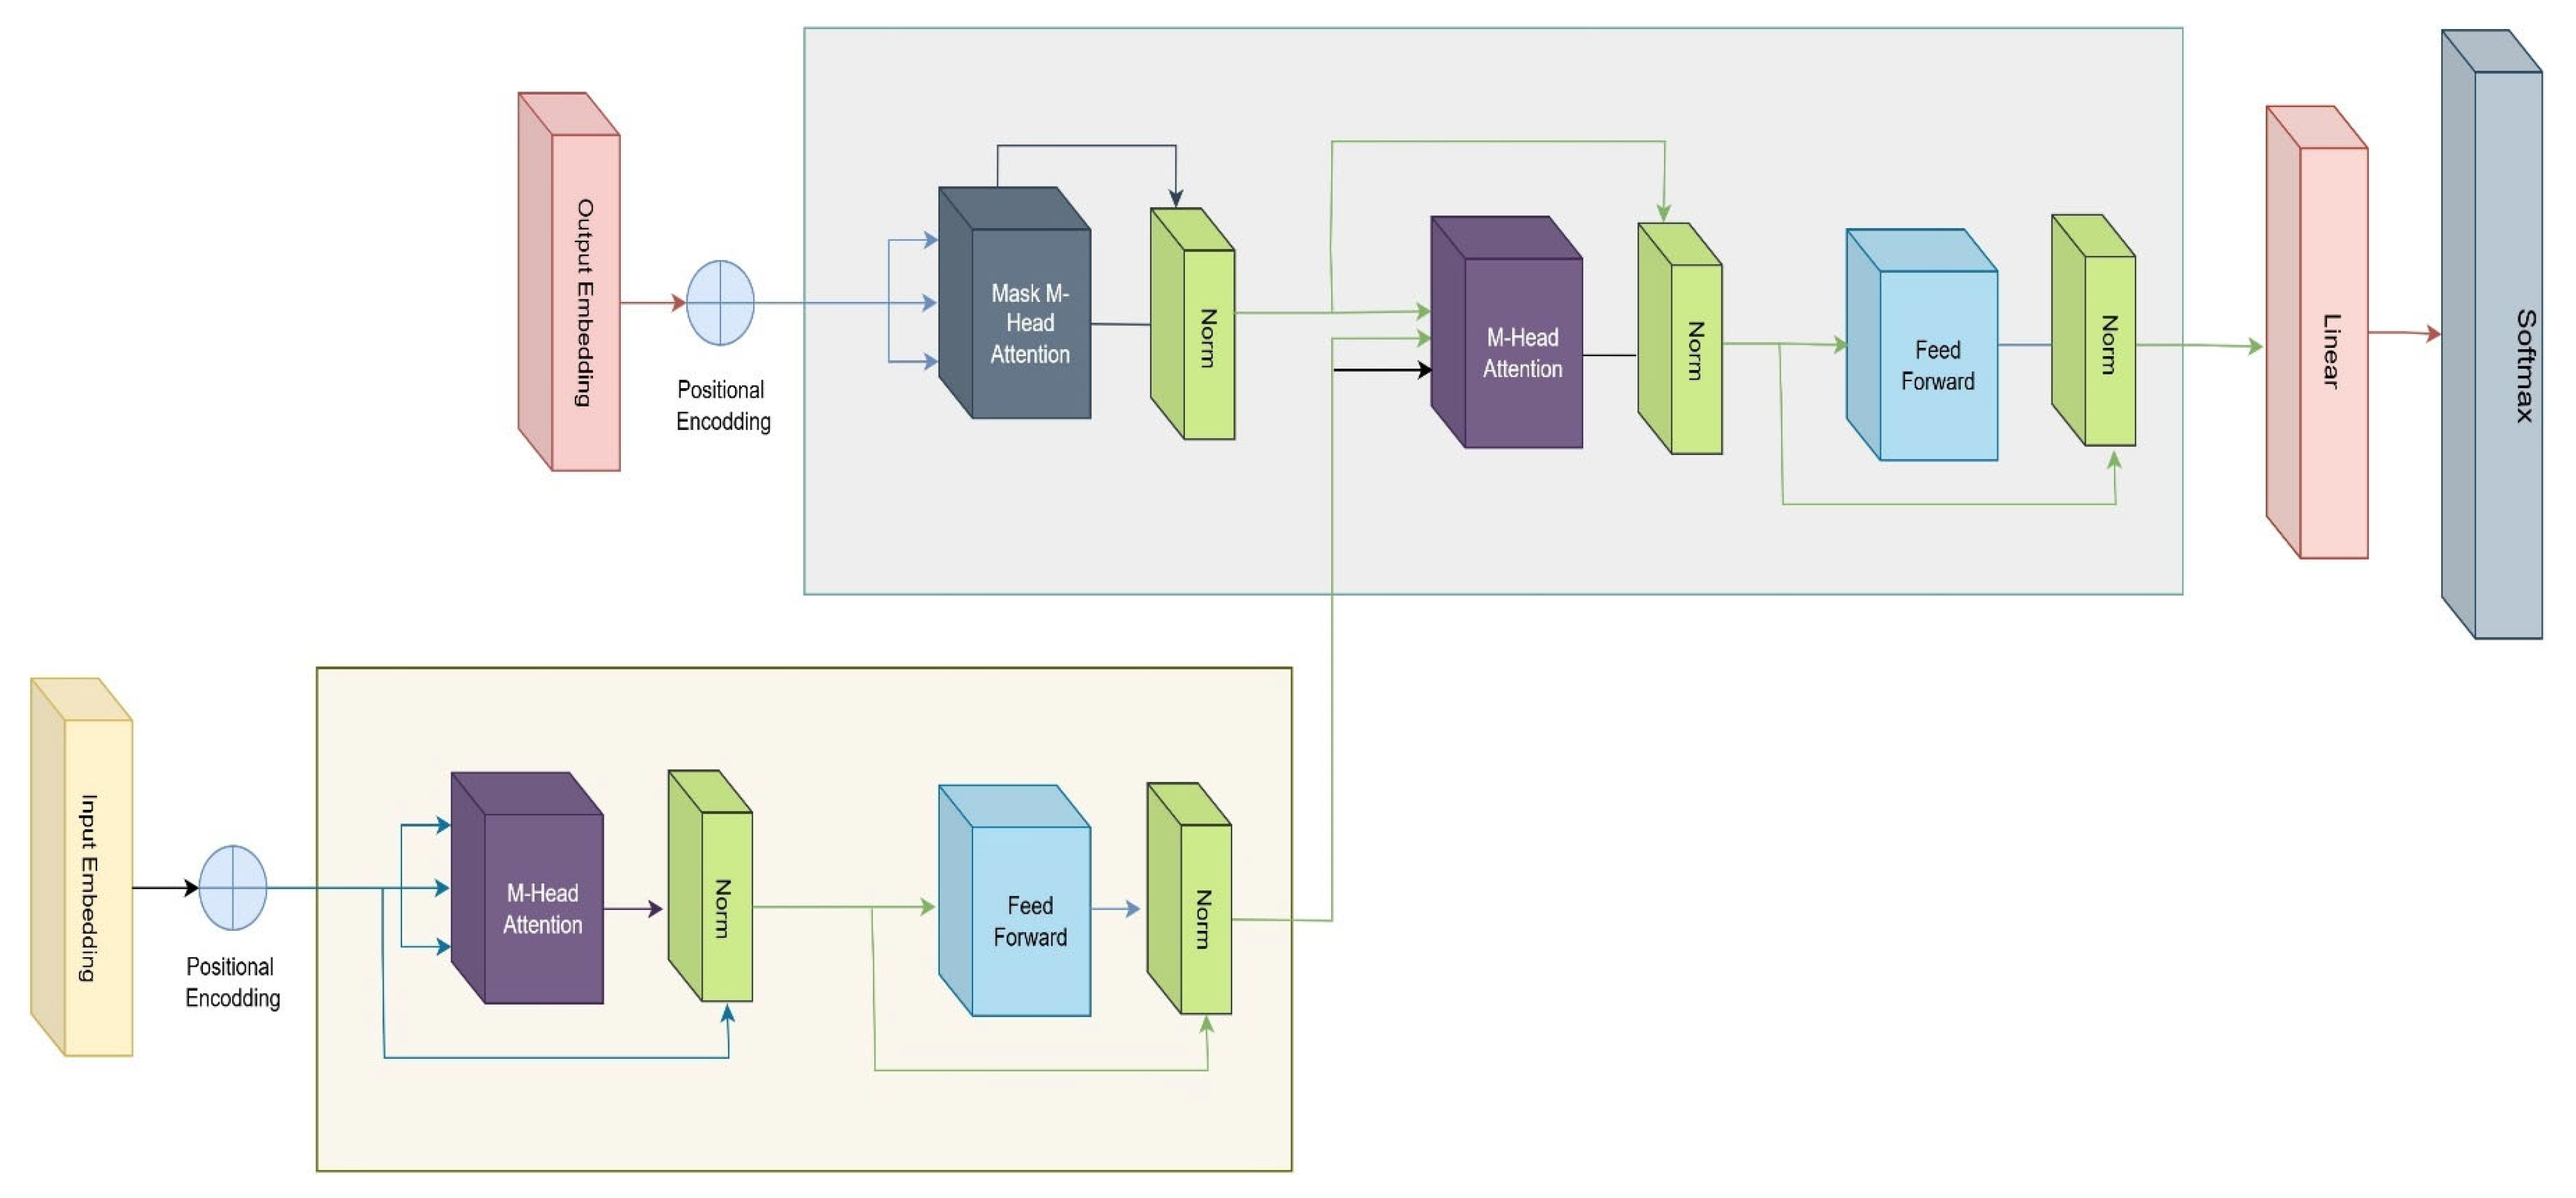
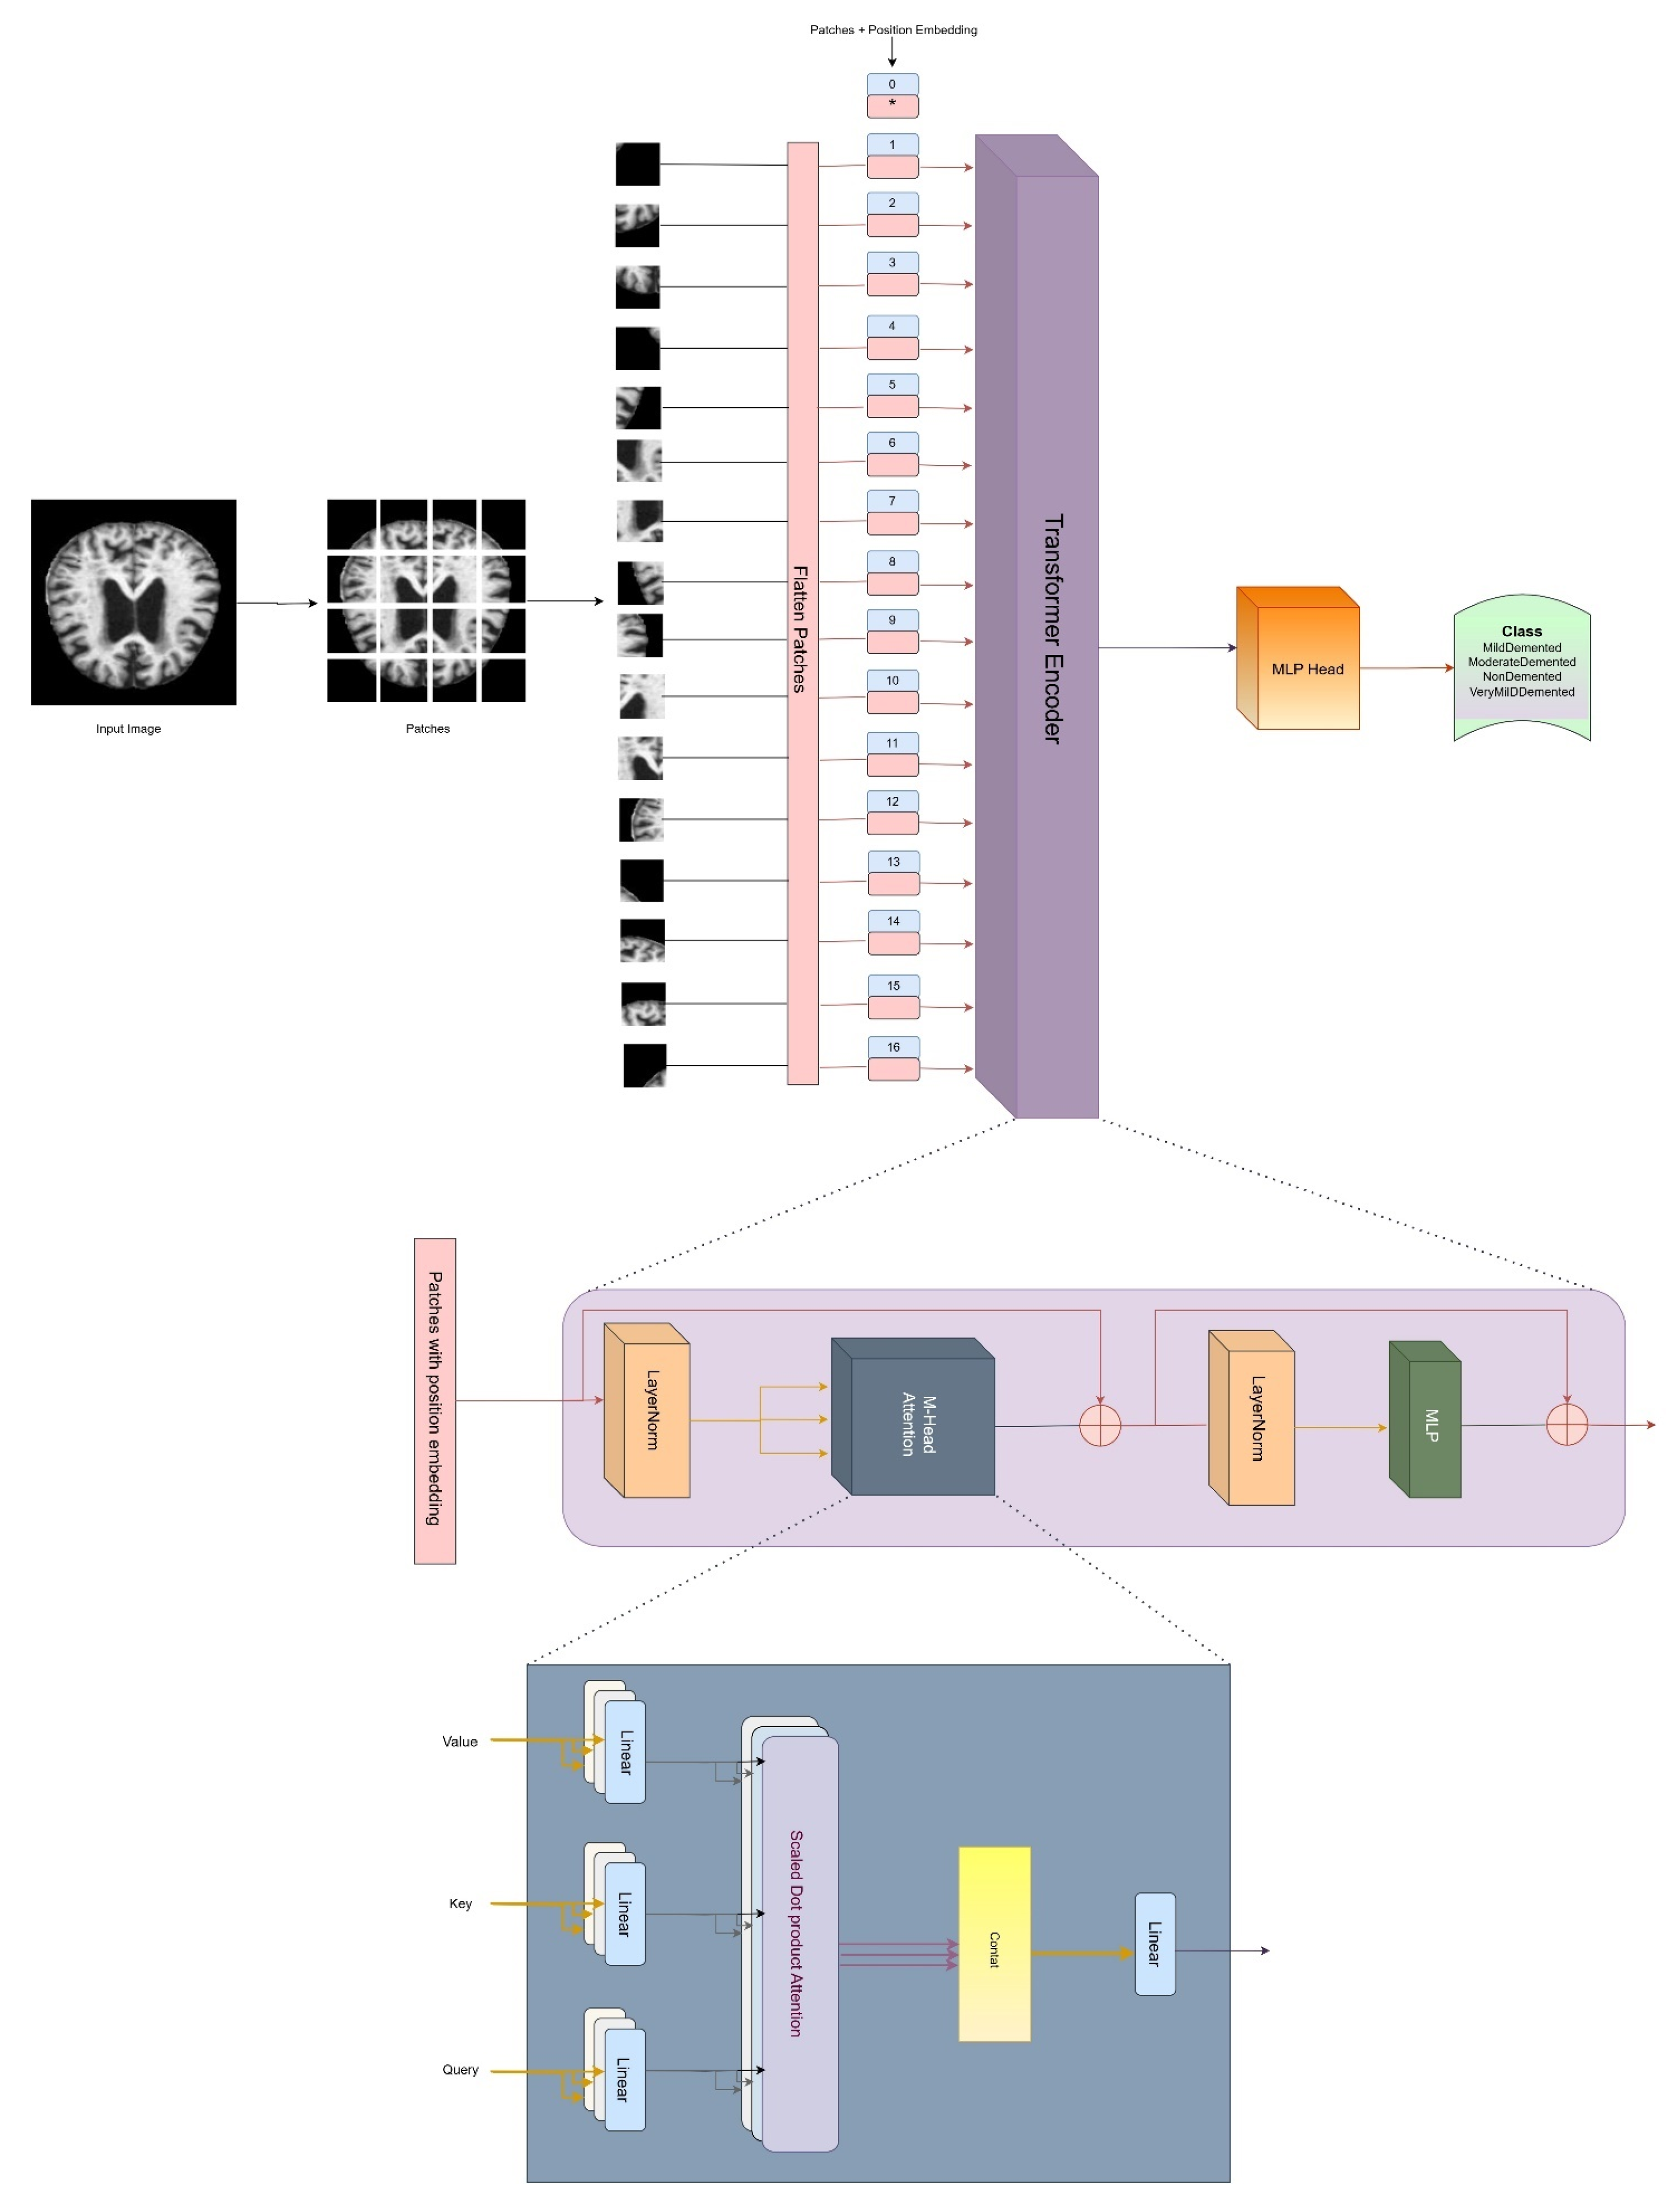
3.4. Architecture of Vision Transformer
3.5. Optimization and Hyperparameter Tuning
3.6. Weighted Average Ensemble Technique
3.7. Systematic Designing Approach
3.8. Proposed Algorithm
| Algorithm 1. DL-based Alzheimer’s disease detection approach using brain MRI images | ||
 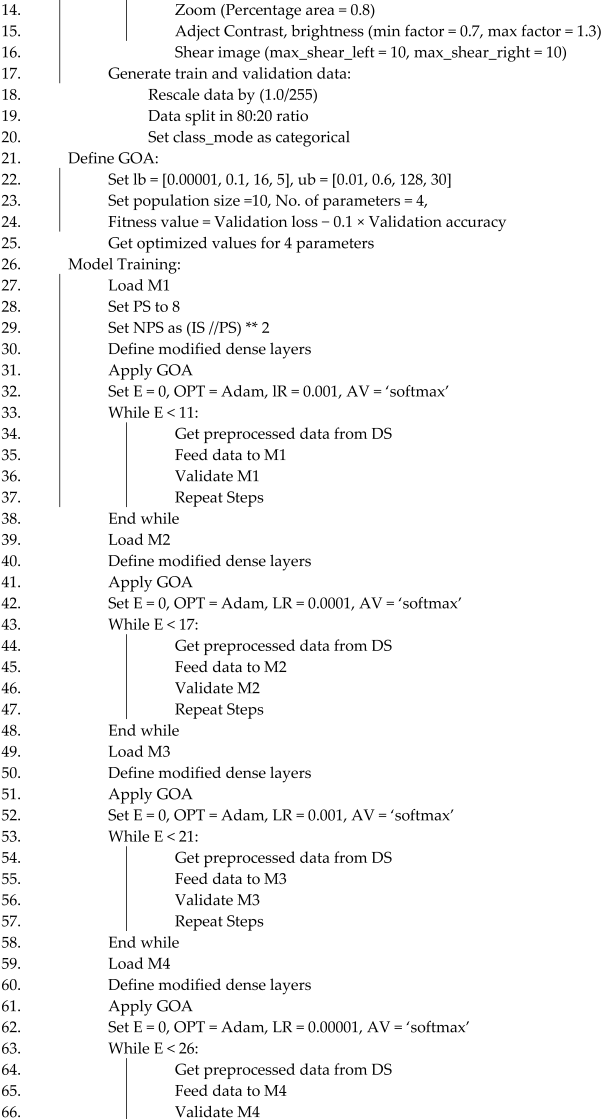  | ||
3.9. IoMT Infrastructure with Proposed Classification Framework
4. Results and Discussion
5. Conclusions
Author Contributions
Funding
Institutional Review Board Statement
Informed Consent Statement
Data Availability Statement
Conflicts of Interest
References
- Abubakar, M.B.; Sanusi, K.O.; Ugusman, A.; Mohamed, W.; Kamal, H.; Ibrahim, N.H.; Khoo, C.S.; Kumar, J. Alzheimer’s Disease: An Update and Insights Into Pathophysiology. Front. Aging Neurosci. 2022, 14, 742408. [Google Scholar] [CrossRef]
- Sehar, U.; Rawat, P.; Reddy, A.P.; Kopel, J.; Reddy, P.H. Amyloid Beta in Aging and Alzheimer’s Disease. Int. J. Mol. Sci. 2022, 23, 12924. [Google Scholar] [CrossRef]
- Gustavsson, A.; Norton, N.; Fast, T.; Frölich, L.; Georges, J.; Holzapfel, D.; Kirabali, T.; Krolak-Salmon, P.; Rossini, P.M.; Ferretti, M.T.; et al. Global estimates on the number of persons across the Alzheimer’s disease continuum. Alzheimer’s Dement. 2023, 19, 658–670. [Google Scholar] [CrossRef]
- Rahman, M.M.; Lendel, C. Extracellular protein components of amyloid plaques and their roles in Alzheimer’s disease pathology. Mol. Neurodegener. 2021, 16, 59. [Google Scholar] [CrossRef] [PubMed]
- Zhang, H.; Wei, W.; Zhao, M.; Ma, L.; Jiang, X.; Pei, H.; Cao, Y.; Li, H. Interaction between aβ and tau in the pathogenesis of alzheimer’s disease. Int. J. Biol. Sci. 2021, 17, 2181–2192. [Google Scholar] [CrossRef]
- Tenchov, R.; Sasso, J.M.; Angela Zhou, Q. Alzheimer’s Disease: Exploring the Landscape of Cognitive Decline. ACS Chem. Neurosci. 2024, 15, 3800–3827. [Google Scholar] [CrossRef]
- Rajeev, V.; Fann, D.Y.; Dinh, Q.N.; Kim, H.A.; De Silva, T.M.; Lai, M.K.P.; Chen, C.L.H.; Drummond, G.R.; Sobey, C.G.; Arumugam, T.V. Pathophysiology of blood brain barrier dysfunction during chronic cerebral hypoperfusion in vascular cognitive impairment. Theranostics 2022, 12, 1639–1658. [Google Scholar] [CrossRef]
- Xiong, Y.; Chen, X.; Zhao, X.; Fan, Y.; Zhang, Q.; Zhu, W. Altered regional homogeneity and functional brain networks in Type 2 diabetes with and without mild cognitive impairment. Sci. Rep. 2020, 10, 21254. [Google Scholar] [CrossRef]
- Fujita, S.; Mori, S.; Onda, K.; Hanaoka, S.; Nomura, Y.; Nakao, T.; Yoshikawa, T.; Takao, H.; Hayashi, N.; Abe, O. Characterization of Brain Volume Changes in Aging Individuals With Normal Cognition Using Serial Magnetic Resonance Imaging. JAMA Netw. Open 2023, 6, E2318153. [Google Scholar] [CrossRef]
- Givian, H.; Calbimonte, J.P.; Neuroimaging, D. Early diagnosis of Alzheimer’s disease and mild cognitive impairment using MRI analysis and machine learning algorithms. Discov. Appl. Sci. 2025, 7, 27. [Google Scholar] [CrossRef]
- Breijyeh, Z.; Karaman, R. Comprehensive Review on Alzheimer’s Disease: Causes and Treatment. Molecules 2020, 25, 5789. [Google Scholar] [CrossRef] [PubMed]
- Zhang, Y.; Wu, K.M.; Yang, L.; Dong, Q.; Yu, J.T. Tauopathies: New perspectives and challenges. Mol. Neurodegener. 2022, 17, 1–29. [Google Scholar] [CrossRef] [PubMed]
- Bezprozvanny, I. Alzheimer’s disease–Where do we go from here? Biochem. Biophys. Res. Commun. 2022, 633, 72–76. [Google Scholar] [CrossRef] [PubMed]
- Tahami Monfared, A.A.; Byrnes, M.J.; White, L.A.; Zhang, Q. Alzheimer’s Disease: Epidemiology and Clinical Progression. Neurol. Ther. 2022, 11, 553–569. [Google Scholar] [CrossRef]
- Fang, E.F.; Xie, C.; Schenkel, J.A.; Wu, C.; Long, Q.; Cui, H.; Aman, Y.; Frank, J.; Liao, J.; Zou, H.; et al. A research agenda for ageing in China in the 21st century (2nd edition): Focusing on basic and translational research, long-term care, policy and social networks. Ageing Res. Rev. 2020, 64, 101174. [Google Scholar] [CrossRef]
- Sethi, M.; Rani, S.; Singh, A.; Mazón, J.L.V. A CAD System for Alzheimer’s Disease Classification Using Neuroimaging MRI 2D Slices. Comput. Math. Methods Med. 2022, 2022, 8680737. [Google Scholar] [CrossRef]
- Bai, W.; Chen, P.; Cai, H.; Zhang, Q.; Su, Z.; Cheung, T.; Jackson, T.; Sha, S.; Xiang, Y.T. Worldwide prevalence of mild cognitive impairment among community dwellers aged 50 years and older: A meta-analysis and systematic review of epidemiology studies. Age Ageing 2022, 51, afac173. [Google Scholar] [CrossRef]
- Rajan, K.B.; Weuve, J.; Barnes, L.L.; McAninch, E.A.; Wilson, R.S.; Evans, D.A. Population estimate of people with clinical Alzheimer’s disease and mild cognitive impairment in the United States (2020–2060). Alzheimer’s Dement. 2021, 17, 1966–1975. [Google Scholar] [CrossRef]
- Yogesh; Kumar, K.; Kaur, K.; Thakur, A.; Nazir, N.; Dahiya, O.; Agarwal, S. A Comparative Study of Machine Learning Techniques for the Detection of Alzheimer’s Disease. In Proceedings of the 2023 10th IEEE Uttar Pradesh Section International Conference on Electrical, Electronics and Computer Engineering (UPCON), Gautam Buddha Nagar, India, 1–3 December 2023; Volume 10, pp. 52–56. [Google Scholar] [CrossRef]
- Panda, S.; Akbar, A.; Li, C.; Khan, O.T.; Patel, R.; Canevari, J.; Lambropoulos, D.; Haghani, S. A Digital Platform for Early Detection and Monitoring the Progression of Alzheimer’s Disease. In Proceedings of the 2024 IEEE International Conference on Consumer Electronics (ICCE), Las Vegas, NV, USA, 6–8 January 2024; pp. 1–3. [Google Scholar] [CrossRef]
- Qu, Z.; Yao, T.; Liu, X.; Wang, G. A Graph Convolutional Network Based on Univariate Neurodegeneration Biomarker for Alzheimer’s Disease Diagnosis. IEEE J. Transl. Eng. Health Med. 2023, 11, 405–416. [Google Scholar] [CrossRef]
- Tushar; Patel, R.K.; Aggarwal, E.; Solanki, K.; Dahiya, O.; Yadav, S.A. A Logistic Regression and Decision Tree Based Hybrid Approach to Predict Alzheimer’s Disease. In Proceedings of the 2023 International Conference on Computational Intelligence and Sustainable Engineering Solutions (CISES), Greater Noida, India, 28–30 April 2023; pp. 722–726. [Google Scholar] [CrossRef]
- Alshammari, M.; Mezher, M. A Modified Convolutional Neural Networks for MRI-based Images for Detection and Stage Classification of Alzheimer Disease. In Proceedings of the 2021 National Computing Colleges Conference (NCCC), Taif, Saudi Arabia, 27–28 March 2021. [Google Scholar] [CrossRef]
- Thatere, A.; Verma, P.; Reddy, K.T.V.; Umate, L. A Short Survey on Alzheimer’s Disease: Recent Diagnosis and Obstacles. In Proceedings of the 2023 1st DMIHER International Conference on Artificial Intelligence in Education and Industry 4.0 (IDICAIEI), Wardha, India, 27–28 November 2023; pp. 1–6. [Google Scholar] [CrossRef]
- Sevcik, A.; Rusko, M. A Systematic Review of Alzheimer’s disease detection based on speech and natural language processing. In Proceedings of the 2022 32nd International Conference Radioelektronika (RADIOELEKTRONIKA), Kosice, Slovakia, 21–22 April 2022; pp. 1–5. [Google Scholar] [CrossRef]
- Gurrala, V.K.; Talasila, S.; Medikonda, N.R.; Challa, S.; Sohail, S.; Siddiq, M.A.B. A Web-Based Interface for Comprehensive Staging Classification of Alzheimer’s Disease Diagnosis through Convolutional Neural Networks. In Proceedings of the 2024 5th International Conference for Emerging Technology (INCET), Belgaum, India, 24–26 May 2024; pp. 1–5. [Google Scholar] [CrossRef]
- Al-Shoukry, S.; Rassem, T.H.; Makbol, N.M. Alzheimer’s diseases detection by using deep learning algorithms: A mini-review. IEEE Access 2020, 8, 77131–77141. [Google Scholar] [CrossRef]
- Grueso, S.; Viejo-Sobera, R. Machine learning methods for predicting progression from mild cognitive impairment to Alzheimer’s disease dementia: A systematic review. Alzheimer’s Res. Ther. 2021, 13, 162. [Google Scholar] [CrossRef] [PubMed]
- Arulprakash, A.; Ponmaniraj, S.; Gokul Rajan, V.; Divya, A. Application of Artificial Intelligence Technique to Detect Alzheimer’s Disease. In Proceedings of the 2023 Intelligent Computing and Control for Engineering and Business Systems (ICCEBS), Chennai, India, 14–15 December 2023; pp. 1–5. [Google Scholar] [CrossRef]
- Bhattarai, P.; Thakuri, D.S.; Nie, Y.; Chand, G.B. Explainable AI-based Deep-SHAP for mapping the multivariate relationships between regional neuroimaging biomarkers and cognition. Eur. J. Radiol. 2024, 174, 111403. [Google Scholar] [CrossRef] [PubMed]
- Alatrany, A.S.; Khan, W.; Hussain, A.; Kolivand, H.; Al-Jumeily, D. An explainable machine learning approach for Alzheimer’s disease classification. Sci. Rep. 2024, 14, 2637. [Google Scholar] [CrossRef] [PubMed]
- Bhargavi, M.S.; Prabhakar, B. Deep Learning Approaches for Early Detection of Alzheimer’s Disease using MRI Neuroimaging. In Proceedings of the 2022 International Conference on Connected Systems & Intelligence (CSI), Trivandrum, India, 31 August–2 September 2022; pp. 1–6. [Google Scholar] [CrossRef]
- Tripathy, S.K.; Singh, D.; Jaiswal, A. Multi-Layer Feature Fusion-based Deep Multi-layer Depth Separable Convolution Neural Network for Alzheimer’s Disease Detection. In Proceedings of the 2023 International Conference on IoT, Communication and Automation Technology (ICICAT), Gorakhpur, India, 23–24 June 2023; pp. 1–5. [Google Scholar] [CrossRef]
- Yin, Y.; Jin, W.; Bai, J.; Liu, R.; Zhen, H. SMIL-DeiT:Multiple Instance Learning and Self-supervised Vision Transformer network for Early Alzheimer’s disease classification. In Proceedings of the 2022 International Joint Conference on Neural Networks (IJCNN), Padua, Italy, 18–23 July 2022; pp. 1–6. [Google Scholar] [CrossRef]
- Kumar, S.; Singh, N.P.; Brahma, B. AI-Based Model for Detection and Classification of Alzheimer Disease. In Proceedings of the 2023 IEEE International Conference on Computer Vision and Machine Intelligence (CVMI), Gwalior, India, 10–11 December 2023; pp. 1–6. [Google Scholar] [CrossRef]
- Zubair, L.; Irtaza, S.A.; Nida, N.; Haq, N.U. Alzheimer and Mild Cognitive disease Recognition Using Automated Deep Learning Techniques. In Proceedings of the 2021 International Bhurban Conference on Applied Sciences and Technologies (IBCAST), Islamabad, Pakistan, 12–16 January 2021; pp. 310–315. [Google Scholar] [CrossRef]
- Saxena, A.; Kaur, H. Alzheimer’s Disease (AD) Detection Using Various Machine Learning Techniques: A Systematic Review. In Proceedings of the 2023 6th International Conference on Contemporary Computing and Informatics (IC3I), Gautam Buddha Nagar, India, 14–16 September 2023; Volume 6, pp. 77–81. [Google Scholar] [CrossRef]
- Archana, B.; Kalirajan, K. Alzheimer’s Disease Classification using Convolutional Neural Networks. In Proceedings of the 2023 International Conference on Innovative Data Communication Technologies and Application (ICIDCA), Uttarakhand, India, 14–16 March 2023; pp. 1044–1048. [Google Scholar] [CrossRef]
- Liu, B. Alzheimer’s disease classification using hippocampus and improved DenseNet. In Proceedings of the 2023 International Conference on Image Processing, Computer Vision and Machine Learning (ICICML), Chengdu, China, 3–5 November 2023; pp. 451–454. [Google Scholar] [CrossRef]
- Han, L.; Yang, T.; Pu, X.; Sun, L.; Yu, B.; Xi, J. Alzheimer’s Disease Classification using LightGBM and Euclidean Distance Map. IEEE Adv. Inf. Technol. Electron. Autom. Control Conf. 2021, 2021, 1540–1544. [Google Scholar] [CrossRef]
- Alarjani, M. Alzheimer’s Disease Detection based on Brain Signals using Computational Modeling. In Proceedings of the 2024 Seventh International Women in Data Science Conference at Prince Sultan University (WiDS PSU), Riyadh, Saudi Arabia, 3–4 March 2024; pp. 77–83. [Google Scholar] [CrossRef]
- Sanjeev Kumar, K.; Reddy, B.S.; Ravichandran, M. Alzheimer’s Disease Detection Using Transfer Learning: Performance Analysis of InceptionResNetV2 and ResNet50 Models. In Proceedings of the 2023 Seventh International Conference on Image Information Processing (ICIIP), Solan, India, 22–24 November 2023; pp. 832–837. [Google Scholar] [CrossRef]
- Mishra, S.; Sharma, V.; Ramya, G. Alzheimer’s Disease Prediction Using Machine Learning. In Proceedings of the 2024 7th International Conference on Circuit Power and Computing Technologies (ICCPCT), Kollam, India, 8–9 August 2024. [Google Scholar] [CrossRef]
- Lu, P.; Tan, Y.; Xing, Y.; Liang, Q.; Yan, X.; Zhang, G. An Alzheimer’s disease classification method based on ConvNeXt. In Proceedings of the 2023 3rd International Symposium on Computer Technology and Information Science (ISCTIS), Chengdu, China, 7–9 July 2023; pp. 884–888. [Google Scholar] [CrossRef]
- Prajapati, R.; Khatri, U.; Kwon, G.R. An Efficient Deep Neural Network Binary Classifier for Alzheimer’s Disease Classification. In Proceedings of the 2021 International Conference on Artificial Intelligence in Information and Communication (ICAIIC), Jeju Island, Republic of Korea, 13–16 April 2021; pp. 231–234. [Google Scholar] [CrossRef]
- Shi, R.; Wang, L.; Jiang, J. An unsupervised region of interest extraction model for tau PET images and its application in the diagnosis of Alzheimer’s disease. In Proceedings of the 2022 44th Annual International Conference of the IEEE Engineering in Medicine & Biology Society (EMBC), Glasgow, UK, 11–15 July 2022; pp. 2157–2160. [Google Scholar] [CrossRef]
- Neetha, P.U.; Simran, S.; Rama Kainthaje, S.; Ujwal; Sunilkumar, G.; Pushpa, C.N.; Thriveni, J.; Venugopal, K.R. Borderline-DEMNET for Multi-Class Alzheimer’s Disease Classification. In Proceedings of the 2023 IEEE 5th International Conference on Cybernetics, Cognition and Machine Learning Applications (ICCCMLA), Hamburg, Germany, 7–8 October 2023; pp. 192–197. [Google Scholar] [CrossRef]
- Prabha, C. Classification and Detection of Alzheimer’s Disease: A Brief Analysis. In Proceedings of the 2023 International Conference on Self Sustainable Artificial Intelligence Systems (ICSSAS), Erode, India, 18–20 October 2023; pp. 777–782. [Google Scholar] [CrossRef]
- Das, R.; Kalita, S. Classification of Alzheimer’s Disease Stages Through Volumetric Analysis of MRI Data. In Proceedings of the 2022 IEEE Calcutta Conference (CALCON), Kolkata, India, 10–11 December 2022; pp. 165–169. [Google Scholar] [CrossRef]
- Yuan, Z.; Yao, X.; Bu, X. Classification of Alzheimer’s Disease Using Conventional Machine Learning Methods with Cortical and Genetic Characteristics. In Proceedings of the 2022 IEEE 2nd International Conference on Power, Electronics and Computer Applications (ICPECA), Shenyang, China, 21–23 January 2022; pp. 303–306. [Google Scholar] [CrossRef]
- Palacios-Navarro, G.; Buele, J.; Gimeno Jarque, S.; Bronchal Garcia, A. Cognitive Decline Detection for Alzheimer’s Disease Patients Through an Activity of Daily Living (ADL). IEEE Trans. Neural Syst. Rehabil. Eng. 2022, 30, 2225–2232. [Google Scholar] [CrossRef]
- Alatrany, A.S.; Hussain, A.; Alatrany, S.S.J.; Mustafina, J.; Al-Jumeily, D. Comparison of Machine Learning Algorithms for classification of Late Onset Alzheimer’s disease. In Proceedings of the 2023 15th International Conference on Developments in eSystems Engineering (DeSE), Baghdad & Anbar, Iraq, 9–12 January 2023; pp. 60–64. [Google Scholar] [CrossRef]
- Wang, T.; Cao, L. Deep Learning Based Diagnosis of Alzheimer’s Disease Using Structural Magnetic Resonance Imaging: A Survey. In Proceedings of the 2021 3rd International Conference on Applied Machine Learning (ICAML), Changsha, China, 23–25 July 2021; pp. 408–412. [Google Scholar] [CrossRef]
- Kayalvizhi, M.; Senthil Kumar, G.; Tushal, V.; Yashvanth, M.; Santhosh, G. Deep Learning-Based Severity Detection in Alzheimer’s Disease: A Comprehensive Study on Cognitive Impairment. In Proceedings of the 2023 International Conference on Data Science, Agents & Artificial Intelligence (ICDSAAI), Chennai, India, 21–23 December 2023; pp. 1–6. [Google Scholar] [CrossRef]
- Akter, L.; Ferdib-Al-Islam. Dementia Identification for Diagnosing Alzheimer’s Disease using XGBoost Algorithm. In Proceedings of the 2021 International Conference on Information and Communication Technology for Sustainable Development (ICICT4SD), Dhaka, Bangladesh, 27–28 February 2021; pp. 205–209. [Google Scholar] [CrossRef]
- Pallawi, S.; Singh, D.K. Detection of Alzheimer’s Disease Stages Using Pre-Trained Deep Learning Approaches. In Proceedings of the 2023 IEEE 5th International Conference on Cybernetics, Cognition and Machine Learning Applications (ICCCMLA), Hamburg, Germany, 7–8 October 2023; pp. 252–256. [Google Scholar] [CrossRef]
- Islam, J.; Furqon, E.N.; Farady, I.; Lung, C.W.; Lin, C.Y. Early Alzheimer’s Disease Detection Through YOLO-Based Detection of Hippocampus Region in MRI Images. In Proceedings of the 2023 Sixth International Symposium on Computer, Consumer and Control (IS3C), Taichung, Taiwan, 30 June–3 July 2023; pp. 32–35. [Google Scholar] [CrossRef]
- Zhou, Y.; Gao, C.; Zhang, X.; Zhang, W.; Wan, S.; Liu, Y. Early Detection and Intervention of Alzheimer’s disease Based on Game APP. In Proceedings of the 2024 5th International Conference on Information Science, Parallel and Distributed Systems (ISPDS), Guangzhou, China, 31 May–2 June 2024; Volume 2017, pp. 182–188. [Google Scholar] [CrossRef]
- Rauniyar, K.; Thakur, S.; Nevatia, A.; Shambharkar, P.G. Early Detection of Alzheimer’s Disease: The Importance of Speech Analysis. In Proceedings of the 2023 2nd International Conference on Applied Artificial Intelligence and Computing (ICAAIC), Salem, India, 4–6 May 2023; pp. 1069–1073. [Google Scholar] [CrossRef]
- Patra, B.; Maity, N.P.; Charan Sutar, B. Early Detection of Alzheimer’s Disease using Feed Forward Neural Network. In Proceedings of the 2023 14th International Conference on Computing Communication and Networking Technologies (ICCCNT), Delhi, India, 6–8 July 2023; pp. 1–4. [Google Scholar] [CrossRef]
- Varma, B.S.S.; Kalyani, G.; Asish, K.; Bai, M.I. Early Detection of Alzheimer’s Disease Using SVM, Random Forest & FNN Algorithms. In Proceedings of the 2023 2nd International Conference for Innovation in Technology (INOCON), Bangalore, India, 3–5 March 2023; pp. 1–6. [Google Scholar] [CrossRef]
- Jiang, Y.; Yu, Z.; Yin, X.; Guo, H. Early Diagnosis and Progression of Alzheimer’s Disease Based on Long Short-Term Memory Model. In Proceedings of the 2023 5th International Conference on Robotics, Intelligent Control and Artificial Intelligence (RICAI), Hangzhou, China, 1–3 December 2023; pp. 620–624. [Google Scholar] [CrossRef]
- Bushra, U.H.; Priya, F.C.; Patwary, M.J.A. Fuzziness-Based Semi-Supervised Learning for Early Detection of Alzheimer’s Disease using MRI data. In Proceedings of the 2023 26th International Conference on Computer and Information Technology (ICCIT), Cox’s Bazar, Bangladesh, 13–15 December 2023; pp. 1–6. [Google Scholar] [CrossRef]
- Subha, R.; Nayana, B.R.; Selvadass, M. Hybrid Machine Learning Model Using Particle Swarm Optimization for Effectual Diagnosis of Alzheimer’s Disease from Handwriting. In Proceedings of the 2022 4th International Conference on Circuits, Control, Communication and Computing (I4C), Bangalore, India, 21–23 December 2022; pp. 491–495. [Google Scholar] [CrossRef]
- Buyrukoglu, S. Improvement of Machine Learning Models Performances based on Ensemble Learning for the detection of Alzheimer Disease. In Proceedings of the 2021 6th International Conference on Computer Science and Engineering (UBMK), Ankara, Turkey, 15–17 September 2021; pp. 102–106. [Google Scholar] [CrossRef]
- Chandra, A.; Roy, S. On the Detection of Alzheimer’s Disease using Naïve Bayes Classifier. In Proceedings of the 2023 International Conference on Microwave, Optical, and Communication Engineering (ICMOCE), Optical, Bhubaneswar, India, 26–28 May 2023; pp. 1–4. [Google Scholar] [CrossRef]
- Talha, A.; Dhanasree, C.; Divya, E.; Prabhas, K.S.; Syed Abudhagir, U. Performance Evaluation of Deep Learning Models for Alzheimer’s Disease Detection. In Proceedings of the 2024 10th International Conference on Communication and Signal Processing (ICCSP), Melmaruvathur, India, 12–14 April 2024; pp. 317–322. [Google Scholar] [CrossRef]
- Bharath, M.; Gowtham, S.; Vedanth, S.; Kodipalli, A.; Rao, T.; Rohini, B.R. Predicting Alzheimer’s Disease Progression through Machine Learning Algorithms. In Proceedings of the 2023 International Conference on Recent Advances in Science and Engineering Technology (ICRASET), B G Nagara, India, 23–24 November 2023; pp. 1–5. [Google Scholar] [CrossRef]
- Sindhu, T.S.; Kumaratharan, N.; Anandan, P. Review on Automatic Detection of Alzheimer Disease. In Proceedings of the 2022 International Conference on Computer Communication and Informatics (ICCCI), Coimbatore, India, 25–27 January 2022; pp. 1–6. [Google Scholar] [CrossRef]
- Jansi, R.; Gowtham, N.; Ramachandran, S.; Sai Praneeth, V. Revolutionizing Alzheimer’s Disease Prediction using InceptionV3 in Deep Learning. In Proceedings of the 2023 7th International Conference on Electronics, Communication and Aerospace Technology (ICECA), Coimbatore, India, 22–24 November 2023; pp. 1155–1160. [Google Scholar] [CrossRef]
- Sushmitha, S.; Chitrakala, S.; Bharathi, U. sMRI Classification of Alzheimer’s Disease Using Genetic Algorithm and Multi-Instance Learning (GA+MIL). In Proceedings of the 2023 International Conference on Electrical, Electronics, Communication and Computers (ELEXCOM), Roorkee, India, 26–27 August 2023; pp. 1–4. [Google Scholar] [CrossRef]
- Kadyan, V.; Bawa, P.; Akhtar, M.M.; Singh, M. Speech-Based Alzheimer’s Disease Classification System with Noise-Resilient Features Optimization. In Proceedings of the 2023 31st Irish Conference on Artificial Intelligence and Cognitive Science (AICS), Letterkenny, Ireland, 7–8 December 2023; pp. 1–4. [Google Scholar] [CrossRef]
- Peng, C.; Liu, M.; Meng, C.; Xue, S.; Keogh, K.; Xia, F. Stage-aware Brain Graph Learning for Alzheimer’s Disease. In Proceedings of the 2024 IEEE Conference on Artificial Intelligence (CAI), Singapore, 25–27 June 2024; pp. 1346–1349. [Google Scholar] [CrossRef]
- Anjali; Singh, D.; Pandey, O.J.; Dai, H.N. STCNN: Combining SMOTE-TOMEK with CNN for Imbalanced Classification of Alzheimer’s Disease. IEEE Sens. Lett. 2024, 8, 1–4. [Google Scholar] [CrossRef]
- Yu, X.; Zhang, L.; Lyu, Y.; Liu, T.; Zhu, D. Supervised Deep Tree in Alzheimer’s Disease. In Proceedings of the 2023 IEEE 20th International Symposium on Biomedical Imaging (ISBI), Cartagena, Colombia, 18–21 April 2023; pp. 1–5. [Google Scholar] [CrossRef]
- Jin, S.; Zou, P.; Han, Y.; Jiang, J. Unsupervised detection of individual atrophy in Alzheimer’s disease. In Proceedings of the 2021 43rd Annual International Conference of the IEEE Engineering in Medicine & Biology Society (EMBC), Virtual, 1–5 November 2021; pp. 2647–2650. [Google Scholar] [CrossRef]
- Soni, A.; Amrhein, B.; Baucum, M.; Paek, E.J.; Khojandi, A. Using Verb Fluency, Natural Language Processing, and Machine Learning to Detect Alzheimer’s Disease. In Proceedings of the 43rd Annual International Conference of the IEEE Engineering in Medicine & Biology Society (EMBC), Virtual, 1–5 November 2021; pp. 2282–2285. [Google Scholar] [CrossRef]
- Suttapakti, U.; Pianprasit, P. Variational Feature Extraction of Two-Dimensional Variational Mode Decomposition for Alzheimer’s Disease Classification. In Proceedings of the 2020 12th International Conference on Information Technology and Electrical Engineering (ICITEE), Yogyakarta, Indonesia, 6–8 October 2020; pp. 344–349. [Google Scholar] [CrossRef]
- Basher, A.; Kim, B.C.; Lee, K.H.; Jung, H.Y. Volumetric Feature-Based Alzheimer’s Disease Diagnosis from sMRI Data Using a Convolutional Neural Network and a Deep Neural Network. IEEE Access 2021, 9, 29870–29882. [Google Scholar] [CrossRef]
- Butta, R.; Shaik, M.S.; Murthy, G.L.N. Ensemble deep learning approach for early diagnosis of Alzheimer’s disease. Multimed. Tools Appl. 2024, 84, 1403–1428. [Google Scholar] [CrossRef]
- Agarwal, D.; Berbís, M.Á.; Luna, A.; Lipari, V.; Ballester, J.B.; de la Torre-Díez, I. Automated Medical Diagnosis of Alzheimer’s Disease Using an Efficient Net Convolutional Neural Network. J. Med. Syst. 2023, 47, 57. [Google Scholar] [CrossRef]
- Saim, M.; Feroui, A. Automated Alzheimer’s Disease Detection and Diagnosis Method Based on Bayesian Optimization and CNN—Based Pre-Trained Features; Springer: New York, NY, USA, 2024; ISBN 0123456789. [Google Scholar]
- Arafa, D.A.; Moustafa, H.E.D.; Ali, H.A.; Ali-Eldin, A.M.T.; Saraya, S.F. A Deep Learning Framework for Early Diagnosis of Alzheimer’s Disease on MRI Images; Springer: New York, NY, USA, 2024; Volume 83, ISBN 0123456789. [Google Scholar]


| Author (s) | Model Used | Dataset | Total Images | Methodology | Accuracy | Focus Area | Limitations |
|---|---|---|---|---|---|---|---|
| Qu et al. (2023) [21] | UNB-GCN | ADNI Dataset | 928 | Used univariate neurodegeneration biomarkers with GCN. | 93.90% (CU vs. AD) 82.05% (MCI vs. AD) | Early AD detection | Lacks multimodal validation. |
| Liu (2023) [39] | DenseNet -AM | ADNI Dataset | 413 | Integration of hippocampal and whole-brain MRI | 92.8% | Structural abnormality analysis | Limited feature diversity |
| Han et al. (2021) [40] | LightGBM | Real Datasets (EADC and ADNI Dataset) | 78 (41 NC and 37 AD) * 19 Features = 1482 Images | Feature optimization for improved classification | 89.7% (AD Classification Feature) 82.1% (Hippocampal Volume) | AD diagnosis | Inconsistent performance on small datasets |
| Sanjeev Kumar K et al. (2023) [42] | InceptionResNetV2 and ResNet50 | ADNI dataset | 6400 MRI Images | Deep learning architecture for AD stage classification | 86.84% 90.27% | Staged AD classification | Requires high-quality annotated data |
| Mishra et al. (2024) [43] | ML models (LR, RF, SVM, DT, AdaBoost) | OASIS Project Dataset | 150 Subjects | Analysis of early prediction problems in AD | 86.84% (RF) (Highest) | Early prediction | Data inconsistency across datasets |
| Lu et al. (2023) [44] | ConvNeXt-DMLP | ADNI Dataset | 33,984 | Multiclassification framework to reduce imaging overlap of AD and MCI | 78.95% | AD and MCI classification | Limited generalization to external datasets |
| Prajapati et al. (2021) [45] | Deep Neural Networks (DNN) | ADNI Dataset | 58 AD, 48 MCI and 73 CN Subjects | Binary classification using deep neural networks | 85.19% (AD vs CN) 76.93% (MCI vs. CN) 72.73% (AD vs MCI) | AD stage classification | Limited scope for multiclass classification |
| Das et al. (2022) [49] | Hippocampal Segmentation with CNN | ADNI and OASIS Dataset (MRI) | 100 people (Train) and 35 people (Test) | Focused on hippocampal segmentation for structural MRI | 91.43% | Structural abnormality detection | Limited generalizability to other brain regions |
| Pallawi et al. (2023) [56] | EfficientNetB0 | Dataset from Kaggle | 6400 images (MD-896, MOD-64, ND-3200, and VMD-2240) | Transfer learning for early-stage AD classification | 95.78% | Early-stage classification | Dataset imbalance |
| Islam et al. (2023) [57] | YOLO (YOLOv3, YOLOv4, YOLOv5, YOLOv6 and YOLOv7 | ADNI Dataset (MRI data) | 300 Subjects (2000+ Images) | Automated hippocampal detection for early recognition | YOLOv7 (81%-AD vs. MCI, 95%-AD vs. CN, 83%-CN vs. MCI) | Early-stage identification | Limited automation coverage |
| Yin et al. (2022) [34] | SMIL-DeiT | ADNI dataset | 2032 Subjects | Staged AD classification with enhanced techniques | 93.2% | Staged classification | Model interpretability |
| Jin et al. (2021) [76] | VAE+GAN | ADNI Dataset (sMRI Images) | 1042 Subjects | Identification of brain atrophy | 94% | Structural analysis | Overfitting potential |
| Feature | VGG19 | ResNet152V2 | EfficientNetV2B3 |
|---|---|---|---|
| Architecture Type | A deep CNN with a straightforward sequential design | A deep residual network incorporating skip connections | An optimized convolutional network with depth-wise convolutions |
| Depth (Layers) | 19 layers | 152 layers | Adaptive depth based scaling |
| Parameter Count | Approximately 143 million | Approximately 60 million | Nearly 24 million |
| Advantages | Simple yet effective for smaller datasets | Overcomes vanishing gradient issues and excels in deep feature extraction | Efficiency in computation while maintaining high accuracy |
| Limitations | High parameter counts leading to increased computational cost | More complex training process with longer inference time | Requires sophisticated training techniques for optimal results |
| Feature Extraction Capability | Captures fine-grained spatial details effectively | Excels at extracting deep semantic representations | Strikes a balance between feature learning and efficiency |
| Training Time | Relatively long | Moderate | Faster compared to the others |
| Accuracy Performance | Moderate to high | High | Very high |
| Reason for Selection | Included due to its ability to retain detailed spatial information | Chosen for its deep feature extraction and improved gradient handling | Selected for its efficiency, optimizing both accuracy and computational demands |
| Layer (Type) | Output Shape | Param # |
|---|---|---|
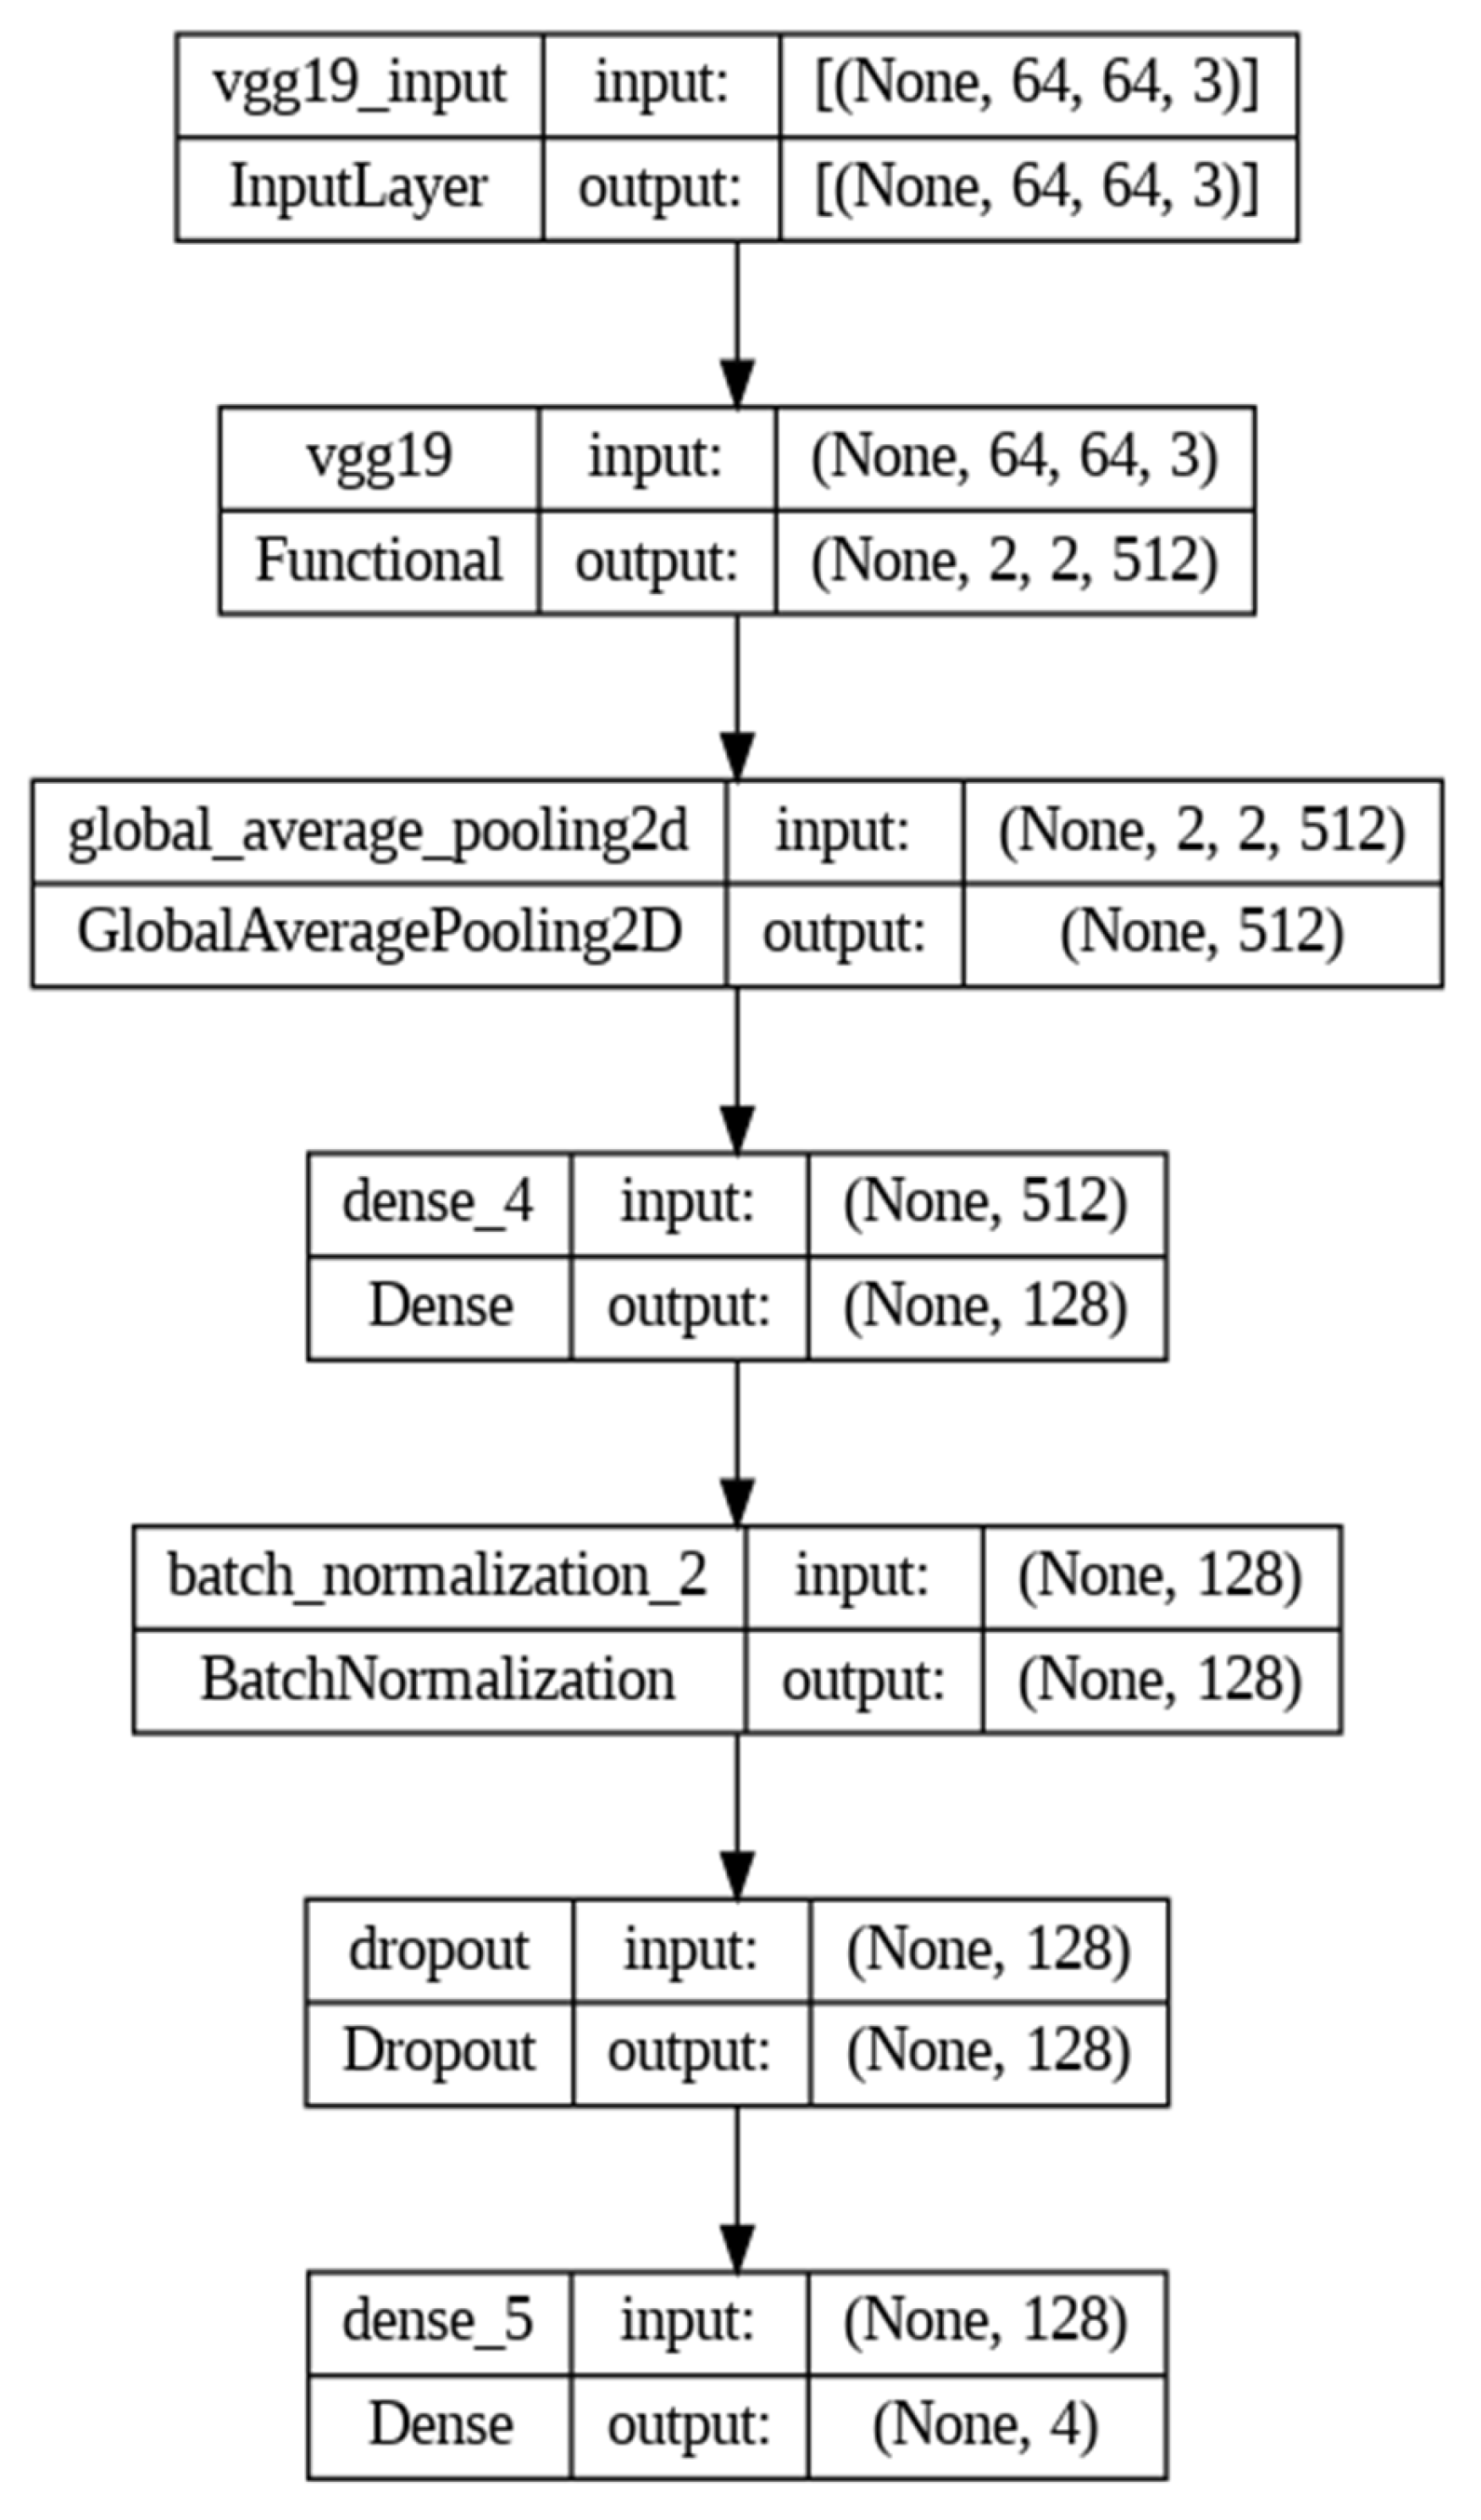
| vgg19 (Functional) | (None, 2, 2, 512) | 20,024,384 |
| global_average_pooling2d (GlobalAveragePooling2D) | (None, 512) | 0 |
| dense_4 (Dense) | (None, 128) | 65,664 |
| batch_normalization_2 (BatchNormalization) | (None, 128) | 512 |
| dropout (Dropout) | (None, 128) | 0 |
| dense_5 (Dense) | (None, 4) | 516 |
| Total params: 20,091,076 | ||
| Trainable params: 66,436 | ||
| Nontrainable params: 20,024,640 |
| Layer (Type) | Output Shape | Param # |
|---|---|---|
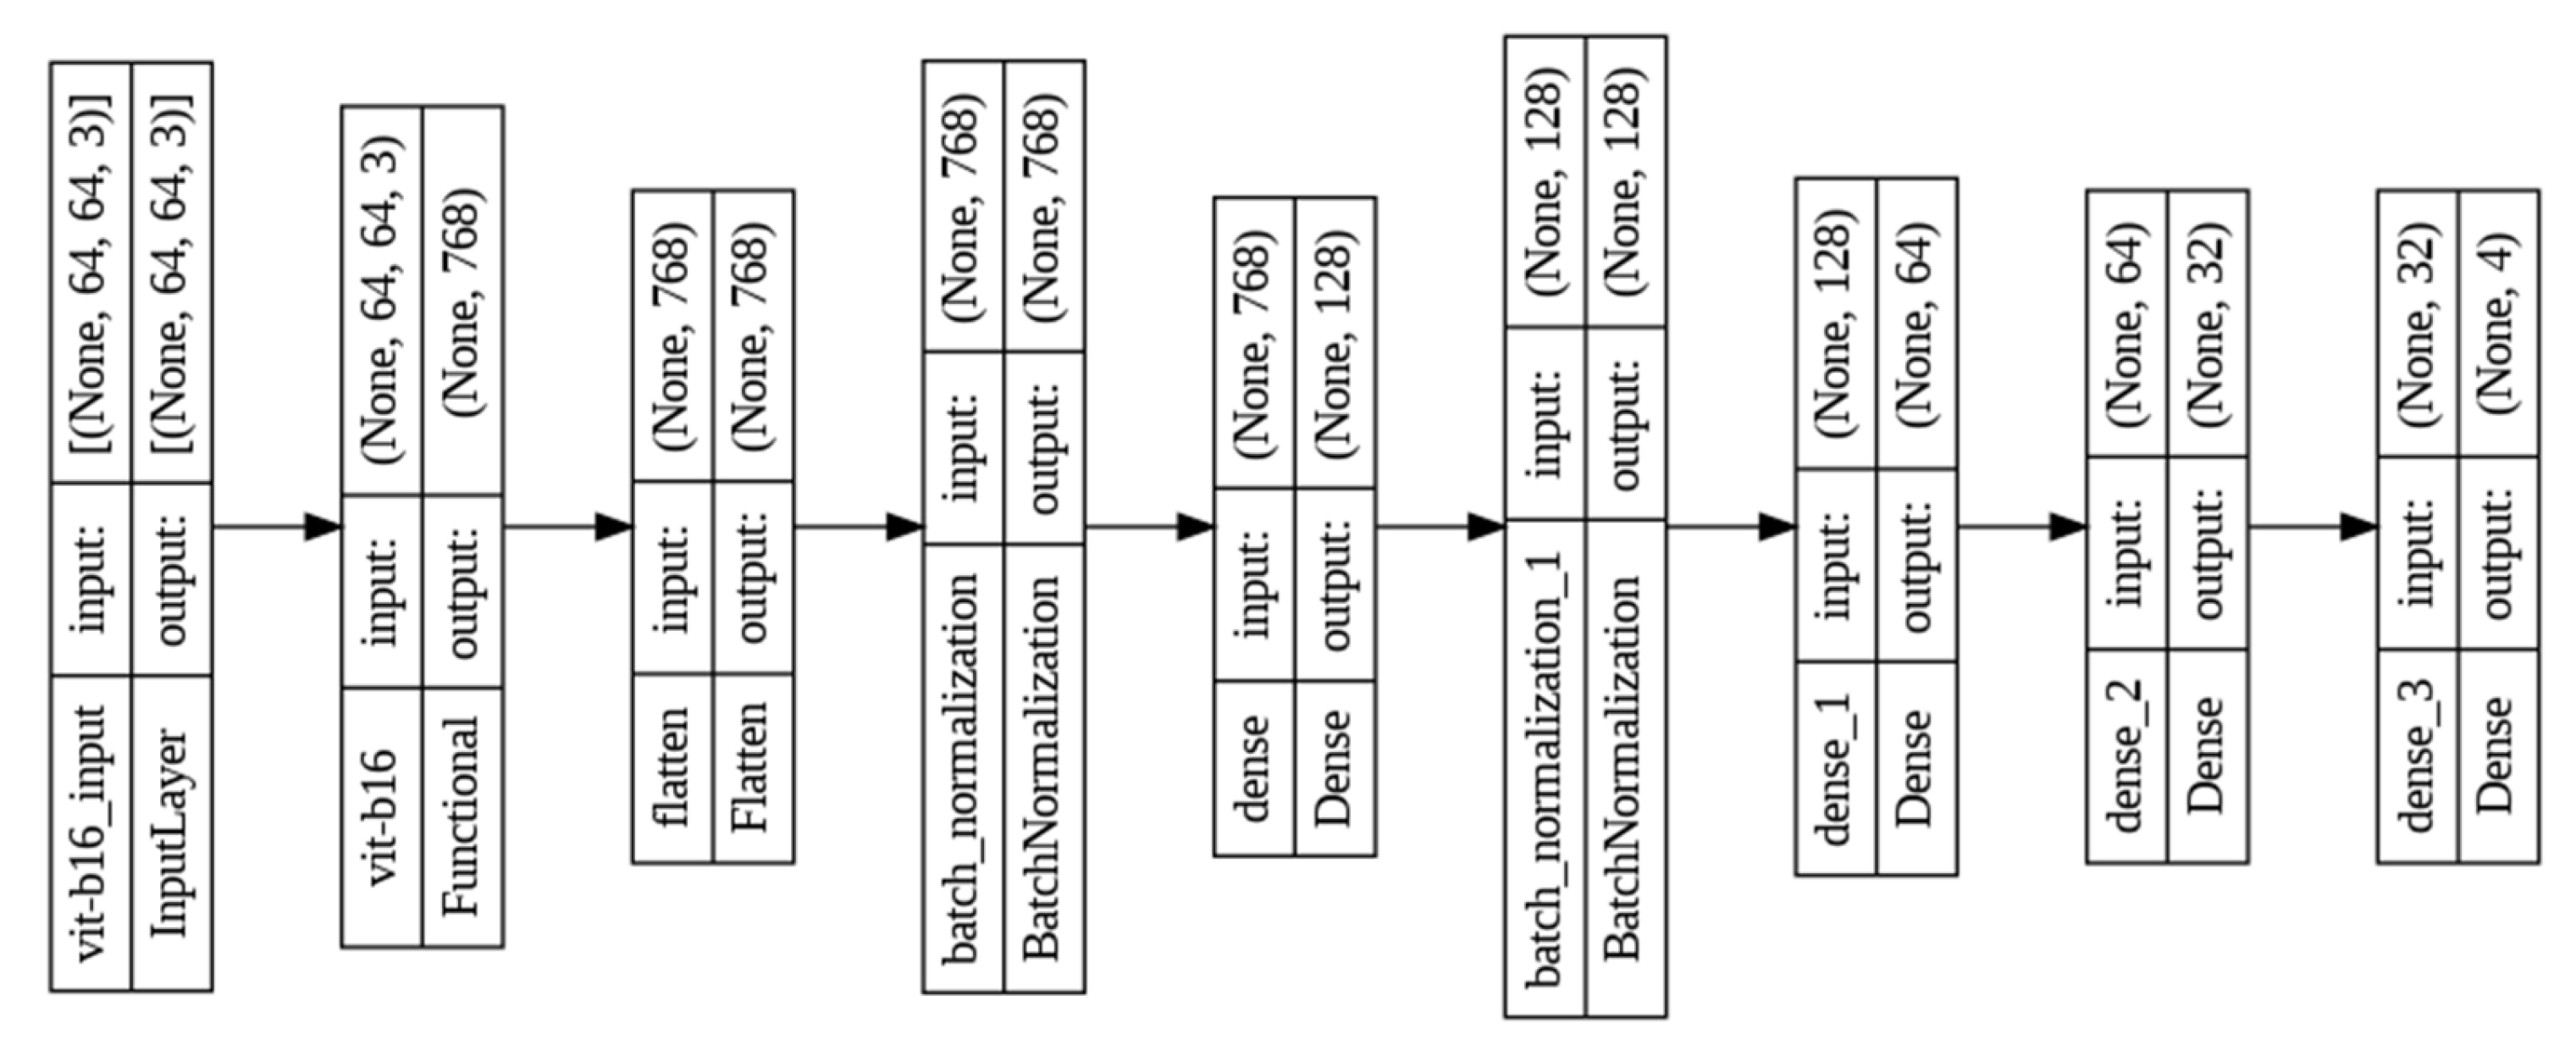
| ViT-B16 (Functional) | (None, 768) | 85,660,416 |
| flatten_6 (Flatten) | (None, 768) | 0 |
| batch_normalization_12 (Batch Normalization) | (None, 768) | 3072 |
| dense_24 (Dense) | (None, 128) | 98,432 |
| batch_normalization_13 (Batch Normalization) | (None, 128) | 512 |
| dense_25 (Dense) | (None, 64) | 8256 |
| dense_26 (Dense) | (None, 32) | 2080 |
| dense_27 (Dense) | (None, 4) | 132 |
| Total params: 85,772,900 | ||
| Trainable params: 85,771,108 | ||
| Nontrainable params: 1792 |
| Parameters | Classification with ViT-B16 | Classification with VGG19 | Classification with ResNet152V2 | Classification with EfficientNetV2B3 |
|---|---|---|---|---|
| Train_loss | 0.05 | 0.08 | 0.07 | 0.08 |
| Train_accuracy | 95.21 | 92.14 | 89.13 | 84.15 |
| Training time | 4 h 17 min | 2 h 13 min | 2 h 39 min | 1 h 46 min |
| Epoch | 10 | 16 | 20 | 25 |
| Optimizer | Adam | Adam | Adam | Adam |
| Initial learning rate | 0.001 | 0.0001 | 0.001 | 0.00001 |
| Loss function | categorical cross entropy | categorical cross entropy | categorical cross entropy | categorical cross entropy |
| Output activation function | Softmax | Softmax | Softmax | Softmax |
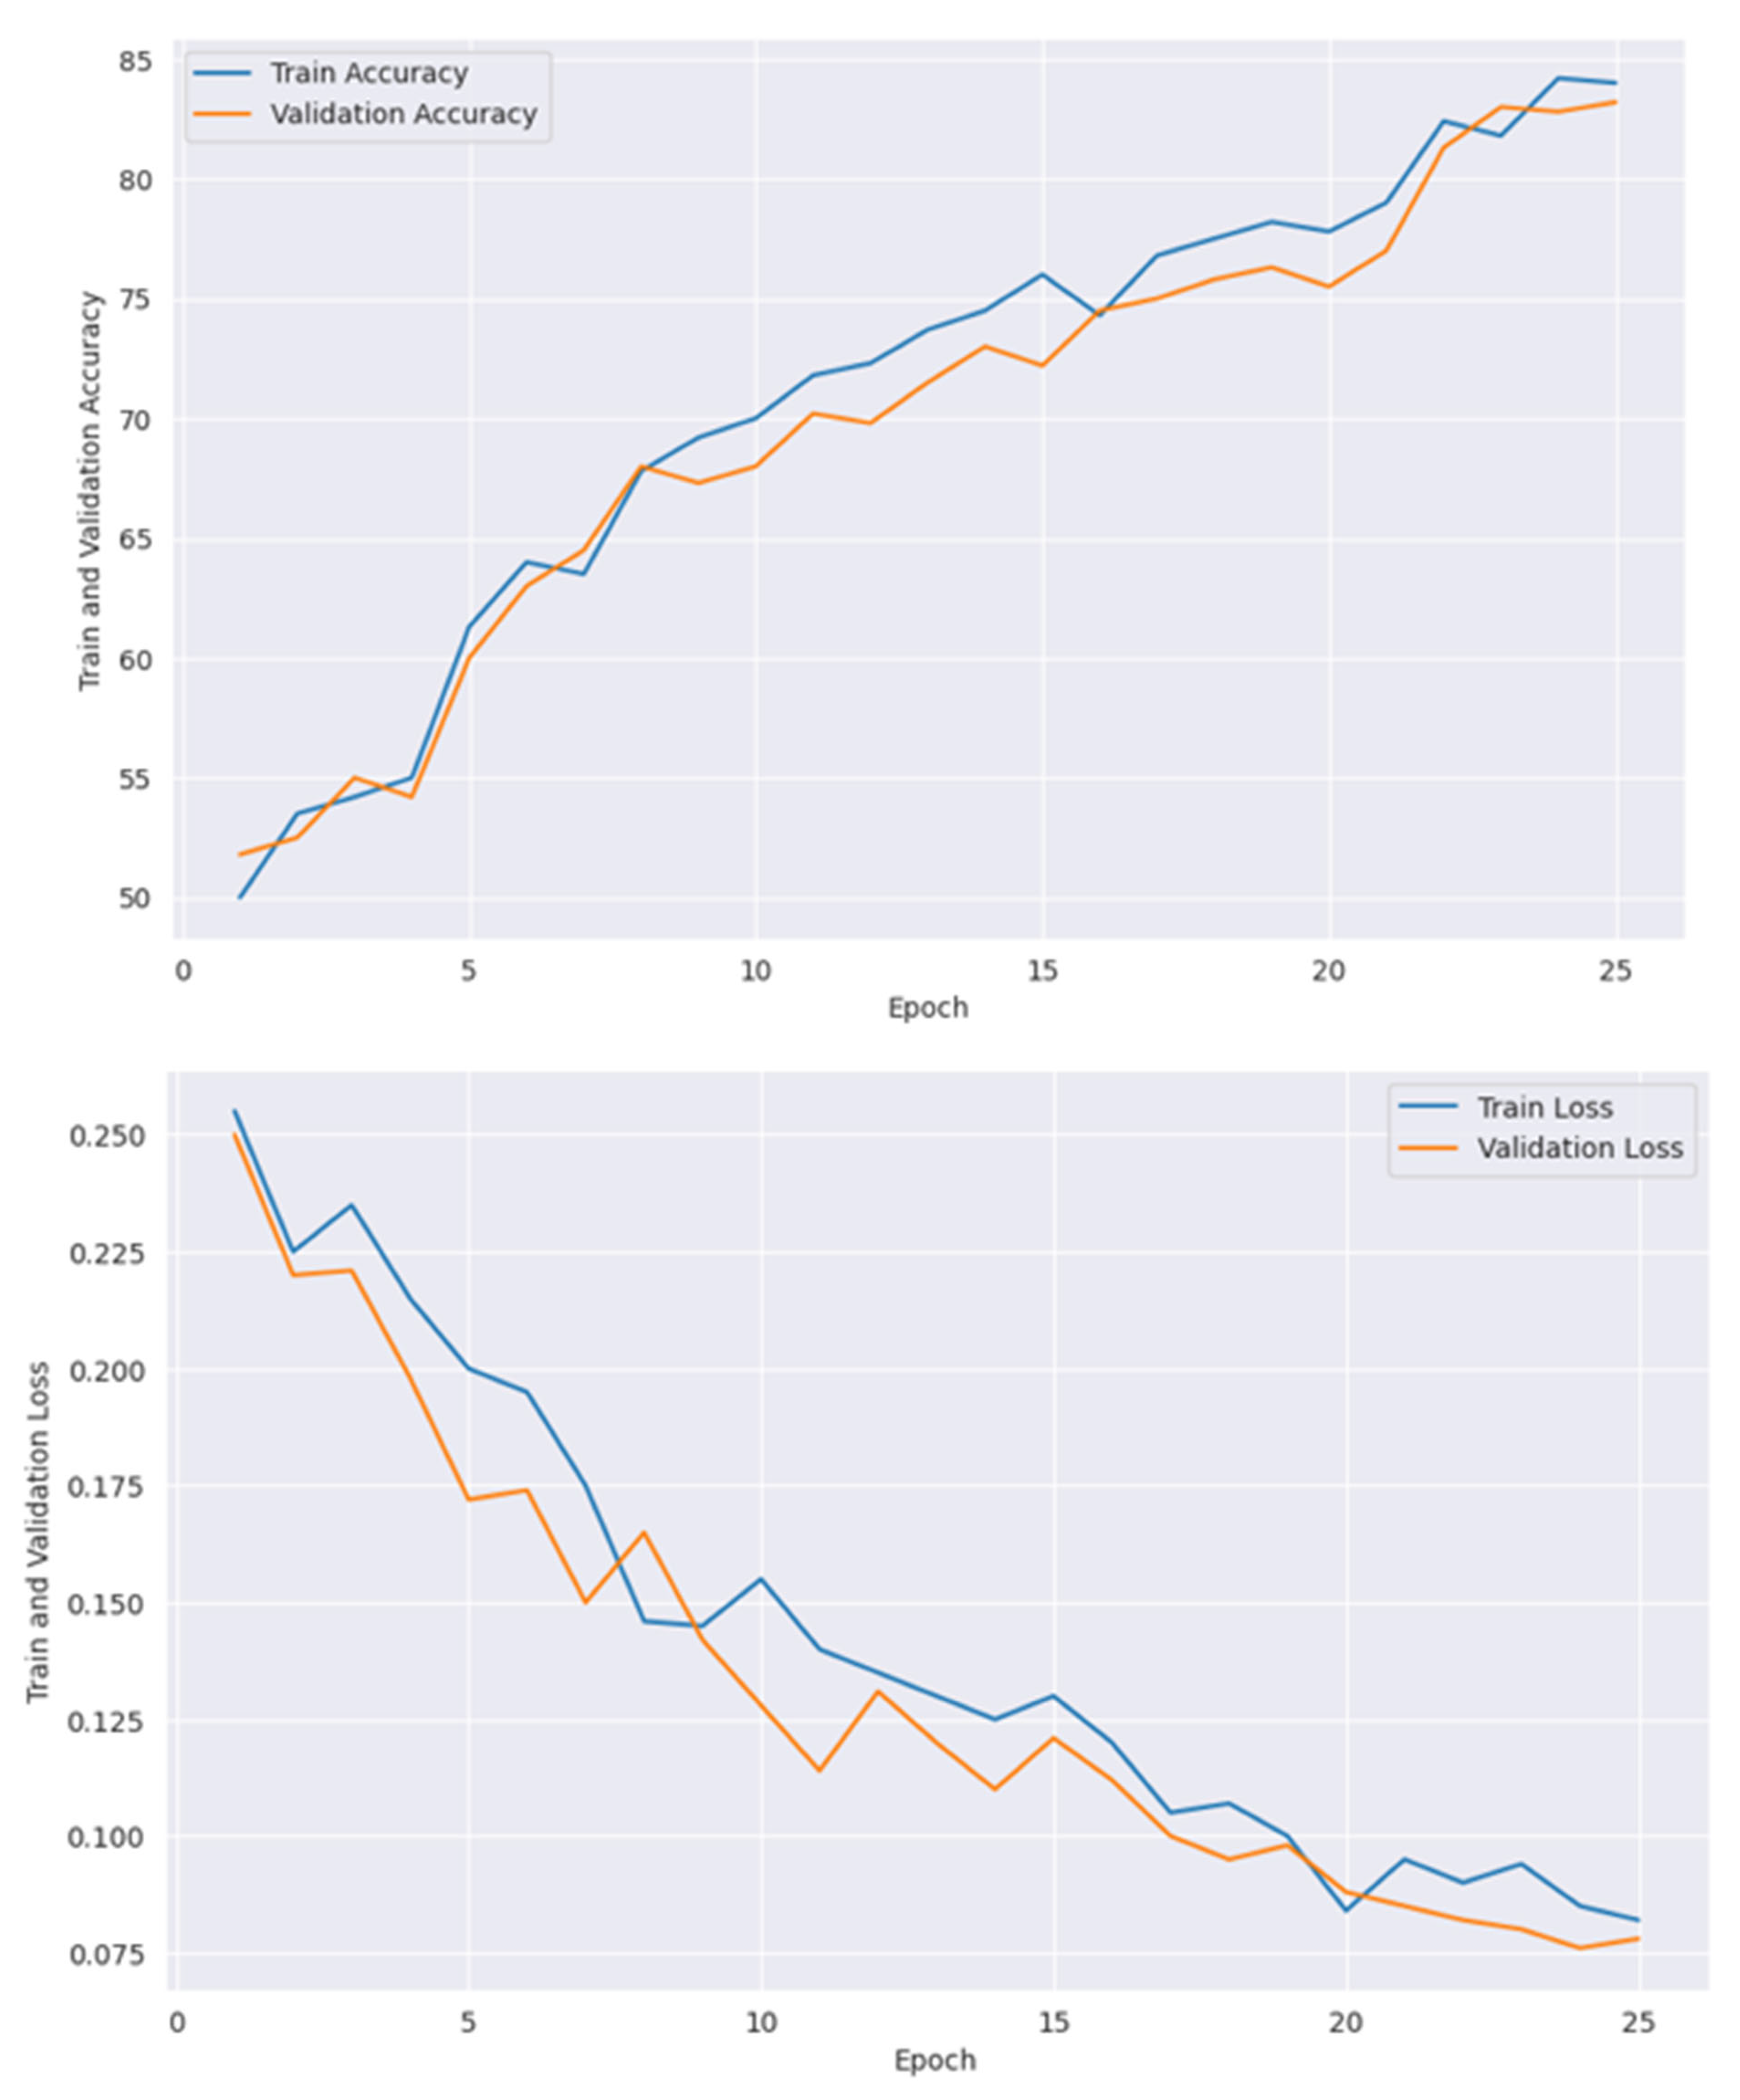
| Number of Epoch | Train Accuracy | Train Loss | Validation Accuracy | Validation Loss |
|---|---|---|---|---|
| 1 | 81 | 0.19 | 83 | 0.16 |
| 2 | 83 | 0.18 | 86 | 0.15 |
| 3 | 84 | 0.15 | 85 | 0.16 |
| 4 | 83 | 0.13 | 86 | 0.14 |
| 5 | 89 | 0.12 | 90 | 0.12 |
| 6 | 91 | 0.12 | 93 | 0.13 |
| 7 | 93 | 0.09 | 91 | 0.07 |
| 8 | 92 | 0.06 | 94 | 0.05 |
| 9 | 94 | 0.07 | 95 | 0.06 |
| 10 | 95 | 0.05 | 96 | 0.04 |
| Models | Best Learning Rate | Best Dropout Rate | Best Batch Size | Best Number of Epochs | Highest Accuracy | Minimum Loss | Best Fitness Score |
|---|---|---|---|---|---|---|---|
| ViT-B16 | 0.001 | - | 8 | 10 | 95.21 | 0.05 | −0.03 |
| VGG19 | 0.0001 | 0.2 | 32 | 16 | 92.14 | 0.08 | −0.01 |
| ResNet152V2 | 0.001 | 0.2 | 16 | 20 | 89.13 | 0.07 | −0.01 |
| EfficientNetV2B3 | 0.00001 | 0.1 | 32 | 25 | 84.15 | 0.08 | −0.004 |
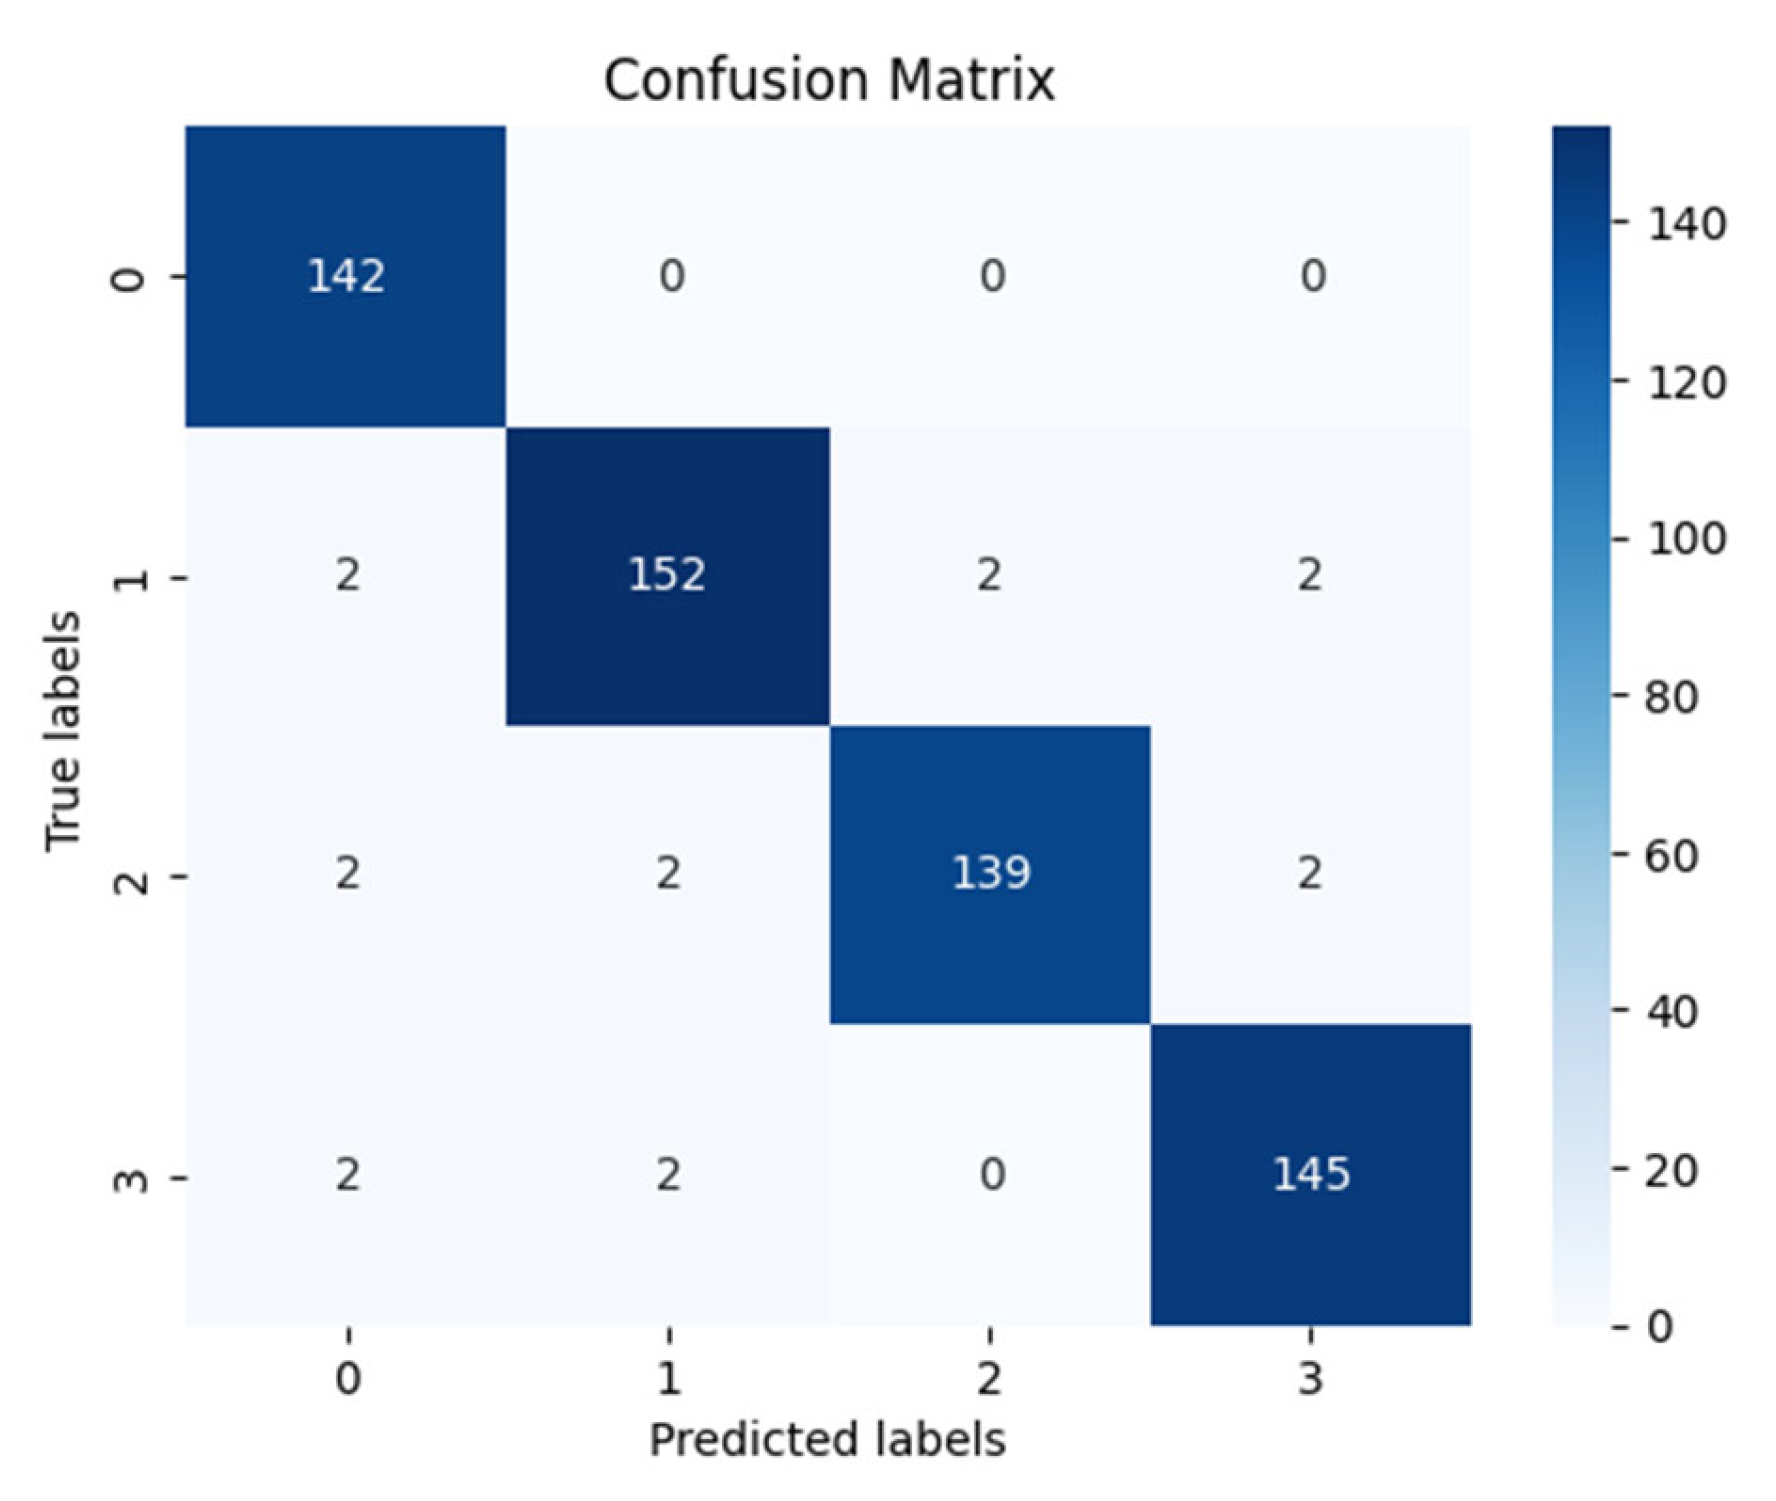
| Precision | Recall | f1-Score | Support | |
|---|---|---|---|---|
| Mild Demented | 0.9595 | 1.0000 | 0.9793 | 142 |
| Moderate Demented | 0.9744 | 0.9620 | 0.9682 | 158 |
| Nondemented | 0.9858 | 0.9586 | 0.9720 | 145 |
| Very Mild Demented | 0.9732 | 0.9732 | 0.9732 | 149 |
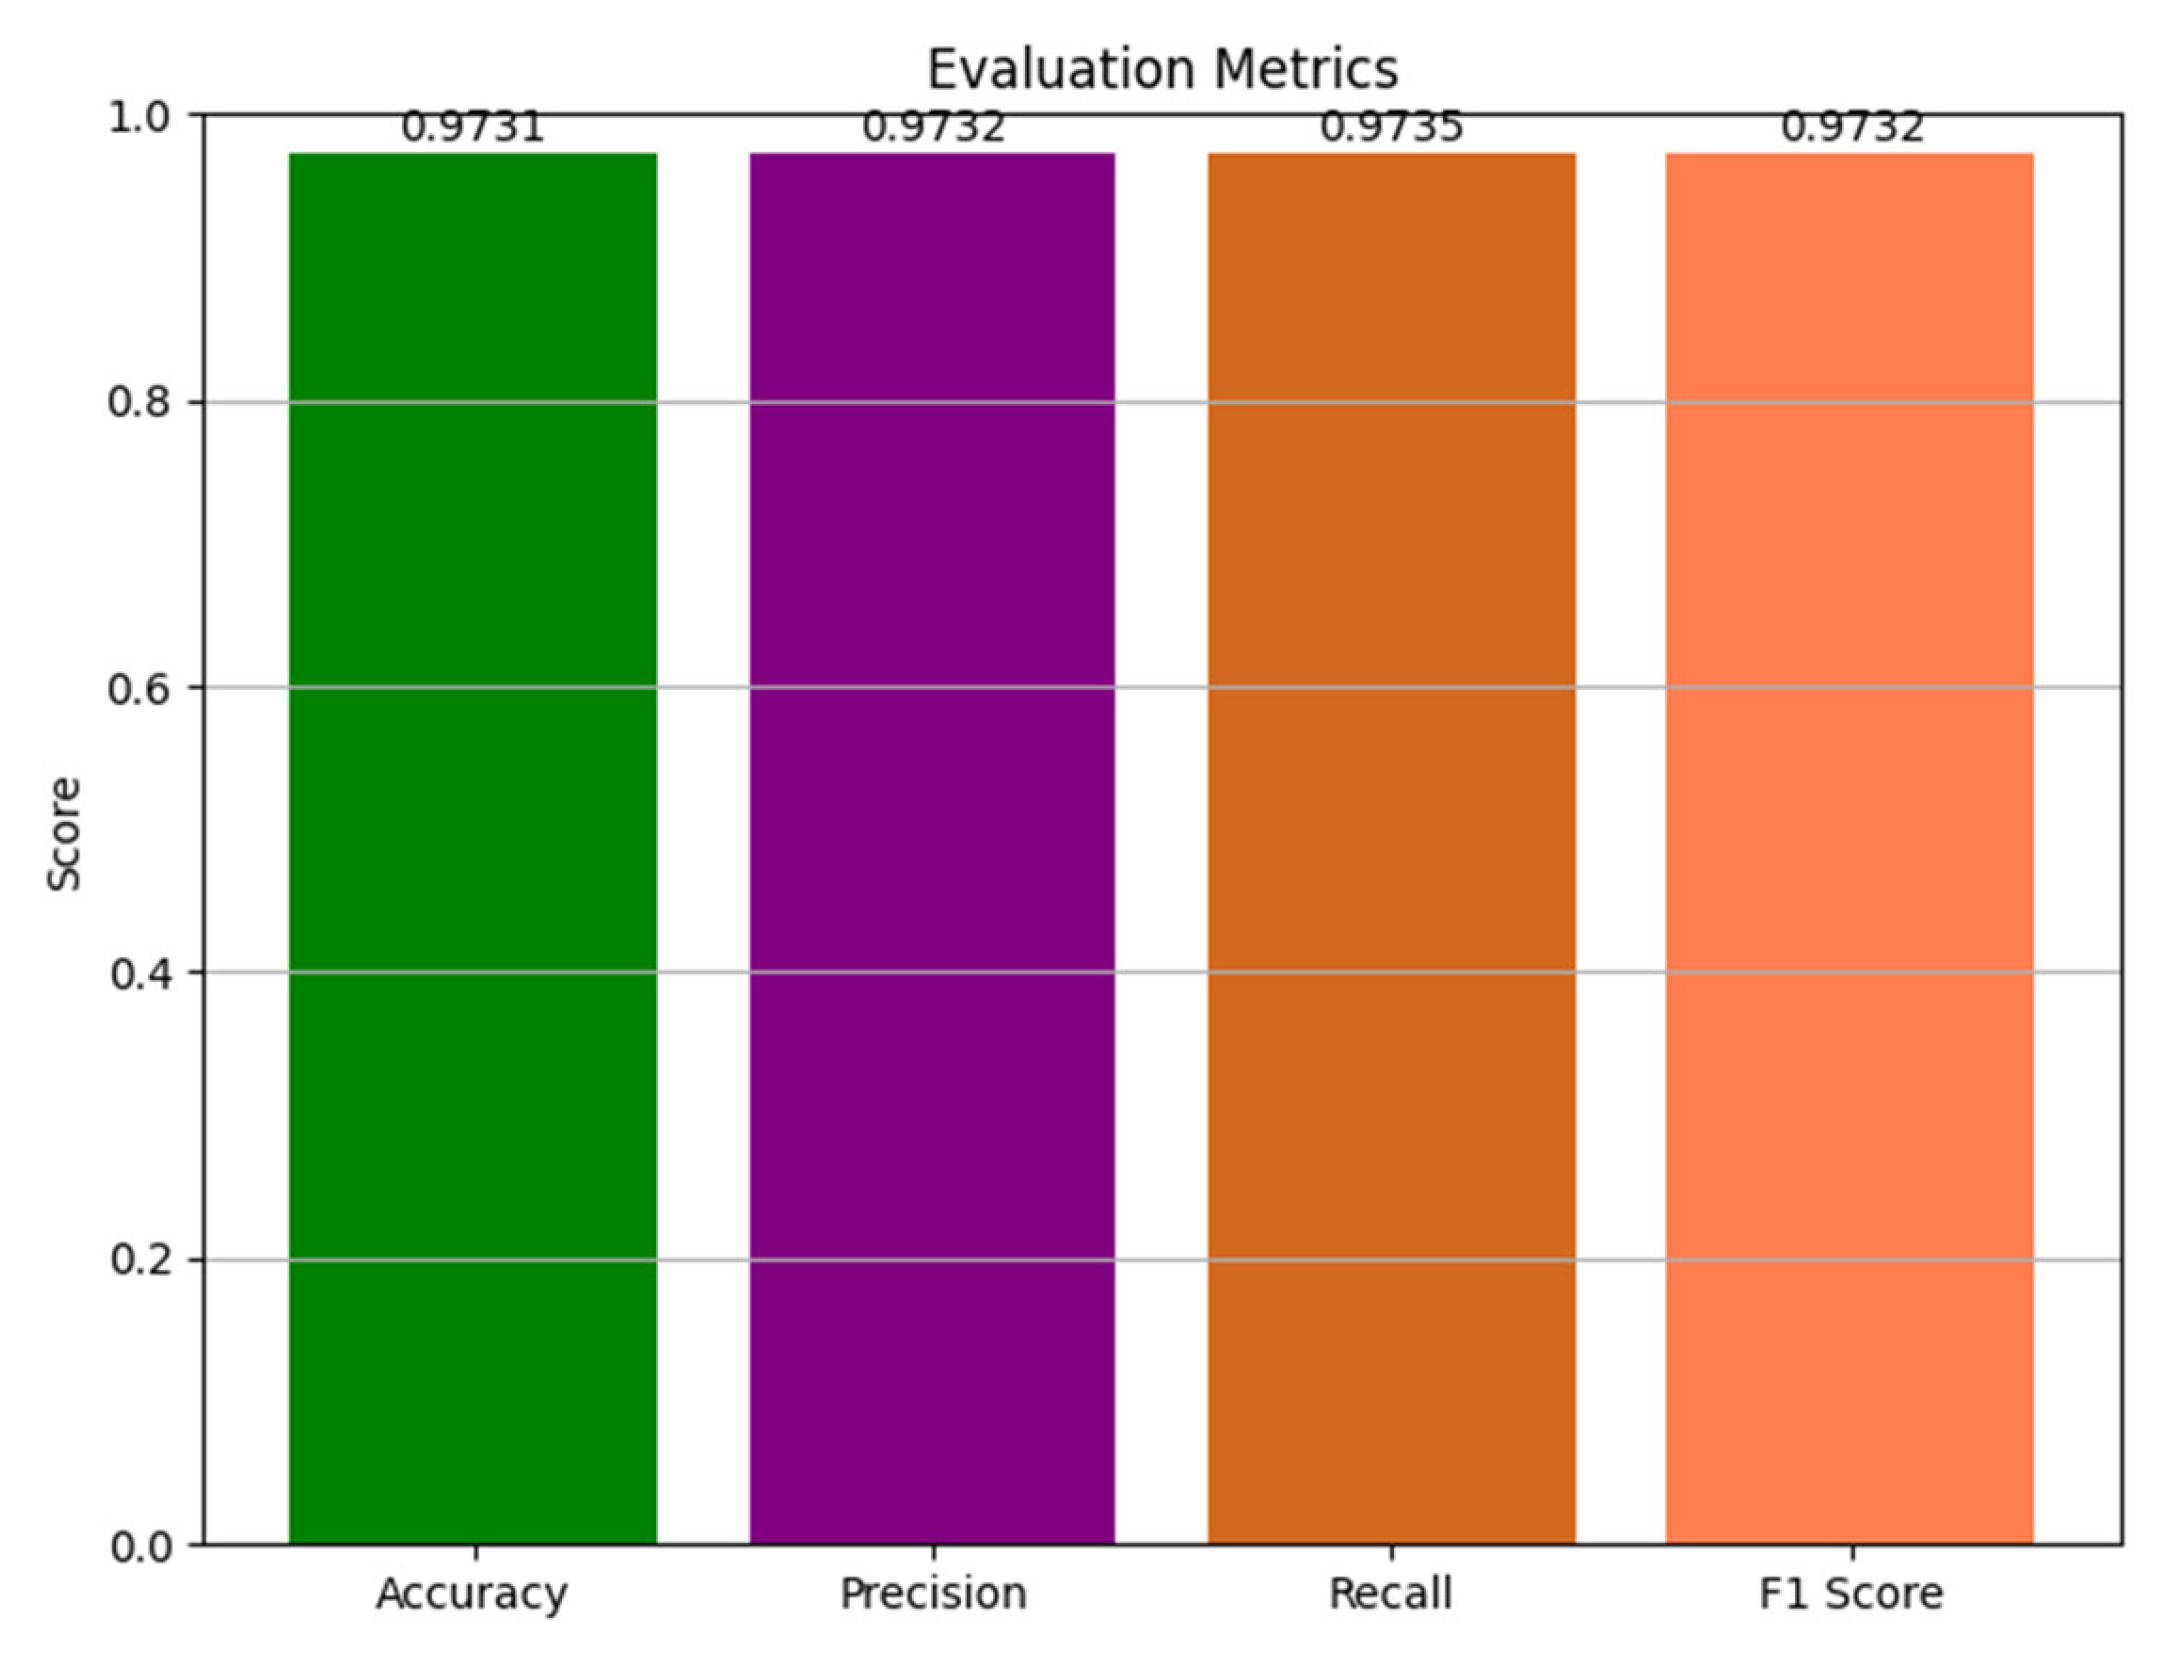
| accuracy | 0.9731 | 594 | ||
| macro avg | 0.9732 | 0.9735 | 0.9732 | 594 |
| weighted avg | 0.9733 | 0.9731 | 0.9730 | 594 |
| Models | Training Accuracy (%) | Testing Accuracy (%) | Processing Time During Training |
|---|---|---|---|
| ViT-B16 | 95.21 | 96.12 | 4 h 17 m |
| VGG19 | 92.14 | 94.27 | 2 h 13 m |
| ResNet152V2 | 89.13 | 89.56 | 2 h 39 m |
| EfficientNetV2B3 | 84.15 | 84.17 | 1 h 46 m |
| Ensemble model (Not optimized) | 96.39 | 96.43 | 1 h 55 m |
| Ensemble model (Optimized with GOA) | 97.25 | 97.31 | 1 h 41 m |
| WV1 | WV2 | WV3 | WV4 | Ensemble Accuracy |
|---|---|---|---|---|
| 0.1 | 0.2 | 0.3 | 0.4 | 96.42 |
| 0.2 | 0.1 | 0.4 | 0.3 | 96.68 |
| 0.3 | 0.4 | 0.1 | 0.2 | 96.83 |
| 0.4 | 0.3 | 0.2 | 0.1 | 97.19 |
| 0.4 | 0.3 | 0.3 | 0.4 | 97.04 |
| 0.4 | 0.3 | 0.4 | 0.3 | 97.25 |
| 0.4 | 0.3 | 0.3 | 0.1 | 97.31 |
| Split Count | ViT-B16 | VGG19 | ResNet152V2 | EfficientNetV2B3 | Ensemble Model |
|---|---|---|---|---|---|
| 1 | 96.04 | 94.22 | 89.51 | 84.11 | 97.26 |
| 2 | 95.86 | 94.14 | 89.36 | 84.04 | 97.14 |
| 3 | 95.96 | 94.08 | 89.22 | 83.99 | 96.99 |
| 4 | 96.08 | 94.18 | 89.41 | 83.94 | 97.12 |
| 5 | 95.88 | 94.05 | 89.31 | 84.09 | 97.06 |
| Arithmetic Mean | 95.96 | 94.13 | 89.36 | 84.03 | 97.14 |
| Variance | 0.007 | 0.003 | 0.009 | 0.003 | 0.008 |
| Standard deviation (std.) | 0.08 | 0.06 | 0.09 | 0.06 | 0.08 |
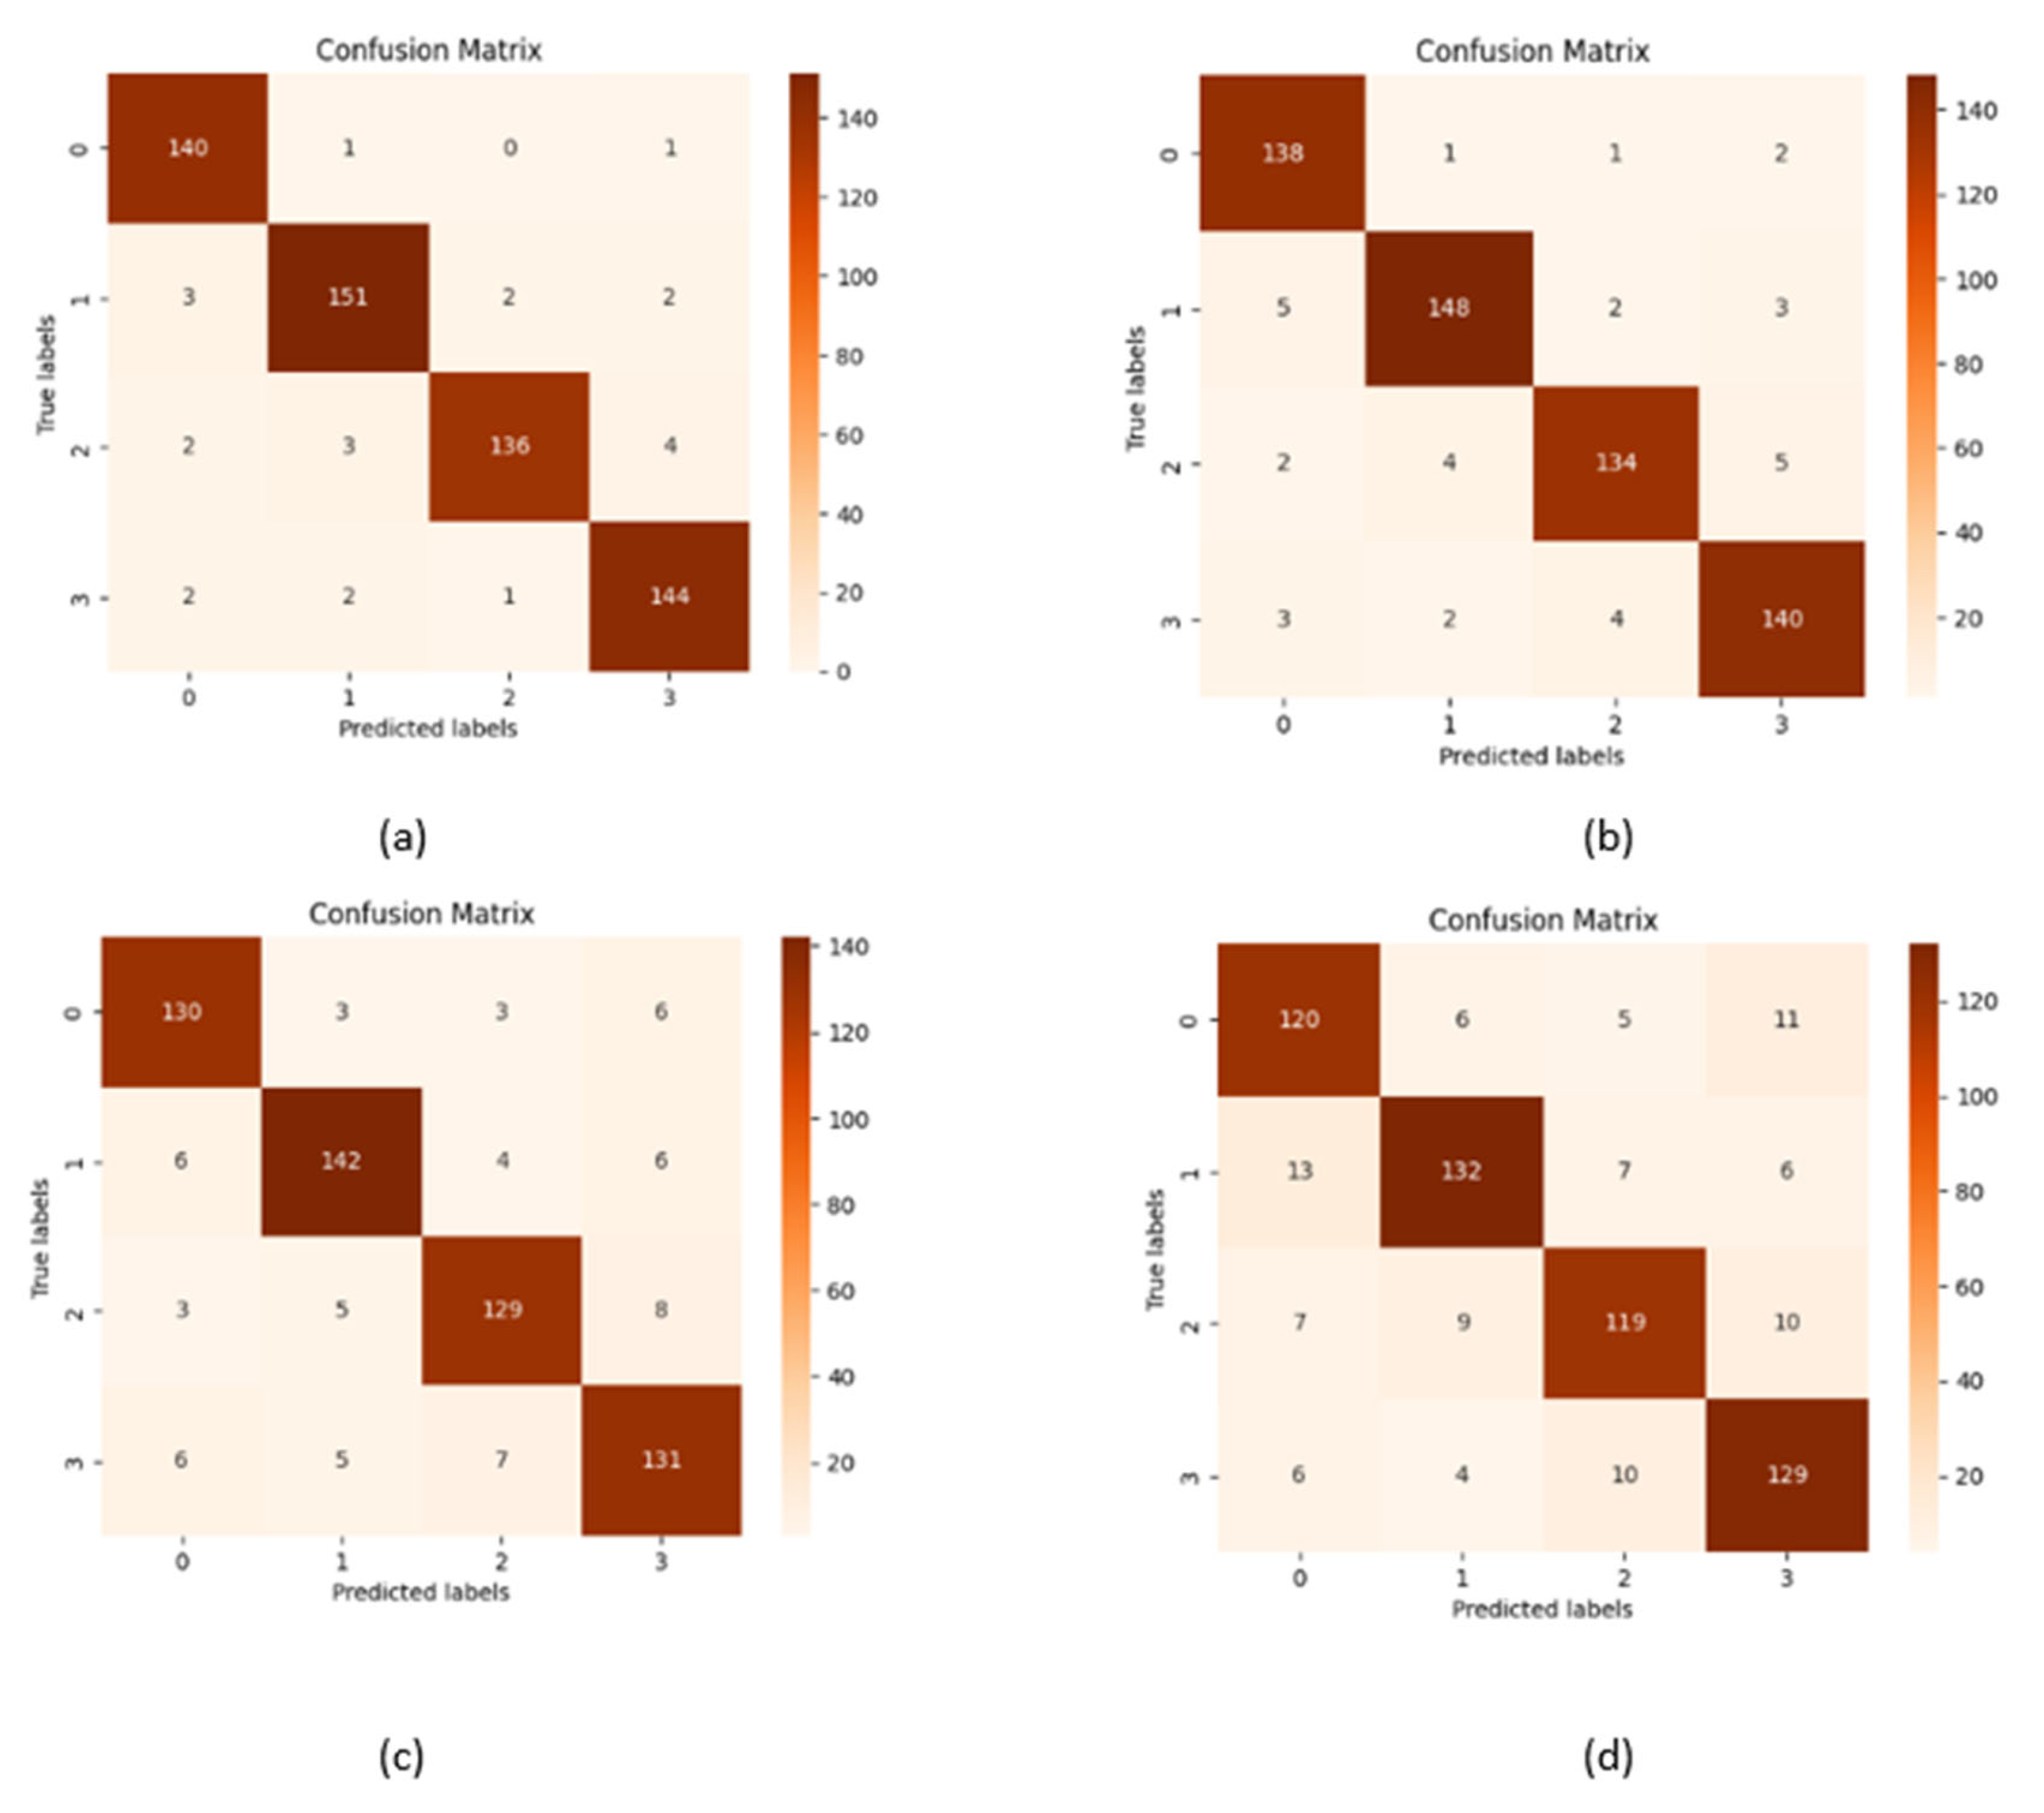
| Performance metrics | ViT-B16 | VGG19 | ResNet152V2 | EfficientNetV2B33 |
|---|---|---|---|---|
| Accuracy | 96.12 | 94.27 | 89.56 | 84.17 |
| Precision | 96.15 | 94.27 | 89.55 | 84.18 |
| Recall | 96.14 | 94.30 | 89.57 | 84.17 |
| F1 Score | 0.9613 | 0.9427 | 0.8955 | 0.8414 |
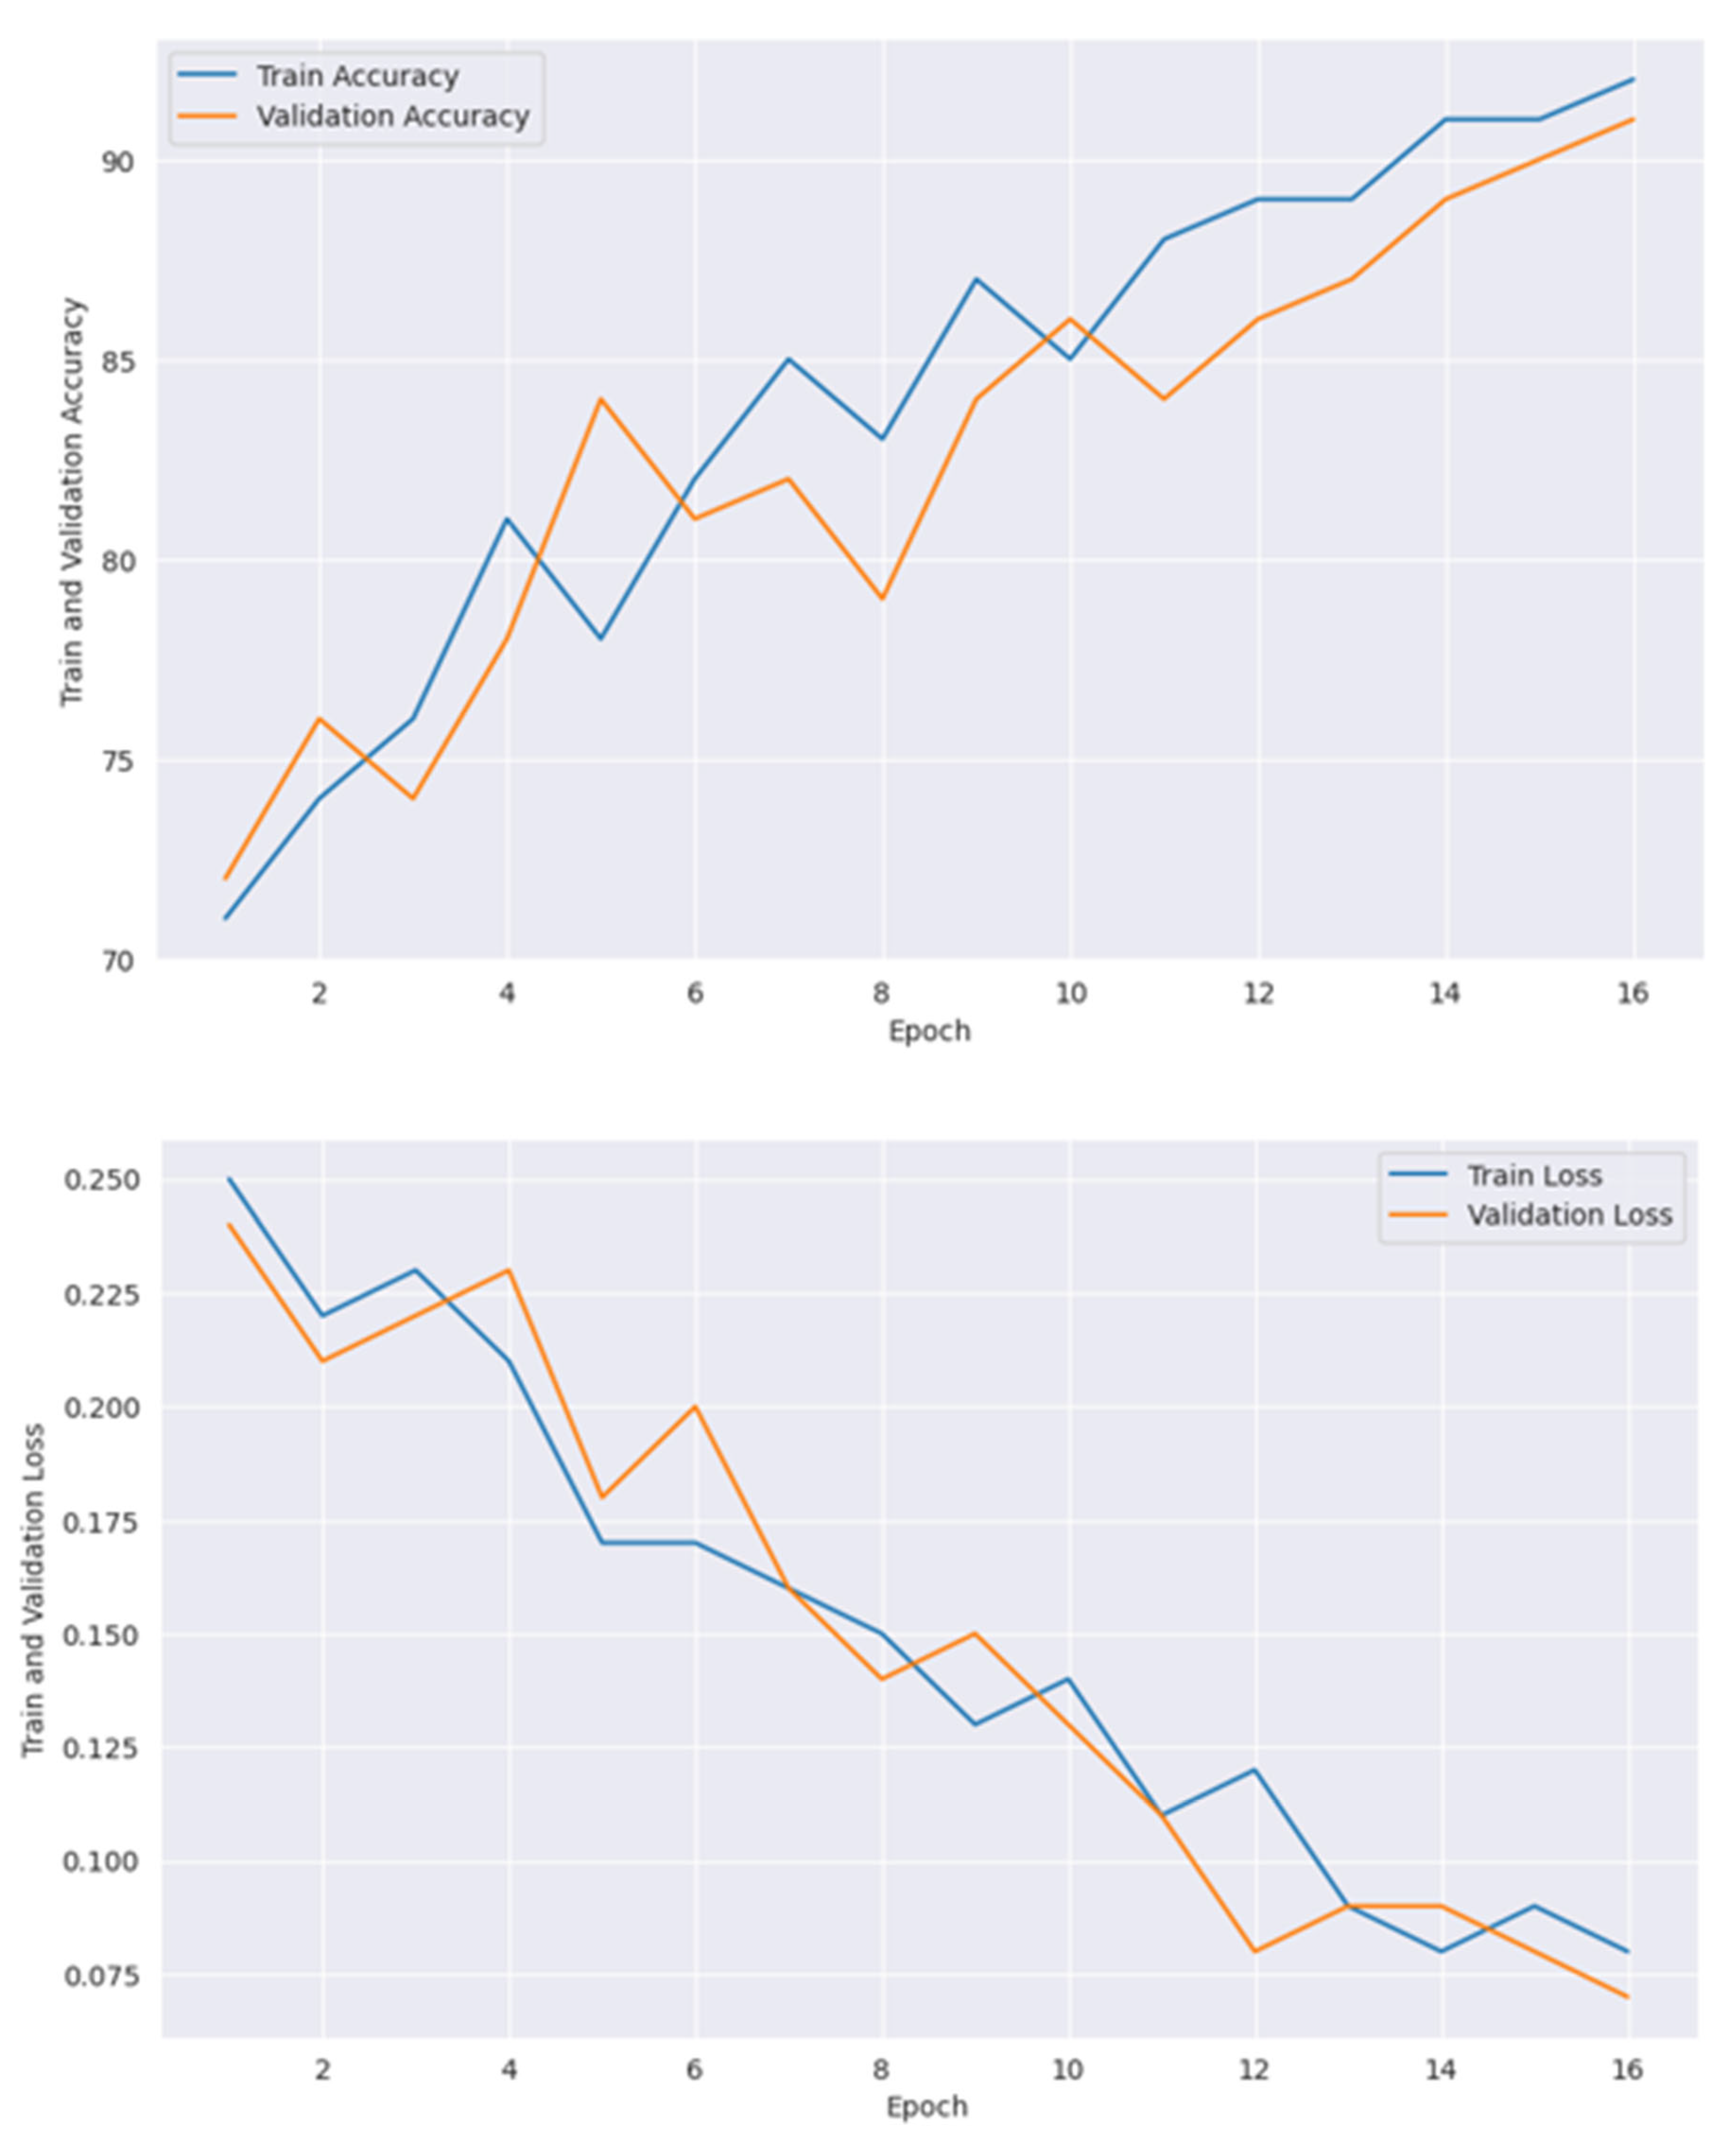
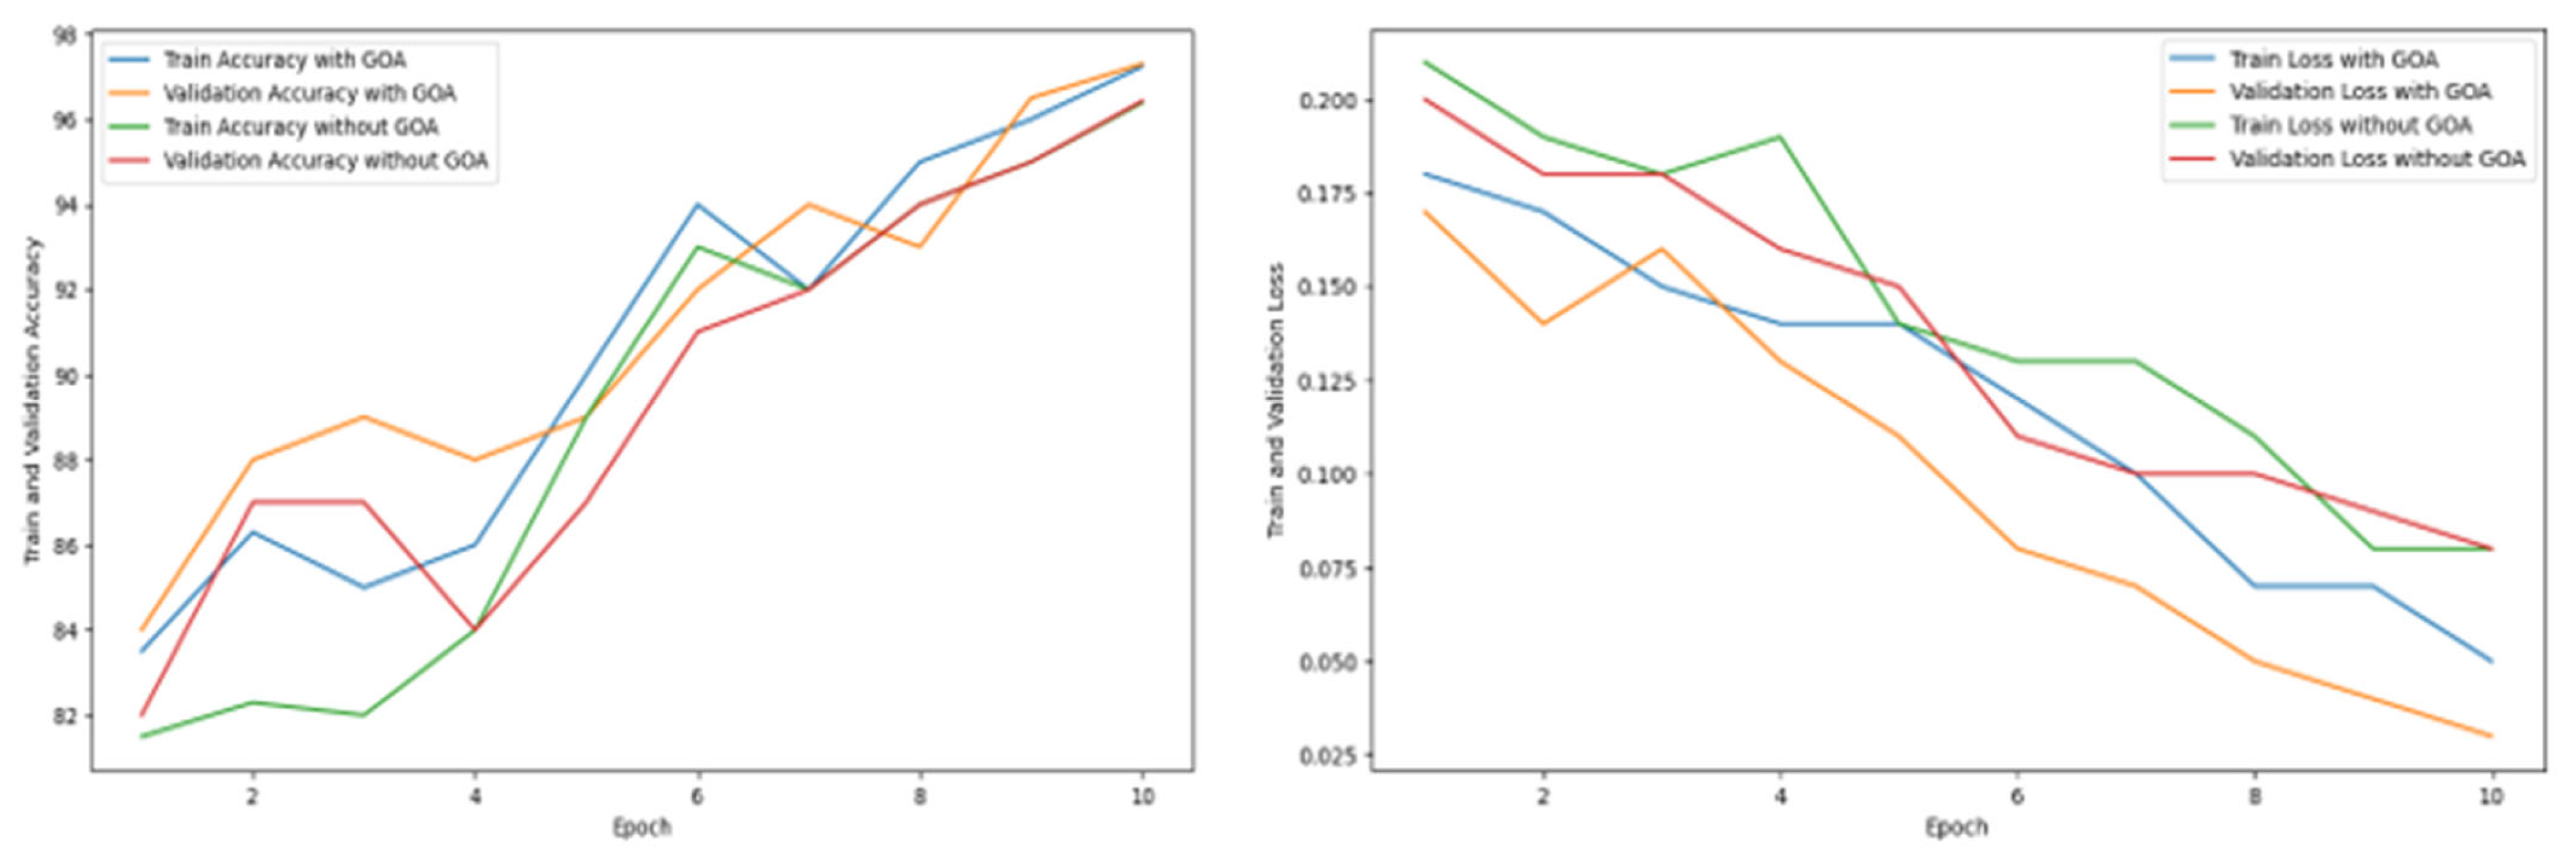
| Epoch | Train Accuracy with GOA | Validation Accuracy with GOA | Train Accuracy Without GOA | Validation Accuracy Without GOA | Train Loss with GOA | Validation Loss with GOA | Train Loss Without GOA | Validation Loss Without GOA |
|---|---|---|---|---|---|---|---|---|
| 1 | 83.51 | 84.37 | 81.54 | 82.73 | 0.18 | 0.17 | 0.21 | 0.20 |
| 2 | 86.34 | 88.54 | 82.38 | 87.58 | 0.17 | 0.14 | 0.19 | 0.18 |
| 3 | 85.54 | 89.86 | 82.28 | 87.52 | 0.15 | 0.16 | 0.18 | 0.18 |
| 4 | 86.68 | 88.36 | 84.56 | 84.87 | 0.14 | 0.13 | 0.19 | 0.16 |
| 5 | 90.67 | 89.34 | 89.25 | 87.23 | 0.14 | 0.11 | 0.14 | 0.15 |
| 6 | 94.68 | 92.75 | 93.86 | 91.78 | 0.12 | 0.08 | 0.13 | 0.11 |
| 7 | 92.36 | 94.97 | 92.64 | 92.64 | 0.10 | 0.07 | 0.13 | 0.10 |
| 8 | 95.43 | 93.65 | 94.16 | 94.34 | 0.07 | 0.05 | 0.11 | 0.10 |
| 9 | 96.28 | 96.52 | 95.31 | 95.78 | 0.07 | 0.04 | 0.08 | 0.09 |
| 10 | 97.25 | 97.31 | 96.39 | 96.43 | 0.05 | 0.03 | 0.08 | 0.08 |
| Authors | Model Used | Dataset | Total Images | Methodology | Accuracy | Focus Area | Limitations |
|---|---|---|---|---|---|---|---|
| Butta et al. (2023) [80] | Ensemble DL Model (O-ANN, Capsule CNN, Autoencoder) | Kaggle Dataset | 6400 MRI Images | Preprocessing (histogram equalization, Gaussian filtering, skull stripping), ROI extraction (attention-based U-NET with EEO optimization) | 94.52% | Early and precise AD diagnosis using MRI | Computational complexity due to hybrid optimization and ensemble techniques; limited testing on diverse datasets |
| Agarwal et al. (2023) [81] | EfficientNet-b0 CNN with fusion of end-to-end and transfer learning (TL) | IXI and ADNI Dataset | 600 MRI scans 916 MRI Scans (ADNI) | Preprocessing pipeline applied to T1W MRI scans; CNN model trained and evaluated for sMCI vs. AD (binary) and AD vs. CN vs. sMCI (multiclass) classification | Binary: 93.10% (testing), Multiclass: 87.38% (testing) | Early detection and staging of AD using MRI biomarkers | Requires further validation on larger and more diverse datasets; computational demands of CNN training |
| Saim et al. (2024) [82] | Nine CNN architectures (AlexNet, Inception, EfficientNet-b0, etc.) | Kaggle Alzheimer’s dataset ADNI dataset | 5091 Images (Train) 1273 Images (Test) | Feature extraction using pretrained CNNs (fully connected, inception-based, residual-based, etc.); classification using MSVM, KNN, DT; | Kaggle: ADNI: 78.54% (MSVM) | Early detection and staging of AD using neuroimaging biomarkers | Performance on ADNI dataset lower; needs further validation on larger and more diverse datasets. |
| Sanjeev Kumar et al. (2023) [42] | InceptionResNetV2 and ResNet50 | ADNI dataset | 6400 MRI Images | Deep learning architecture for AD stage classification | 86.84% | Staged AD classification | Requires high-quality annotated data |
| Lu et al. (2023) [44] | ConvNeXt-DMLP | ADNI Dataset | 33,984 | Multiclassification framework to reduce imaging overlap of AD and MCI | 78.95% | AD and MCI classification | Limited generalization to external datasets |
| Proposed Work | Weighted ensemble model combined of ViT-B16, VGG19, ResNet152V2, EfficientNetV2B3 | OASIS Dataset, collected from kaggle | 234,220 | Multiclass classification framework, optimized with Grasshopper Optimization Algorithm | 97.31% | Classify dementia status that can be integrated to IoMT infrastructure |
Disclaimer/Publisher’s Note: The statements, opinions and data contained in all publications are solely those of the individual author(s) and contributor(s) and not of MDPI and/or the editor(s). MDPI and/or the editor(s) disclaim responsibility for any injury to people or property resulting from any ideas, methods, instructions or products referred to in the content. |
© 2025 by the authors. Licensee MDPI, Basel, Switzerland. This article is an open access article distributed under the terms and conditions of the Creative Commons Attribution (CC BY) license (https://creativecommons.org/licenses/by/4.0/).
Share and Cite
Chakra Bortty, J.; Chakraborty, G.S.; Noman, I.R.; Batra, S.; Das, J.; Bishnu, K.K.; Tarafder, M.T.R.; Islam, A. A Novel Diagnostic Framework with an Optimized Ensemble of Vision Transformers and Convolutional Neural Networks for Enhanced Alzheimer’s Disease Detection in Medical Imaging. Diagnostics 2025, 15, 789. https://doi.org/10.3390/diagnostics15060789
Chakra Bortty J, Chakraborty GS, Noman IR, Batra S, Das J, Bishnu KK, Tarafder MTR, Islam A. A Novel Diagnostic Framework with an Optimized Ensemble of Vision Transformers and Convolutional Neural Networks for Enhanced Alzheimer’s Disease Detection in Medical Imaging. Diagnostics. 2025; 15(6):789. https://doi.org/10.3390/diagnostics15060789
Chicago/Turabian StyleChakra Bortty, Joy, Gouri Shankar Chakraborty, Inshad Rahman Noman, Salil Batra, Joy Das, Kanchon Kumar Bishnu, Md Tanvir Rahman Tarafder, and Araf Islam. 2025. "A Novel Diagnostic Framework with an Optimized Ensemble of Vision Transformers and Convolutional Neural Networks for Enhanced Alzheimer’s Disease Detection in Medical Imaging" Diagnostics 15, no. 6: 789. https://doi.org/10.3390/diagnostics15060789
APA StyleChakra Bortty, J., Chakraborty, G. S., Noman, I. R., Batra, S., Das, J., Bishnu, K. K., Tarafder, M. T. R., & Islam, A. (2025). A Novel Diagnostic Framework with an Optimized Ensemble of Vision Transformers and Convolutional Neural Networks for Enhanced Alzheimer’s Disease Detection in Medical Imaging. Diagnostics, 15(6), 789. https://doi.org/10.3390/diagnostics15060789