Figure 1.
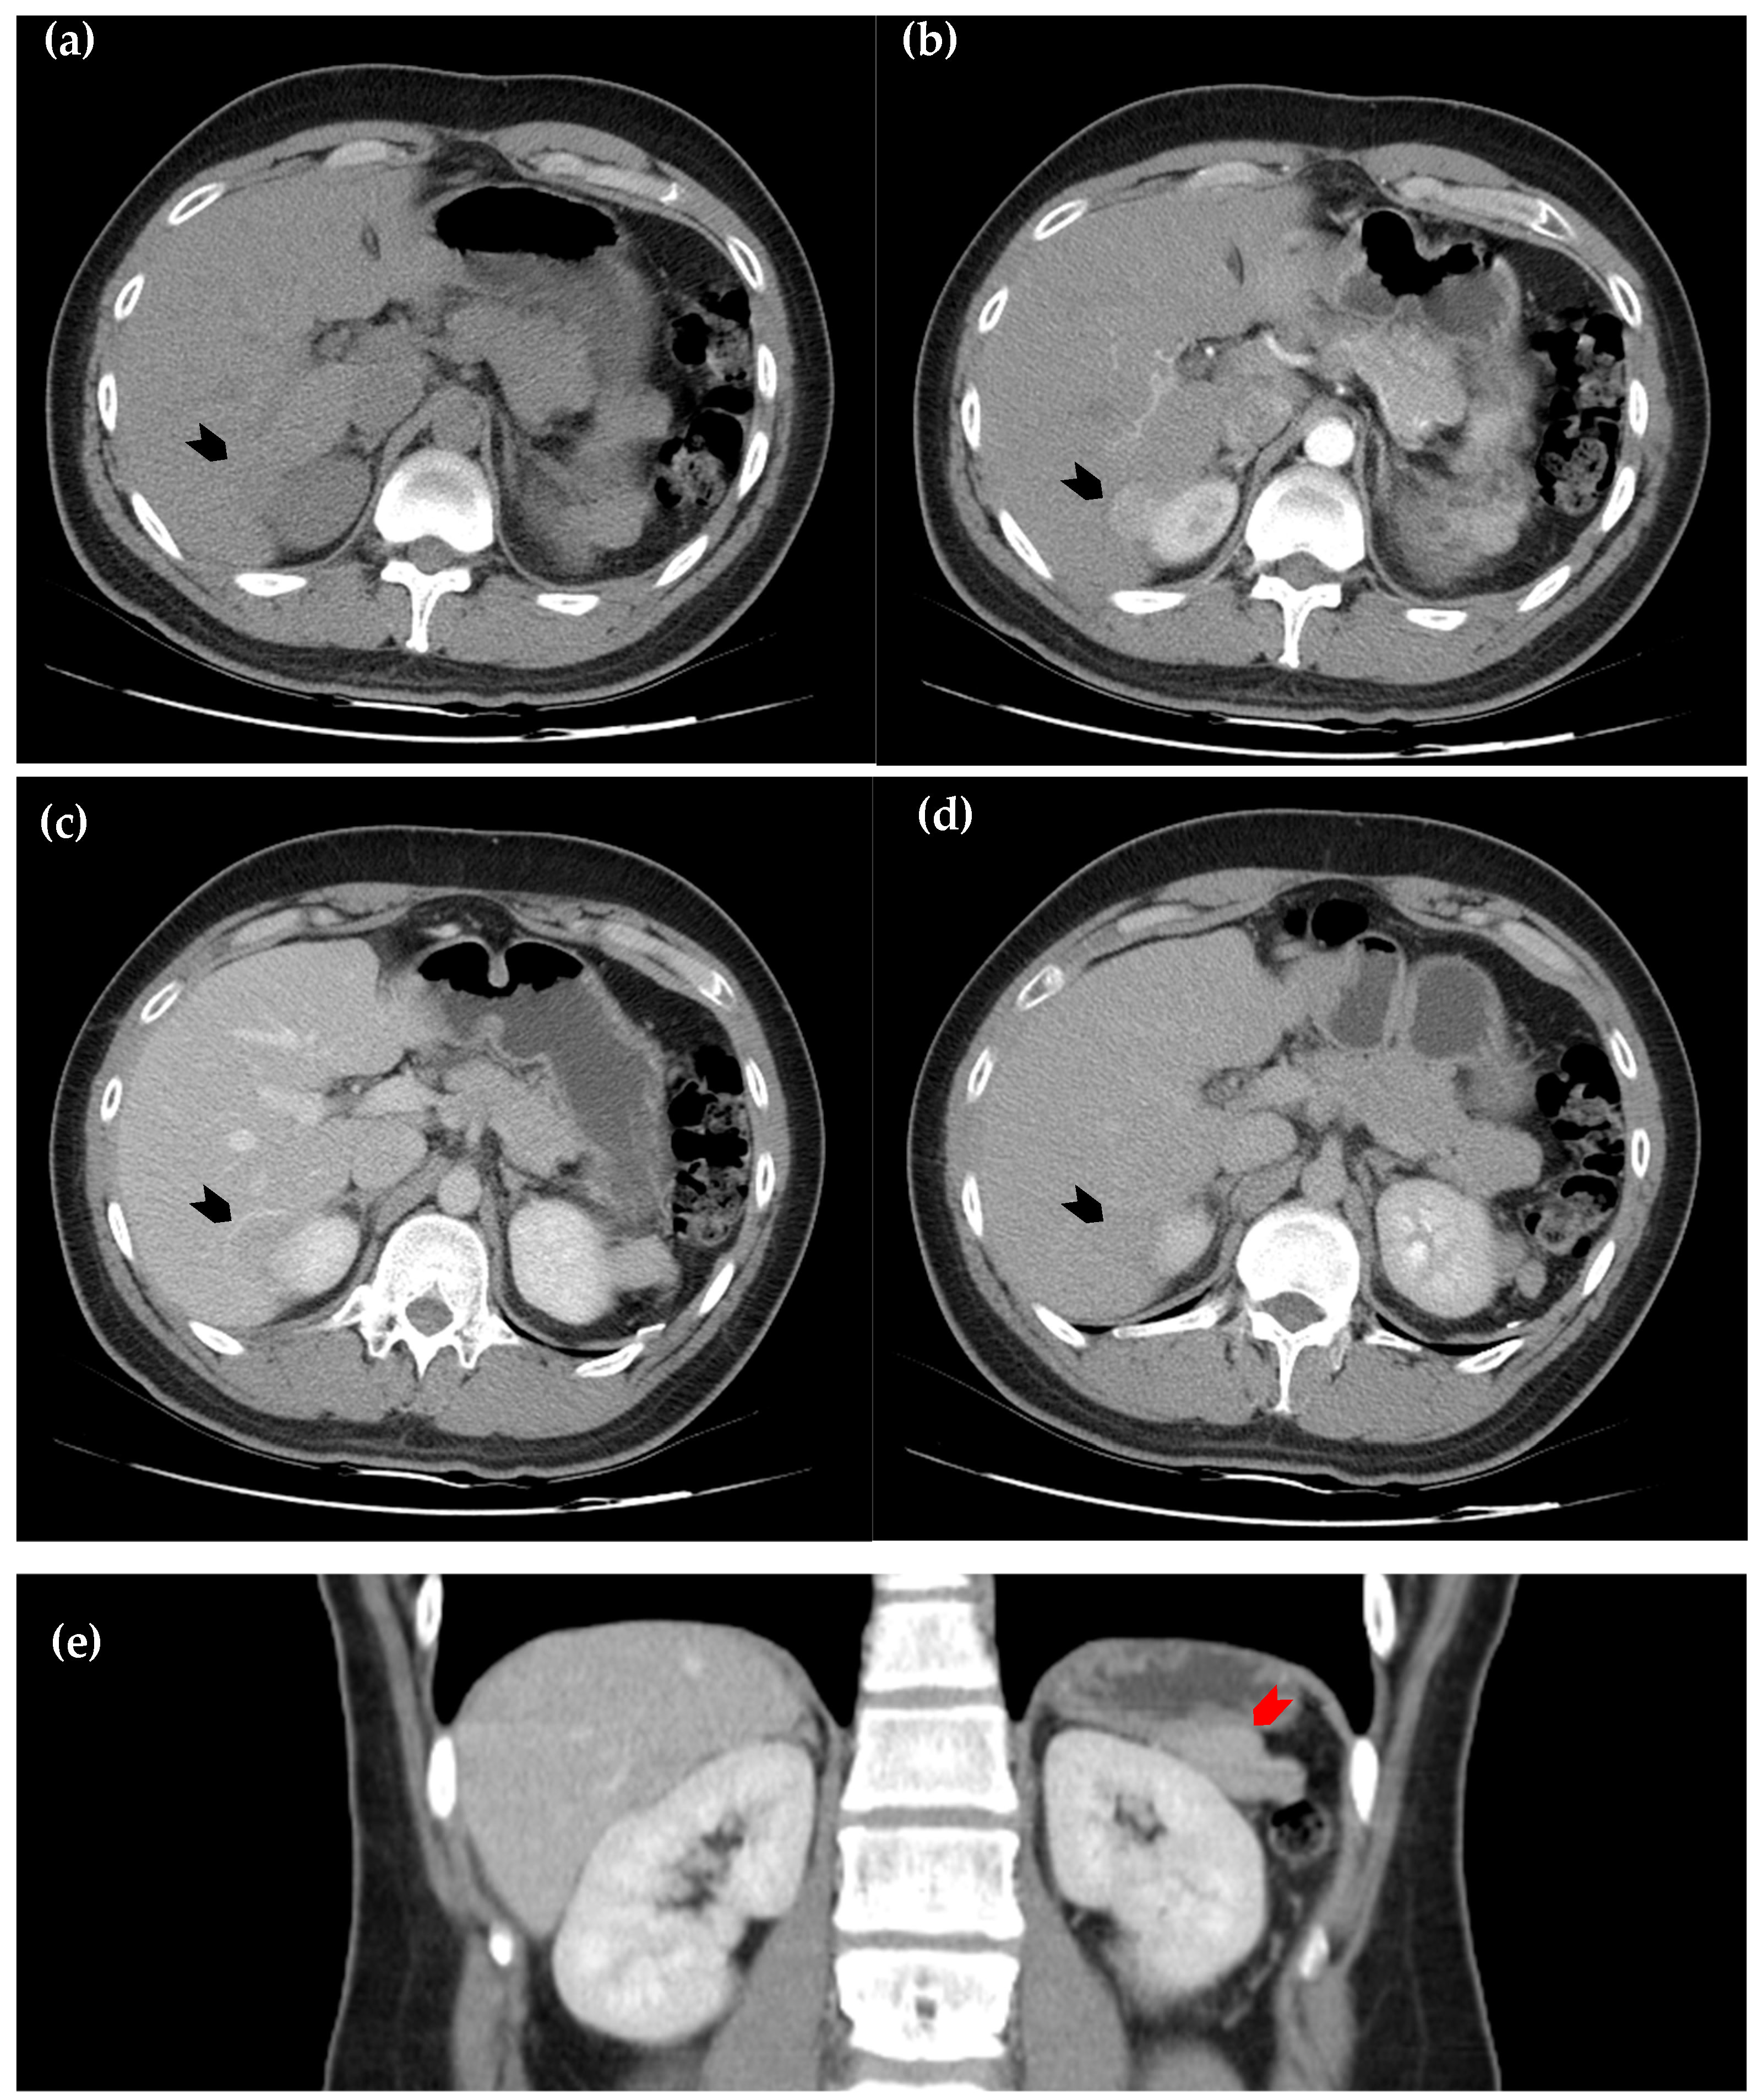
Dynamic computed tomography of the liver. (
a) Axial view of the pre-contrast sequence shows a slightly hypodense lesion, as compared with the surrounding normal hepatic parenchyma, located in segment six of the liver (black arrowhead); (
b) axial view of the arterial phase. The lesion exhibits homogeneous enhancement (black arrowhead); (
c) axial view of the portal phase, in which the lesion becomes relatively hypoattenuating (black arrowhead); (
d) the axial view of the delayed phase, in which hypoattenuation of the lesion persists but is less prominent than in the portal phase (black arrowhead); (
e) coronal view of the portal phase, in which a soft tissue lesion at left perinephric area (red arrowhead) demonstrates similar attenuation to the intrahepatic lesion, raising suspicion for splenosis. However, due to the early wash-in and early wash-out enhancement pattern, hepatic tumors such as hepatocellular carcinoma and metastatic lesions remain important differential diagnoses [
1,
2,
3,
4].
Figure 1.
Dynamic computed tomography of the liver. (
a) Axial view of the pre-contrast sequence shows a slightly hypodense lesion, as compared with the surrounding normal hepatic parenchyma, located in segment six of the liver (black arrowhead); (
b) axial view of the arterial phase. The lesion exhibits homogeneous enhancement (black arrowhead); (
c) axial view of the portal phase, in which the lesion becomes relatively hypoattenuating (black arrowhead); (
d) the axial view of the delayed phase, in which hypoattenuation of the lesion persists but is less prominent than in the portal phase (black arrowhead); (
e) coronal view of the portal phase, in which a soft tissue lesion at left perinephric area (red arrowhead) demonstrates similar attenuation to the intrahepatic lesion, raising suspicion for splenosis. However, due to the early wash-in and early wash-out enhancement pattern, hepatic tumors such as hepatocellular carcinoma and metastatic lesions remain important differential diagnoses [
1,
2,
3,
4].
![Diagnostics 15 01789 g001]()
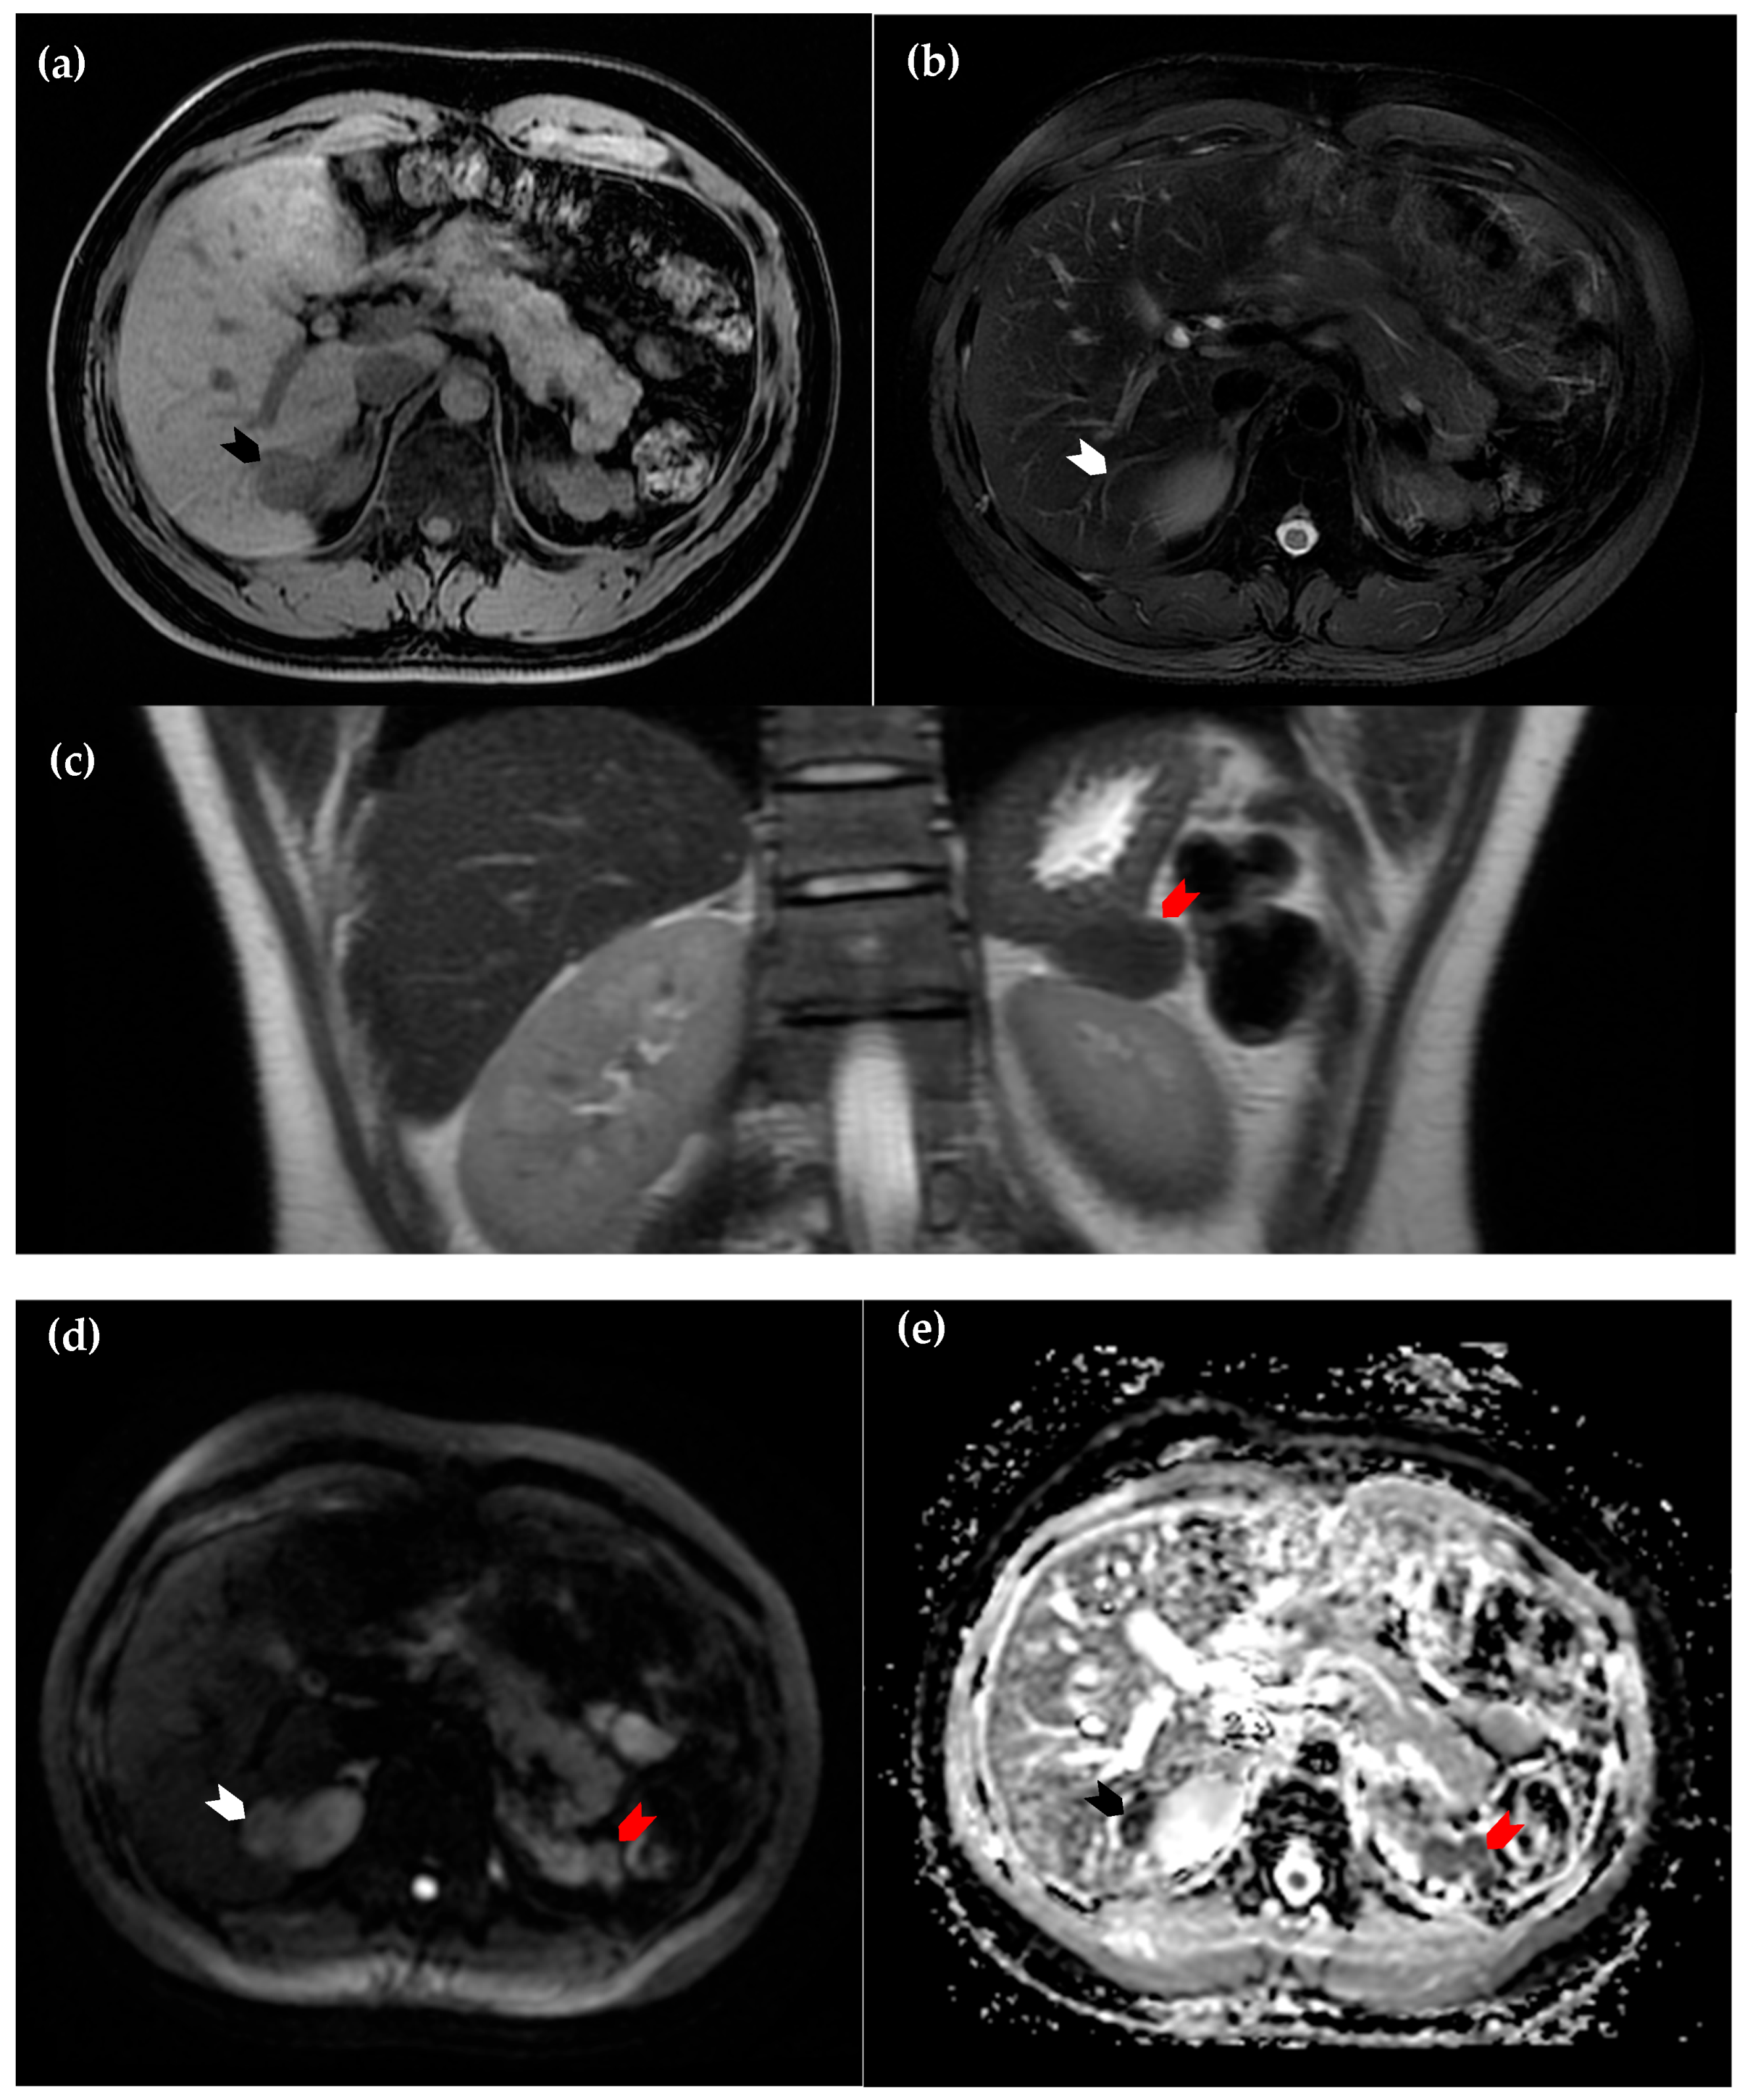
Figure 2.
Magnetic resonance imaging of the liver. (
a) Axial view of the T1 sequence, in which the intrahepatic lesion is hypointense in comparison to surrounding normal hepatic parenchyma (black arrowhead); (
b) axial view of the T2 sequence, in which the lesion is nearly isointense (white arrowhead); (
c) coronal view of the T2 sequence. The suspected perinephric splenosis (red arrowhead) again exhibits similar attenuation to the intrahepatic lesion (white arrowhead in (
d) and black arrowhead in (
e)), as well as characteristics of restricted diffusion on diffusion-weighted imaging (
d) and the corresponding apparent diffusion coefficient map (
e). These findings support the diagnosis of intrahepatic splenosis [
2].
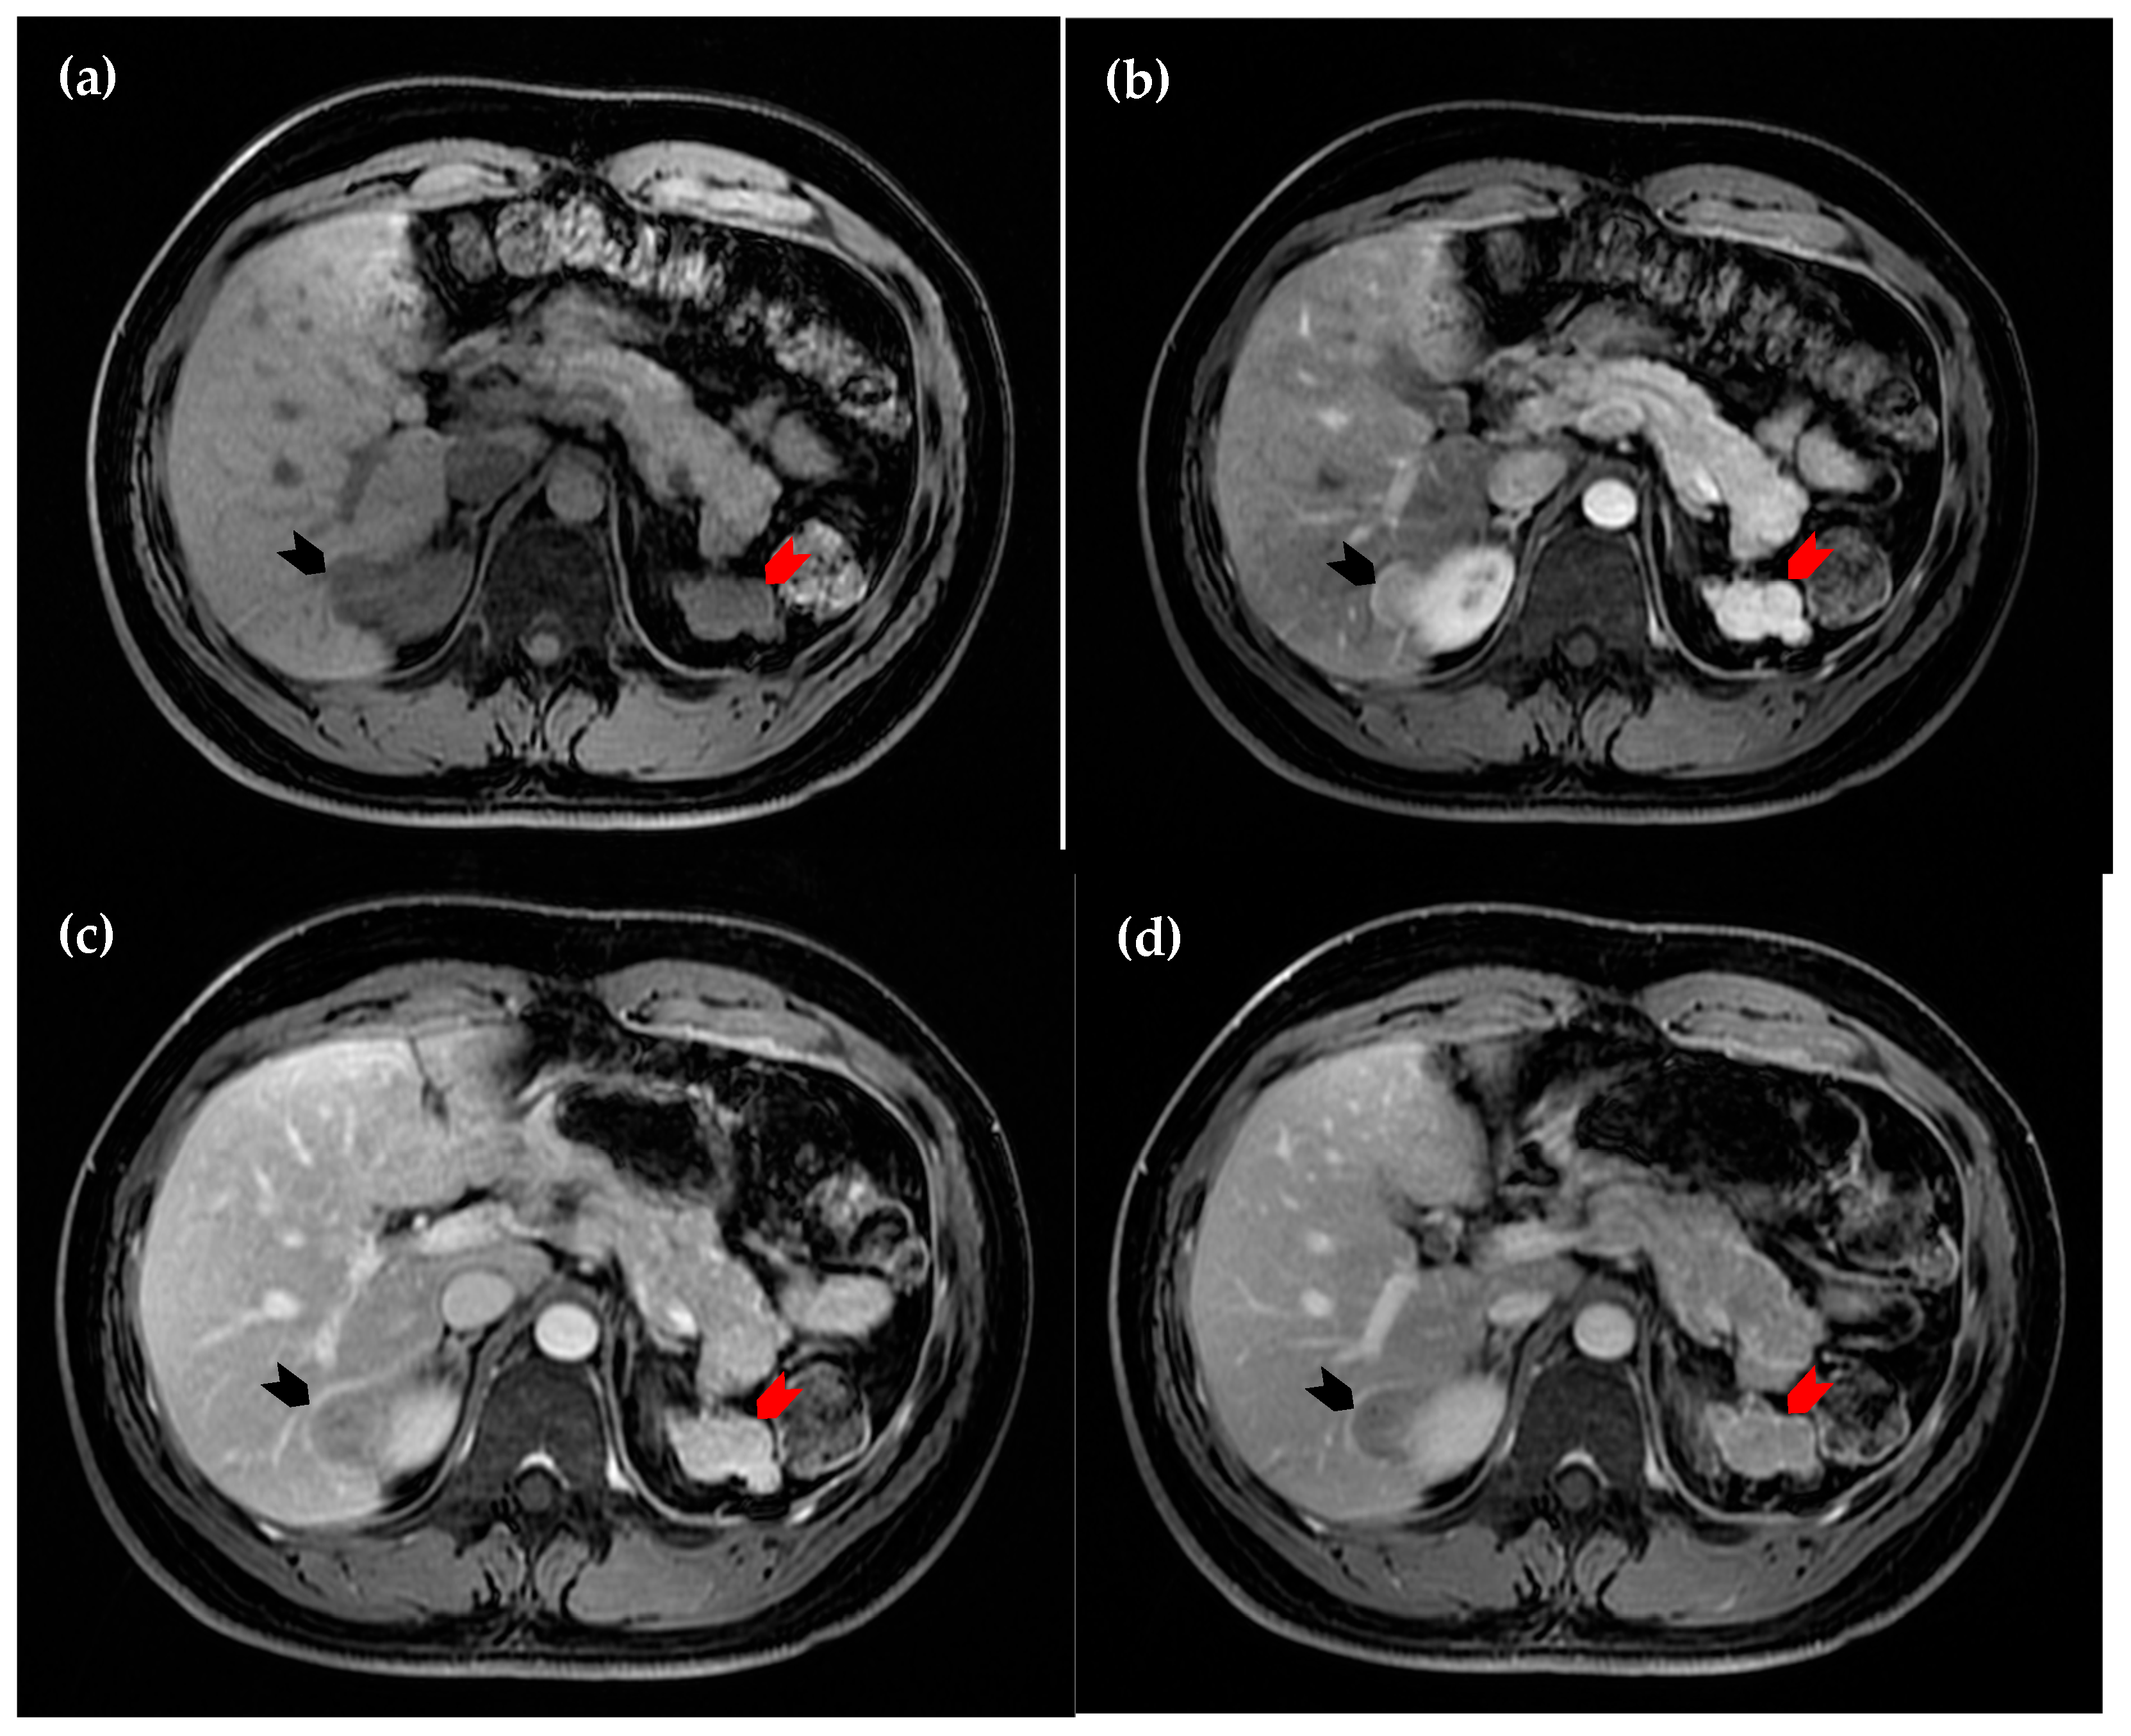
Figure 3.
Dynamic magnetic resonance imaging of the liver. (
a) Axial view of the pre-contrast sequence, in which the intrahepatic lesion is hypointense (black arrowhead); (
b) axial view of the arterial phase, in which the lesion demonstrates homogeneous hyperintensity (black arrowhead); (
c) axial view of the portal phase, in which early wash-out of enhancement is observed (black arrowhead); (
d) axial view of the delayed phase, in which the lesion (black arrowhead) remains more hypointense compared to the surrounding hepatic parenchyma. The perinephric lesion again demonstrates similar attenuation across all sequences (red arrowhead in (
a–
d)). However, due to the suspicious enhancement pattern of the intrahepatic lesion, a hepatic tumor cannot be excluded [
1,
2,
3,
4].
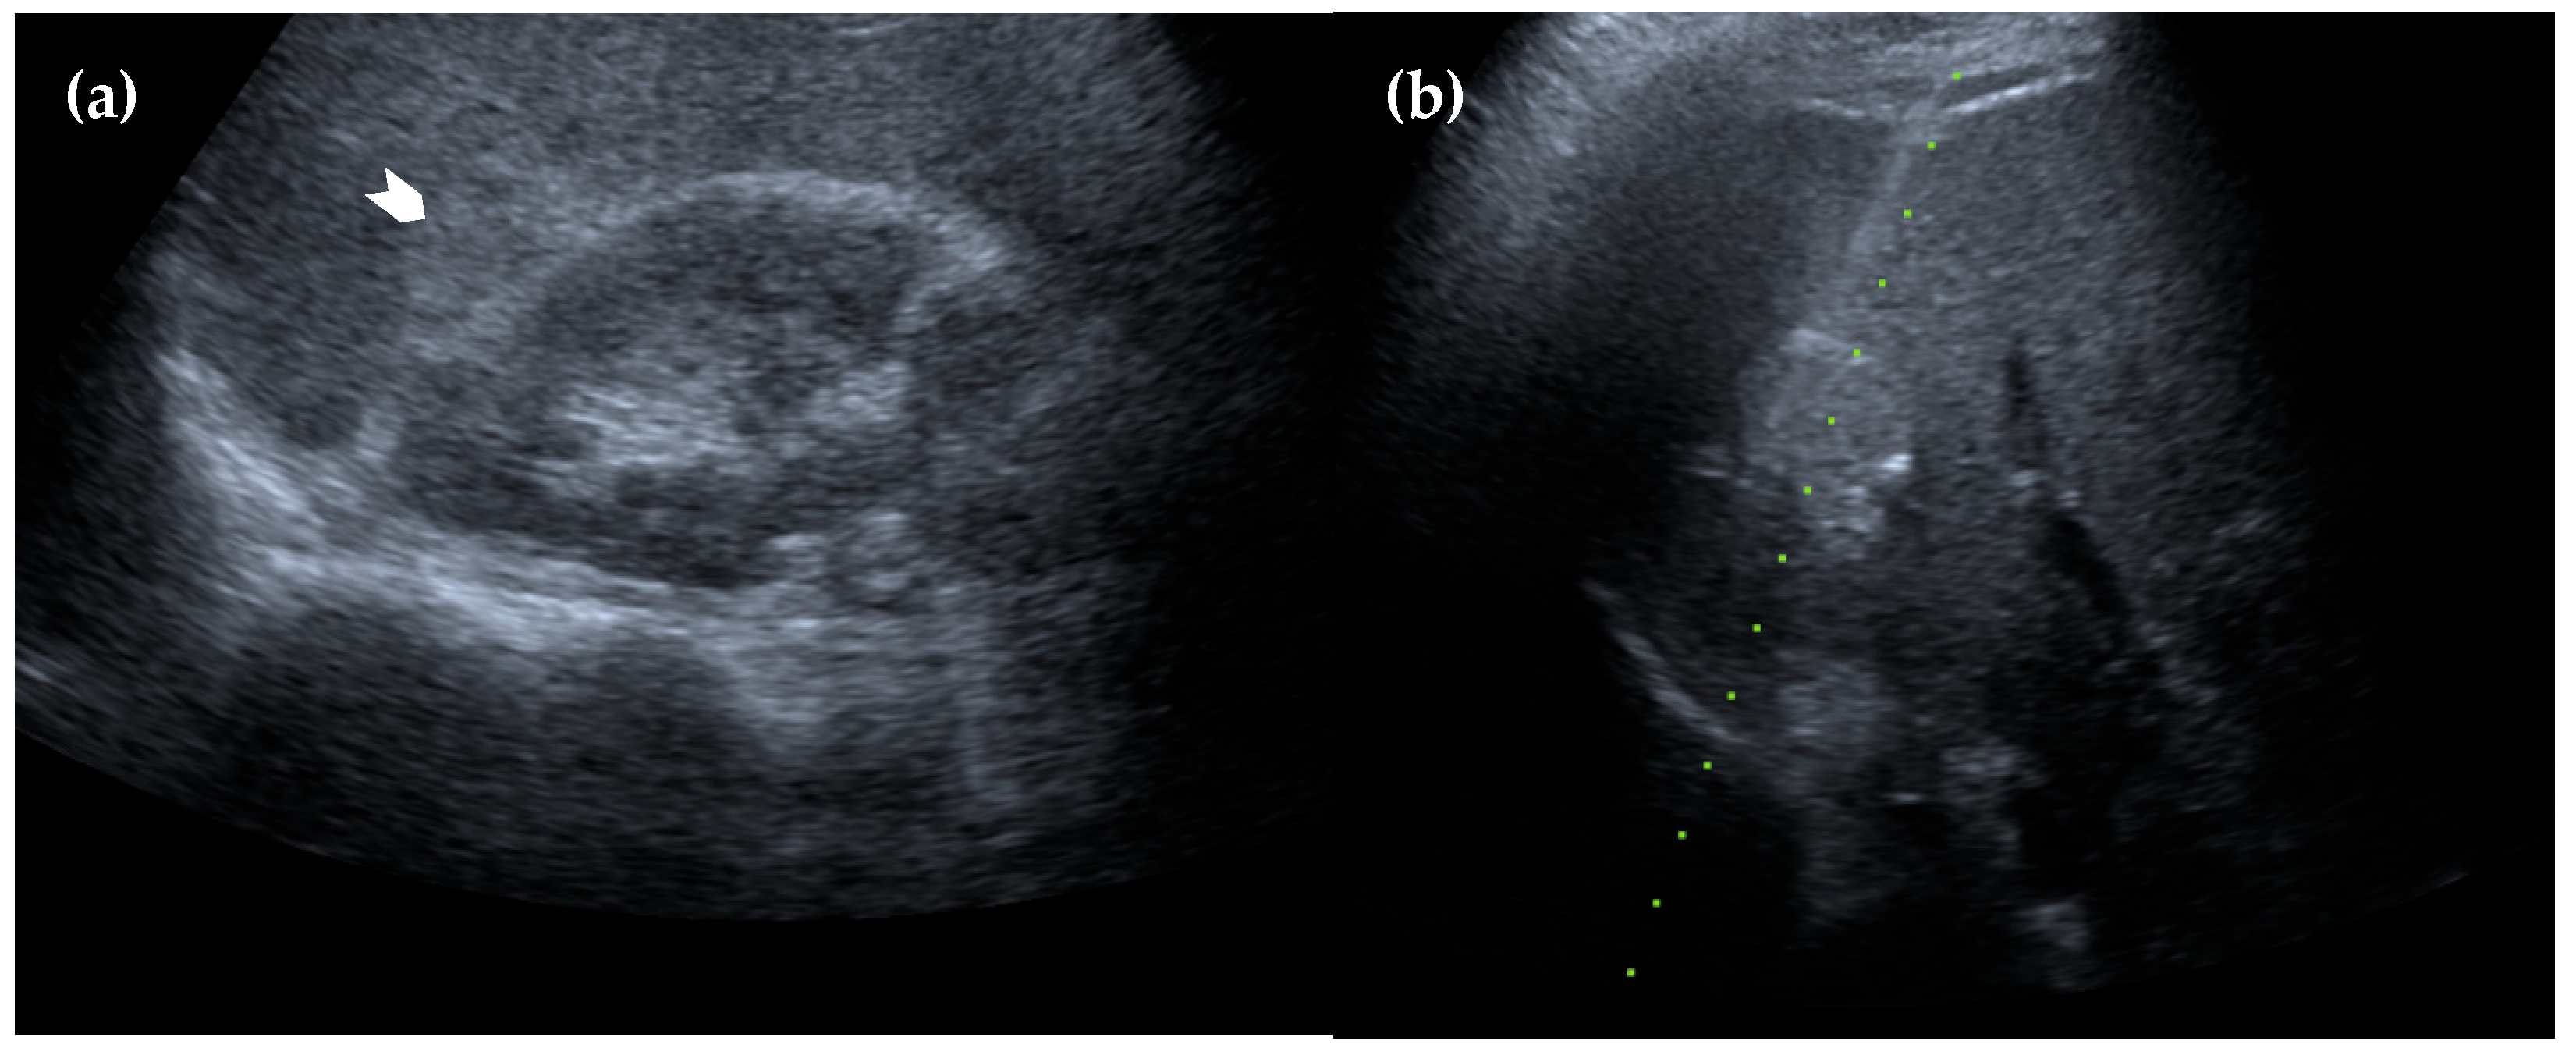
Figure 4.
Ultrasonography of the liver. (a) The lesion appears homogeneously hyperechoic with a well-defined margin (white arrowhead); (b) an ultrasound-guided biopsy was performed, and the pathology results confirmed the diagnosis of intrahepatic splenosis.
Figure 4.
Ultrasonography of the liver. (a) The lesion appears homogeneously hyperechoic with a well-defined margin (white arrowhead); (b) an ultrasound-guided biopsy was performed, and the pathology results confirmed the diagnosis of intrahepatic splenosis.


