Correction

Correction: Eroğlu, G. Electroencephalography-Based Neuroinflammation Diagnosis and Its Role in Learning Disabilities. Diagnostics 2025, 15, 764

Computer Engineering Department, Engineering and Nature Faculty, Bahçeşehir University, 34349 Istanbul, Turkey
Diagnostics 2025, 15(14), 1772; https://doi.org/10.3390/diagnostics15141772
Submission received: 25 June 2025 / Accepted: 30 June 2025 / Published: 14 July 2025
In the original publication [1], Figures 1, 2 and 4–7, as well as Tables 1 and 2, were based on earlier internal drafts and have since been revised for improved clarity and accuracy. While the overall methodology and conclusions of the study remain scientifically sound and unchanged, these updated figures and tables provide enhanced transparency and reproducibility of the presented data.
The corrected Figure 1, Figure 2, Figure 4, Figure 5, Figure 6, Figure 7 and Table 1, Table 2 are shown below.
Additionally, the Python code used for EEG preprocessing, Artificial Neural Network (ANN) model training, and performance evaluation was not included in the original publication. These scripts document key processes such as z-score normalization, data balancing, ANN architecture optimization, and performance metric calculation. To improve transparency and enable reproducibility, the code has now been made available as Supplementary File S1: Python codes MDPI.ipynb, and a citation for this file has been inserted in the Section 3 Results, paragraph 3, and should read as follows:
“Moreover, the study explored the impact of preprocessing techniques, such as minimum–maximum scaling, on model performance. While this technique introduced a slight reduction in accuracy, from 98.5% to 98.33%, the model retained robust performance metrics, including an F1 score of 0.983 and an increased loss of 0.08 (as detailed in Table 1 and Table 2). These findings indicate that while preprocessing can slightly alter accuracy, the overall diagnostic capability of the ANN remains consistently high (Supplementary File S1).”
With this correction, the “Supplementary Materials” part has been added accordingly.
The authors state that the scientific conclusions are unaffected. This correction was approved by the Academic Editor. The original publication has also been updated.

Reference

  1. Eroğlu, G. Electroencephalography-Based Neuroinflammation Diagnosis and Its Role in Learning Disabilities. Diagnostics 2025, 15, 764. [Google Scholar] [CrossRef] [PubMed]
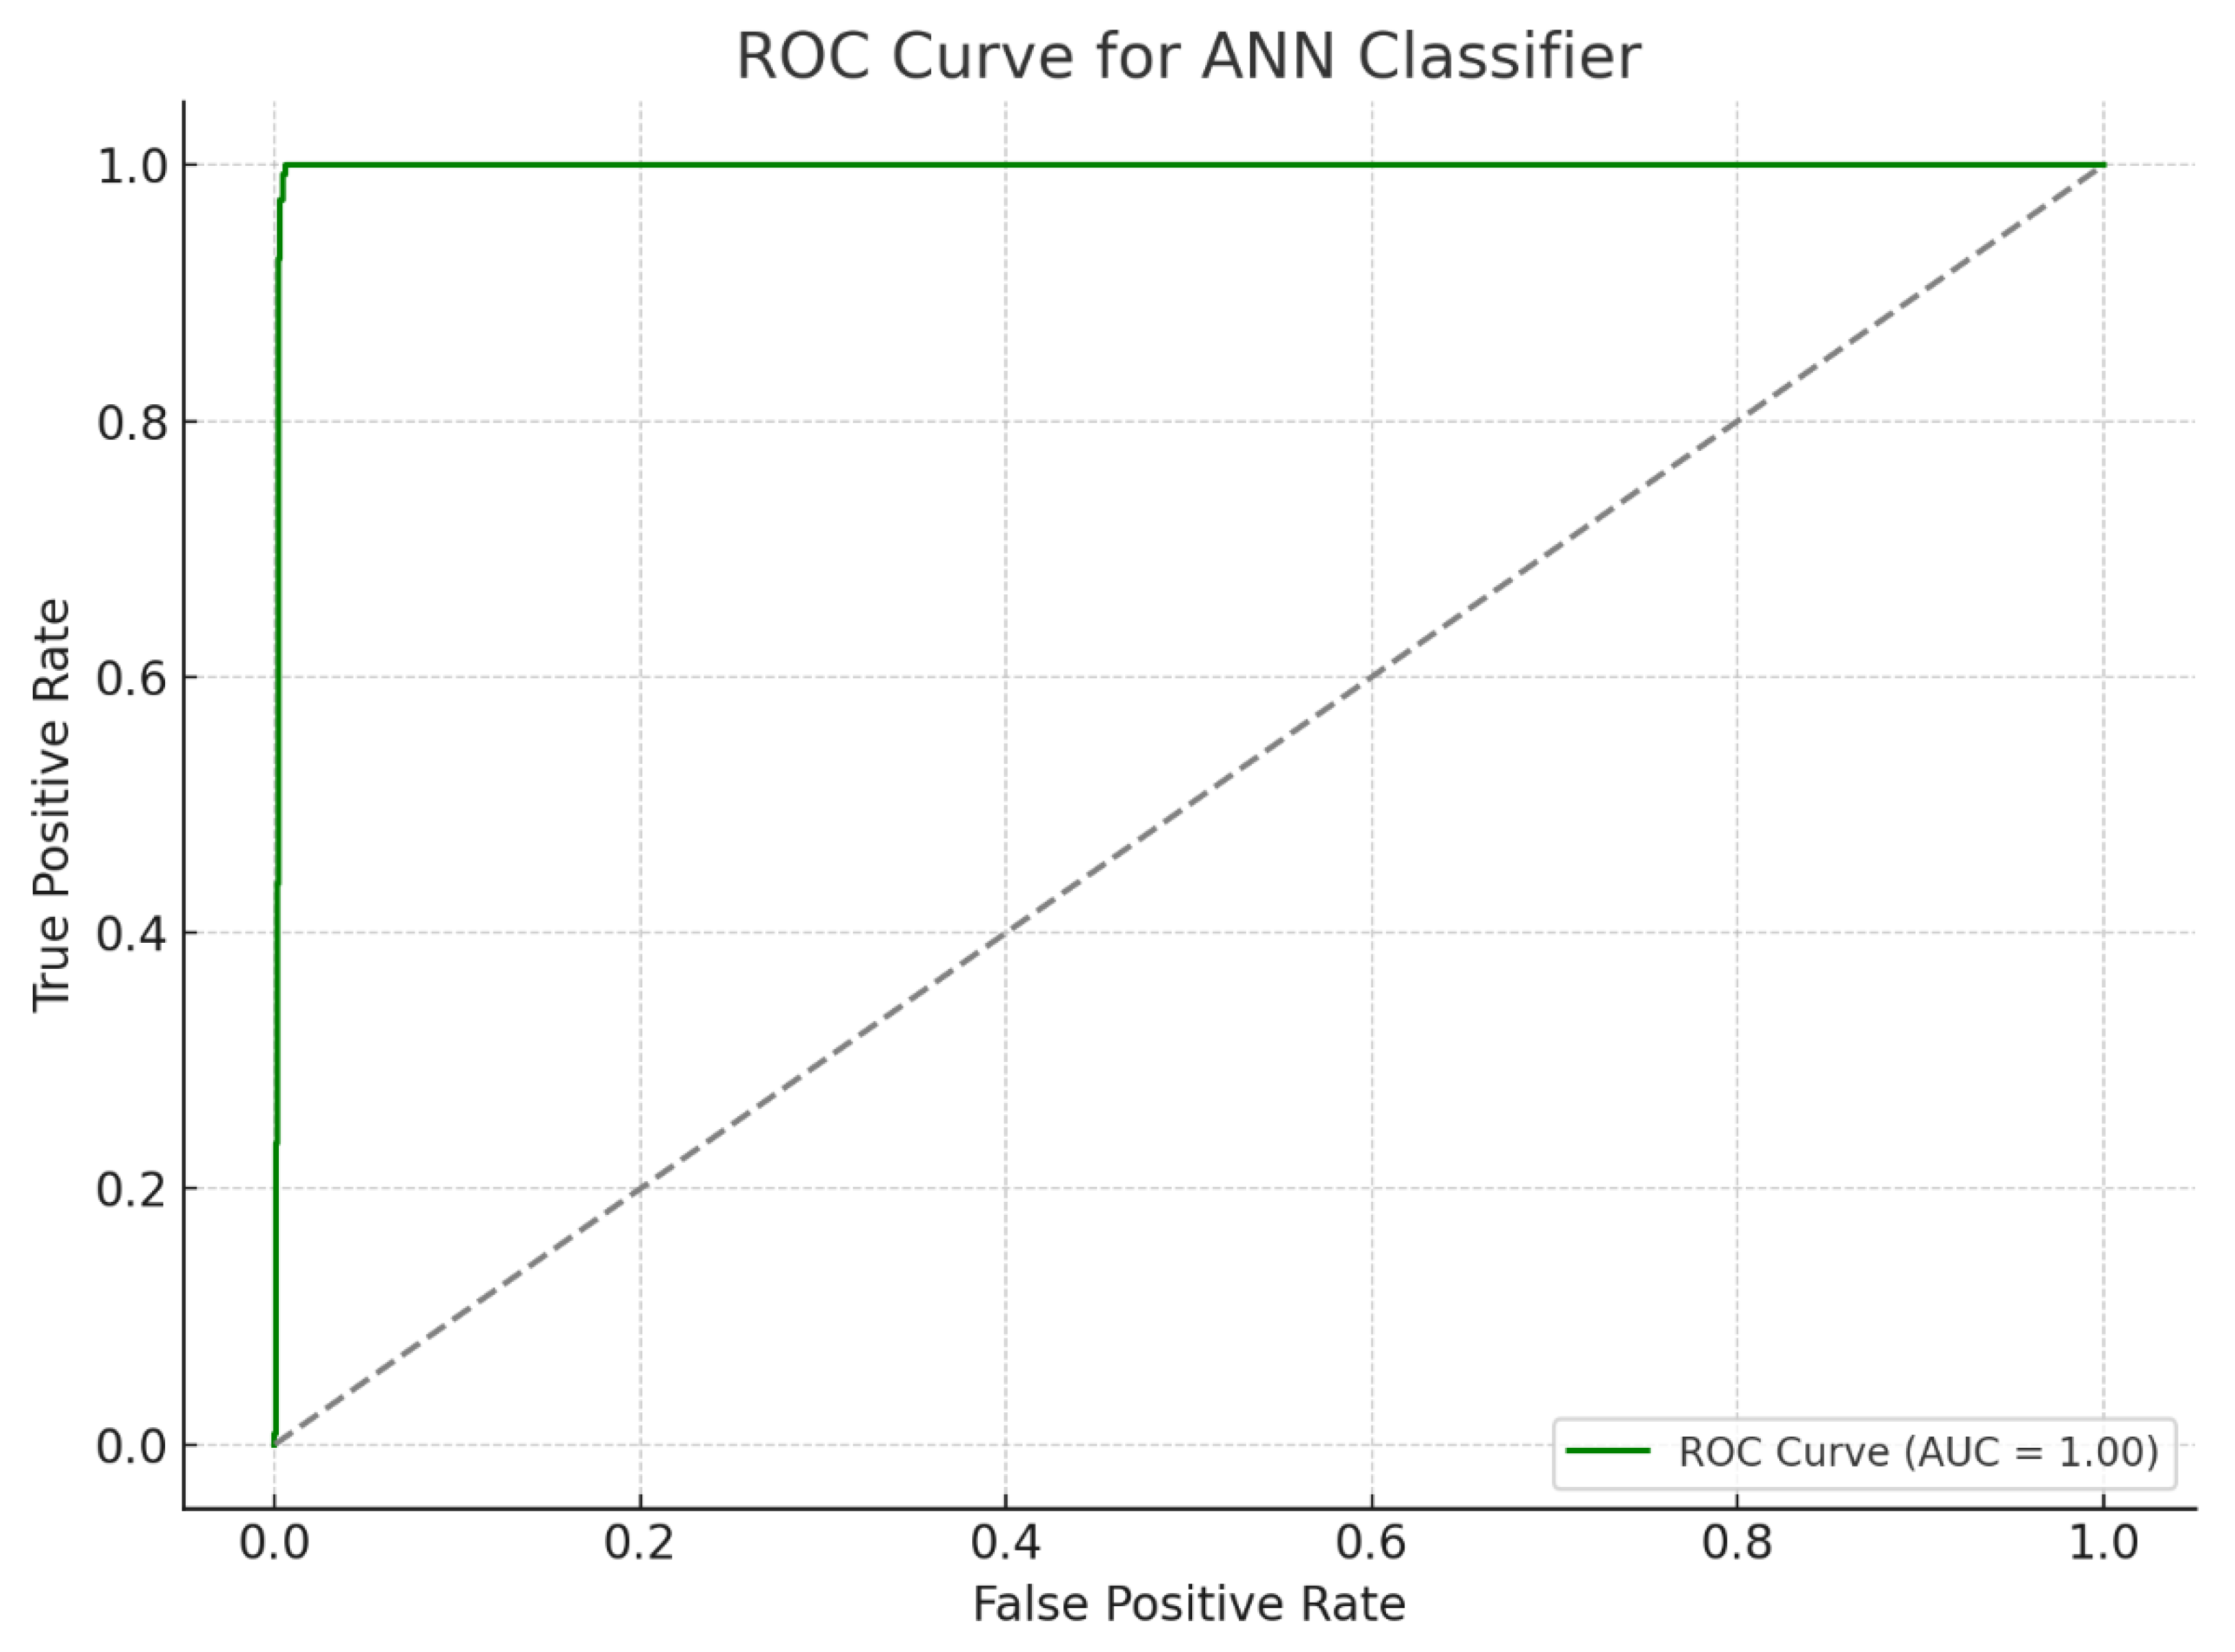
Figure 1. Receiver Operating Characteristic (ROC) Curve of the Artificial Neural Network (ANN) model. The ROC curve illustrates the performance of a multilayer perceptron model trained on EEG-derived features to classify children with learning disabilities. The model achieved an AUC of approximately 1, indicating high diagnostic accuracy in distinguishing between the LD and control groups. The gray dashed line in the ROC curve plot represents the “no-skill classifier” or random guess baseline.
Diagnostics 15 01772 g001
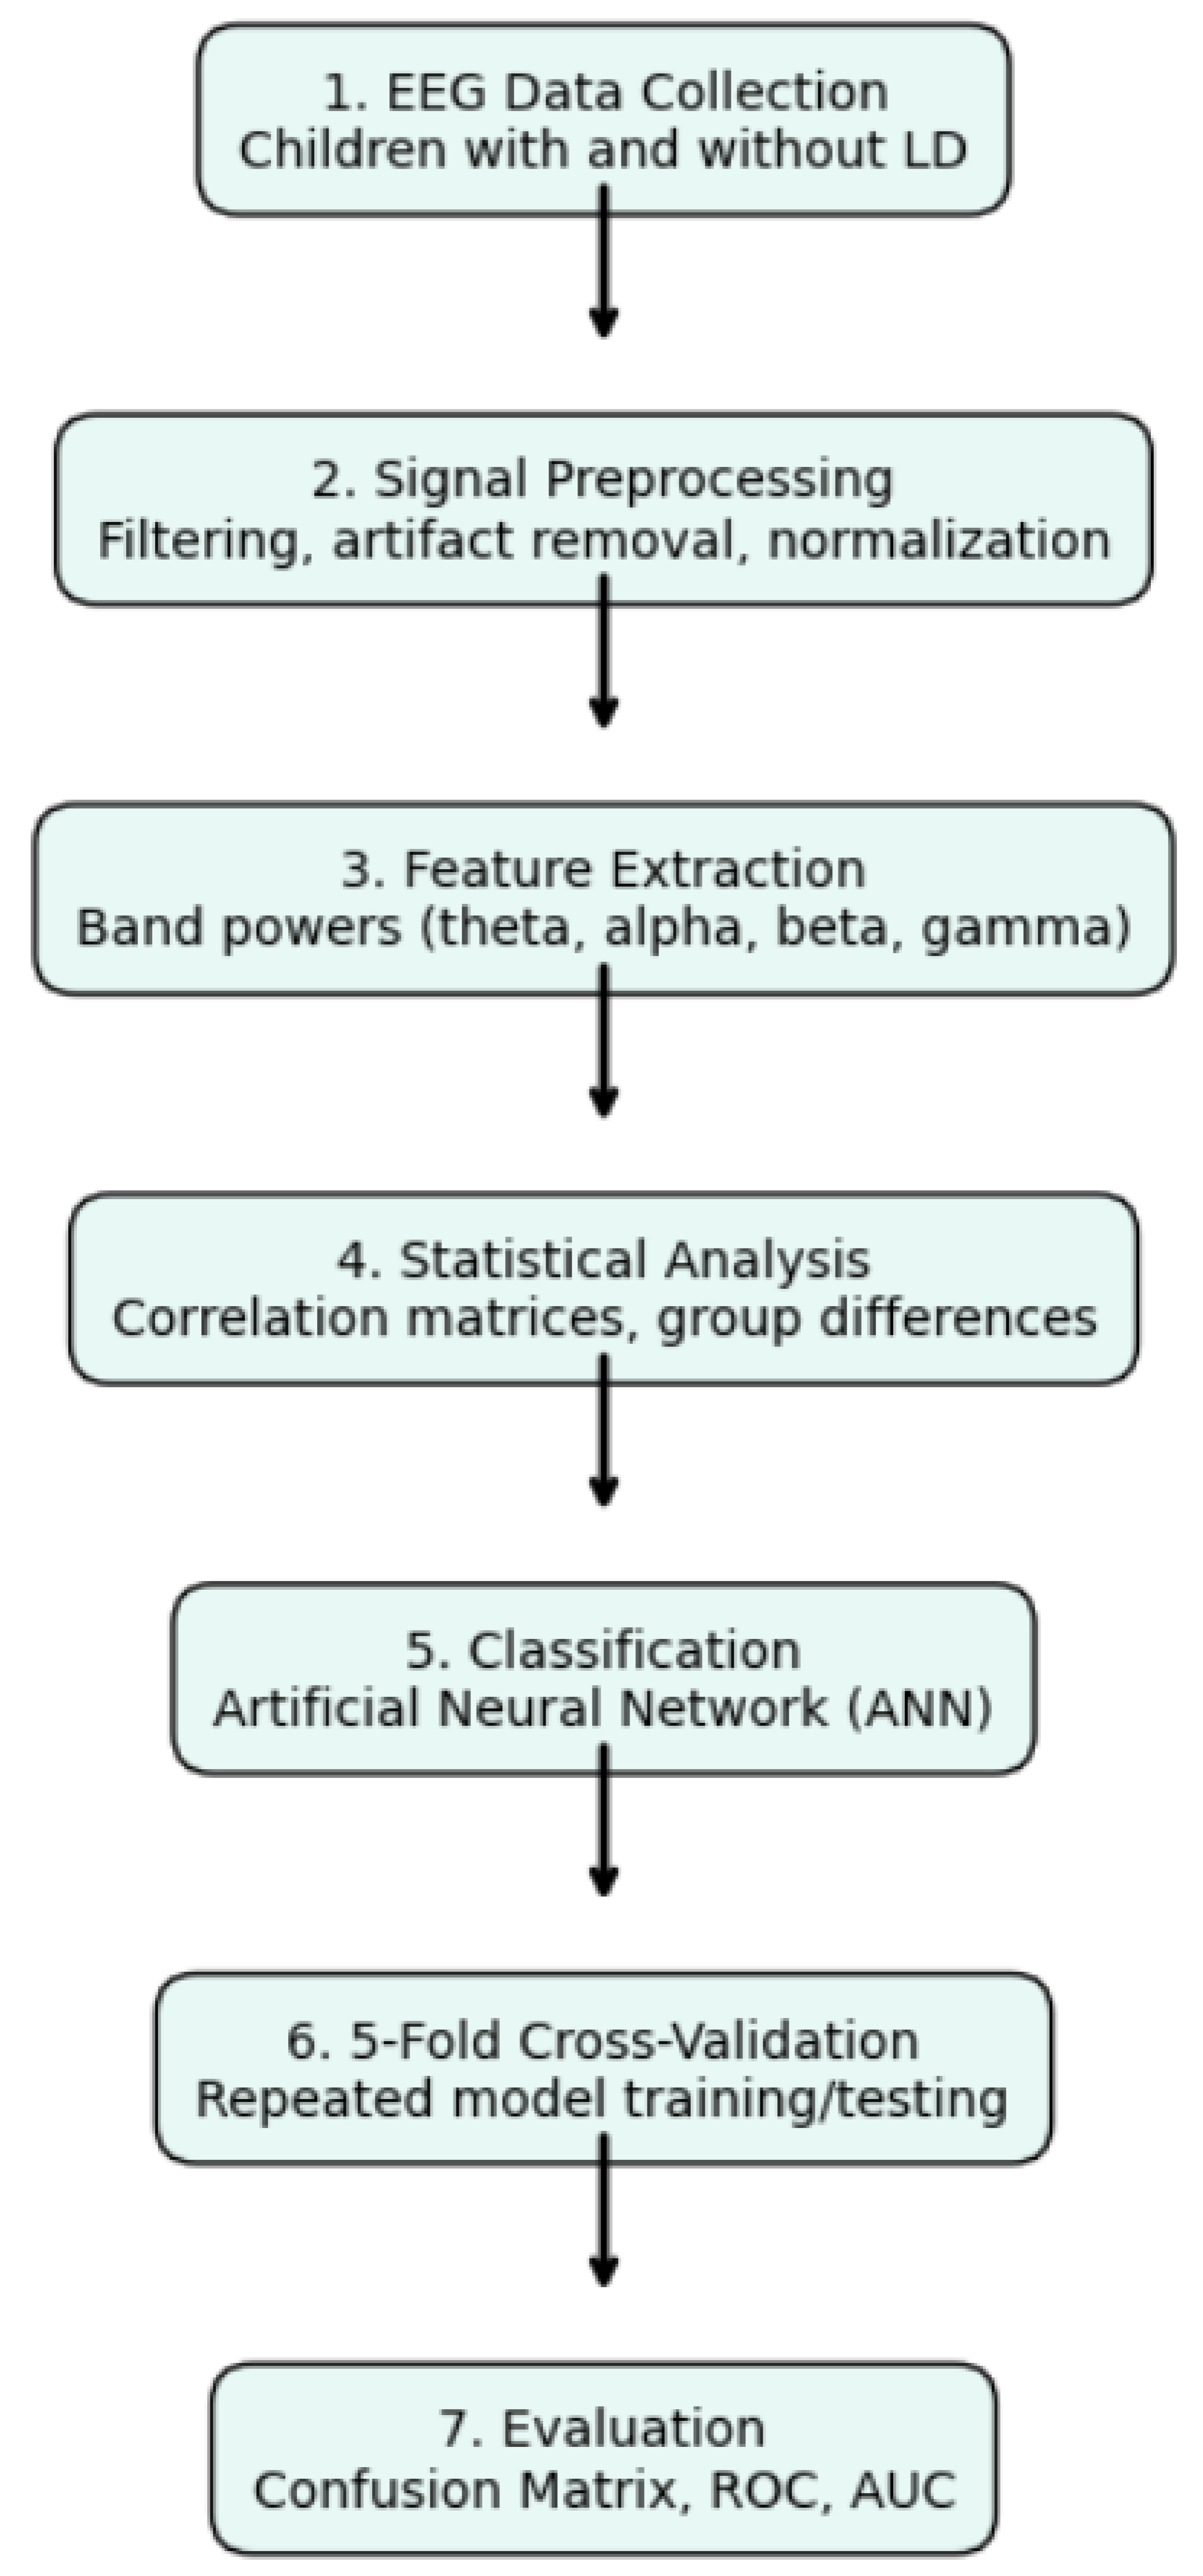
Figure 2. Stepwise flowchart of the EEG-based learning disorder diagnosis method. The figure presents a vertically aligned stepwise methodology for diagnosing learning disorders using EEG. The process includes data acquisition, signal processing, feature extraction, statistical comparison, 5-fold cross-validation, ANN-based classification, and performance evaluation.
Diagnostics 15 01772 g002
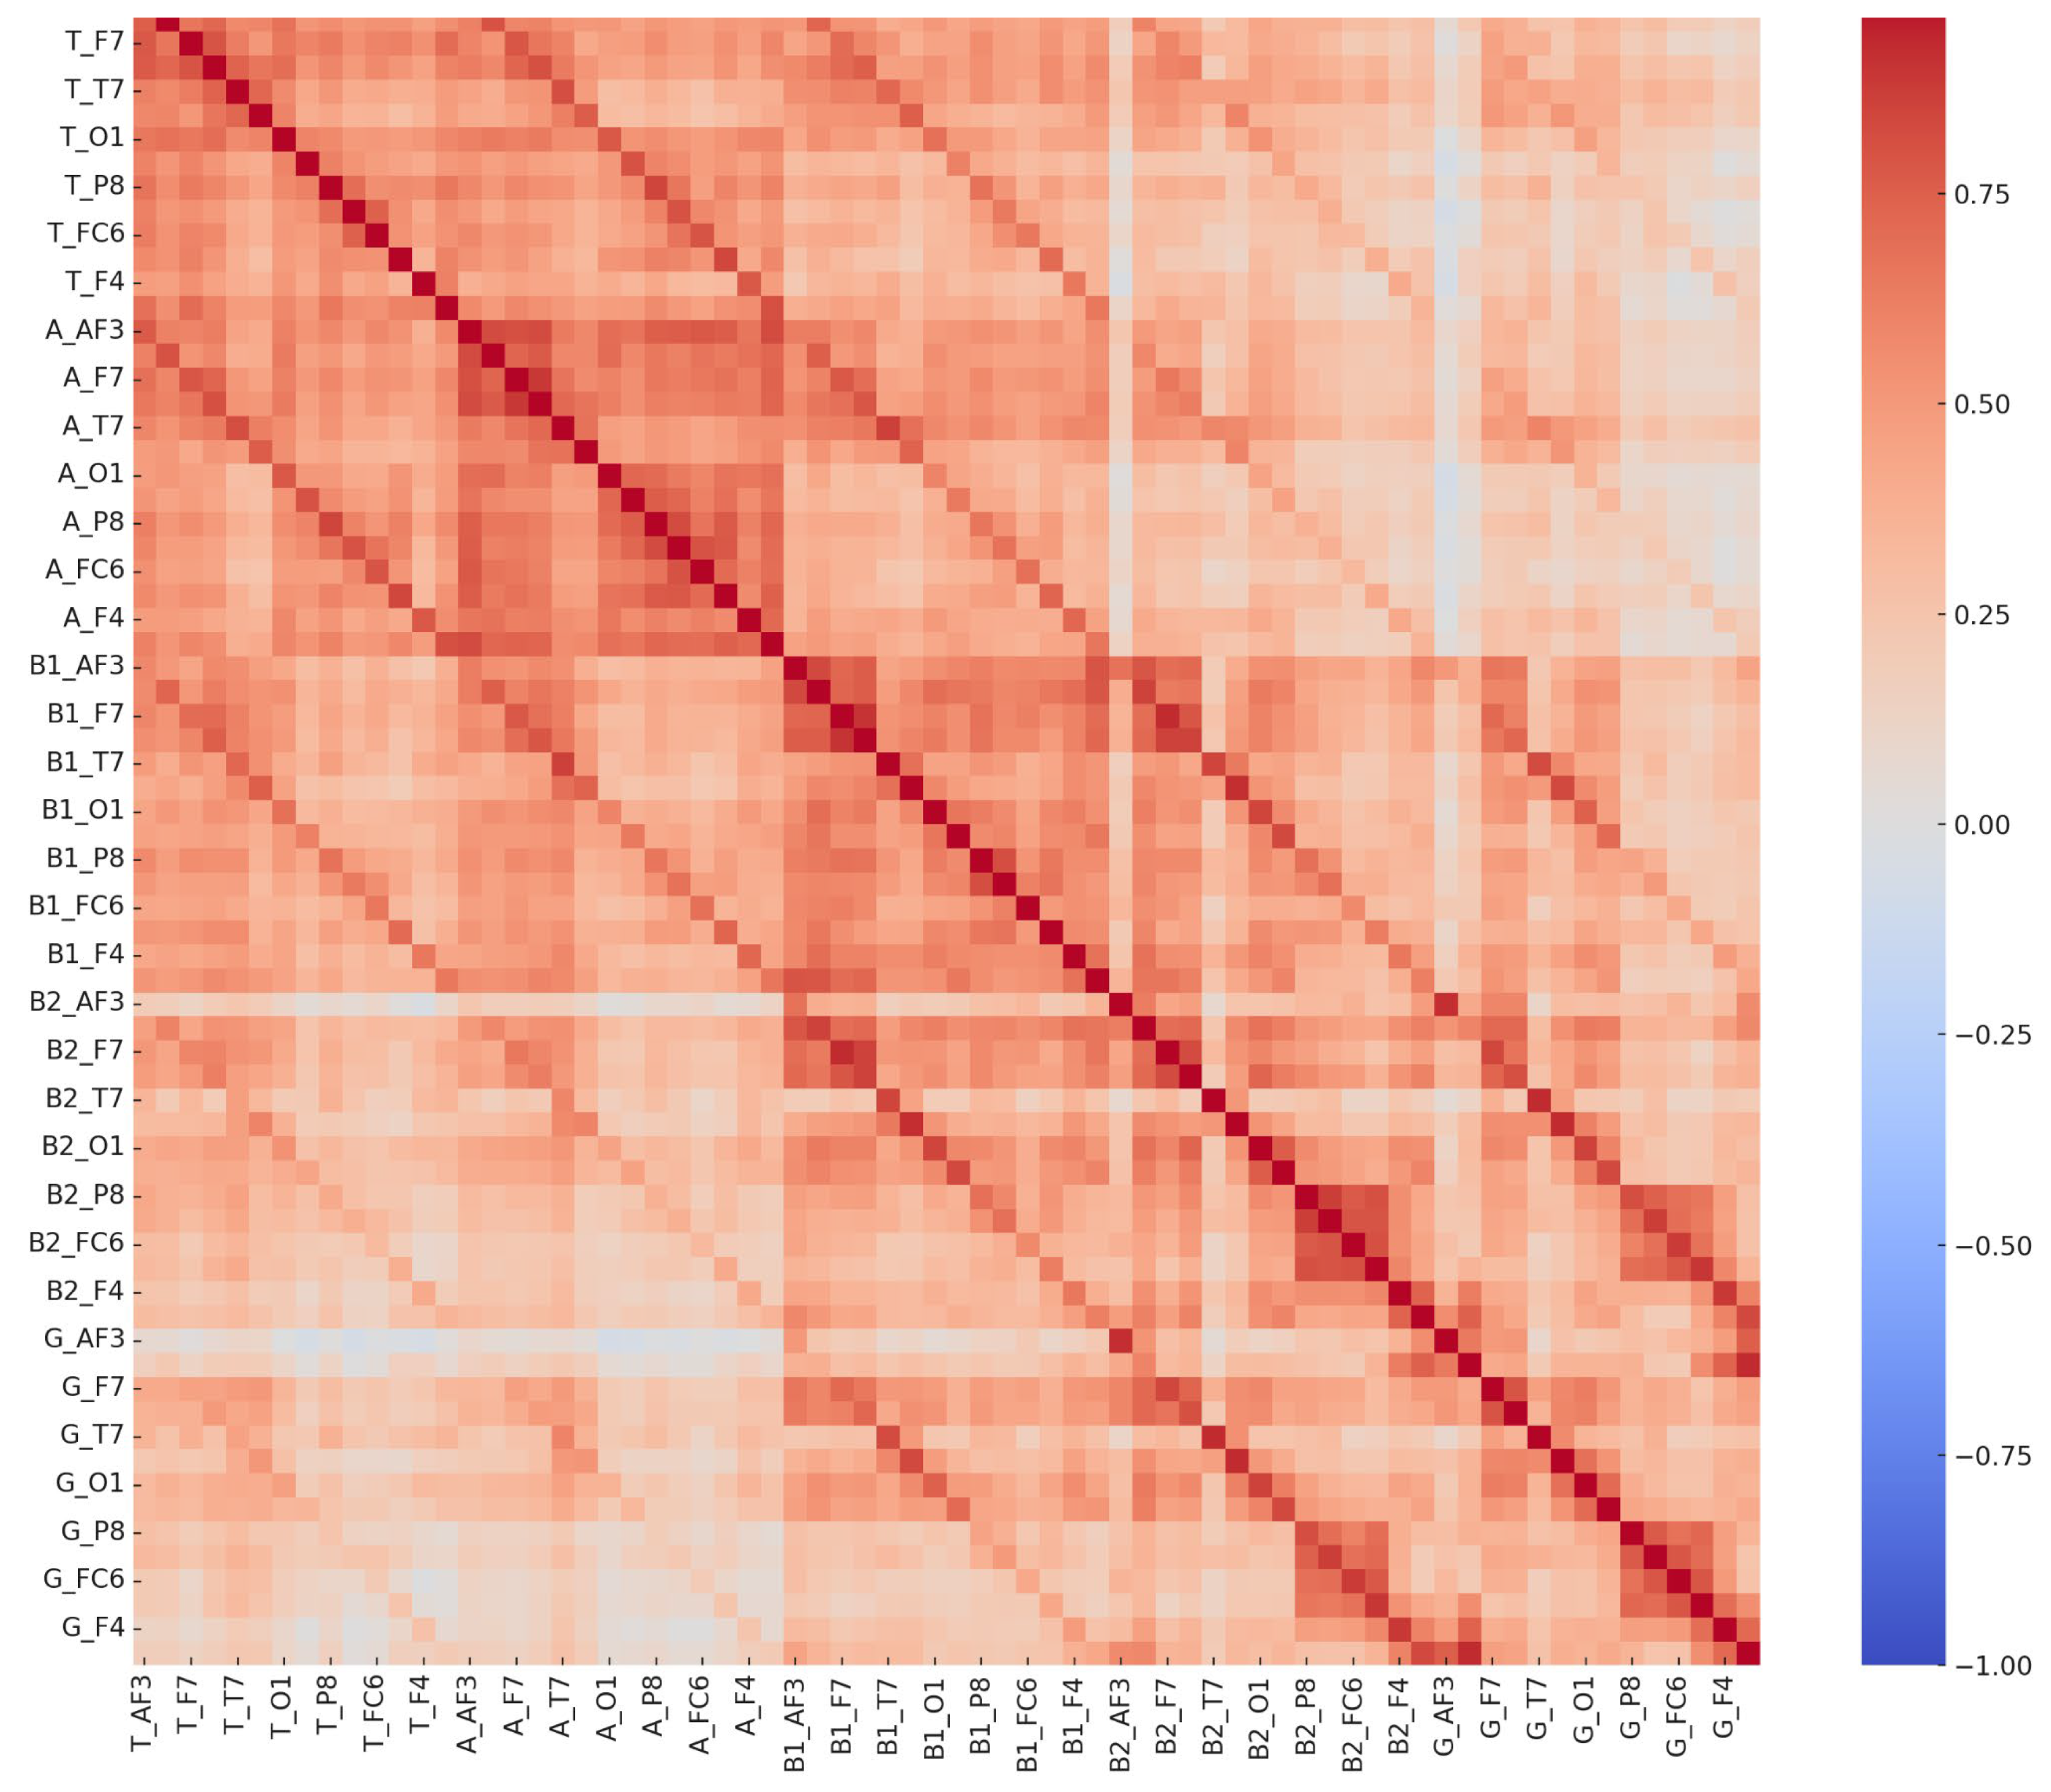
Figure 4. Comprehensive EEG channel correlation matrix—learning disorder group.
Diagnostics 15 01772 g004
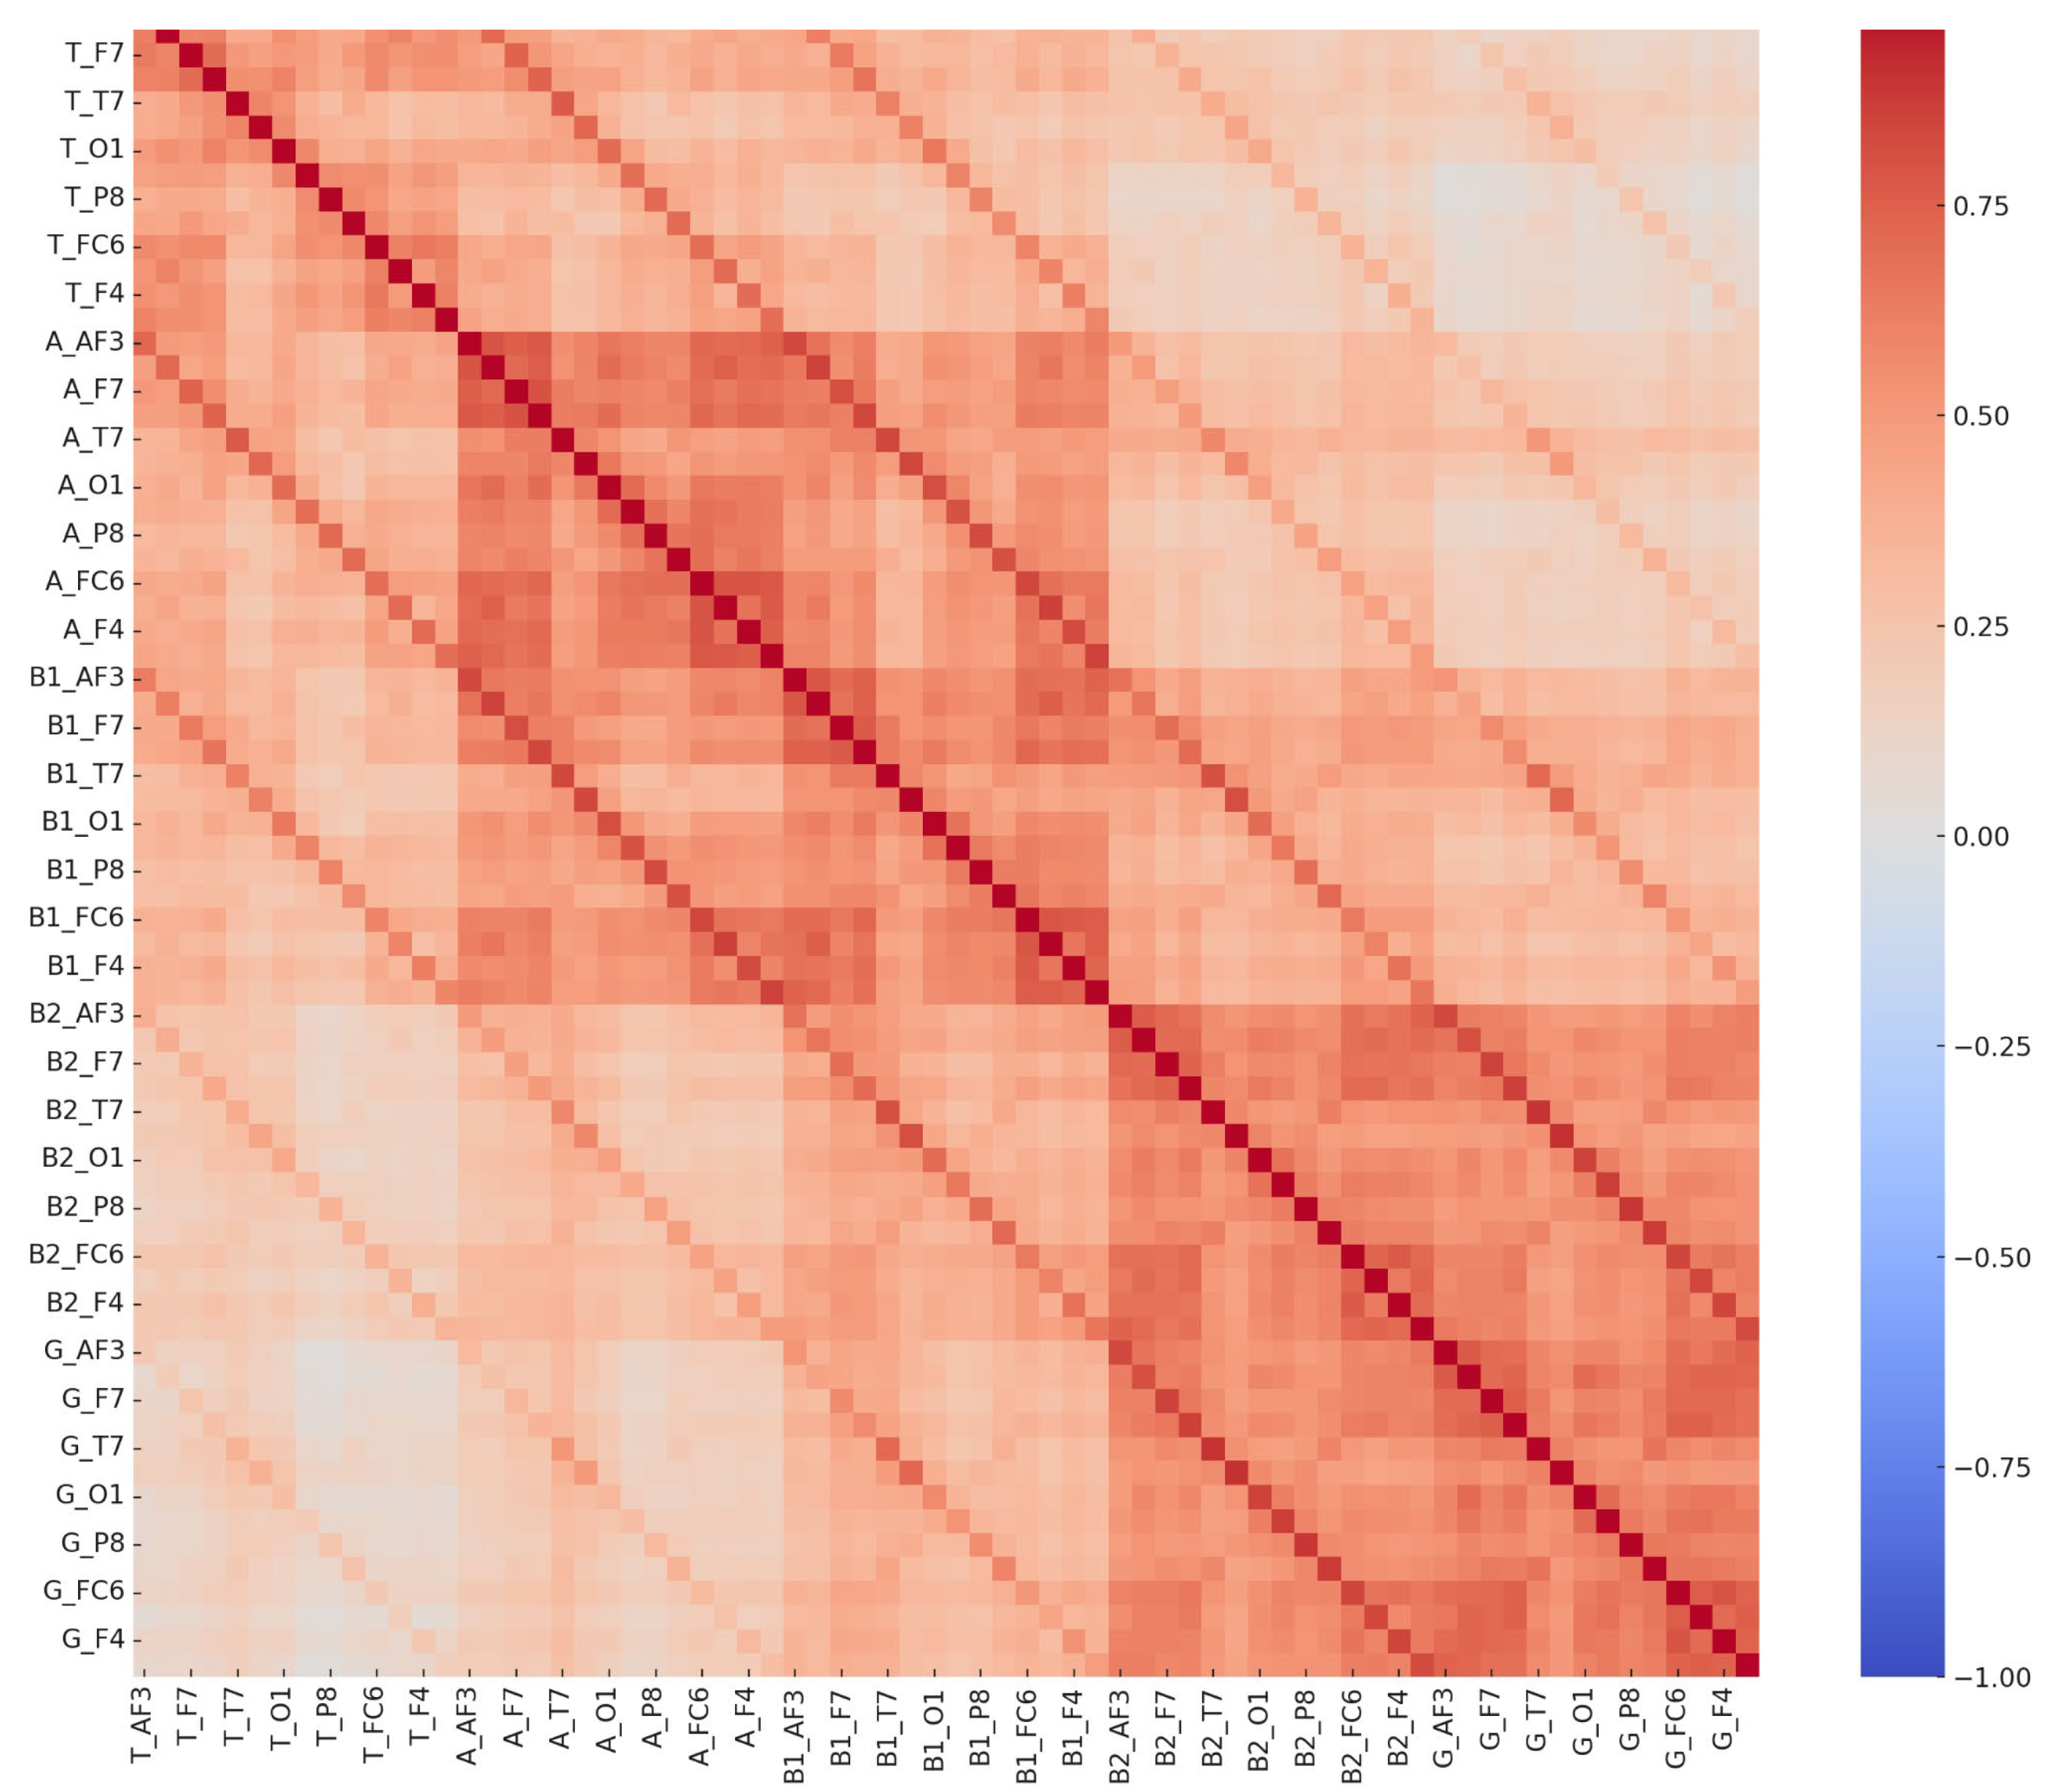
Figure 5. Comprehensive EEG channel correlation matrix—control group. These matrices depict interrelationships among 70 EEG-derived features in both the LD and control groups. The distinct correlation patterns reflect neurophysiological differences between groups, potentially supporting EEG-based biomarkers for learning disorder detection.
Diagnostics 15 01772 g005
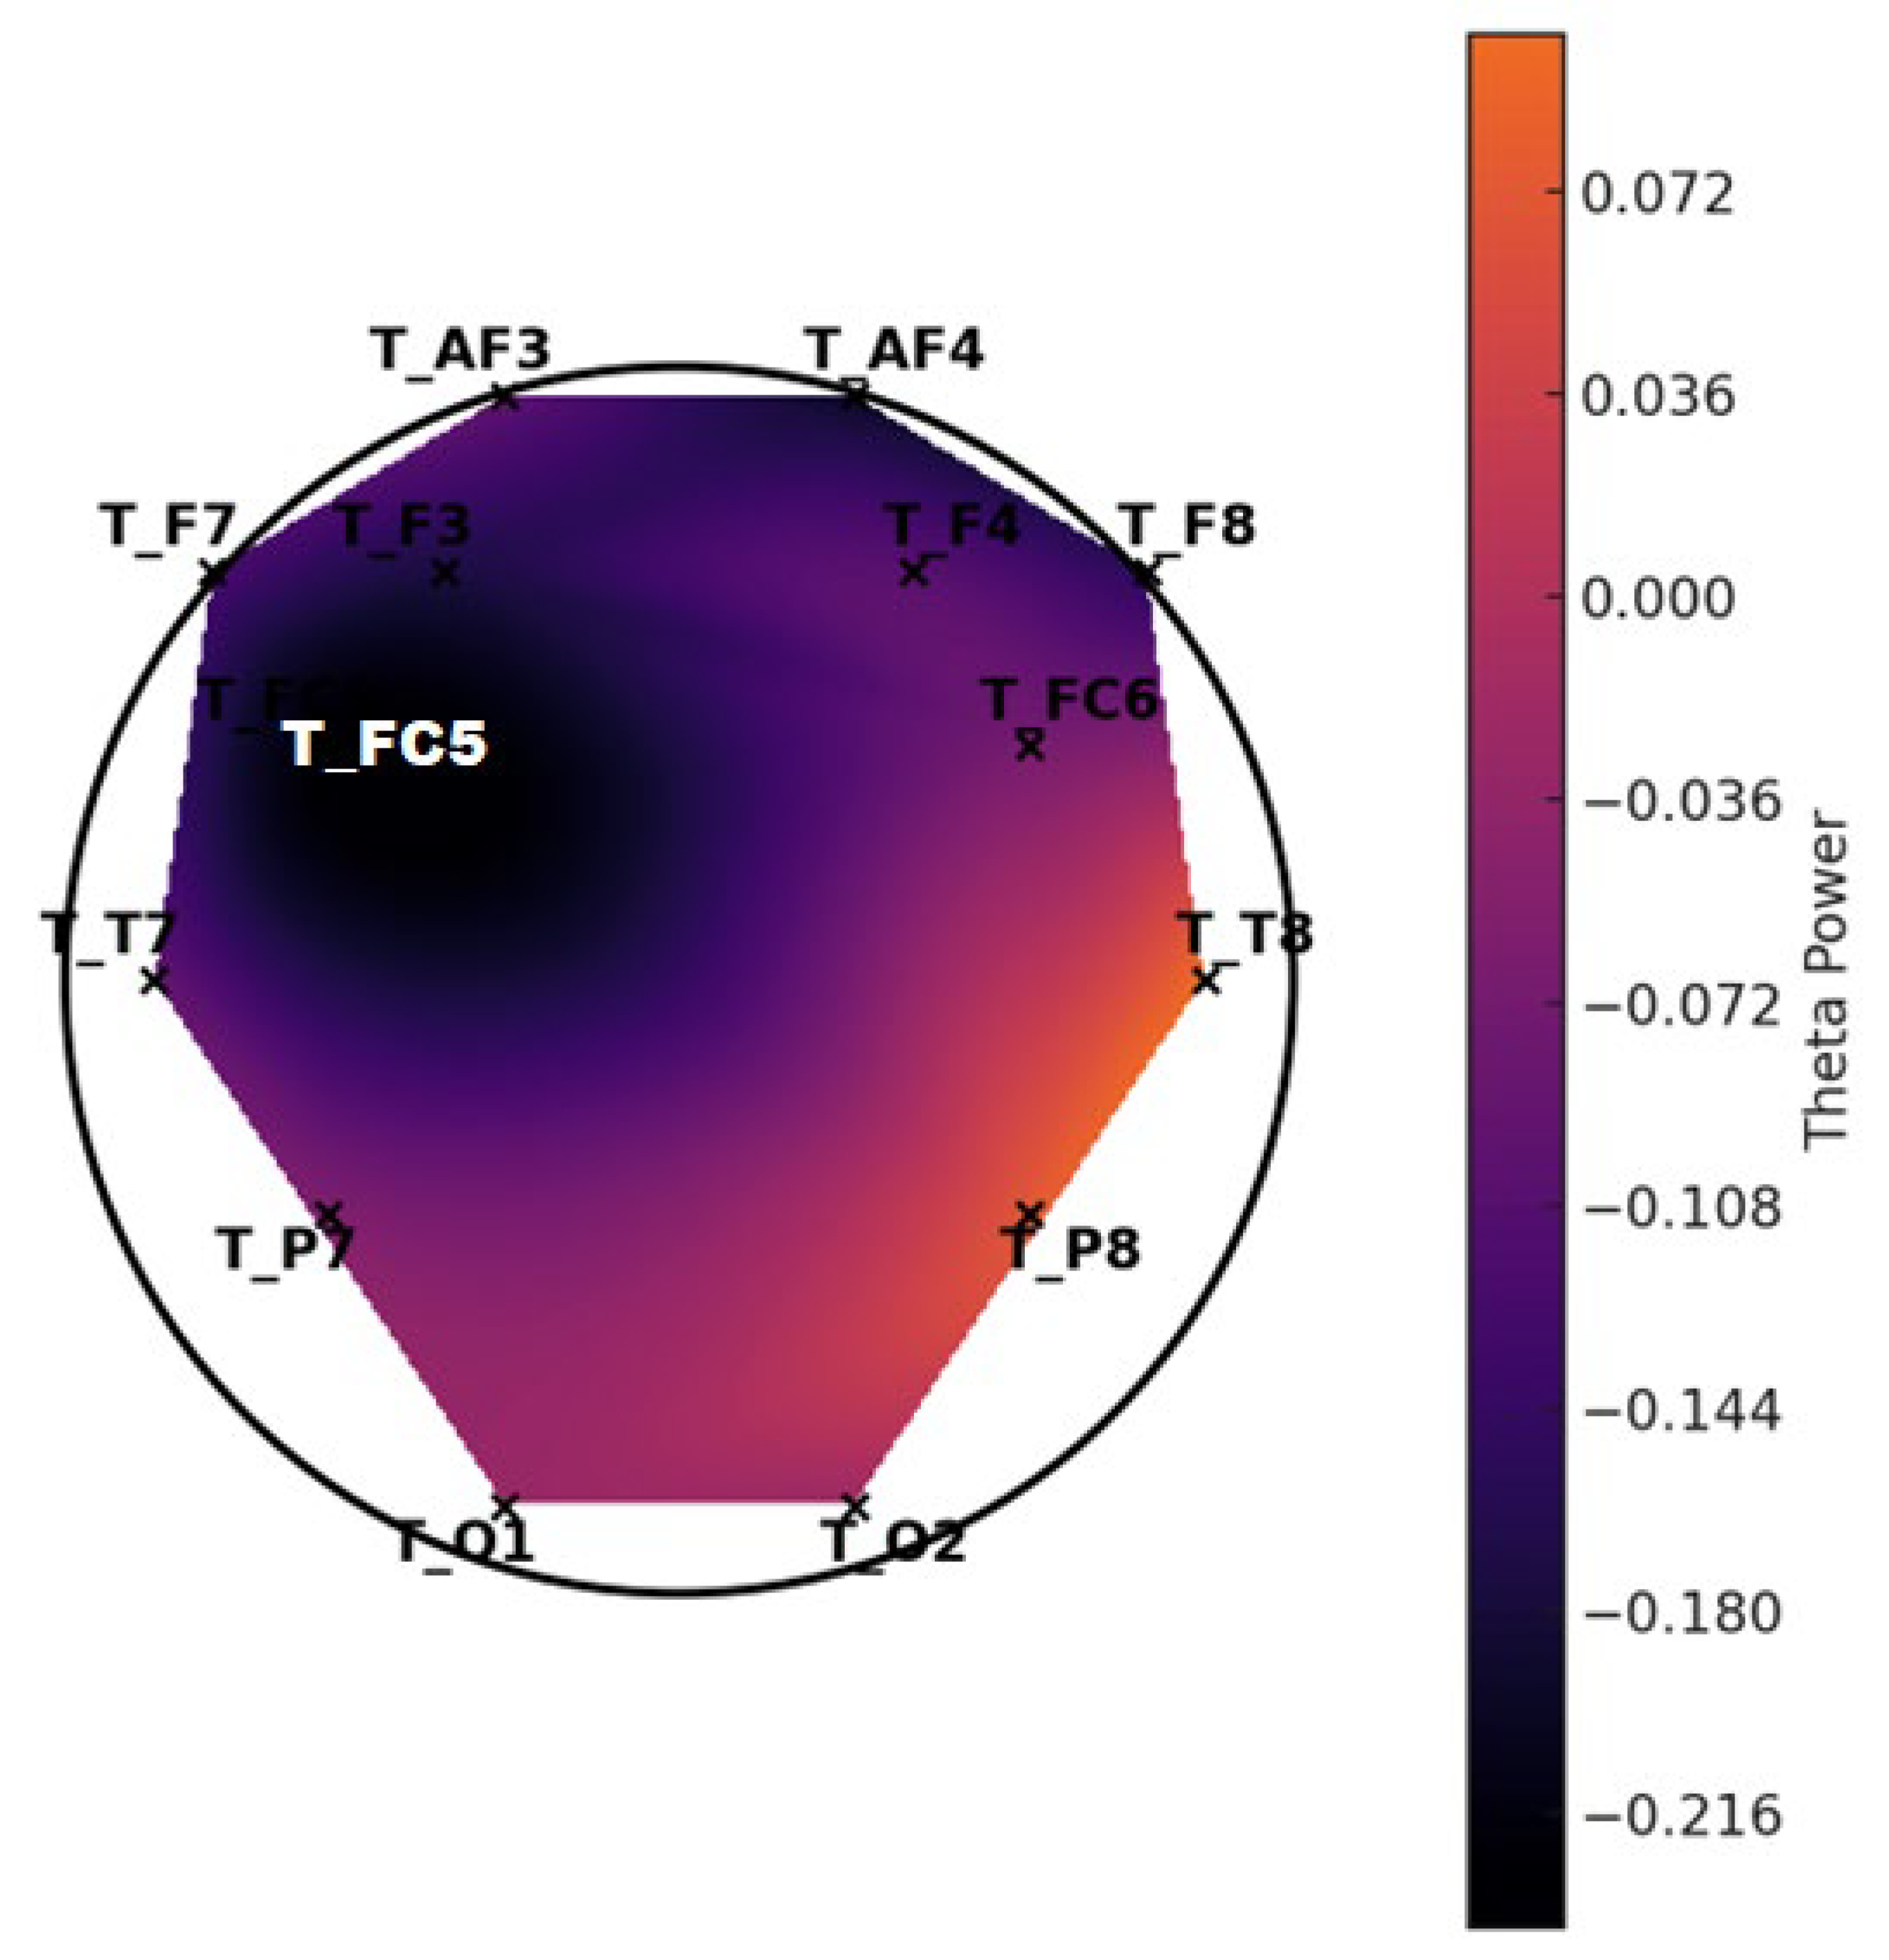
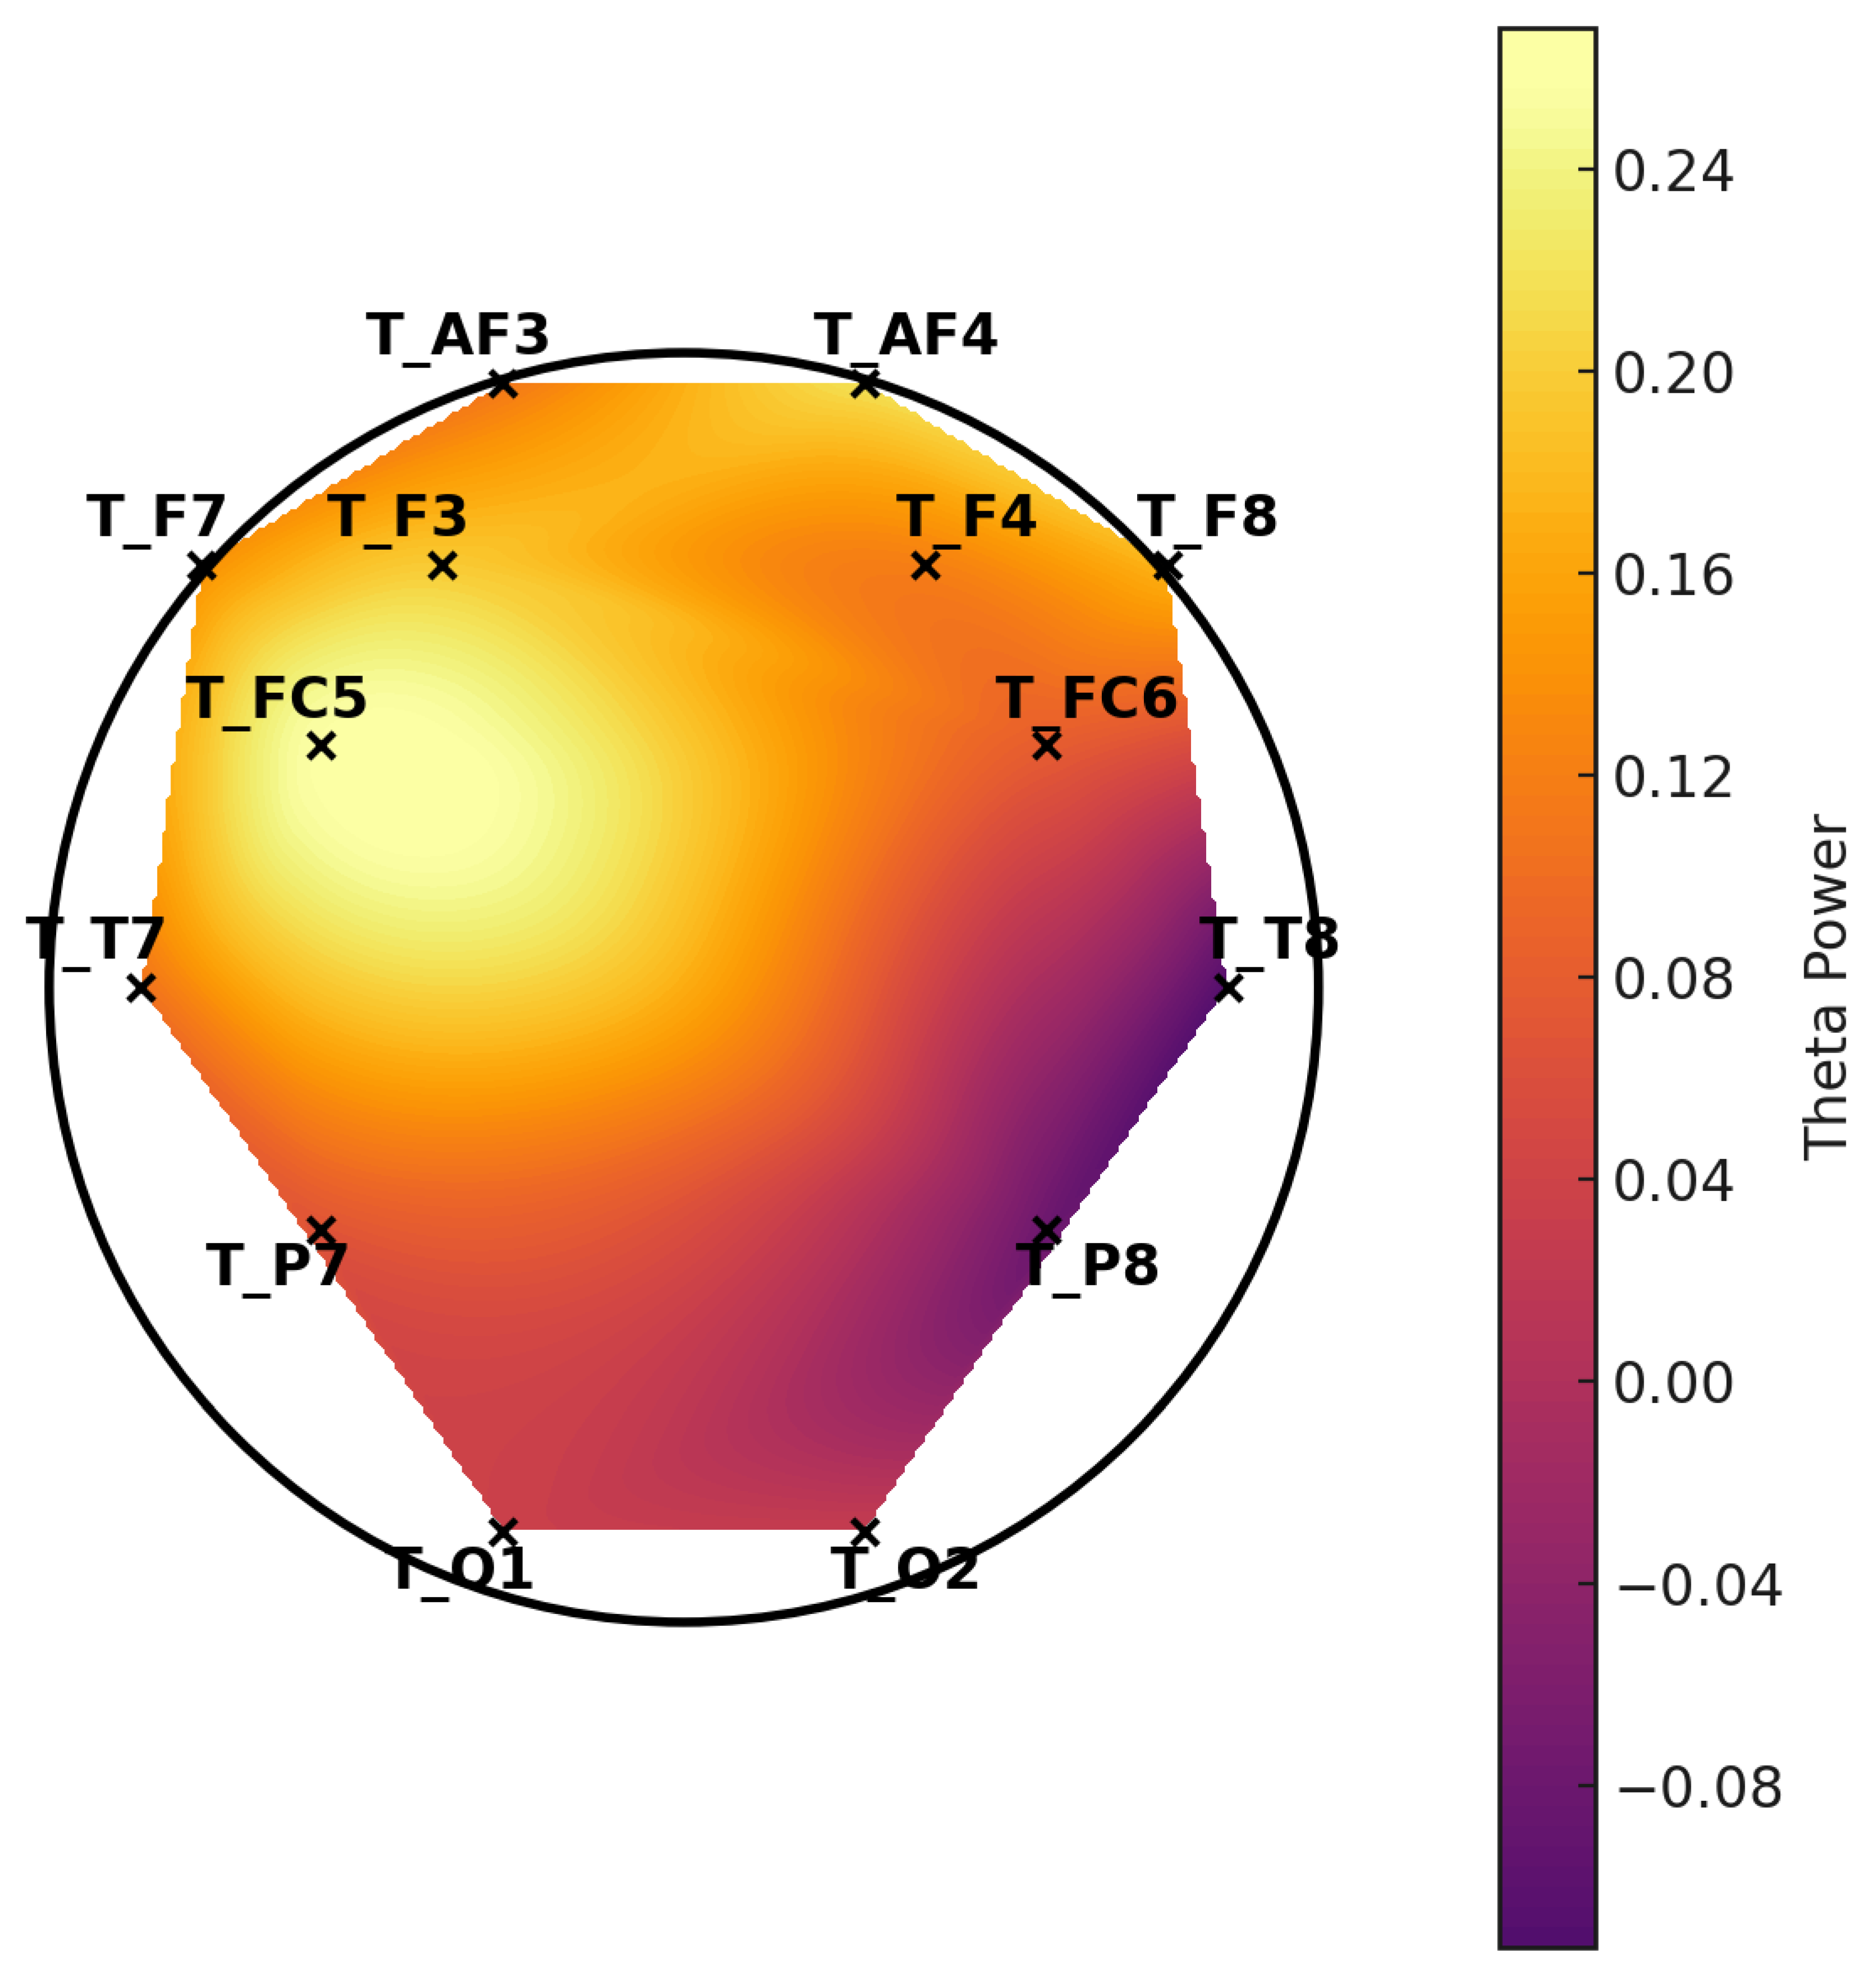
Figure 6. Topographic distribution of mean theta power—LD group.
Diagnostics 15 01772 g006
Figure 7. Topographic distribution of mean theta power—control group. These scalp maps represent the spatial distribution of average theta band power across selected EEG channels. The control group exhibits higher overall theta power, especially in the frontal regions, while the LD group shows relatively reduced frontal theta activity.
Diagnostics 15 01772 g007
Table 1. Architecture of the Artificial Neural Network (ANN). The table outlines the structure of the ANN model used in the study.
Input Layer70 EEG Features
Hidden Layer 164 neurons, Activation: ReLU
Hidden Layer 232 neurons, Activation: ReLU
Output Layer1 neuron, Activation: Sigmoid
Total Layers4
Table 2. Cross-validated ANN performance metrics (5-fold CV). This table presents the average performance metrics for the ANN model evaluated using 5-fold cross-validation.
MetricMean ValueStandard Deviation
Accuracy99.49%±0.0009
Precision99.05%±0.0017
Recall100%±0.0000
F1 Score99.5%±0.0008
Log Loss0.031±0.01
Disclaimer/Publisher’s Note: The statements, opinions and data contained in all publications are solely those of the individual author(s) and contributor(s) and not of MDPI and/or the editor(s). MDPI and/or the editor(s) disclaim responsibility for any injury to people or property resulting from any ideas, methods, instructions or products referred to in the content.