1. Introduction
Automatic medical image analysis has emerged as a cornerstone of modern healthcare diagnostics, with retinal imaging serving as a critical tool for the early detection and monitoring of various ocular and systemic diseases [
1]. The segmentation of retinal structures, particularly blood vessels, plays a vital role in diagnosing conditions such as diabetic retinopathy (DR), hypertension-related retinopathy, and glaucoma [
2,
3]. As these conditions represent leading causes of preventable blindness globally, the development of accurate and reliable automated segmentation systems has become increasingly important for supporting clinical decision-making and enabling large-scale screening programs [
4,
5].
Deep learning approaches have revolutionized retinal image segmentation, with convolutional neural networks (CNNs) demonstrating remarkable performance in extracting complex vascular patterns [
6,
7,
8]. However, the success of these models is fundamentally dependent on the quality of the training data labeling. The accurate annotation of medical images is particularly challenging due to the intricate nature of anatomical structures. The task is further complicated by interobserver variability and the substantial time and expertise required for manual annotation. Consequently, even widely used benchmark datasets may contain labeling errors that can significantly impact model training and evaluation [
9,
10,
11,
12,
13,
14,
15].
The segmentation challenge presented by label noise in retinal image datasets extends beyond simple annotation errors. Pixels may be mislabeled due to ambiguous vessel boundaries, poor image quality, artifacts, and the subjective interpretation of complex vascular structures. These labeling inaccuracies can lead to several detrimental effects: (1) the introduction of poor outcomes during model training, as networks learn incorrect patterns; (2) unreliable performance evaluation due to errors in test datasets; and (3) potential misdiagnoses when precision is paramount [
16,
17,
18,
19,
20,
21].
Recent studies have highlighted the pervasive nature of labeling errors in medical imaging benchmarks, revealing that even well-established datasets used for algorithm development and validation may contain significant annotation inconsistencies [
20,
22]. This realization has prompted a re-evaluation of traditional approaches to model training and performance assessment, emphasizing the need for robust methods that identify and correct labeling errors systematically.
To address this challenge, we propose a novel framework that leverages Confident Learning (CL), a principled approach for characterizing and correcting label noise in datasets [
23,
24,
25]. CL provides a theoretical foundation for estimating the joint distribution of noisy and true labels, enabling the identification of potentially mislabeled examples with statistical confidence. By integrating CL methodologies with human re-annotation processes, our approach aims to enhance both the quality of training data and the reliability of model evaluation in retinal image segmentation tasks.
This study makes several key contributions to the field of medical image analysis. First, we have developed an effective and scalable label correction framework that combines CL techniques with non-expert human verification, making it accessible in practical clinical applications. Second, we have implemented and evaluated two distinct CL-based correction strategies—Confident Joint Analysis (CJA) and Prune by Noise Rate (PBNR)—using different neural network architectures to assess their effectiveness across various noise conditions. Third, we have provided comprehensive experimental evidence that correcting labeling errors, particularly in validation datasets, significantly improves the accuracy and reliability of performance assessments. Finally, we have conducted a cross-validation analysis between the two methodologies to evaluate their consistency and potential for synergistic application.
The remainder of this paper is organized as follows:
Section 2 reviews related works in retinal image segmentation, label noise handling, and CL approaches.
Section 3 details our proposed methodology, including the CL-based correction strategies and implementation details.
Section 4 presents the experimental results obtained from four public retinal image datasets. Discussions of the results and study limitations follow in
Section 5 and
Section 6.
Section 7 presents our conclusions.
3. Materials and Methods
Our proposed framework integrates CL principles with human re-annotation to systematically identify and correct label errors in retinal image segmentation datasets. The methodology consists of five main components: (1) materials, (2) network architectures, (3) a CL-based pixel-level label noise estimation, (4) the implementation of two distinct CL strategies—Confident Joint Analysis (CJA) and Prune by Noise Rate (PBNR)—to compare their effectiveness across different architectures and noise conditions, and (5) evaluation metrics.
3.1. Materials
In order to assess the efficacy of our proposed methodology, we executed a series of experiments employing four publicly accessible retinal image datasets: DRIVE, STARE, CHASE_DB1, and HRF. Collectively, these datasets encompass a total of 133 images, each paired with an expert-annotated segmentation mask. The specifics of each dataset can be found in
Table 1. The datasets were chosen for their variability in image quality and annotation style. The DRIVE and CHASE_DB1 datasets served as the foundational basis for initializing the network models utilized to investigate and explore noisy identification within the STARE and HRF datasets. All images underwent a resizing process to achieve a resolution of 1024 × 1024 pixels through the application of the nearest neighbor interpolation method.
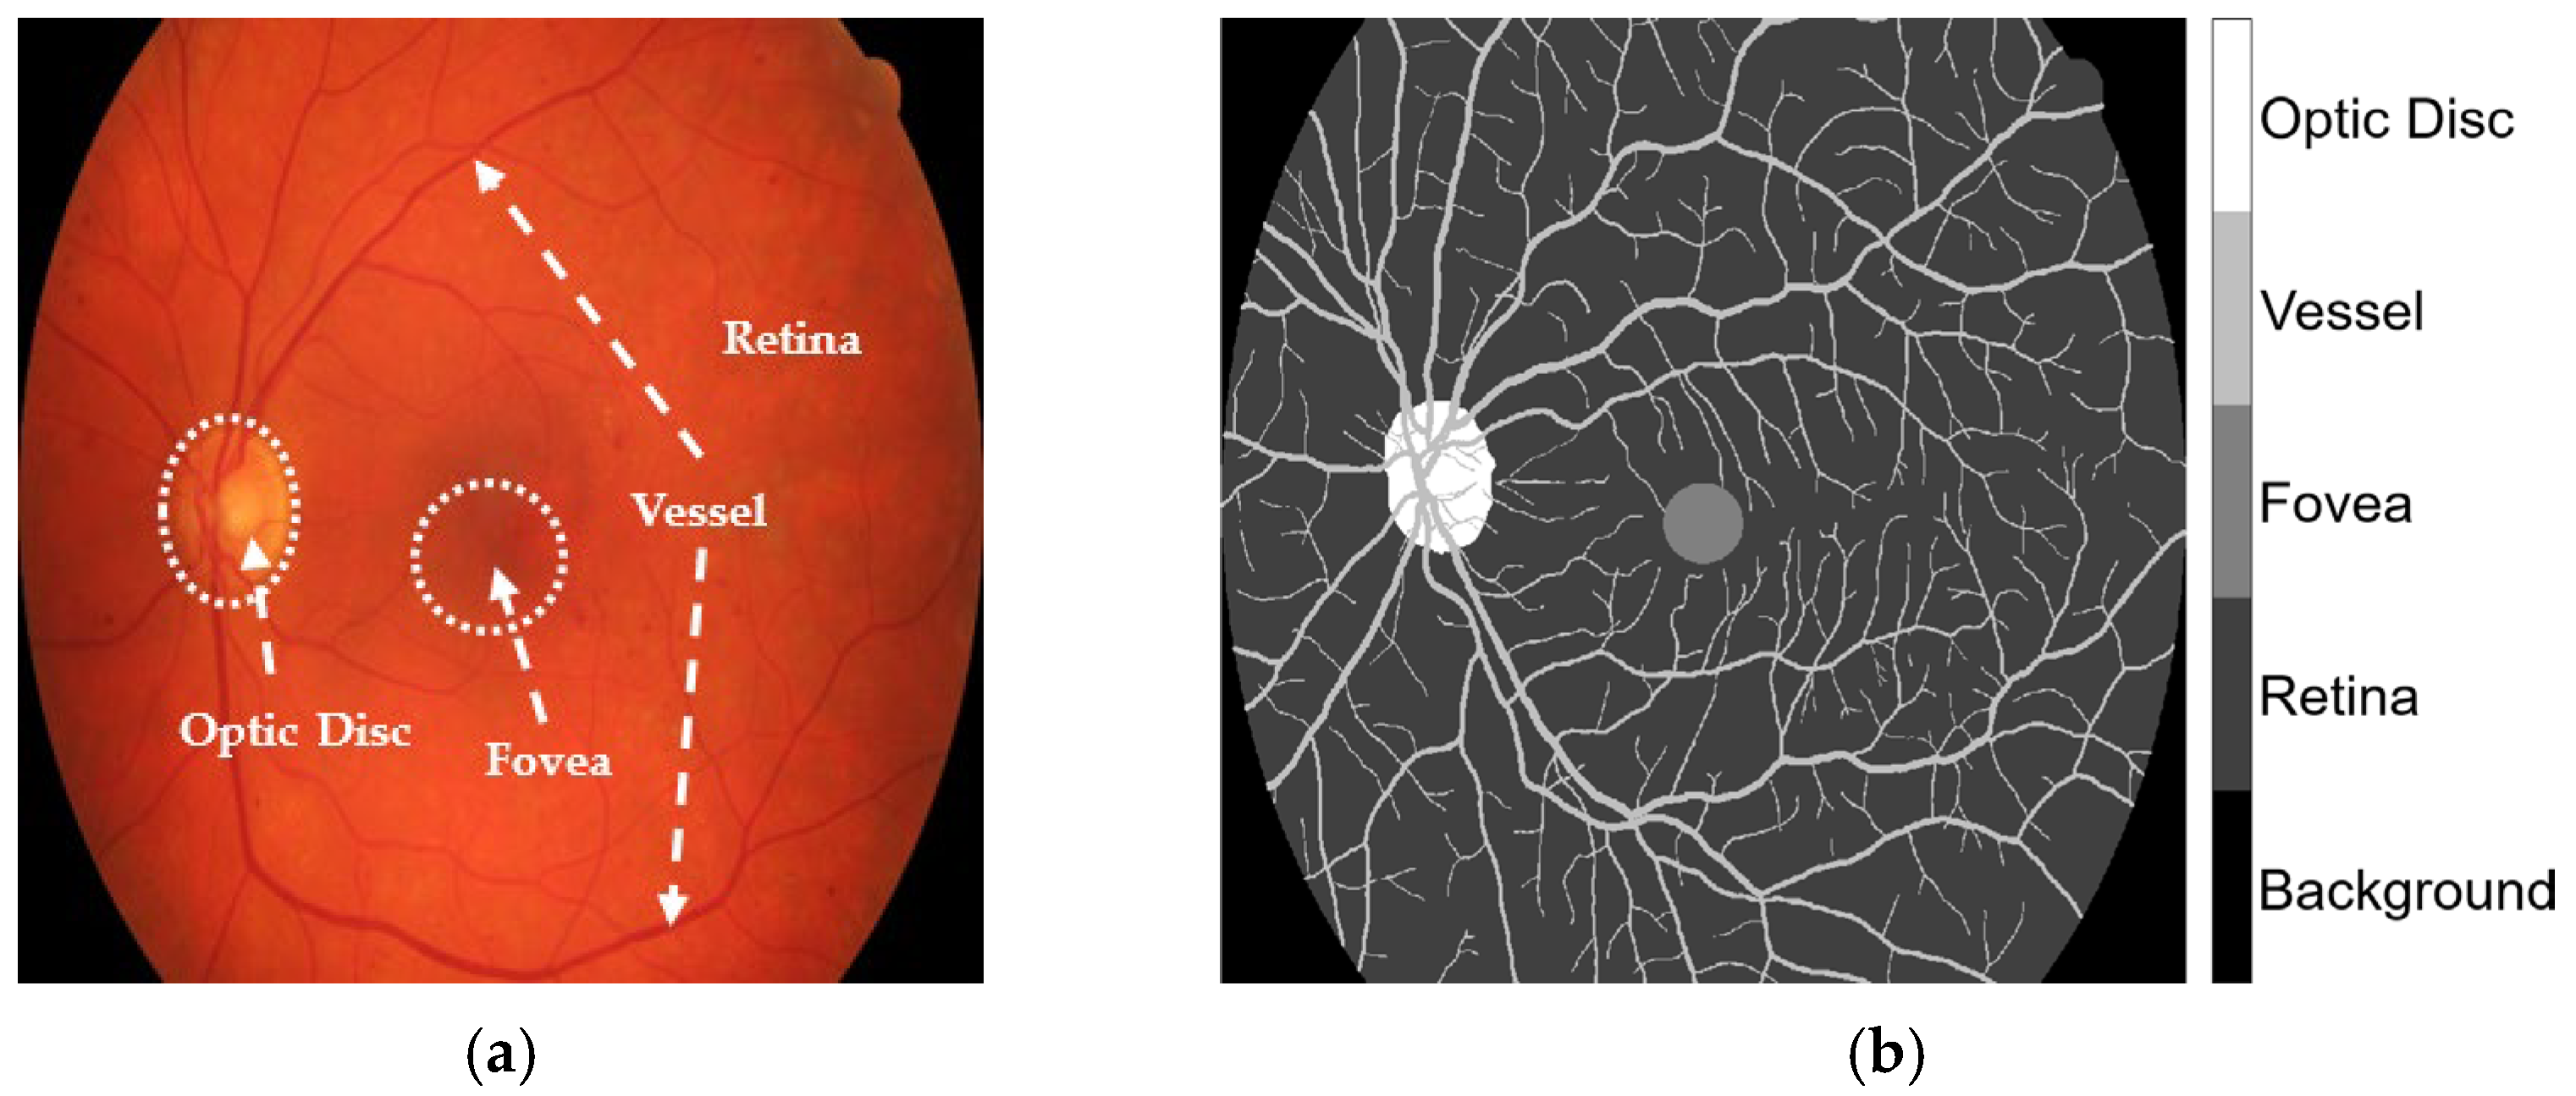
The HRF, DRIVE, and CHASE_DB1 datasets facilitated the examination of label inaccuracies within the CLA framework. The ground truths were first modified by incorporating three additional classes, retina, optic disc, and fovea, as shown in
Figure 1. The revised annotations were conducted under the guidance of seasoned ophthalmologists who delivered precise delineations to guarantee accuracy in the segmentation methodology. When these three classes were overlaid, they became major anatomic structures in the retinal images. Blood vessels in the STARE database were manually annotated by two experts, Adam Hoover (AH) and Valentina Kouznetsova (VK), as referenced in [
10]. The annotated data are publicly available at
https://cecas.clemson.edu/~ahoover/stare/probing/index.html (accessed on 2 July 2025). These annotations are used as reference labels to evaluate label rectification within the PBNR framework.
3.2. Network Architecture
DeepLabV3+ is a state-of-the-art semantic segmentation model that integrates various components from previous models to improve performance. It employs an encoder-decoder structure, where the encoder extracts high-level features from input images using a backbone network, while the decoder refines these features for precise segmentation. A key feature of DeepLabV3+ is the use of atrous, or dilated, convolutions and atrous spatial pyramid pooling (ASPP). The atrous convolutions expand the receptive field without increasing the number of parameters. This allows the model to capture multiscale contextual information effectively, which is essential for segmenting the optic disc, fovea, and vessels of varying sizes. The ASPP module performs parallel atrous convolutions at different rates, enabling the model to gather the global context and improve the segmentation accuracy. This is particularly beneficial for retinal images, where vessels can be thin and intricate.
To examine the segmentation of anatomic structures of the retina and rectify labeling discrepancies in blood vessel datasets, two foundational architectures—ResNet [
35] and DeepLabV3+—were deployed. This approach facilitated a thorough assessment of segmentation efficacy in different conditions and datasets. The foundational model, ResNet50, is a sophisticated deep convolutional neural network that employs residual connections, thereby enhancing the training of deeper architectures. It allows DeepLabV3+ to capture intricate multiscale contextual information through atrous convolutions, culminating in accurate anatomic structure segmentation. Its proficiency in representing complex features is particularly beneficial in challenging scenarios characterized by label noise and intricate structures, and enabled the investigation of the CJA framework, designated as CJA-RN50DLv3+. Conversely, the ResNet-18 backbone is a more superficial and lightweight residual network, optimized for expedited inference and diminished computational requirements. It was employed to encode within DeepLabV3+ specifically for the segmentation of blood vessels, which facilitated the exploration of PBNR frameworks, referred to as PBNR-RN18DLv3+.
3.3. CL-Based Pixel-Level Label Noise Estimation
CL is a technique for identifying and correcting labeling errors by analyzing the agreement between model predictions and observed labels using the predicted class probabilities of a model as evidence. It systematically detects instances where the predicted label likely differs from the true label, enabling an accurate refinement of the annotation. The CL-based method is particularly effective in medical imaging and was developed for label refinement in two strategies: CJA and PBNR. CJA estimates the joint distribution of true and noisy labels using a confident joint matrix. This operation allows the identification of mismatches where the model is confident that the observed label is incorrect. PBNR ranks samples based on their likelihood of being mislabeled and selectively prunes or flags low-confidence samples using noise rate estimates to reduce the influence of label noise. Both methods, CJA and PBNR, follow a shared sequence of key steps.
A semantic segmentation model was trained using noisy labels (ỹ) obtained from non-expert annotations. After training, the CJA-RN50DLv3+ and PBNR-RN18DLv3+ frameworks generated class-wise predicted probabilities for each pixel x ∈ X, denoted as , where i is the class index and θ represents the model parameters.
- 2.
Identifying Noisy Labels
For the CJA-RN50DLv3+ model, the confidence scores were used to estimate the likelihood that each pixel was correctly labeled. By comparing these confidence scores with the original labels, potential label errors could be inferred. For the PBNR-RN18DLv3+ model, label noise was modeled using a noise transition matrix to indicate the probability of one class being mislabeled as another. Two annotation sets from the STARE dataset—AH and VK—are used in this study. The AH set was treated as a set of naturally observed labels, while the VK set of annotations served as the ground truth. The noise transition matrix was defined as
where
Tỹ, y* denotes the noise transition matrix;
ỹ is the observed noisy label;
y* is the unobserved, latent, or correct label.
P(ỹ = | y* = j) is the conditional probability that a true label y* = j is flipped to a noisy label ỹ = i.
- 3.
Computing Class-Wise Confidence Thresholds
For every categorized class, a confidence threshold,
, was determined to differentiate true positives from false positives as follows:
In Equation (2),
represents the confidence threshold for class ;
is the set of pixels originally labeled as class
is the model-predicted probability of pixel
belonging to class
.
- 4.
Constructing the Confident Joint Matrix
The confident joint matrix, denoted as , quantified the relationship between noisy labels (ỹ) and inferred true labels (y*). Each entry represented the number of pixels labeled as class i in the noisy dataset, and confidently predicted by the model to belong to class j, based on class-specific confidence thresholds.
Confidence was determined by comparing the model-predicted probability
to a threshold
for class
j, typically estimated as the mean predicted probability of that class. The confident joint matrix was formally defined as
in which
is the set of samples labeled as class i but are inferred to belong to class j, based on the confidence threshold ;
denotes the model-predicted probability that sample x belongs to class j, given parameter θ;
is the confidence threshold for class j;
The argmax selects the class
with the highest predicted probability among those whose predicted probabilities exceed their respective thresholds
. This operation ensures that the inferred class label j is both confident and the most probable among the eligible classes.
- 5.
Computing the Normalized Margin-Based Pixel Ranking
To prioritize pixels most likely to be mislabeled in the PBNR approach, we computed the normalized margin for each observed label. This margin quantified the confidence gap between the predicted probability of the noisy label
ỹ and the highest predicted probability across all other classes. The normalized margin was defined as
where
Pixels were then ranked in ascending order based on their normalized margin scores. A lower normalized margin indicated greater uncertainty, and hence, a higher likelihood of mislabeling.
In the traditional PBNR method, the lowest-ranked pixels—corresponding to the estimated noise rate per class—would typically be removed from the training dataset. However, in this study, we retained all samples. Rather than potentially discarding useful data, we used the normalized margin ranking to guide label refinement, thereby maintaining dataset integrity while still mitigating the impact of label noise.
3.4. Implemented Frameworks
The models utilized for the implementation of label correction via CJA and PBNR are illustrated in
Figure 2 and
Figure 3, respectively. The methods put forward not only augment the precision of segmentation but also establish a resilient framework for mitigating label noise within medical imaging datasets. The methods are described below.
3.4.1. CJA Model
CJA constitutes a fundamental methodology within the CL framework that is specifically designed to identify and rectify labeling inaccuracies within machine learning datasets. This technique discerns likely instances of mislabeling by computing the confident joint matrix, as in Equation (3), which encapsulates the joint distribution between authentic labels and the observed labels from the datasets. To evaluate the contribution of CJA-driven label refinement to enhanced image segmentation performance, CJA-RN50DLv3+ was deployed to study, evaluate, and correct the labeling in the HRF dataset. The CJA framework is depicted in
Figure 2. The incorporation of CL into the training framework was anticipated to augment the quality of the training dataset and consequently enhance the segmentation results. The subsequent subsections provide a detailed account of each phase of the CJA workflow.
The following procedure is outlined in
Figure 2. The modified datasets, DRIVE and CHASE-DB1, underwent preprocessing to adjust the spatial resolution to 1024 × 1024 pixels through the application of nearest neighborhood interpolation on both the images and their corresponding masks. These datasets provided the training data for the CJA-RN50DLv3+ model, which was instrumental in initializing the segmentation of major anatomic structures of the retina. The obtained HRF training dataset was randomly partitioned into three subsets, with sub_HRF-1 and sub_HRF-2 each comprising ten images, while sub_HRF-3 comprised the remaining images. The subset sub_HRF-1 was utilized for the fine-tuning of the CJA-RN50DLv3+ model. The fine-tuned model was evaluated on sub_HRF-2 to determine its efficacy in accurately segmenting retinal structures. Some evaluative results are illustrated in
Figure 4. These submodules facilitated the preparation of the model for the CJA process.
The CJA process, as described in
Section 3.3, was then implemented. The confidence threshold for each
category was computed from Equation (2) (
Table 2). In order to construct the confident joint matrix for the entire set of images within the sub_HRF-2 dataset, it was imperative to examine the original ground truths. The original images underwent enhancement utilizing Contrast Limited Adaptive Histogram Equalization (CLAHE) [
36] to augment the anatomic details of the retina, and the Image Labeler application within MATLAB [
37] was used to rectify labeling inaccuracies present in each class, as depicted in
Figure 5. These meticulously refined ground truths facilitated the calculation of the confident joint matrix from Equation (3), as demonstrated in
Table 3.
Figure 6 visualizes the segmentation results specifically for the vessel class, illustrating the relationships in the corresponding row and column of the confident joint matrix shown in
Table 3. The dark blue region represents true positive (TP) pixels—those originally labeled as vessel (
ỹ) and also confirmed as vessel by CL (
y* = vessel). This TP region contained 81,780 pixels, where the predicted probability score for the vessel class exceeded the threshold of 0.9744 indicated in
Table 2. The light blue region represents false positive pixels—originally labeled as other classes but predicted by CL as a vessel. These pixels included 4 labeled as background, 14,137 as retina, and 669 as optic disc. These 14,810 pixels exceeded the vessel threshold of 0.9744 but fell below the thresholds of their putative classes, indicating potential label noise. Conversely, the light green region represents false negative pixels—originally labeled as vessel but identified by CL as other classes. This group included 1 pixel now reclassified as background, 16,686 as retina, 1 as fovea, and 615 as optic disc. For these 17,303 pixels, the thresholds of their reclassifications exceeded the probability threshold for the vessel classification, suggesting mislabeling in the original annotation.
As illustrated in
Figure 2, following the identification of noise and the refinement of masks by CL, sub_HRF-2 contained two distinct sets: an initial set originating from the CL refinement, and a second set derived from human refinement. Both were utilized to train the CJA-RN50DLv3+ model in order to evaluate the efficacy of the CJA framework during the experimental procedures.
3.4.2. PBNR Model
The PBNR framework is illustrated in
Figure 3. The framework constitutes a systematic approach to the identification of noise. Inaccurately labeled pixels are identified by evaluating class-specific noise rates derived from model predictions. The most erroneous instances are eliminated based on these assessments. The CL methodology facilitates the automated enhancement of training labels, thereby improving the quality of annotations and fostering more resilient segmentation outcomes.
The following procedure is outlined in
Figure 3. The modified datasets DRIVE and CHASE-DB1 underwent a rigorous preprocessing phase to recalibrate the spatial resolution to 1024 × 1024 pixels via the implementation of nearest neighbor interpolation on both the images and their associated masks. These datasets constituted the foundational framework for the training of the PBNR-RN18DLv3+ model dedicated to blood vessel segmentation. The model, once trained, was used to forecast vessel classification from the STARE dataset, which preserved the predicted probability scores,
, necessary for the computation of the threshold values from Equation (2) (
Table 4). In Equation (1), the true label,
y*, was substituted with the VK set, while
ỹ was derived from the AH set within the STARE dataset. In this way, the noise transition matrix could undergo retraining. In this study, label noise was not artificially introduced but was derived from inherent inaccuracies in the manual annotations of the DRIVE dataset. Although the annotations were created by expert graders, they still contained inconsistencies, particularly where regions of low contrast, ambiguous vessel boundaries, or fine vascular structures occurred. Such imperfections are common in medical image datasets and reflect the subjective nature of manual labeling. Previous studies (e.g., Zhang et al. [
31]; Xu et al. [
18]) have highlighted that even datasets annotated by experts can exhibit variability and noise. This naturally occurring label noise provides a realistic setting for evaluating the robustness of Confident Learning (CL)-based label refinement methods. To elucidate the identification of noise within the PBNR model, the image file, im0001, with its corresponding ground truth from the AH set, its threshold value, and its predicted probability, were utilized to establish the CL confident joint matrix in
Table 5.
The confident joint matrix shows for image im0001 shows 5981 false-positive pixels misclassified as background and 23,960 as a vessel. These values reflect the labeling discrepancies identified by the CL method and are visualized in the observed issue mask shown in
Figure 7a.
To prioritize these potentially mislabeled pixels, the normalized margin, as defined in Equation (4), was applied to all pixels in the observed issue mask. Each pixel was then ranked in ascending order by its normalized margin score, where a lower score indicated higher uncertainty and a greater likelihood of being mislabeled.
To evaluate the effectiveness of CL in detecting label errors, PBNR was used to examine the overlap between
Figure 7a (the observed issue mask) and
Figure 7b (the true issue mask). Pixels present in both masks were classified as true positives (TPs) and highlighted in
Figure 7c. Additional categories—false positives (FPs), false negatives (FNs), and true negatives (TNs)—were also represented in
Figure 7c and summarized in
Table 6. An FP refers to a pixel present in
Figure 7a but not in
Figure 7b, indicating an incorrectly flagged error. An FN refers to a pixel present in
Figure 7b but absent from
Figure 7a, representing an error missed by CL. A TN refers to a pixel not flagged by CL in
Figure 7a and correctly labeled according to the ground truth, which is an appropriate case of no error detected.
Table 7 lists the top 10 candidate label errors in im0001, ranked by their normalized margin scores. Here, the “true label” refers to the VK ground truth annotation, while the “true issue” column indicates whether each candidate was a confirmed labeling error (one) or not (zero), based on a comparison with the true issue mask derived from annotation disagreements between AH and VK (
Figure 7b).
As shown in
Figure 3, following the detection of noise and the enhancement of masks through CL, the STARE ground truth identified certain observed pixels within the AH set, yielding refined observed masks and two subsets, one comprising fourteen images allocated for training, and the other comprising the remaining six images designated for testing. The training subset was used to instruct the PBNR-RN18DLv3+ model, with the objective of assessing the effectiveness of the PBNR framework throughout the experimental phase.
3.5. Evaluation Metrics
To evaluate the performance of the semantic segmentation models, we employed four widely-used metrics: accuracy (Acc), Intersection over Union (IoU), weighted IoU, and Mean Boundary F1 Score (MeanBFScore). These metrics capture complementary aspects of segmentation quality, particularly in the context of imbalanced medical datasets such as retinal vessel segmentation.
This metric evaluates the overall proportion of correctly predicted pixels across all classes. While it provides a general sense of model correctness, it may be less informative in scenarios with significant class imbalance, such as the dominance of background pixels over smaller structures like vessels. Acc was determined as follows:
Class accuracy evaluates the proportion of correctly predicted pixels for each class individually. This metric helps identify model performance across imbalanced or minority classes and was determined as follows:
where
i denotes the class index.
IoU evaluates the spatial overlap between the predicted segmentation and ground truth by computing the ratio of their intersection to their union. IoU is particularly effective in assessing how well the model captures the extent of target regions and was determined as
This metric is an extension of standard IoU that applies class-specific weights to address class imbalance. In vessel segmentation, where background regions vastly outnumber vessel pixels, this metric ensures that minority class performance is properly reflected in the evaluation. Weighted IoU was determined as follows:
where
C is the number of classes,
is the IoU for class
c, and
is the number of pixels in class
c in the ground truth.
A boundary-based metric, MeanBFScore compares the predicted and ground truth object edges using the F1 score. This metric is especially relevant for medical segmentation tasks, such as retinal imaging, where accurate delineation of fine anatomic structures is critical. It was determined as
where
and
are computed based on the distances between predicted and ground-truth boundaries within a tolerance (typically a few pixels). The final metric is the average BFScore over all images:
Together, these metrics provided a robust evaluation framework that considered pixel-level accuracy, object-level overlap, class imbalance, and boundary precision—key factors in determining segmentation performance in clinical applications.
4. Experiments
The performances of the CJA and PBNR models were assessed on the test datasets shown in
Figure 2 and
Figure 3. Inter-model evaluations were conducted, where the ground truth adjusted by each model underwent cross-testing. The findings derived from this analysis will yield insights into the efficacy of each correction methodology and their influence on segmentation performance across the datasets.
4.1. Experimental Settings
All experimental procedures were conducted utilizing MATLAB® R2023a. The training and assessment methodologies were performed on a workstation furnished with an Intel® Xeon® E5-2689 0 @ 2.60 GHz central processing unit (Intel Corporation, Santa Clara, CA, USA), 32 GB of RAM, and an NVIDIA® Tesla K40c graphics processing unit (NVIDIA Corporation, Santa Clara, CA, USA), which facilitated hardware acceleration for deep learning calculations.
4.2. Training Parameters
The neural network was developed utilizing retinal fundus images alongside their associated labeled segmentations. A stochastic gradient descent optimization algorithm was implemented with the following hyperparameters: 1000 training epochs, a batch size of two, a momentum coefficient of 0.9, a learning rate of 0.001, and a weight decay of 1 × 10⁻⁴. These parameters were meticulously chosen to facilitate stable convergence throughout the training process.
4.3. CJA Model Evaluation
To assess the impact of label refinement on segmentation performance, we conducted a retraining and evaluation experiment as the final stage of the CJA-based label correction pipeline. This step validated whether the improved labeling of evaluation data leads to better model performance.
Figure 8 presents the retraining and evaluation process, where the baseline trained CJA-RN50DLv3+ model was trained on sub_HRF-2 under three distinct scenarios:
Original labels—the model was trained using the initial original labels without any correction, representing the baseline scenario.
CL-refined labels (Scenario 1)—the model was trained using labels refined solely through CL, based on the confident joint matrix derived from the original masks.
Human and CL-refined labels (Scenario 2)—the model was trained using labels refined through a combination of human correction and CL, representing the most reliable version of the ground truth.
Figure 8.
Retraining and evaluation with refined labels. This stage completes the CJA-based label refinement process by retraining the model using the corrected labels and evaluating its performance on clean test data. The goal is to assess the effectiveness of label correction in improving segmentation accuracy.
These three trained models were then evaluated on the sub_HRF-3 dataset using both the original and corrected label sets to ensure a fair performance comparison. This experiment specifically aimed to assess how varying levels of label refinement affected the generalization capability of the model.
This setup enabled a comparative evaluation of model performances under different label quality conditions, demonstrating the effectiveness of CL-based refinement in improving training data and enhancing semantic segmentation accuracy.
Table 8 presents the segmentation performance across all model training configurations, demonstrating consistent improvements as the quality of the test set labels increased. The best results were achieved when the models were evaluated on the Scenario 2-refined test set (human and CL-refined masks). The model trained on CL-refined masks yielded the highest weighted IoU (0.95709), whereas the model trained on the human and CL-refined masks achieved the highest global accuracy (0.97697), IoU (0.91557), and MeanBFScore (0.98452). This configuration also provided a competitive class accuracy (0.95056), indicating strong performance across both the majority and minority classes.
These findings demonstrate that training with refined labels—particularly those corrected through a combination of human inspection and CL—could significantly enhance segmentation quality and model generalization. While global accuracy, IoU, and weighted IoU showed substantial improvements after label refinement, the MeanBFScore remained relatively stable, suggesting that the boundary-level precision improved only moderately. Since the highest metric values were achieved on the Scenario 2-refined sub_HRF-3 test set, the class-wise segmentation performances (accuracy, IoU, and MeanBFScore) of all three models were further evaluated exclusively on this refined version (
Table 9).
As shown in
Table 9, the background and retina classes returned consistently high scores across all models, indicating that they were relatively easier to segment. The fovea class benefited the most from label refinement, with accuracy improving from 0.8420 (original training) to 0.9423 and IoU from 0.8335 to 0.9272, highlighting the impact of label refinement on small or ambiguous structures. The vessel class also showed notable increases in both IoU and boundary precision, with the MeanBFScore exceeding 0.98 for all refined models, reflecting the improved localization of thin and complex structures. The optic disc class showed moderate but consistent gains in all metrics. These results confirmed that label refinement—particularly combining human and CL methods—could enhance not just overall performance but also class-specific segmentation quality, especially for challenging anatomic regions.
These refinements directly influenced both model training and evaluation. By reducing label noise and improving annotation quality, particularly in anatomically complex regions such as vessels and optic discs, the refined datasets enabled more precise learning of class boundaries. Models trained on these improved datasets exhibited stronger generalization and superior segmentation performance across all key metrics. This effect was especially evident under high-noise conditions, where poor label quality has a greater impact. The integration of CL with human review not only enhanced label reliability but also contributed to more stable benchmarking and fairer comparisons across different model configurations.
4.4. PBNR Model Evaluation
The images from the STARE dataset contained heterogeneous backgrounds. Setting the background intensity to zero in the preprocessing significantly improved the segmentation accuracy by mitigating background noise and enhancing vessel visibility. To assess the impact of label refinement using the PBNR method, the field of view provided a comparative retraining and evaluation experiment aimed at quantifying performance improvements when training with CL-refined labels versus original noisy annotations.
Figure 9 shows the process of retraining and evaluating, where the PBNR-RN18DLv3+ model was retrained using the STARE training dataset under two conditions: (1) the original annotations, AH set, and (2) the refined AH labels created using the PBNR framework. Each model was evaluated on the same set of six AH test images using two conditions of test masks: (1) the original AH masks and (2) the CL-refined masks. This setup allowed us to isolate the effect of label quality on segmentation performance and analyze model generalization across varying annotation conditions.
Table 10 presents a comparative evaluation of the PBNR-RN18DLv3+ model trained on the original and CL-refined AH masks from the STARE dataset and tested on both original and CL-refined masks. When trained on the original AH labels, the model achieved a global accuracy of 0.96881 and an IoU of 0.79758 on the original test masks. Its performance improved when evaluated on CL-refined masks, reaching a 0.97021 global accuracy and 0.81508 IoU. Notably, class accuracy also increased from 0.85475 to 0.89097, and the weighted IoU improved from 0.94232 to 0.94598. The MeanBFScore showed a slight increase from 0.93542 to 0.93828, indicating stable boundary performance.
In contrast, the model trained on CL-refined AH masks consistently outperformed its counterpart. It achieved a 0.97092 global accuracy and 0.81811 IoU on the original test masks, and further improved to 0.97776 and 0.86297, respectively, on the CL-refined test masks. Class accuracy increased to 0.90188 and the weighted IoU to 0.95758, highlighting improved segmentation quality across both the vessel and background classes. The MeanBFScore also increased significantly, from 0.94609 to 0.96692, suggesting enhanced boundary precision under refined training and testing conditions.
Overall, these results confirmed that training with CL-refined labels could enhance model performances across all major metrics—particularly in IoU, class accuracy, and weighted IoU—while also contributing to improved boundary delineation. The findings underscored the effectiveness of CL-guided label correction in producing more accurate and robust semantic segmentation models for medical imaging.
4.5. Cross-Validation of Label Quality Between the CJA and PBNR Methods
Table 11 presents a performance comparison of the PBNR-RN18DLv3+ model trained on either the original or CL-refined AH masks from the STARE dataset, evaluated across three versions of the sub_HRF-3 test set: original masks, CL-refined masks, and human and CL-refined masks.
The model trained on the original masks achieved a global accuracy of 0.94871 and an IoU of 0.77975 when evaluated on the original test set. Its performance improved noticeably when evaluated on the CL-refined and human and CL-refined masks, with IoU increasing to 0.81452 and 0.81507, respectively. The MeanBFScore also increased to approximately 0.9546 in both cases, indicating improved boundary-level prediction. These results highlighted the significant impact of the test label quality on evaluation outcomes, even when the training data itself were not refined.
Conversely, the model trained on CL-refined masks consistently outperformed the original trained counterpart across all test sets. Even on the original test masks, it achieved better performance, returning an IoU of 0.79626, global accuracy of 0.94885, and a higher MeanBFScore of 0.95525. When evaluated on the CL-refined and human and CL-refined masks, its performances improved further, with the global accuracy exceeding 0.955, IoU around 0.812–0.813, and MeanBFScore peaking at approximately 0.965.
These findings indicate that refining training labels using CL could generate more accurate, generalizable, and robust segmentation models. Also, the improved performance across all test set variants reinforces the critical role of label quality not only in training but also in evaluation. The consistent gains observed with CL-refined masks confirm the value of CL in producing reliable annotations that advance the segmentation of medical images.
Table 12 compares the performance of the CJA-RN50DLv3+ model trained on three types of segmentation masks from the sub_HRF-2 dataset—original, CL-refined, and human and CL-refined—evaluated on both the original and CL-refined AH masks from the STARE dataset.
Overall, the model trained on CL-refined masks consistently delivered superior performances across nearly all metrics. When evaluated on CL-refined AH masks, it achieved the highest values for global accuracy (0.95595) and weighted IoU (0.91907), and, notably, the best MeanBFScore of 0.87515, indicating strong boundary delineation. Even when tested on original AH masks, the CL-trained model maintained robustness (MeanBFScore: 0.86262), suggesting effective generalization.
Interestingly, the model trained on the original masks also performed reasonably well, especially on CL-refined test masks (global accuracy, 0.95645; weighted IoU, 0.92089), implying that, despite label noise during training, the model retained some resilience and was still capable of producing competitive results under cleaner evaluation conditions.
In contrast, the model trained on human and CL-refined masks showed the weakest performances across both test sets. For example, it yielded a lower MeanBFScore (down to 0.81360 on original AH masks and 0.84084 on CL-refined masks), suggesting that the integration of manual corrections may have introduced inconsistencies or noise, especially when not guided by systematic approaches such as CL.
These findings highlight the critical role of systematic label refinement, particularly through CL, in improving segmentation performance. The combination of CL-refined labels in both training and evaluation settings produced the most reliable and accurate results, especially at the boundary level, underscoring the effectiveness of CL in enhancing model robustness and ensuring consistent benchmarking in medical image segmentation.
4.6. Computational Efficiency and Runtime Analysis
We evaluated the runtime performance of the proposed models using MATLAB® R2023a on a workstation equipped with an Intel® Xeon® E5-2689 0 @ 2.60 GHz CPU, 32 GB of RAM, and an NVIDIA® Tesla K40c GPU, which provided hardware acceleration for deep learning computations. All experiments were conducted using retinal images at a resolution of 1024 × 1024 pixels.
Table 13 presents the average inference times of the models, showing a time of 0.8355 s per image for the baseline DeeplabV3+ResNet-50 model, and a time of 0.8344 s per image for the DeeplabV3+ResNet-50 + CL (Scenario 1) variant. The DeeplabV3+ResNet-18 model recorded an average inference time of 0.4413 s per image, which the CL-integrated version (DeeplabV3+ResNet-18 + CL (Scenario 1)) reduced marginally to 0.4410 s.
The estimated computational cost, measured in Giga Floating Point Operations (GFLOPs), remained unchanged across each backbone: 546.27 GFLOPs for ResNet-50-based models and 329.14 GFLOPs for ResNet-18-based models. Throughput was calculated by dividing GFLOPs by the corresponding inference time, resulting in 654.69 GOPSs for DeeplabV3+ResNet-50 + CL (Scenario 1) and 746.32 GOPSs for DeeplabV3+ResNet-18 + CL (Scenario 1).
Model size also remained unaffected by CL integration, with 175.6 MB for the ResNet-50-based models and 82.4 MB for the ResNet-18-based models.
These results confirmed that incorporating CL introduced no additional computational overhead during inference. The high throughput and relatively compact model sizes demonstrated the practicality of these models for real-time deployment in clinical settings, particularly in embedded or resource-constrained environments. These findings align with recent research into efficient deep learning solutions for ocular disease diagnosis [
38,
39].
5. Discussion
The implementation of the CJA and PBNR frameworks highlighted the practical utility of CL techniques in identifying and correcting labeling errors in medical image segmentation. The CJA-RN50DLv3+ model was trained and fine-tuned using the corrected DRIVE and CHASE-DB1 datasets and evaluated on the HRF dataset. This evaluation enabled the construction of a confident joint matrix that revealed inconsistencies between observed and true labels. Images were then enhanced through CLAHE preprocessing to improve the clarity of anatomic details for more accurate human verification. The final model improved labeling precision by efficiently detecting false positives and false negatives, especially in the vessel class. The enhancement of segmentation performance was validated through probability-based thresholding.
The PBNR-RN18DLv3+ model presents a structured strategy for identifying class-dependent label noise in retinal vessel segmentation. A prioritization mechanism, based on normalized margin scores, ranks suspected mislabeled pixels by uncertainty and the model leverages predictions with associated confidence scores to isolate mislabeled pixels and estimate noise rates across different classes. When applied to the STARE dataset, this process revealed significant discrepancies between the observed and reference annotations that demonstrated the ability of CL to uncover latent labeling errors. While not all detected errors were confirmed, the substantial overlap with known annotation disagreements supported the reliability of the noise detection strategy. The refinement of STARE annotations based on these insights enabled the construction of a cleaner training subset. The improved label integrity of the subset enhanced segmentation quality, reinforcing the practical value of PBNR.
The CJA and PBNR model evaluations presented in
Section 4.3 and
Section 4.4, respectively, highlighted the critical role of label refinement strategies based on CL. Both semantic segmentation models showed improved accuracy and generalizability for retinal image analysis. Across all experiments, including the PBNR-based evaluation summarized in
Table 10, models trained and evaluated using CL-refined segmentation masks consistently outperformed those trained on the original annotations. The PBNR-RN18DLv3+ model, especially when trained on CL-refined labels, showed clear improvements across the key evaluation metrics when tested on both original and corrected annotations. These improvements were particularly notable in the segmentation of retinal structures such as vessels and the fovea, which are highly sensitive to annotation noise. This study supports previous studies that demonstrated the negative impact of noisy or inaccurate labels on medical image segmentation tasks [
4,
5,
9,
11,
18,
19,
20,
21]. Overall, the results of the present study demonstrate that CL-guided label correction enables the development of more accurate, reliable, and robust segmentation models.
Our cross-dataset evaluations in
Section 4.5 further substantiated the role of CL in guiding label refinement for medical image segmentation. As shown in
Table 11, training on CL-refined labels yielded a better boundary quality, as indicated by the highest MeanBFScore. In contrast, models trained on original labels returned slightly better scores for global accuracy and IoU when evaluated on the same CL-refined test set. This result suggests that the choice of annotation involves a trade-off. It may be that CL enhances structural precision, while original labels better preserve pixel-level consistency. The impact of label refinement became more apparent when the model was trained on the original STARE-AH masks and tested on different versions of sub_HRF-3. Even without changing the training data, replacing noisy test masks with CL-refined masks significantly improved the MeanBFScore. Further gains occurred when both training and test masks were refined. These results confirmed that, even without architectural changes, CL improved model generalization and segmentation reliability, reinforcing its value in clinical settings [
1,
18,
19,
20,
21]. The effect of integrating human corrections was revealed in the MeanBFScore values (
Table 12). While combining human and CL-based refinements may seem beneficial, the approach did not consistently produce better outcomes than purely CL-guided corrections. Specifically, the CJA-RN50DLv3+ model trained only on CL-refined labels from sub_HRF-2 achieved the highest MeanBFScore of 0.87515 when evaluated on CL-refined AH masks. In contrast, the same model trained on human and CL-refined labels returned a MeanBFScore of 0.84084. This result suggests that unstructured or inconsistent human corrections may reduce segmentation precision by introducing label variability at object boundaries. These results align with the conclusions of Zhang et al. [
32], who highlighted the importance of the structured characterization of labeling errors to improve annotation quality and model reliability.
In the present investigation, the comparative analysis of the proposed methodology was primarily conducted against a baseline DeepLabV3+ model trained on the original noisy dataset, thereby establishing a foundational performance benchmark. While this benchmark could serve as a critical reference point, it is recognized that contemporary state-of-the-art methodologies for addressing label noise, including Co-teaching [
40], MentorNet [
41] and noise-robust loss functions such as generalized cross-entropy loss [
42], represent alternative strategies that warrant a thorough examination. These methodologies have shown their efficacy in alleviating the detrimental effects of noisy labels across a diverse array of domains. Nonetheless, owing to limitations in computational resources and the scope of the current investigation, direct comparisons with these techniques could not be drawn from the present experiments. This is regarded as a limitation, and more current comparative analyses will be pursued in future research endeavors to provide a more exhaustive and rigorous assessment of the proposed framework.
Taken together, these findings underscore the critical importance of addressing label noise in medical image segmentation. Our cross-dataset evaluations demonstrated that models trained with CL-refined labels not only generalize more effectively to unseen data but also benefit from more reliable performance assessments when evaluated against corrected ground truth masks. This finding reinforces the crucial role of high-quality test sets in ensuring trustworthy and stable benchmarking outcomes. The integration of CL, especially when complemented with human verification, provides a scalable and robust framework for improving annotation integrity. This dual approach strengthens both the training and evaluation phases, directly responding to concerns raised in recent studies regarding the destabilizing impact of label errors in test sets [
20]. Future work should explore combining CL with other label quality estimation techniques, extending the application of CL to multi-class and multi-modal medical imaging tasks—such as OCT and MRI—and evaluating its influence on clinical diagnostic accuracy and decision-making.
The precise delineation of retinal blood vessels holds significant clinical implications within the field of ophthalmology, particularly concerning conditions such as DR and glaucoma. In relation to DR, accurate vascular mapping is crucial for the identification of microaneurysms, hemorrhages, and neovascularization, pathological indicators that often lie adjacent to or disrupt vascular architectures. Improved segmentation facilitates more dependable lesion localization and bolsters automated grading systems for DR. In the case of glaucoma, the vascular morphology surrounding the optic disc plays a vital role in the estimation of the cup-to-disc ratio and the recognition of aberrant vascular patterns, which are essential for a prompt diagnosis. Furthermore, clinical evaluations take into account quantitative biomarkers obtained from vessel segmentation, including tortuosity, caliber, and branching angles. Consequently, the enhancement of vessel segmentation through label correction techniques, such as CL, not only augments model efficacy but also fortifies the reliability, interpretability, and clinical relevance of automated screening systems.
In summary, this study validates the incorporation of CL-based label refinement as a foundational element in reliable semantic segmentation pipelines. When paired with selective human oversight, CL-guided corrections significantly enhance the consistency and accuracy of both training and testing datasets, effectively mitigating the widespread issue of noisy ground truth annotations in medical image analysis.
6. Limitations
Despite the overall effectiveness of CL in improving label quality and enhancing segmentation performance, this study identifies several limitations that warrant further investigation. A primary concern arises from the thresholding mechanism employed during the label correction process, which can lead to the misclassification of pixels, even when the model exhibits high confidence in its predictions.
Figure 10 presents a visual example from Image1024-02_g, in which a vessel pixel—highlighted in a yellow box across all subfigures—is misclassified by the CJA model due to the fixed thresholding mechanism used in the CL-based label refinement process.
Table 14 provides the predicted probability scores for this specific pixel across all classes, along with the corresponding class-specific threshold values that were used to determine whether the prediction should be retained or rejected as out of the distribution.
The pixel belonged to a vessel but had a predicted probability of 0.9306, which fell short of the predefined vessel-specific threshold of 0.9744. The pixel was incorrectly flagged as out of the distribution. This case exemplifies how fixed thresholds may fail to capture the true prediction confidence, particularly in regions near class decision boundaries.
Figure 11 presents a visual example from image im0001, in which a vessel pixel is highlighted in a red box across all subfigures.
Figure 11b shows that the pixel was originally labeled as background by the PBNR model. The PBNR-RN18DLv3+ model predicted this pixel as an undefined or out-of-distribution class because its predicted probability scores as vessel (0.8511) or background (0.1489) (
Table 15) did not exceed the respective threshold values (0.9755 for vessel and 0.9982 for background).
Figure 11c (see also
Figure 7c and
Table 6) indicates that this pixel classification is a false negative. This result means that CL failed to identify this mislabeled pixel, indicating a limitation in its detection capability.
These issues stem from (1) the ambiguity in predicted probabilities near boundaries between classes and (2) the inflexibility of fixed thresholds that do not adapt to local context or uncertainty. Such challenges are critical in medical image segmentation tasks involving fine, complex anatomical structures like retinal vessels.
To address these limitations within this study, we incorporated adaptive thresholding strategies that dynamically adjust threshold values based on local prediction distributions, which helped reduce false rejections. In addition, we applied spatial continuity constraints informed by vessel connectivity heuristics to improve correction robustness in boundary-sensitive regions. These refinements proved effective in mitigating threshold-related misclassifications and contributed to the overall improvement of the annotation quality. The integration of these techniques within our CL-based framework demonstrates its scalability and robustness in clinical retinal image analysis, particularly under conditions of label uncertainty and structural complexity.
Lastly, another prominent limitation of this study involved the domain shift and image quality differences between the training (HRF) and testing (STARE) datasets. Although all images were resized to 1024 × 1024 pixels, the original STARE images possessed a significantly lower visual quality, particularly in sharpness, contrast, and anatomical details. These deficiencies most likely impaired the segmentation performance, especially at the boundaries of small or ambiguous structures such as vessels and the optic disc. As shown in
Table 12, all models, including the best-performing model trained on CL-refined labels, experienced a decrease in the MeanBFScore under this cross-dataset evaluation. The decline in performance highlighted the importance of domain consistency as well as image fidelity when applying label correction strategies across heterogeneous datasets.
7. Conclusions
The rectification of label noise via confident learning and subsequent human refinement markedly enhances the efficacy of semantic segmentation in retinal fundus images. Across different datasets and evaluative metrics, models that were trained on refined labels consistently exhibited superior performances compared with those trained on noisy labels. Significantly, CL-refined models demonstrated enhanced generalization capabilities to previously unseen datasets and yielded more reliable evaluations when assessed against corrected ground truths, thereby underscoring the pivotal importance of the test set quality in facilitating equitable and dependable benchmarking.
The innovative approach presented integrates algorithmic label refinement with rigorous human verification, resulting in highly accurate segmentation not only of prominent anatomic structures but also of subtle pathological regions that may otherwise be overlooked. This dual methodology highlights the critical importance of scalable label correction frameworks in the realm of medical image analysis, demonstrating their capacity to enhance the precision and reliability of diagnostic imaging. Furthermore, the findings emphasize the necessity of prioritizing annotation quality within both training and evaluation pipelines, as high-quality annotations are essential for developing robust machine learning models that can effectively interpret complex medical data. By ensuring meticulous attention to detail in the labeling process, significant improvements can be made to the overall accuracy of automated systems deployed to analyze and identify medical conditions, ultimately leading to better patient outcomes.


