
Enhancing Heart Disease Diagnosis Using ECG Signal Reconstruction and Deep Transfer Learning Classification with Optional SVM Integration


Abstract
1. Introduction
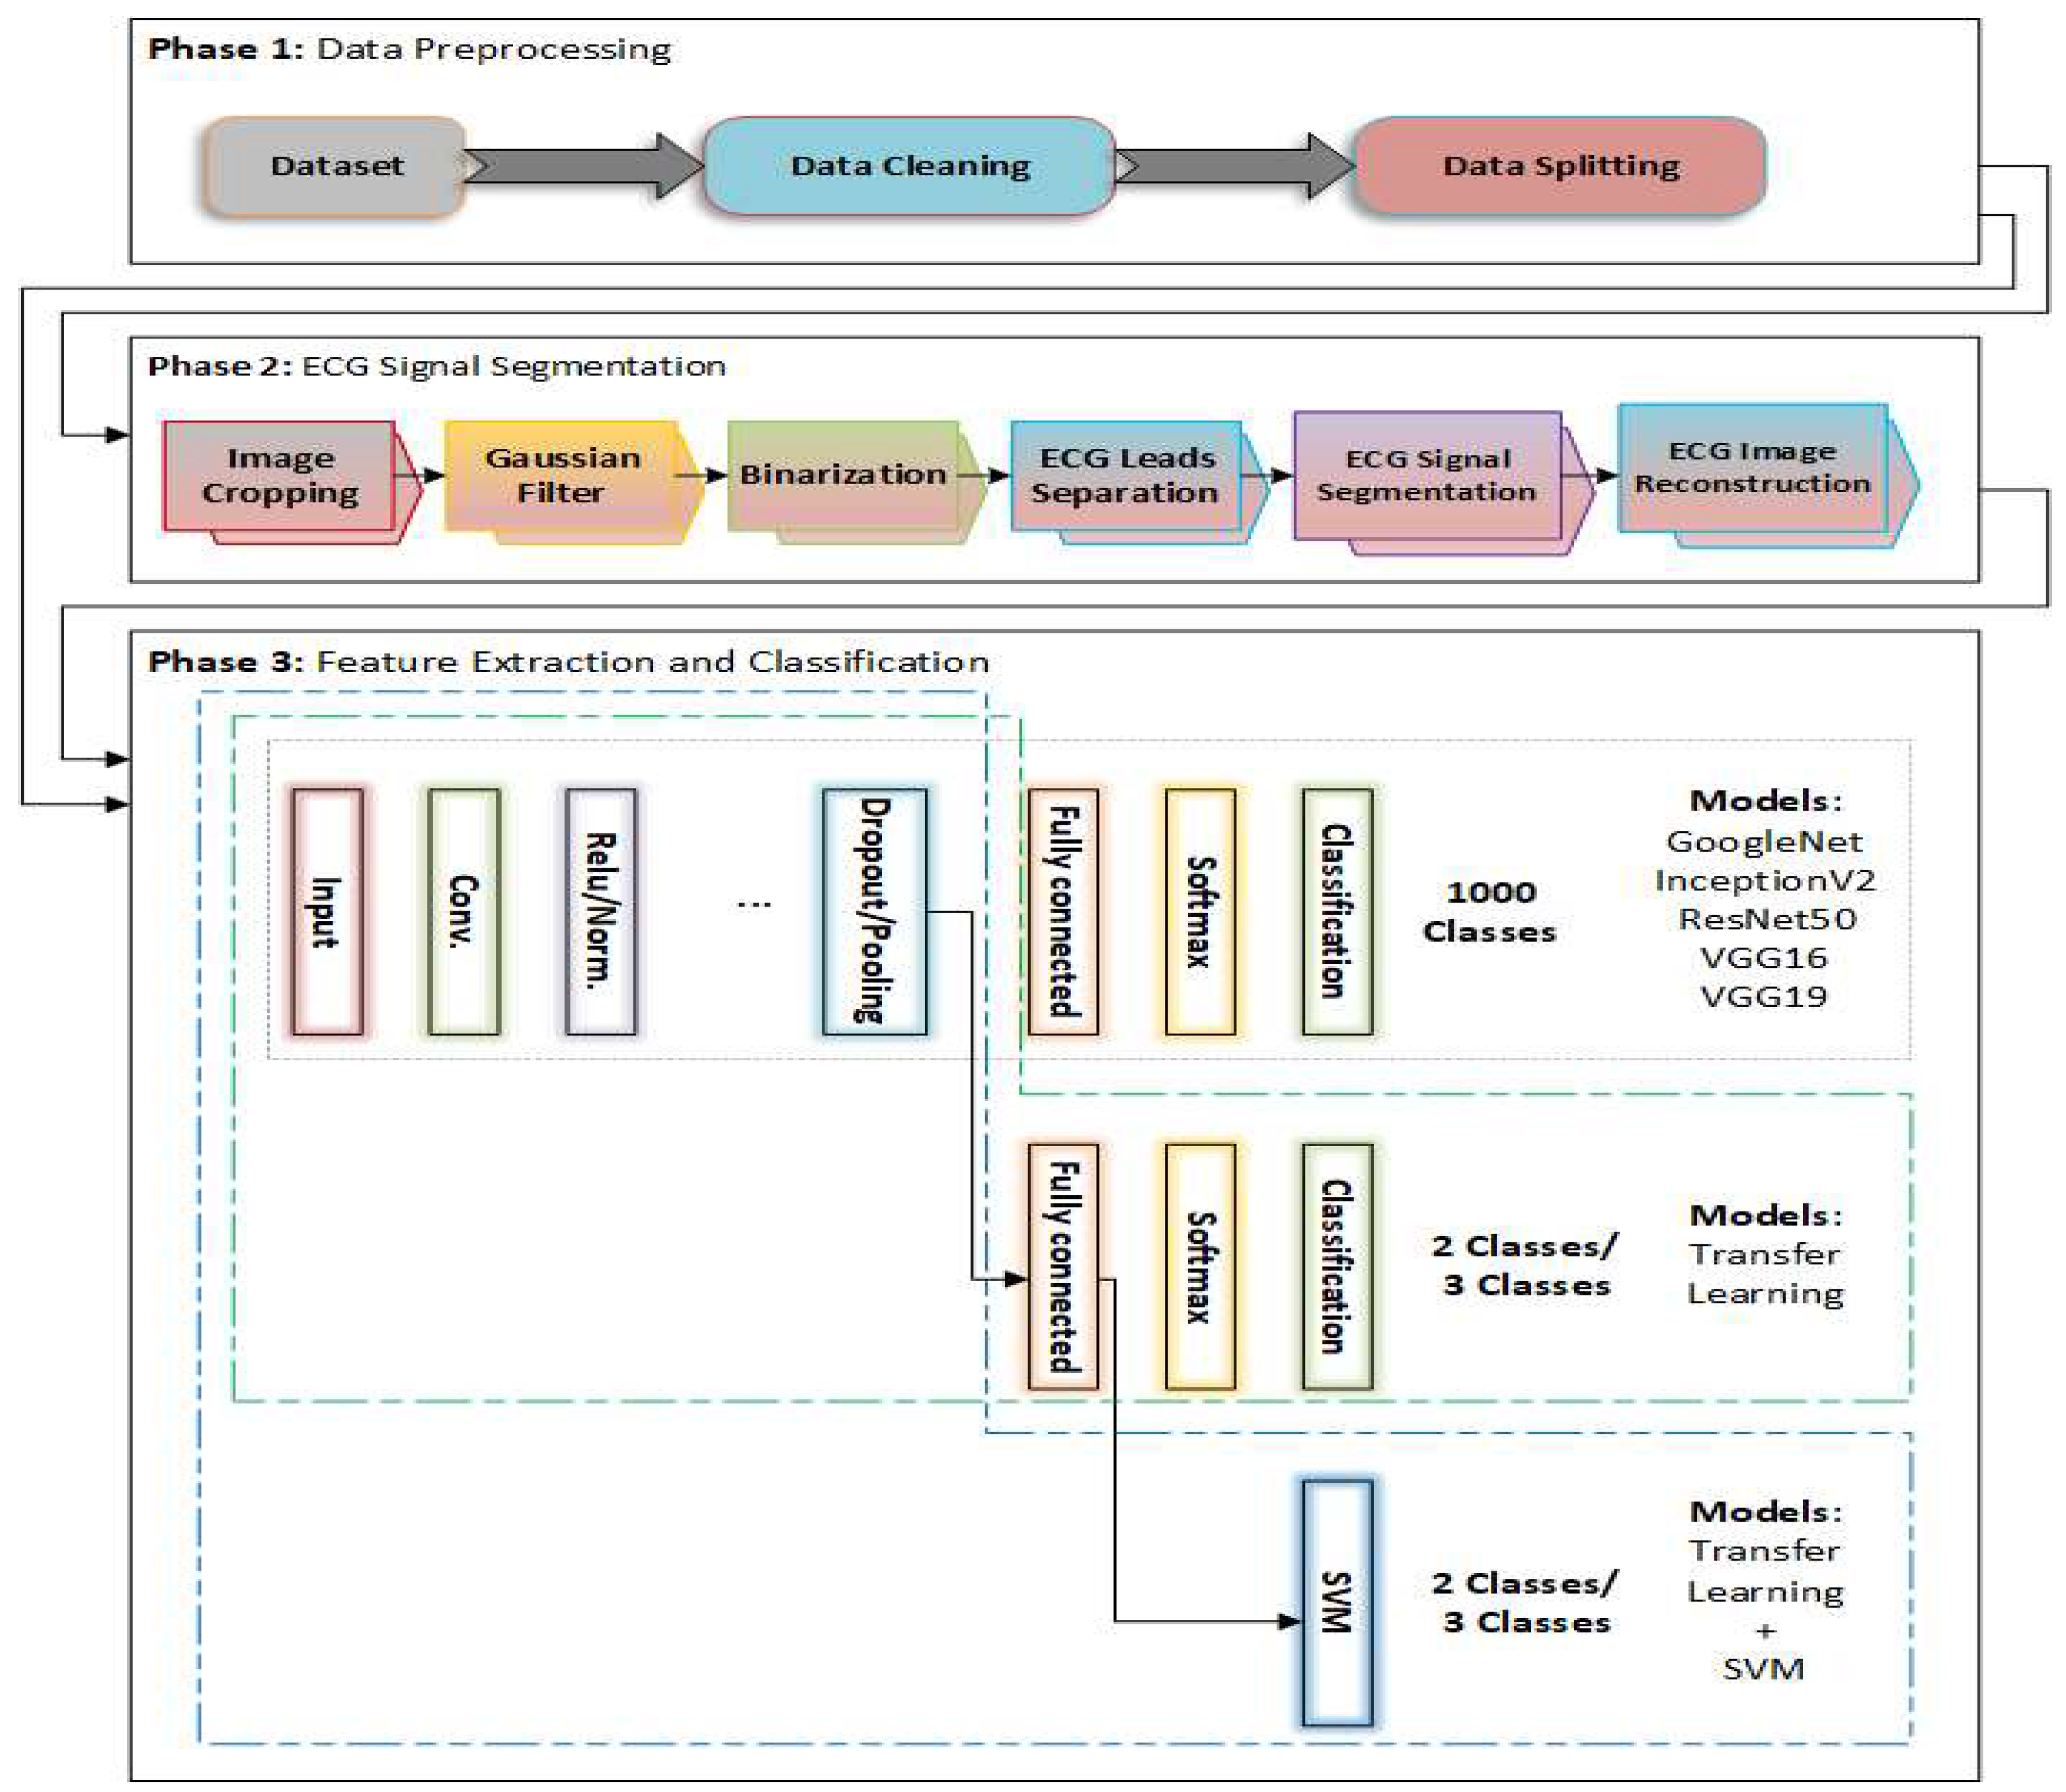
- A comprehensive framework for ECG signal analysis that integrates image segmentation and transfer learning classification, addressing challenges such as noise interference and waveform variability.
- An effective segmentation approach that enhances the extraction of ECG signals, improving the clarity of the signals for better classification and diagnosis.
- Rigorous evaluations of several transfer learning models—such as VGG19, VGG16, InceptionNetV2, ResNet50, GoogleNet, and others—for both binary and multi-class classification tasks, all of which demonstrated high accuracy rates.
- A hybrid model combining VGG19 with SVM, which achieved an outstanding classification accuracy—reaching up to 100% in some tasks. This model outperformed other approaches and highlights the strong potential of ECG signals for enhancing model generalization.
- Extensive comparisons with the recent state of the art to verify the superiority of the proposed models.
2. Literature Review
2.1. CNN-Based Methods
2.2. Hybrid CNN and Machine Learning Models
2.3. Transformer-Based and Attention-Enhanced Models
2.4. Explainable AI and Interpretable DL Techniques
2.5. Transfer Learning and Custom Architectures

| Ref. | Year | Dataset | Dataset Size | Model | Accuracy |
|---|---|---|---|---|---|
| [13] | 2021 | ECG Images dataset | 11,148 standard 12-lead-based ECG images | Single Shoot Detection (SSD) MobileNet v2-based DL | Multi-class diagnosis: 98 for 4 classes |
| [18] | 2025 | ECG Images dataset | 1406 ECG images | CNN+ML | Transfer learning: 88.65% Transfer learning with GNB, SVM, and RF: 98.93% |
| [37] | 2022 | ECG Images dataset | 928 ECG images (741 images for training and 187 images for testing) | MobileNetV2 and VGG16 | MobileNetV2 model: 95% after fine-tuning VGG16 model: 95% after fine-tuning |
| [38] | 2024 | ECG Images dataset | 928 ECG images | A novel image-vectorization method with ANNs | Binary classification models: Normal vs. MI: 92.39% Normal vs. Abn-HB: 88.88% Normal vs. His-MI: 78.72% Multi-label classification model: 89.58% |
| [39] | 2022 | ECG Images dataset | 1682 ECG images | InceptionV3, ResNet50, MobileNetV2, VGG19, and DenseNet201 | InRes-106 model: 98.34% InceptionV3 model: 90.56% ResNet50 model: 89.63% DenseNet201 model: 88.94% VGG19 model: 87.87% MobileNetV2 model: 80.56% |
3. Methodology
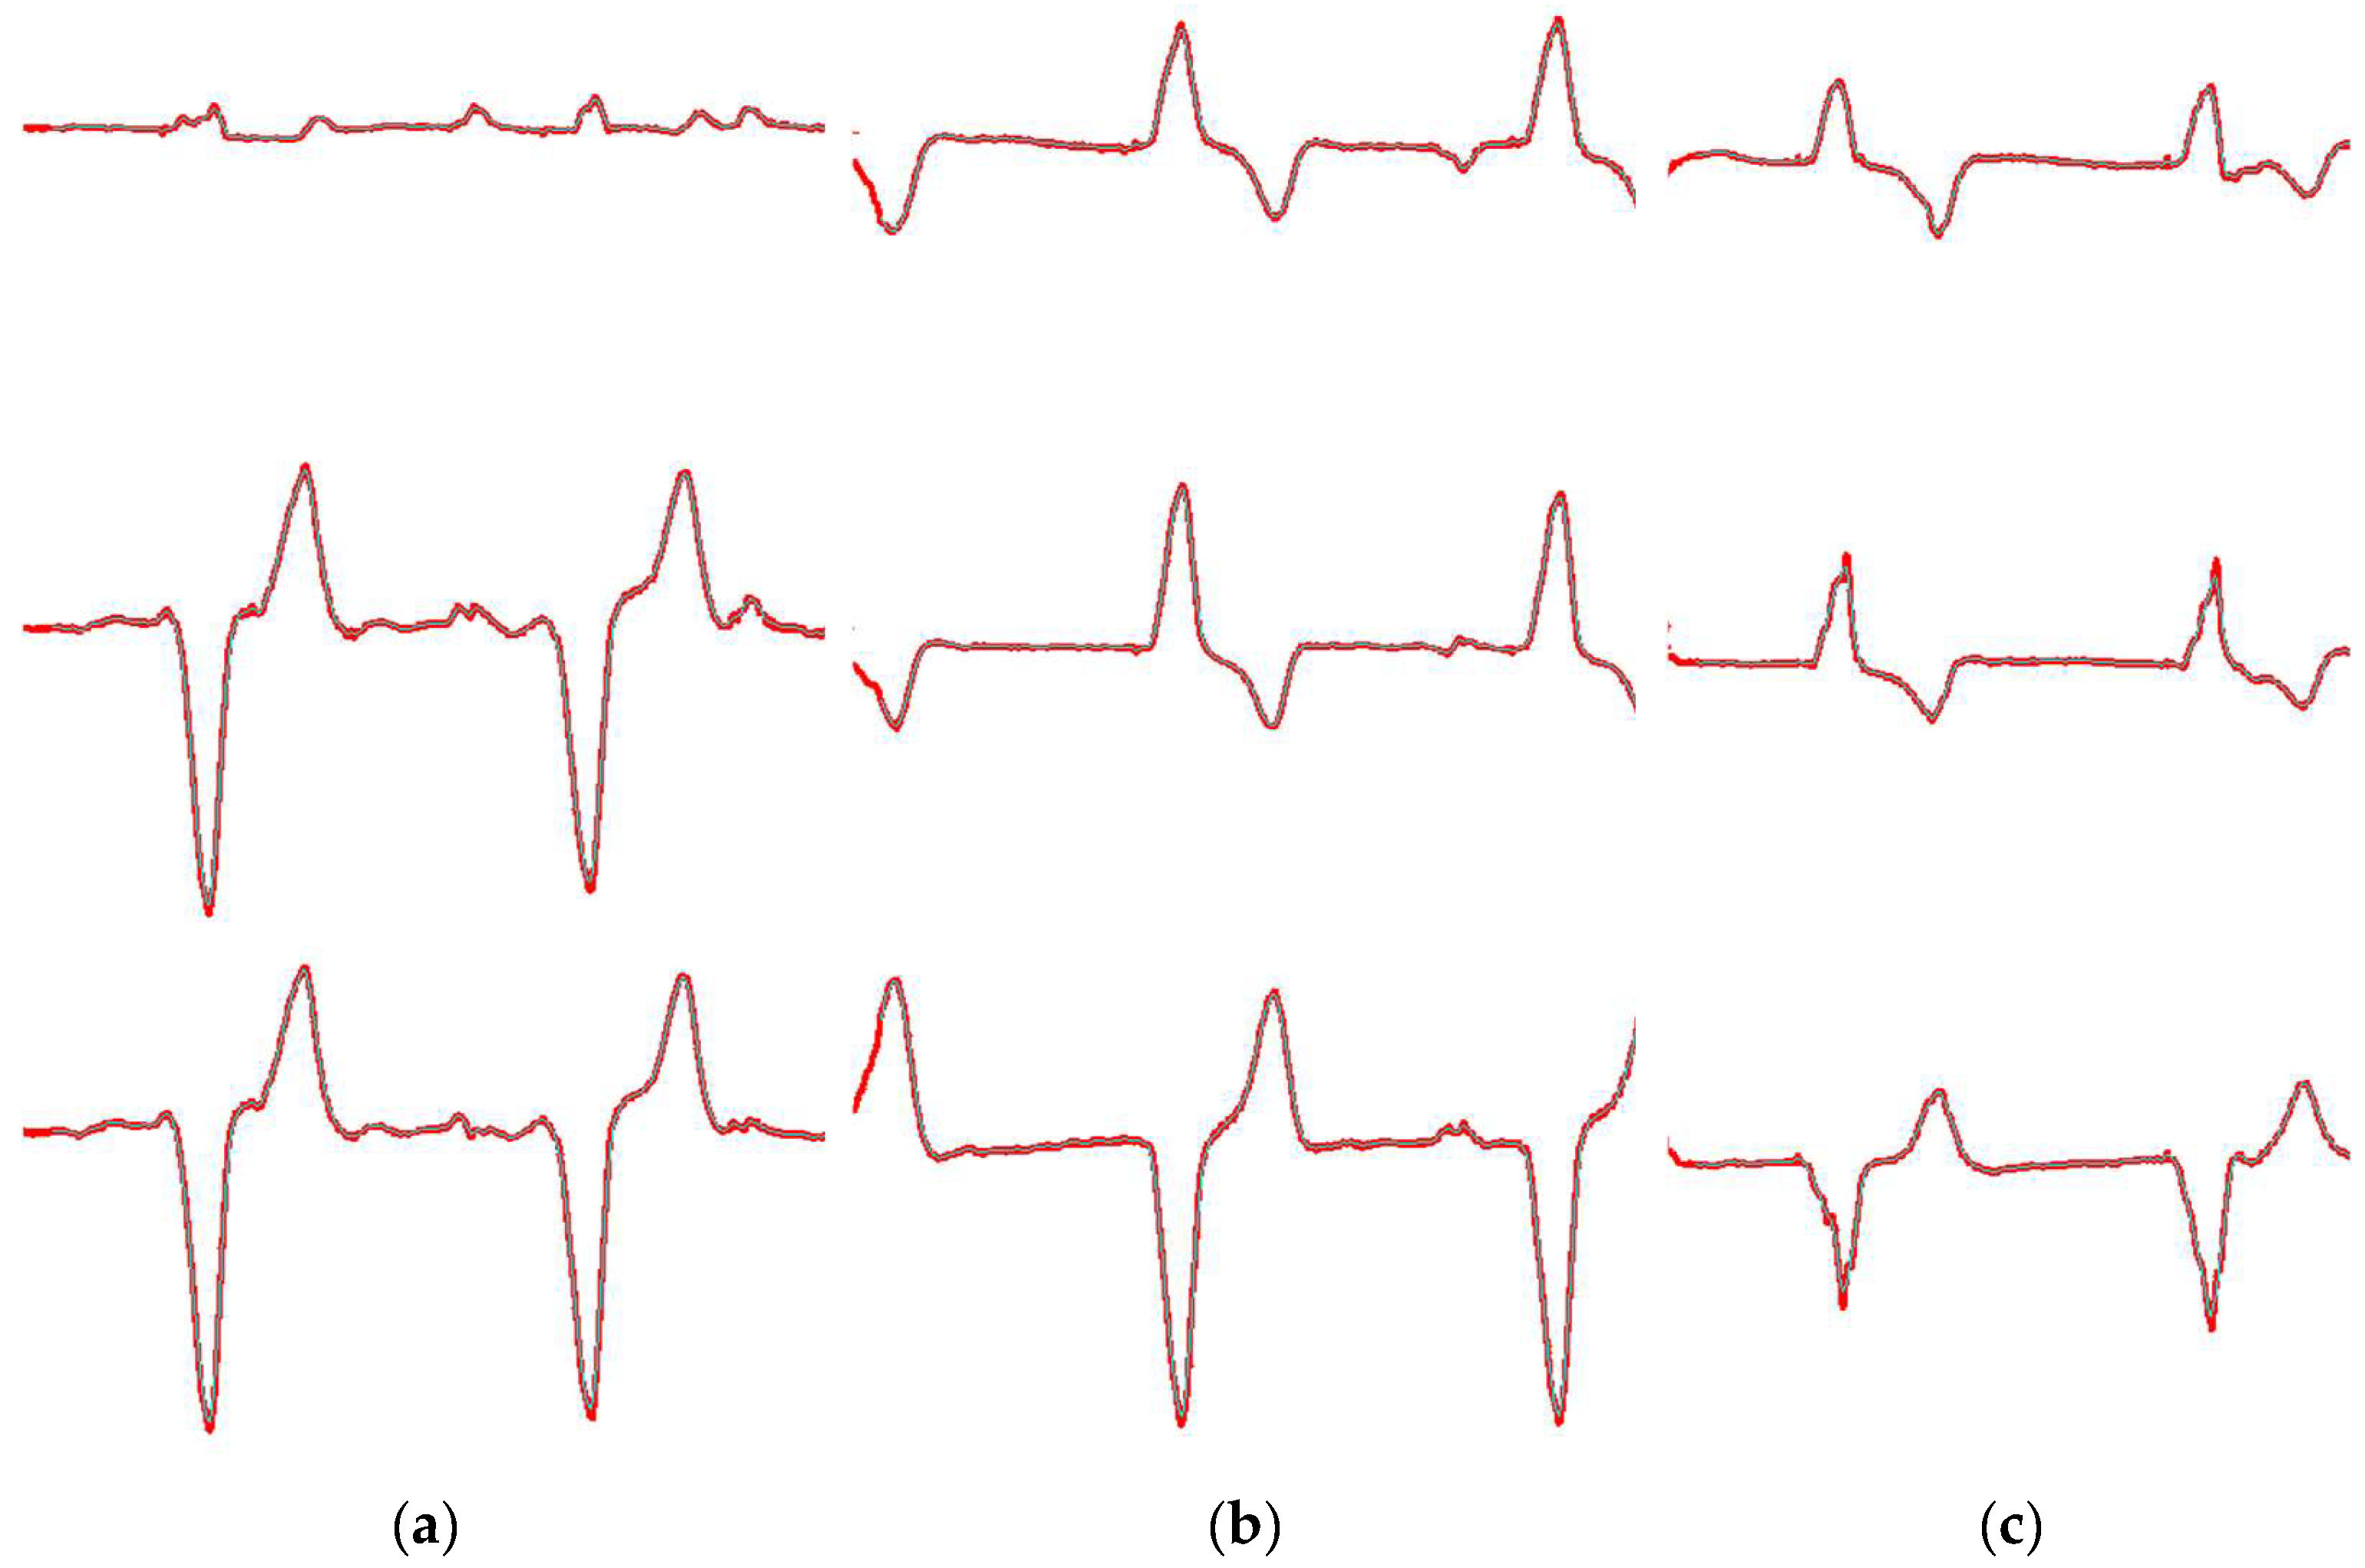
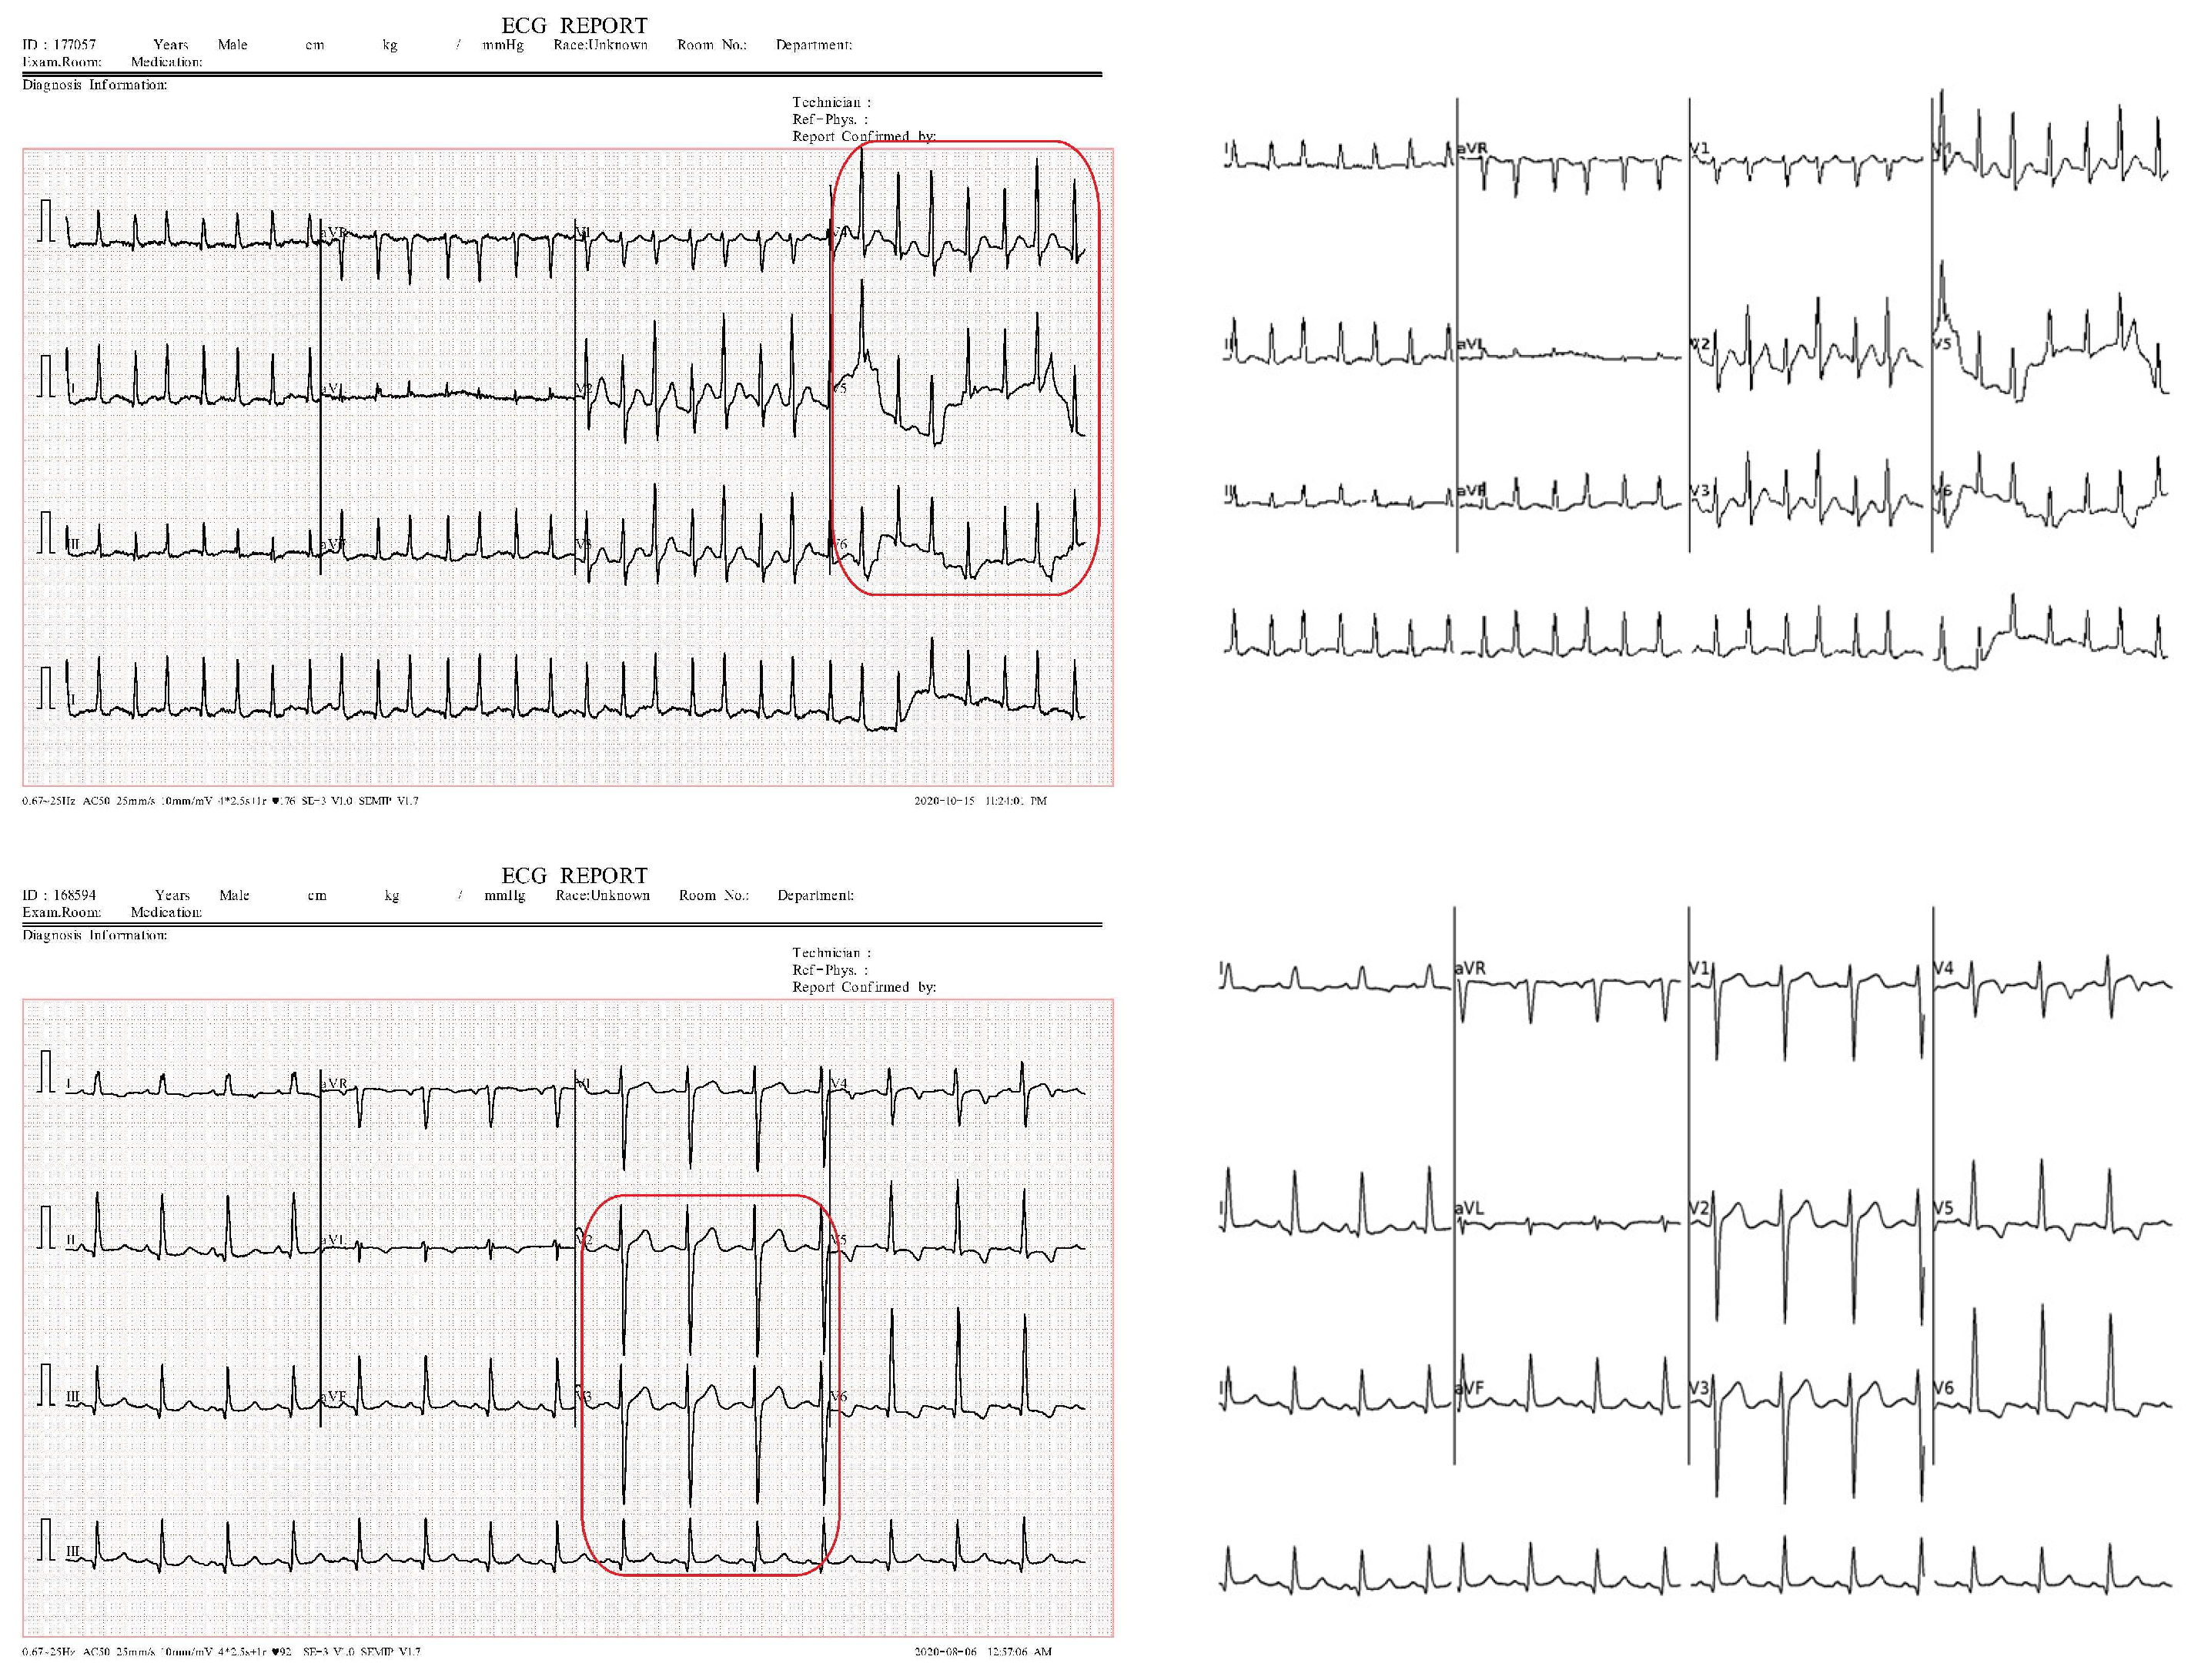
3.1. ECG Signal Segmentation
| Algorithm 1: ECG signal segmentation |
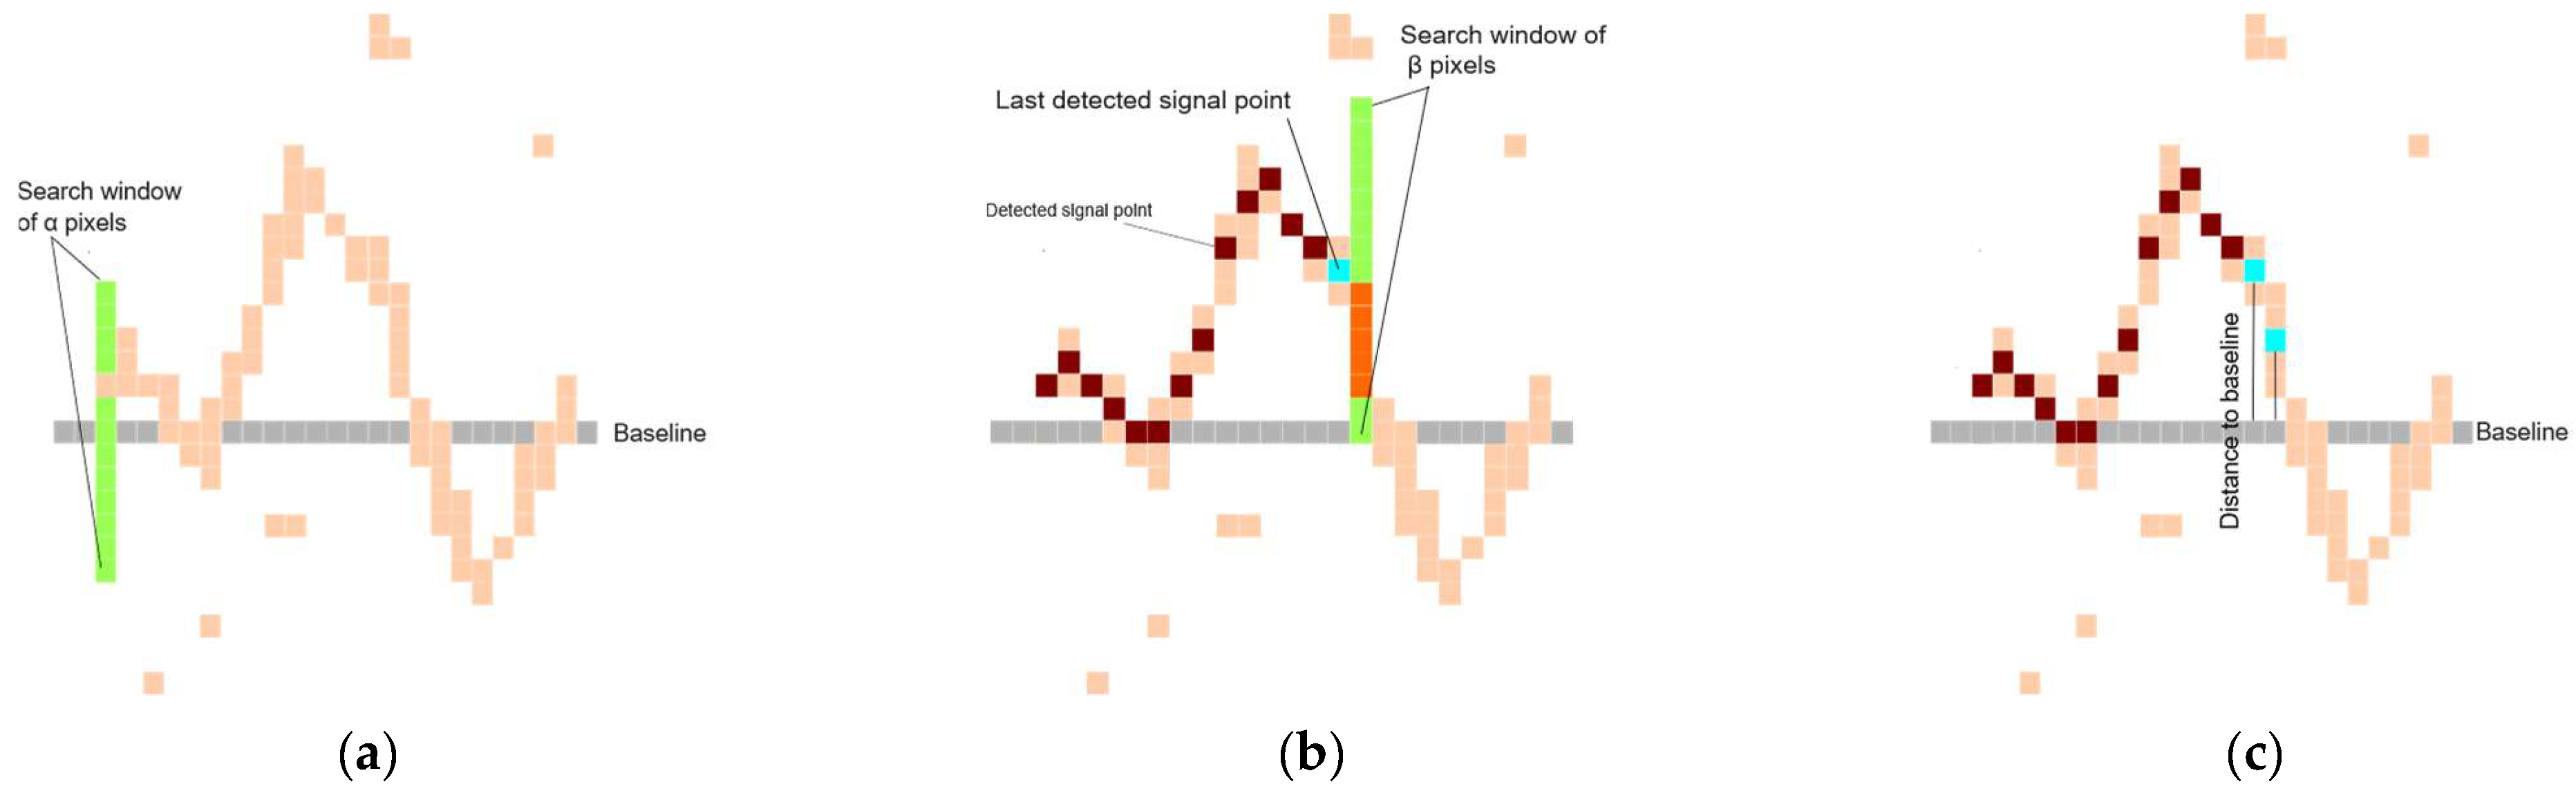
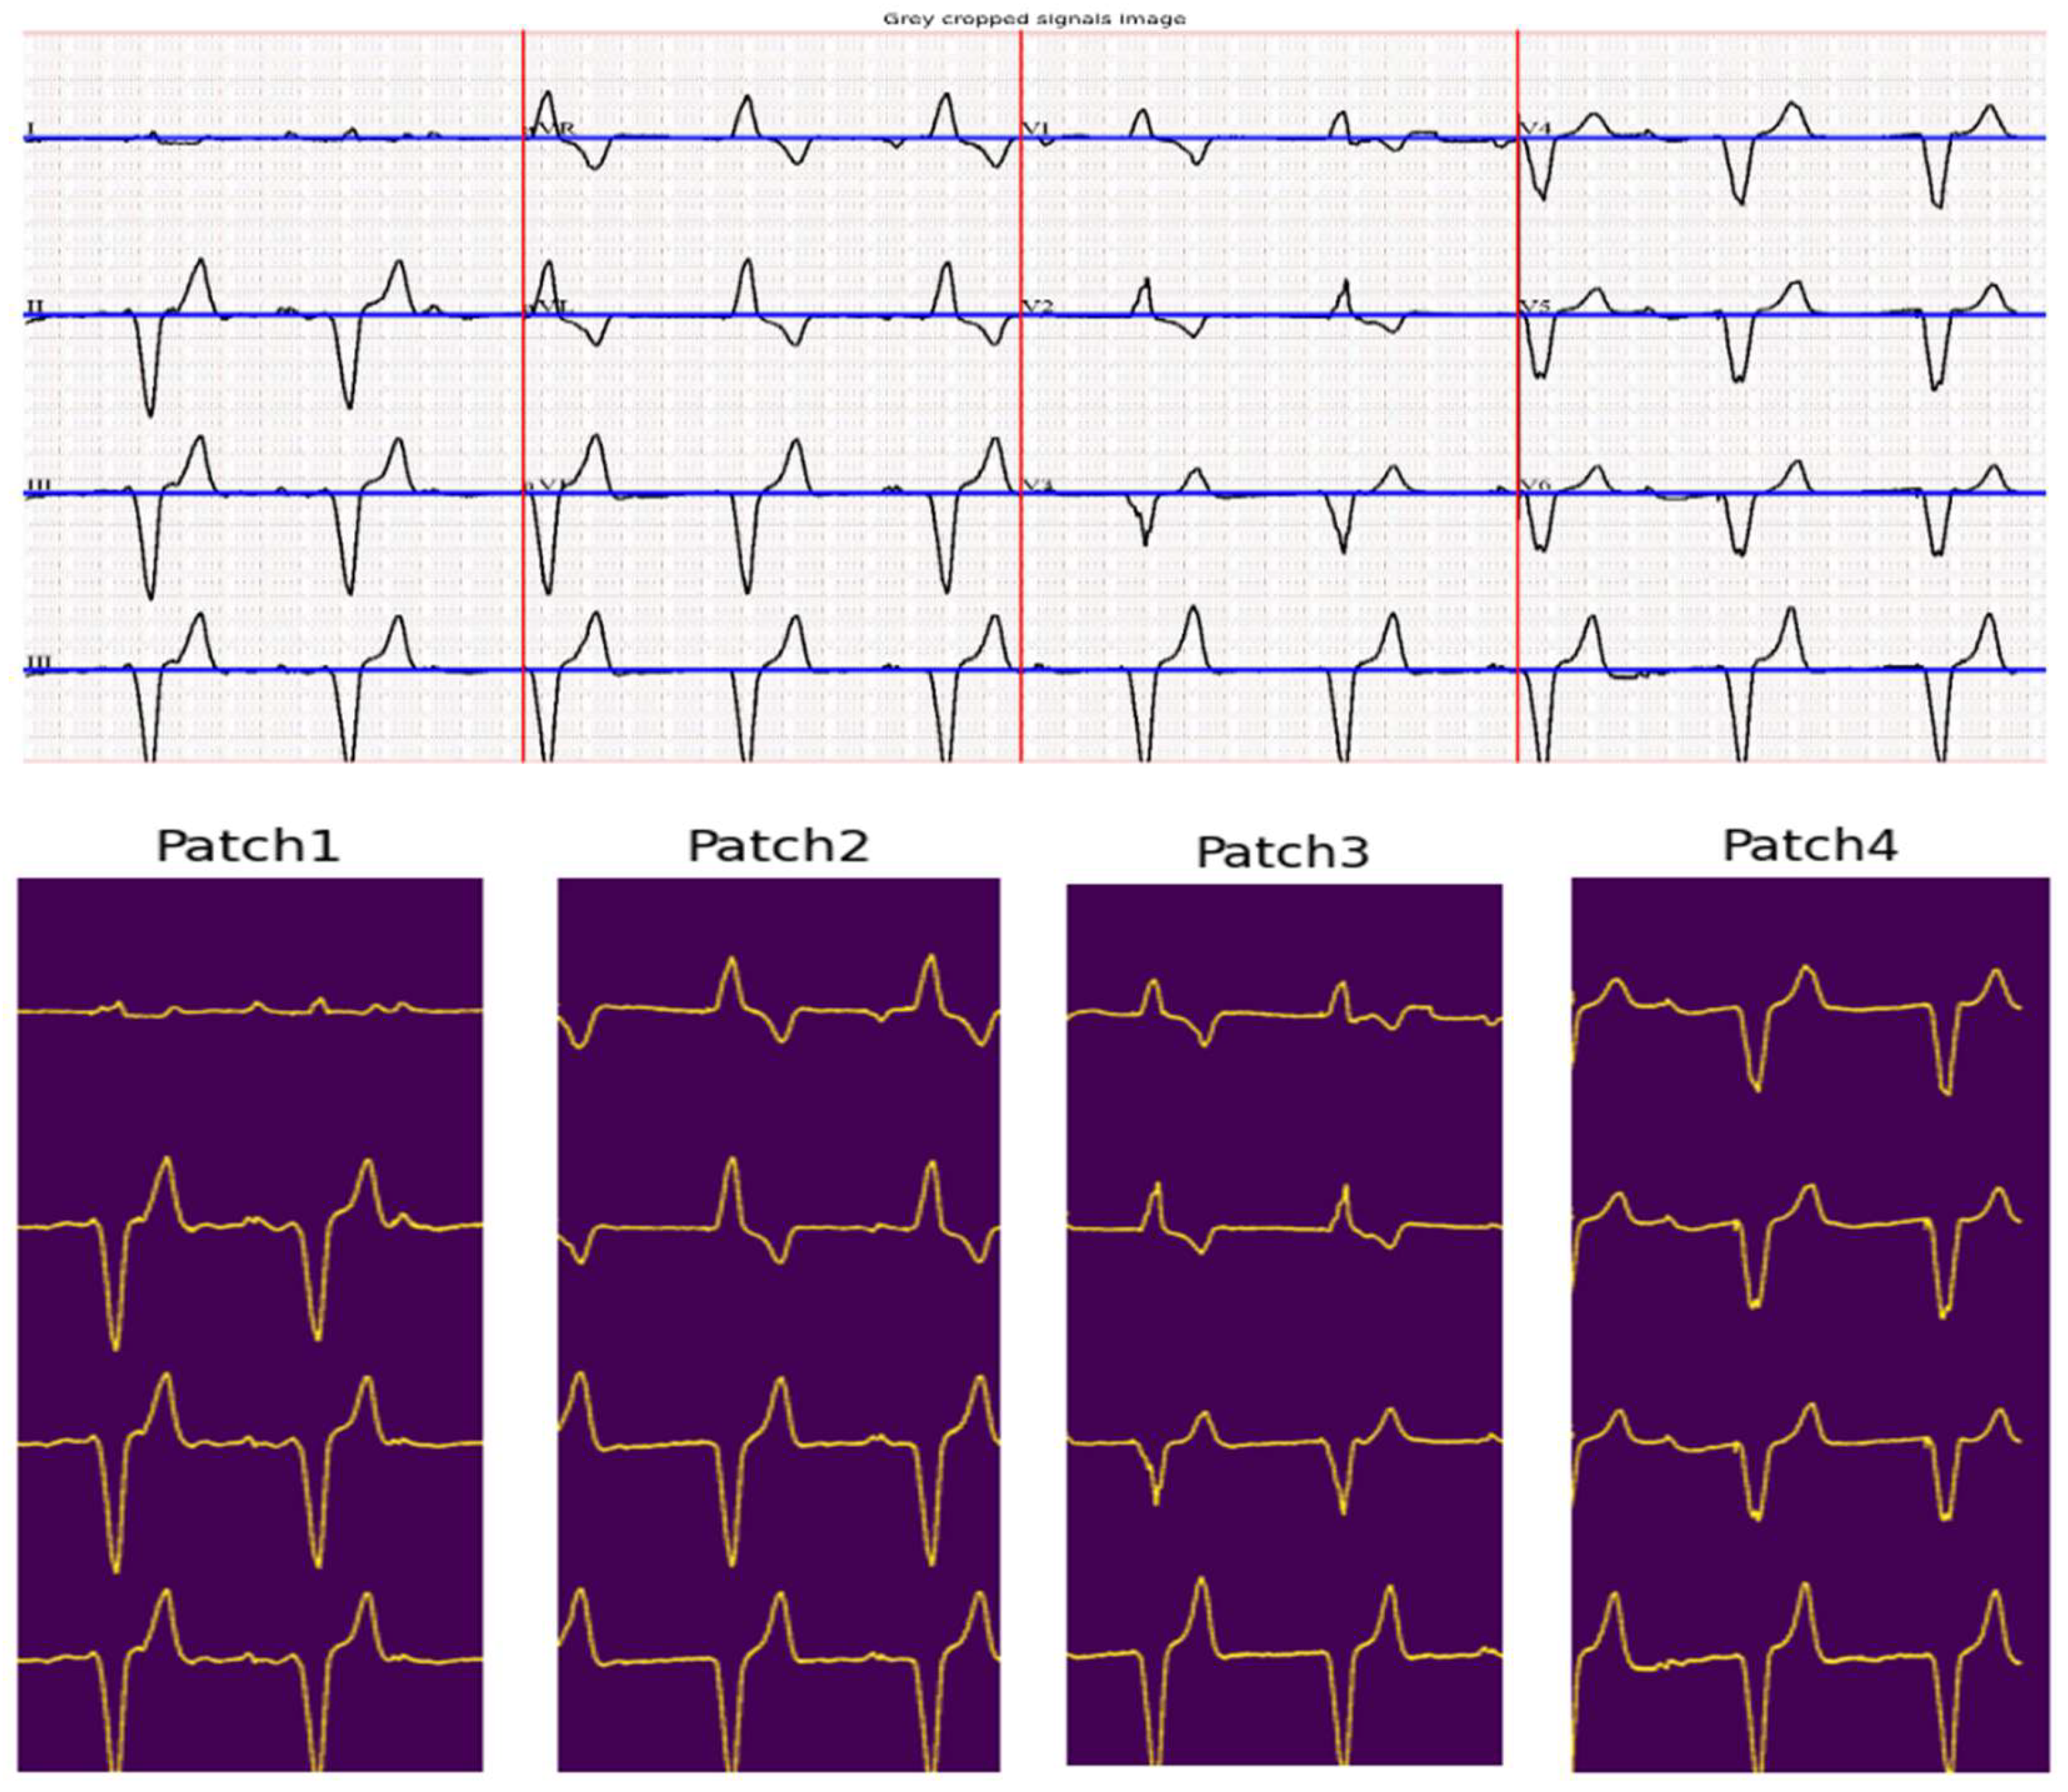
| Input: ECG_Image Output: Segmented_ECG_Leads Parameters: σ ←Gaussian blur parameter α ← Vertical search window size for seed point β ← Vertical search window size for tracking signal γ ← Margin for signal point validation 1. Preprocessing: a. Crop ECG_Image to remove borders and irrelevant regions. Cropped_image ← ECG_Image[280:1520, 150:2150] b. Smooth and reduce noise. Cropped_Image ← GaussianBlur(ECG_Image, σ) 2. Image Binarization: # Binary_Image is obtained by applying Otsu’s thresholding to ECG_Image. a. Binary_Image ← Apply_Otsu_Thresholding(ECG_Image) 3. ECG Lead Separation: a. H_Histogram ← Compute_Horizontal_Histogram(Binary_Image) b. V_Histogram ← Compute_Vertical_Histogram(Binary_Image) c. Identify the top three vertical peaks in V_Histogram to define lead boundaries. V_Peak ← Sort(V_Histogram, reverse=true)[0:3] d. Divide Binary_Image into 4 image patches: # Patches correspond to Leads [1, 5, 9], Leads [2, 6, 10], Leads [3, 7, 11], and Leads [4, 8, 12] Patch_1←Binary_Image[0: Binary_Image.rows, 5:V_peaks[0]-5] Patch_2←Binary_Image[0:Binary_Image.rows,V_peaks[0]+5:V_peaks[1]-5] Patch_3←Binary_Image[0:Binary_Image.rows,V_peaks[1]+5:V_peaks[2]-5] Patch_4←Binary_Image[0:Binary_Image.rows,V_peaks[2]+5:Binary_Image.cols] 4. Signal Extraction: For each Patch in [Patch_1, Patch_2, Patch_3, Patch_4]: a. Identify the top four peaks in H_Histogram Baselines ← Sort(H_Histogram, reverse=true)[0:4] b. For each lead in Patch: i. Seed_Point ← Find_Seed_Point(Baselines[lead], window = α) ii. Signal ← Initialize signal as an empty list iii. Current_Point ← Seed_Point iv. While Current_Point < Patch width: - Next_Window ← Vertical_Search_Window(Current_Point, size = β) - Next_Point ← Track_Signal_Point(Next_Window) # Check for discontinuity - If Discontinuity_Detected(Next_Point): Next_Point←Signal[Signal.length - 1] # Check for multiple point detection - If Thick_Isoelectric_Line_Detected: Next_Point← Estimate_Median_Point(identified points) # Validate the point w.r.t the previously added point - If Validate_Point(Next_Point, Baseline, γ): Signal.append(Next_Point) Current_Point ← Next_Point c. Store Signal in Segmented_ECG_Leads Return Segmented_ECG_Leads |
3.2. Pretrained DL Models
4. Results and Discussion
4.1. Dataset Description
4.2. Evaluation Metrics
- Accuracy: This metric is defined based on the values of true positives (TPs), true negatives (TNs), false negatives (FNs), and false positives (FPs) and is represented by Equation (1).
- Precision: This measure is the ratio of true positives to true and false positives and is shown in Equation (2).
- Recall: This metric is measured as the ratio of correctly identified positive examples to the total number of positive models. Equation (3) shows the recall evaluation measure.
- The F1 score: This measure is a useful metric in ML and DL, which is a combination of two other metrics. Equation (4) shows the F1 score measure evaluation.
4.3. ECG Signal Segmentation Evaluation
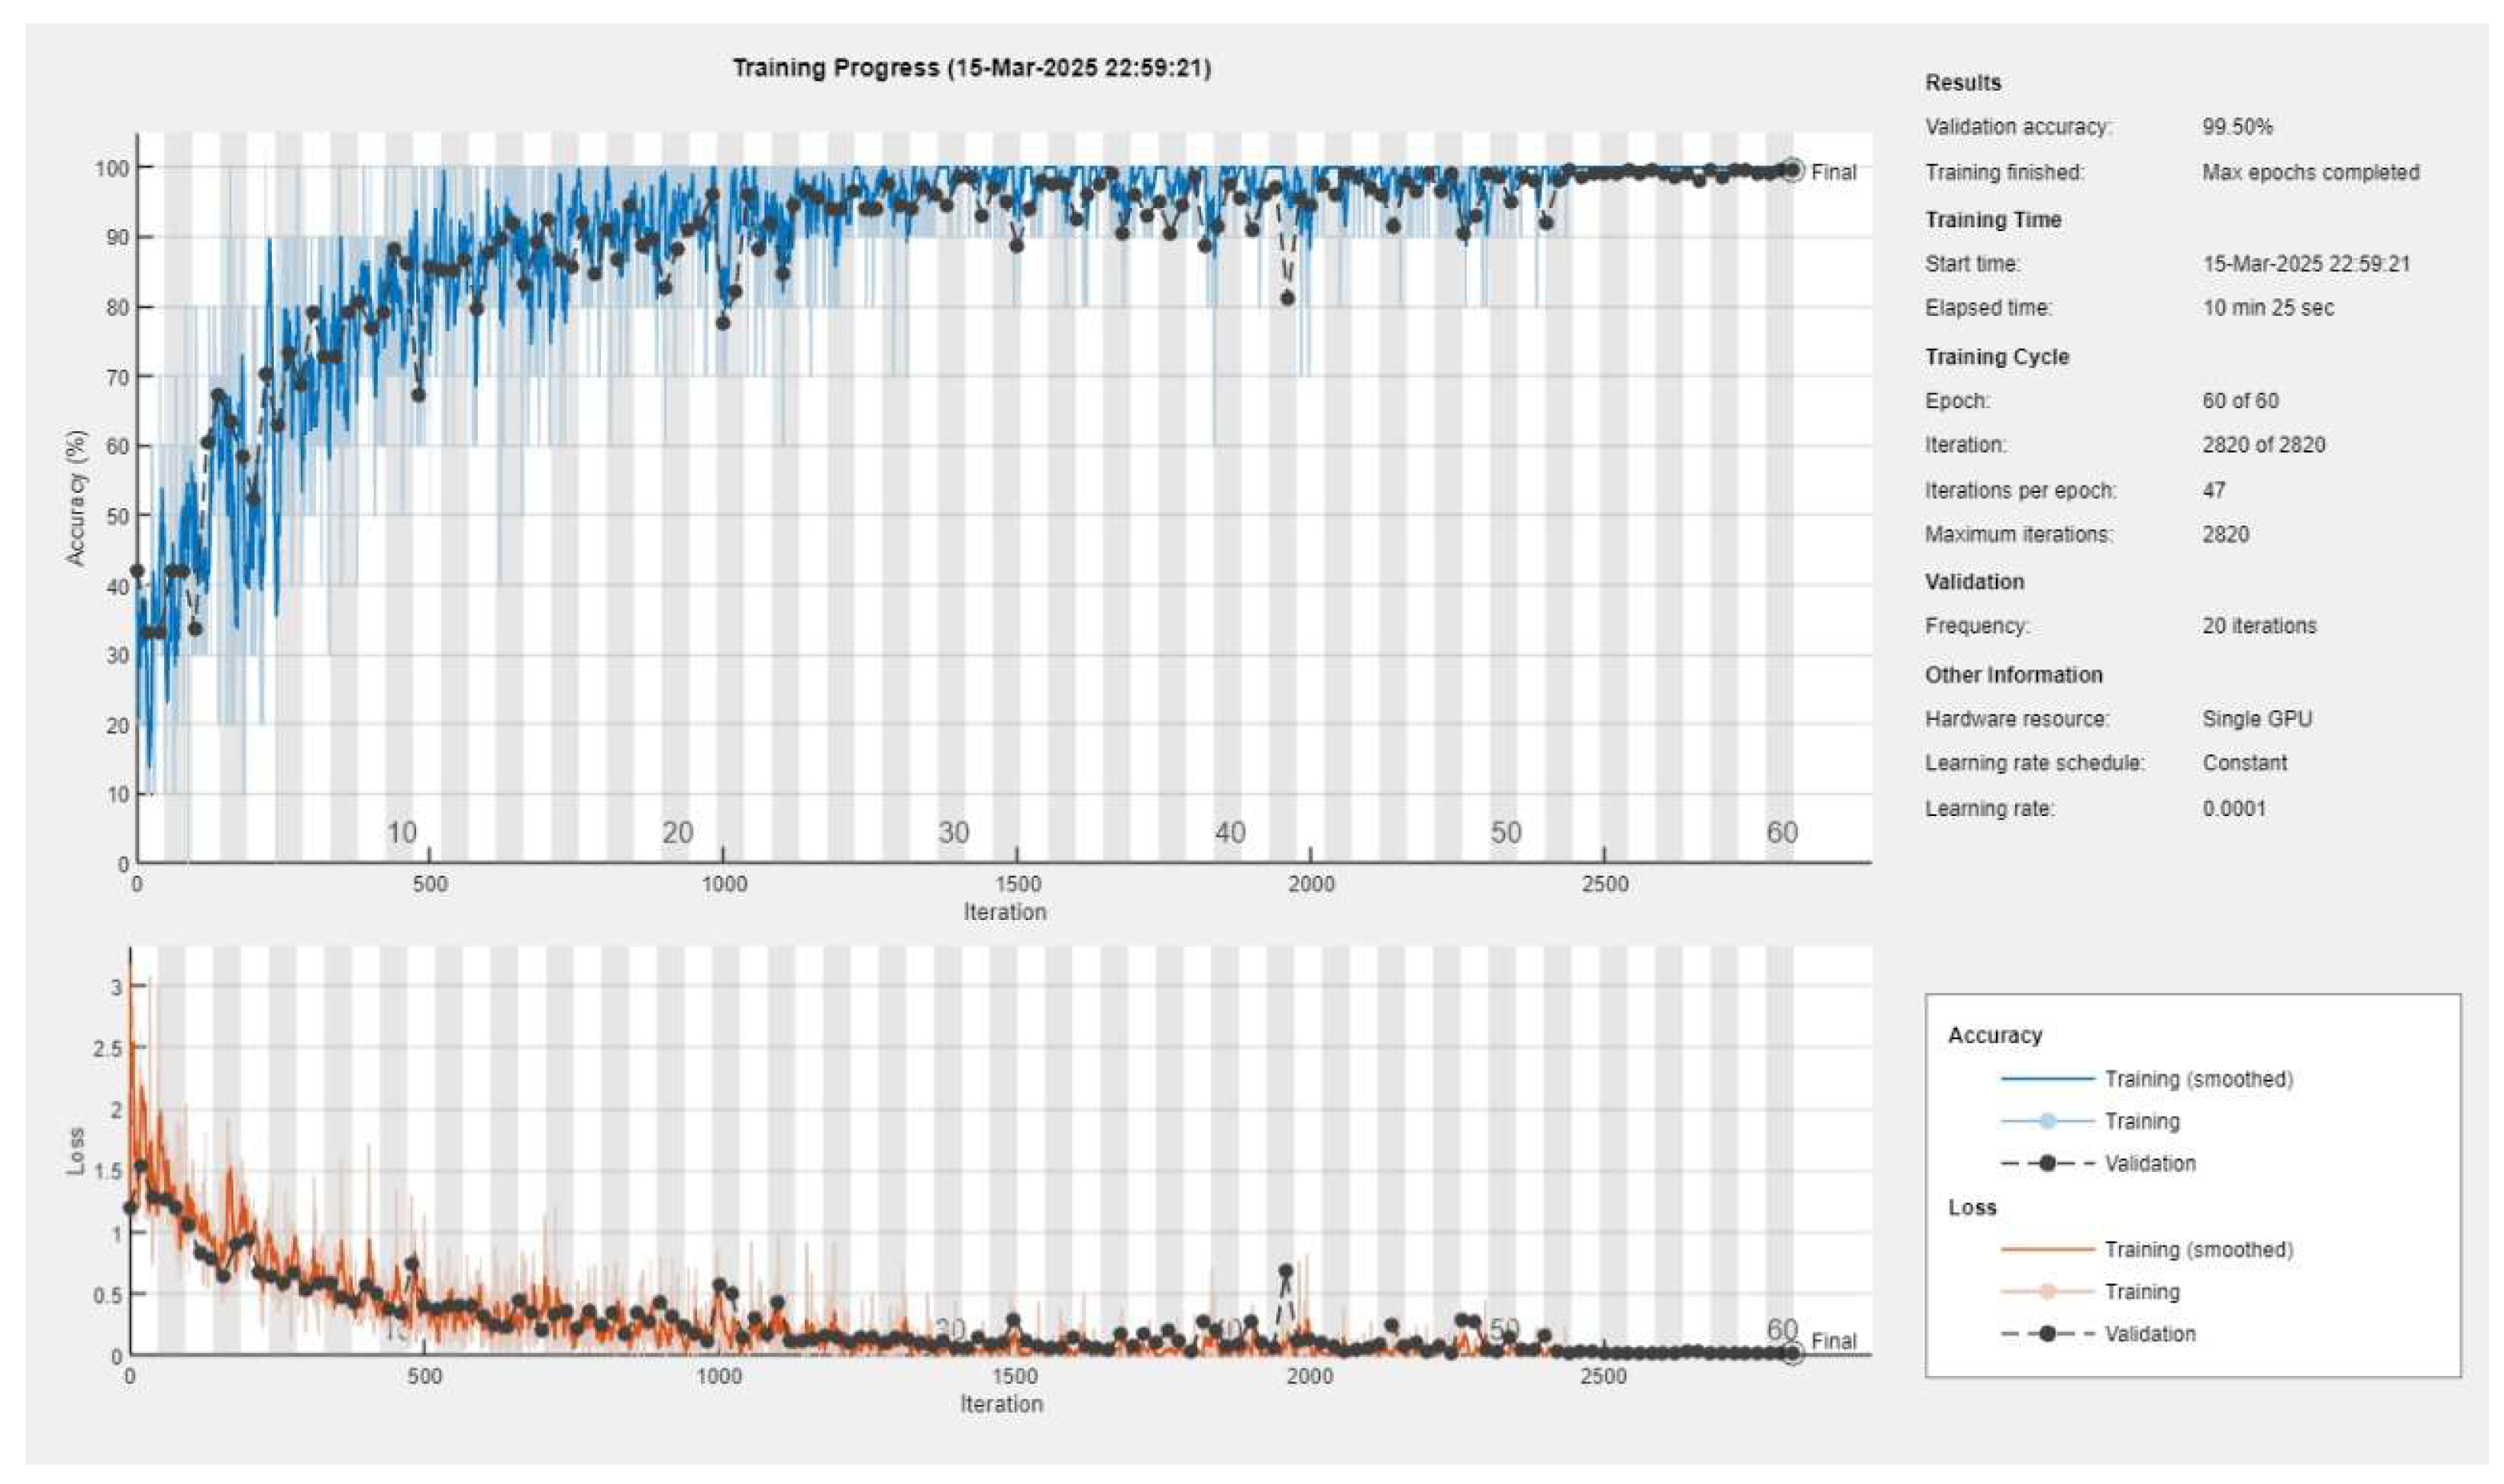
4.4. ECG Signal Classification
4.4.1. Binary Classification Results
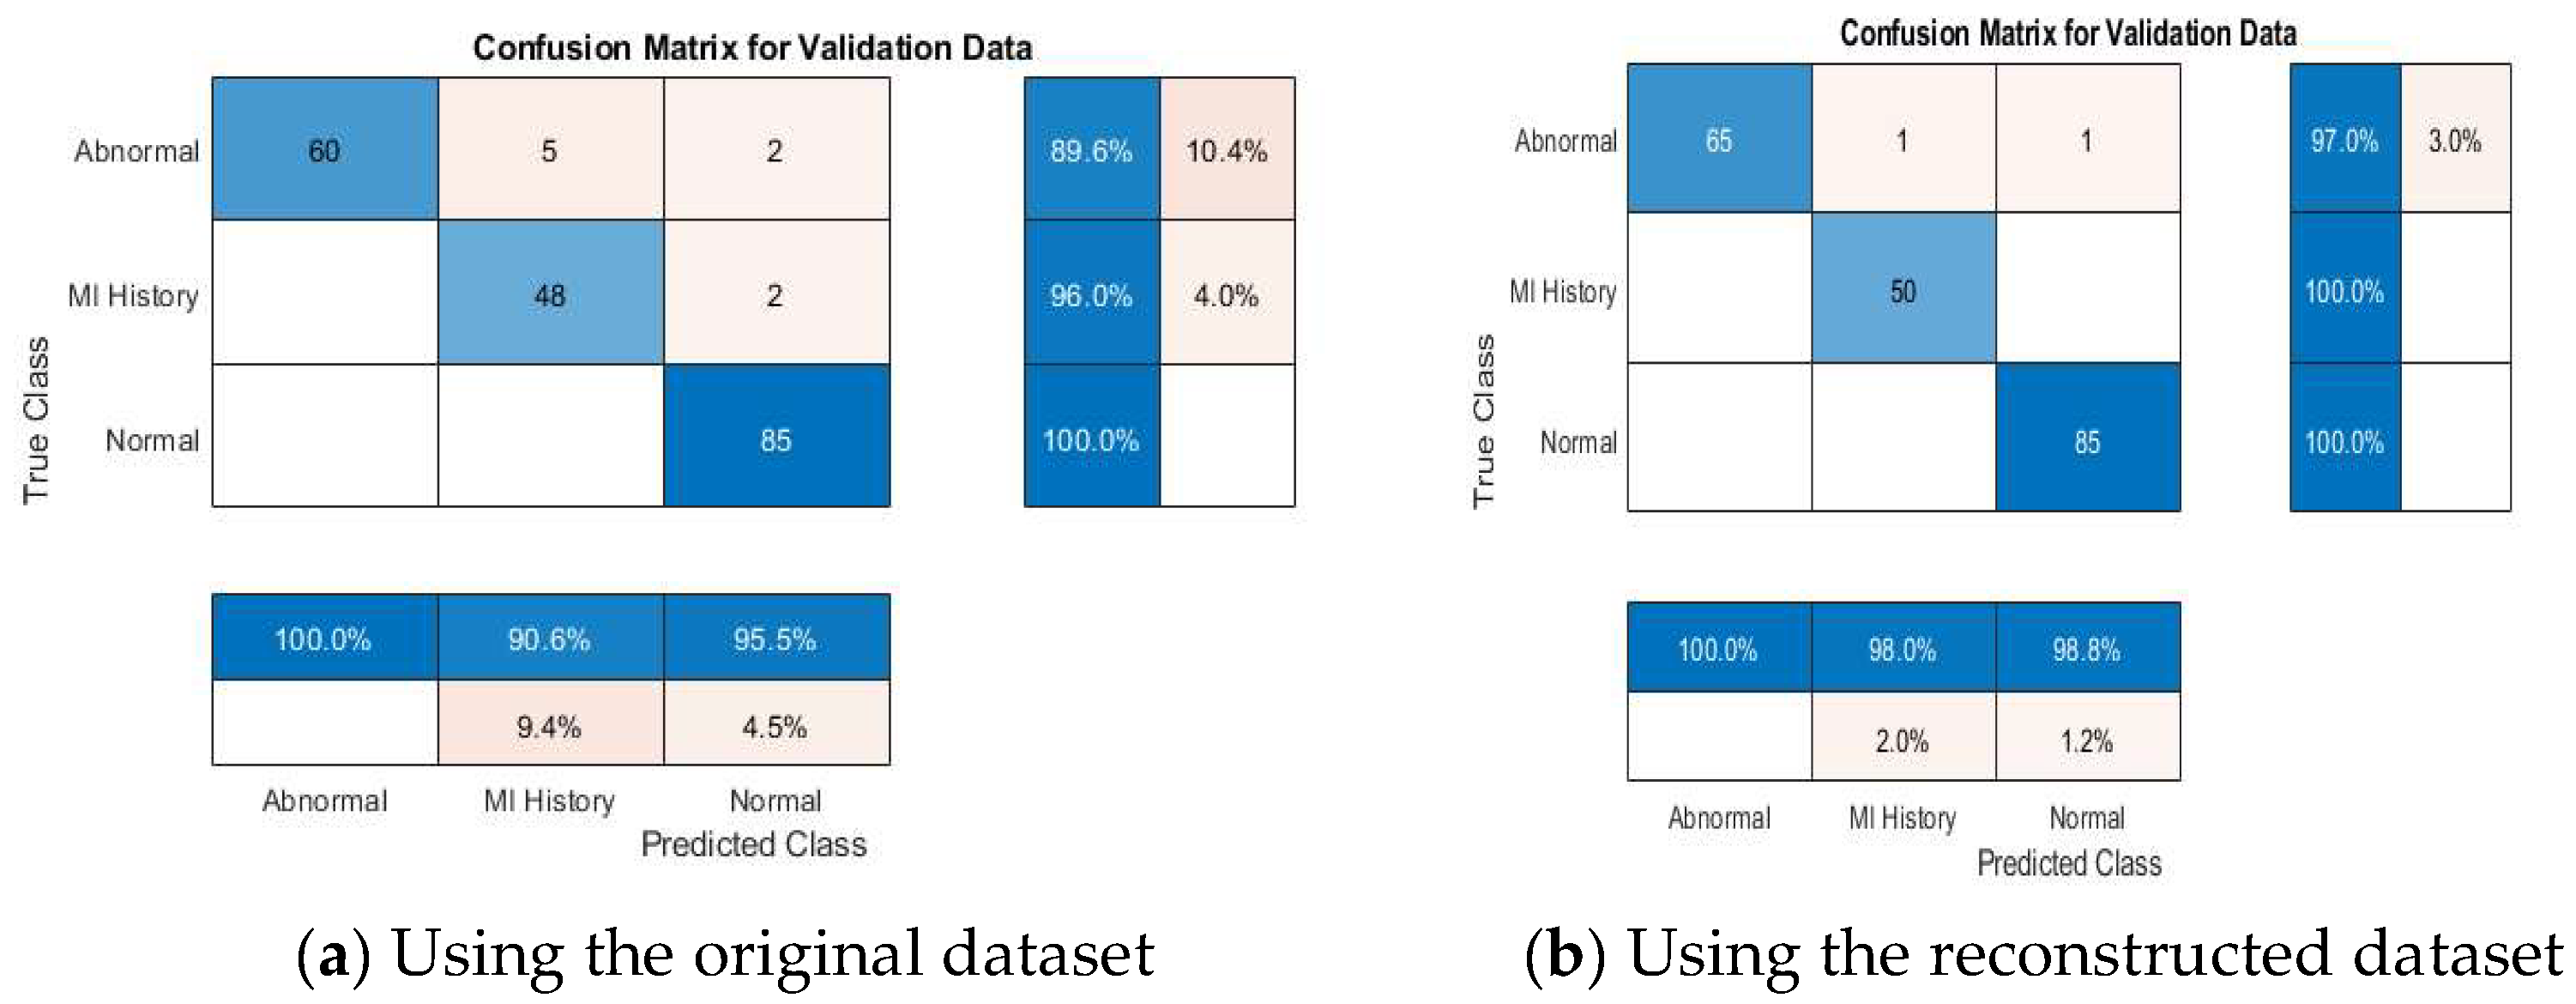
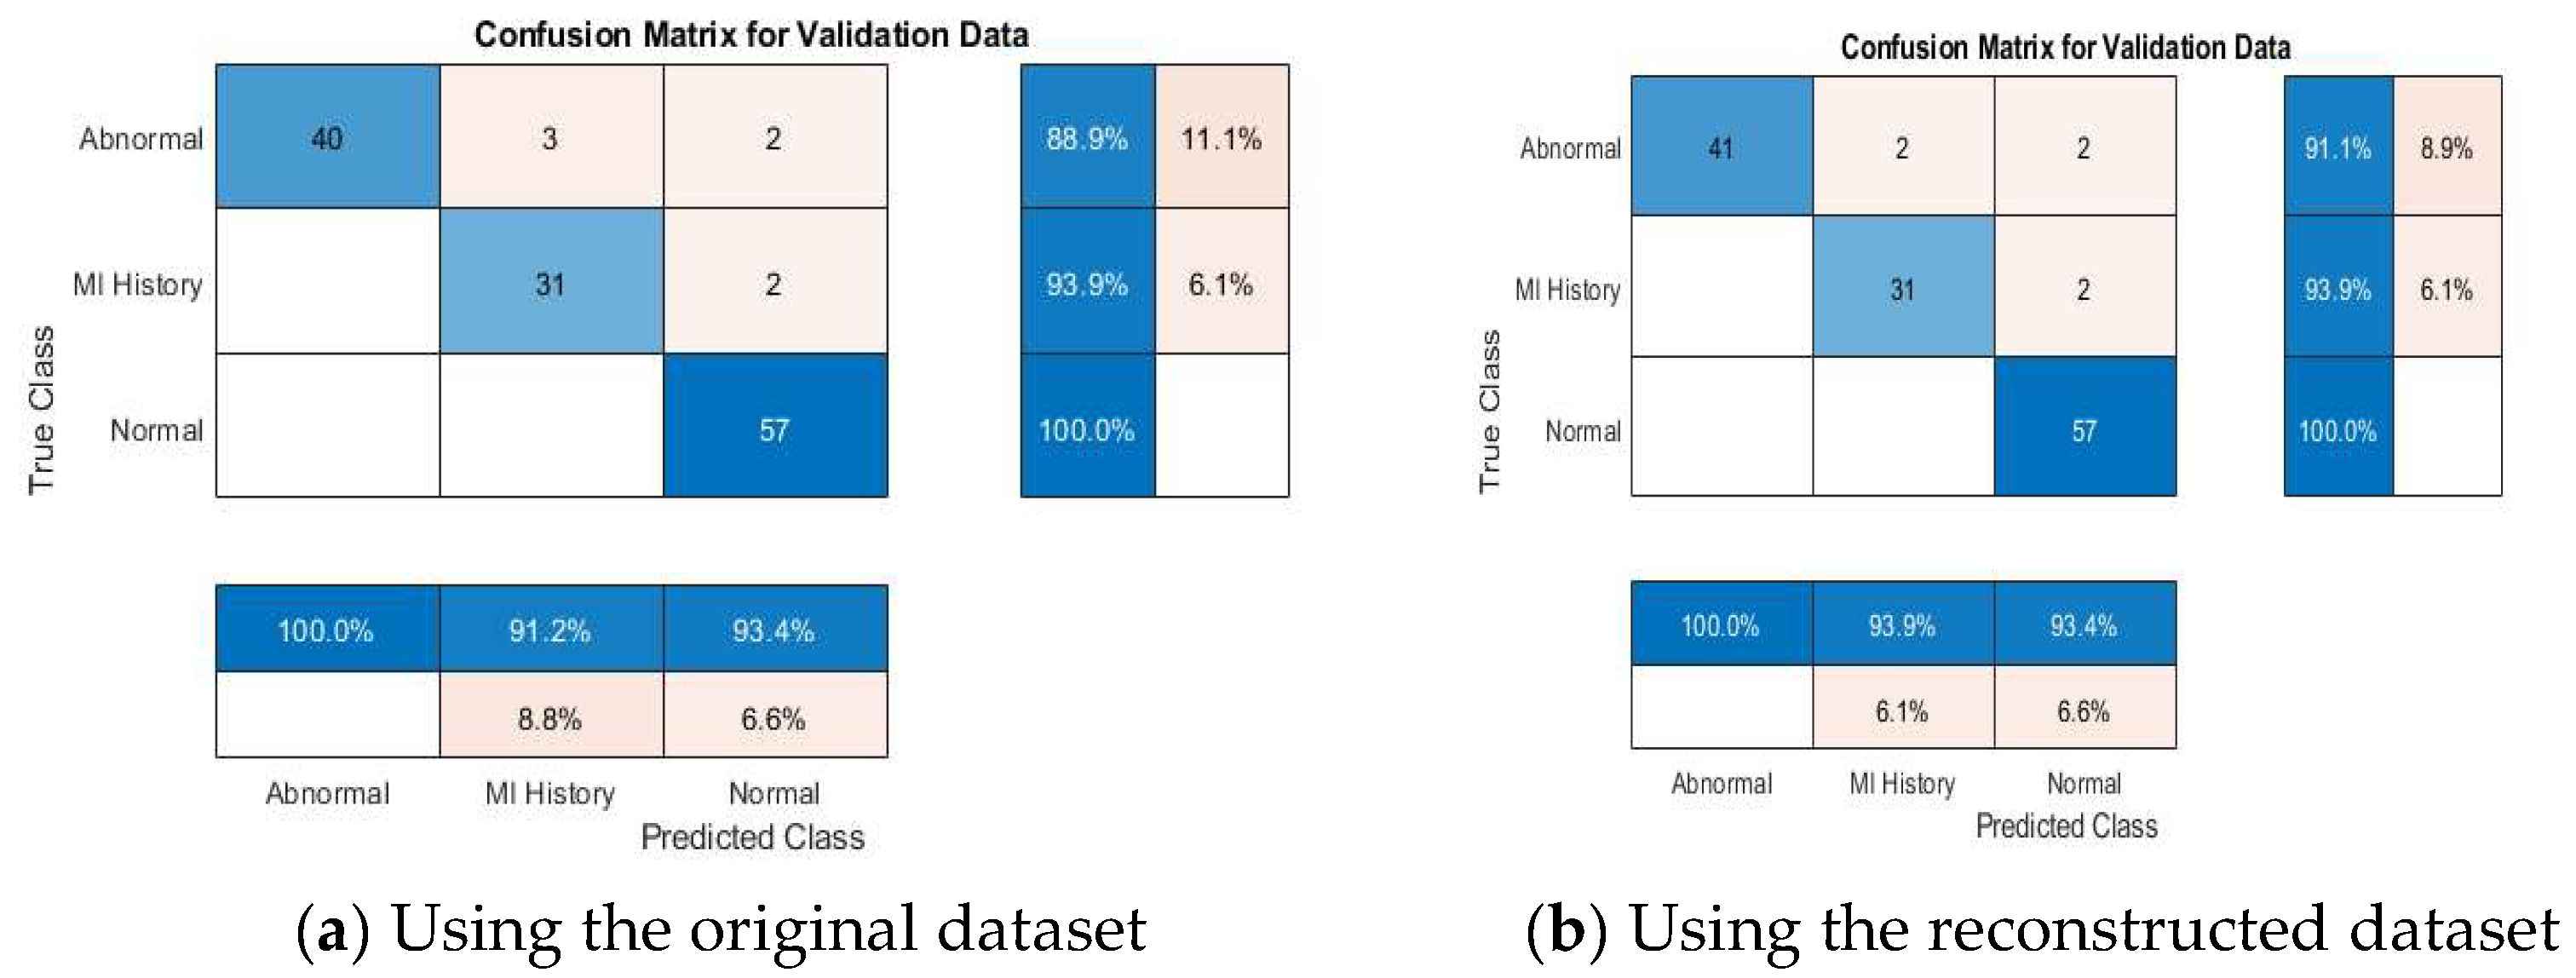
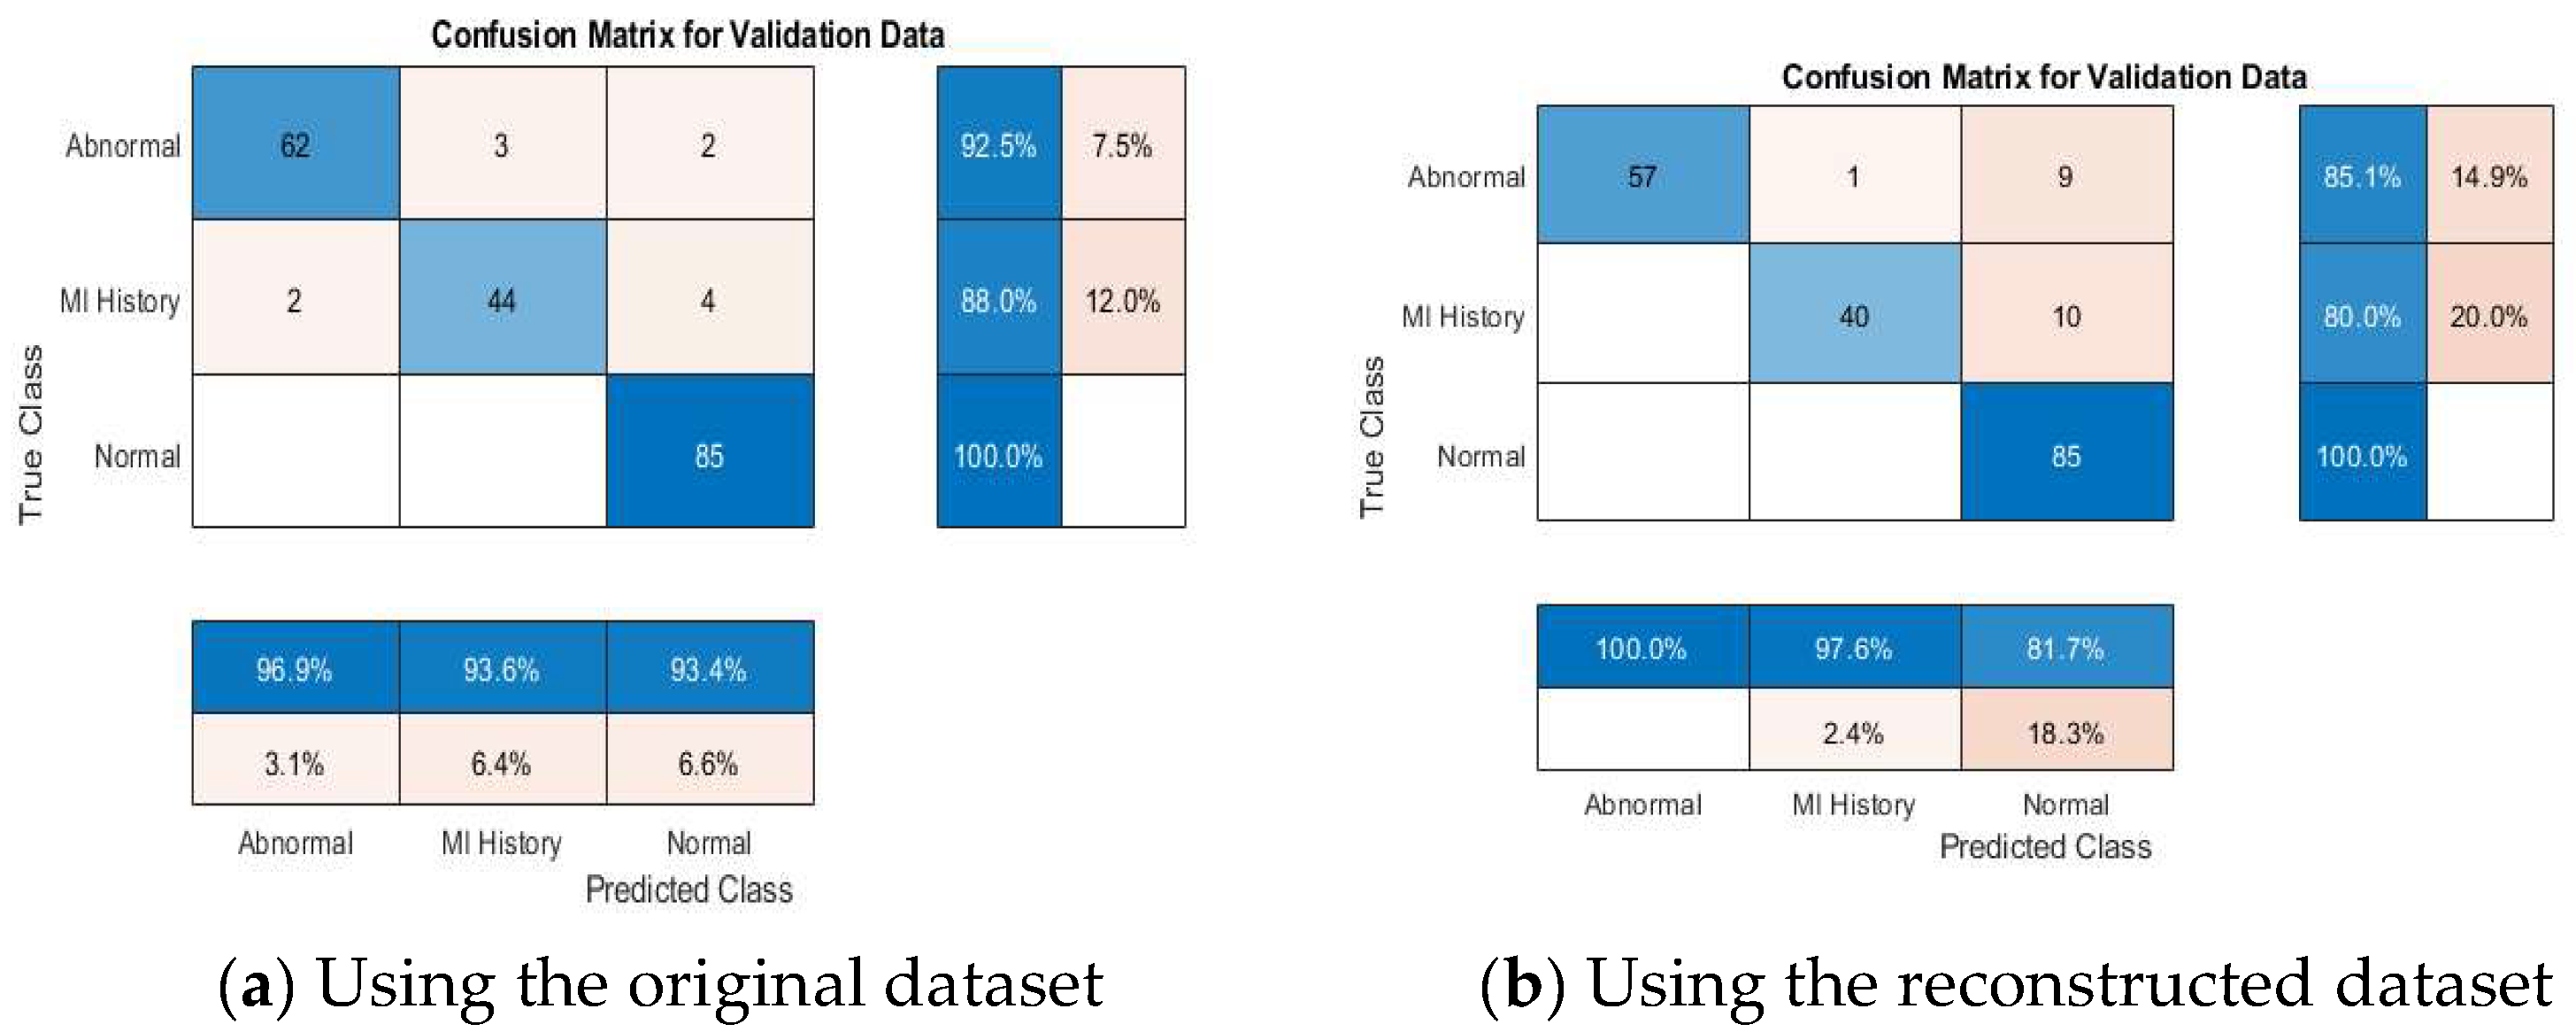
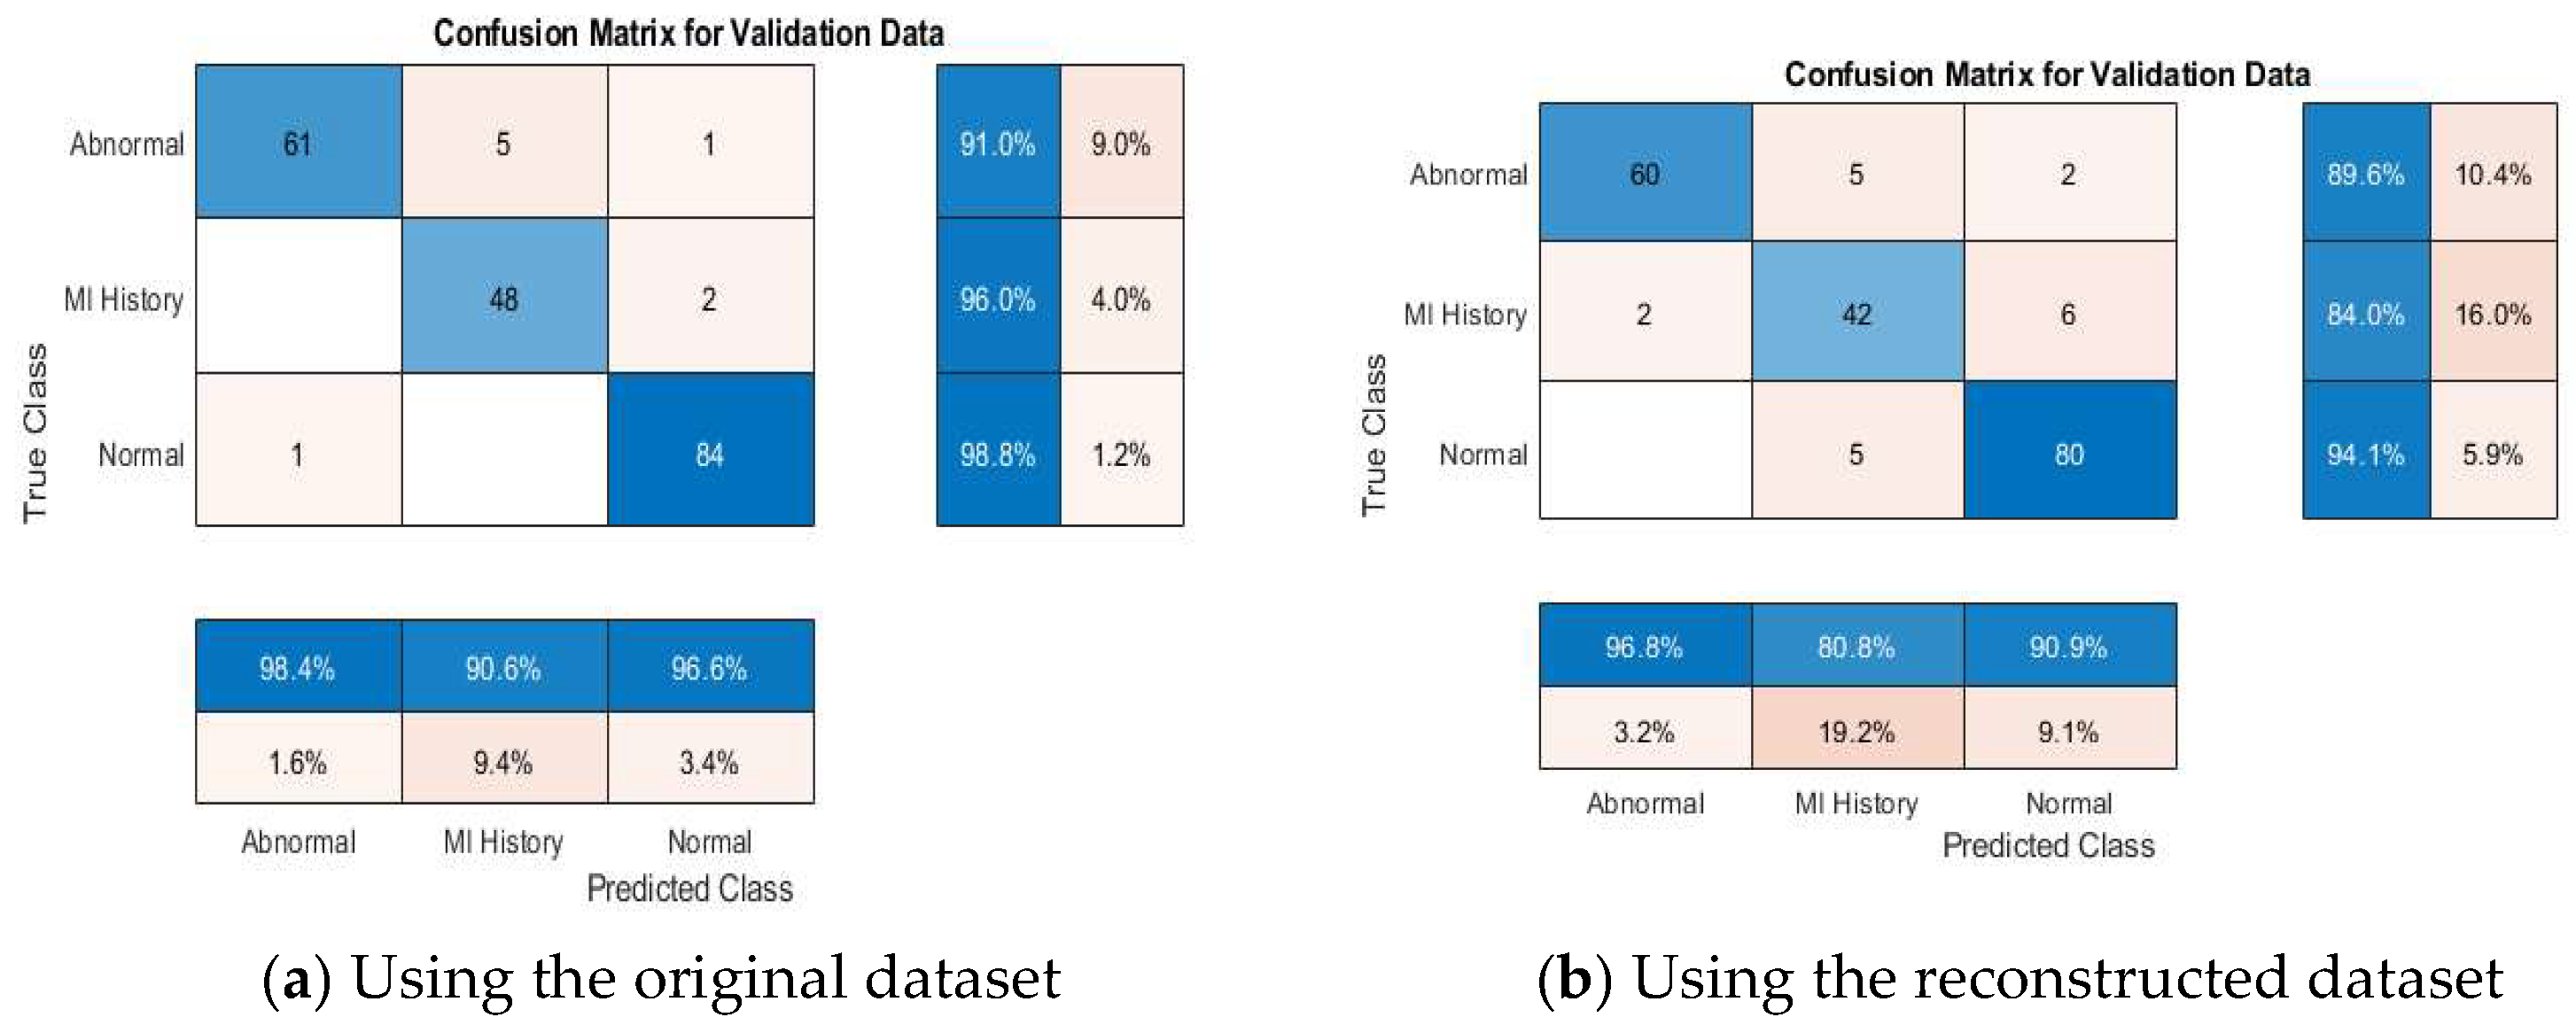
4.4.2. Multi-Class Classification Results
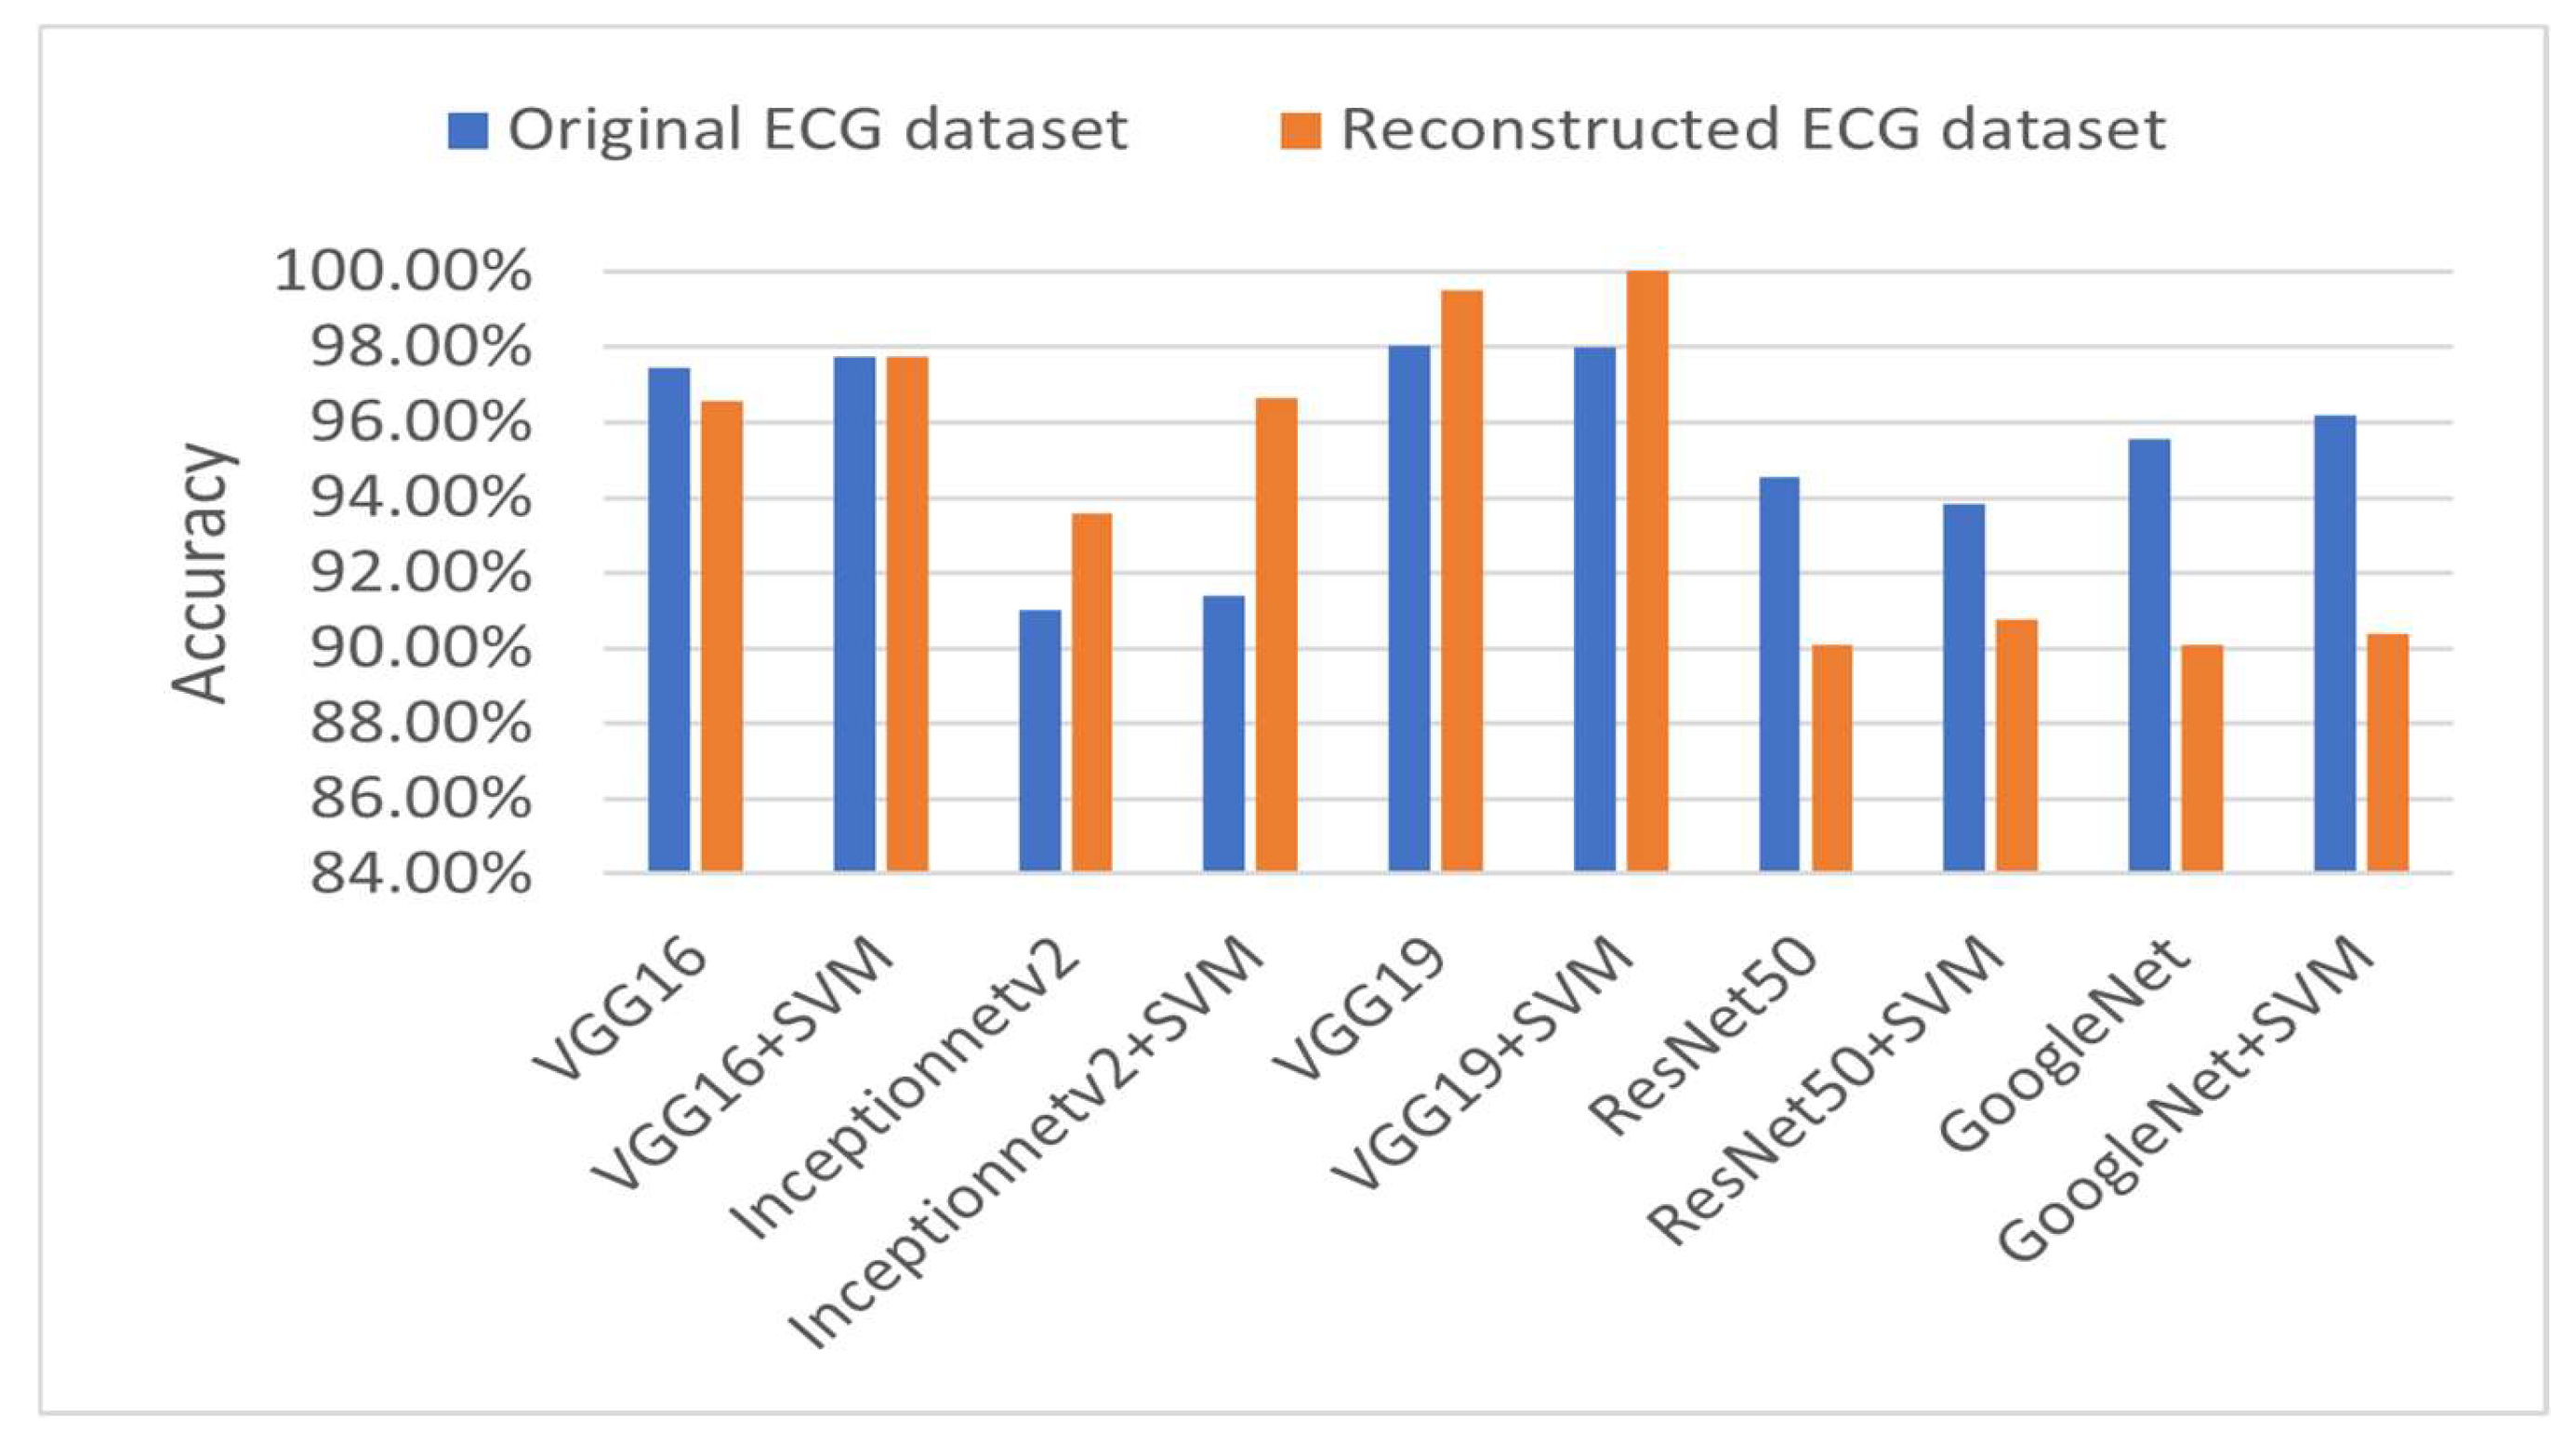
4.4.3. Comparative Performance Evaluation with Recent Related Work
| Reference | Model Used | Average Accuracy | |||
|---|---|---|---|---|---|
| Binary Classification | Multi-Class Classification | ||||
| Normal vs. Abnormal | Normal vs. MI | Abnormal vs. MI | |||
| [18] | InceptionV3 + GNB | - | - | - | 92.91% |
| ResNet50 + RF | - | - | - | 92.19% | |
| DenseNet169 + RF | - | - | - | 92.55% | |
| lightweight CNN | - | - | - | 98.93% | |
| [13] | SSDMobileNetV2 | 97.25% | 100% | 96.3% | 98.33% |
| [37] | MobileNetV2 | - | - | - | 95% |
| VGG16 | - | - | - | 95% | |
| [38] | ANNs | 92.39% | 98.26% | - | 89.58% |
| [39] | InceptionV3 | - | - | - | 90.56% |
| ResNet50 | - | - | - | 89.63% | |
| MobileNetV2 | - | - | - | 80.56% | |
| VGG19 | - | - | - | 87.87% | |
| DenseNet201 | - | - | - | 88.94% | |
| Proposed (using reconstructed ECG dataset) | VGG16 | 98.08% | 100% | 97.46% | 96.58% |
| VGG16 + SVM | 98.08% | 100% | 97.76% | 97.76% | |
| InceptionNetv2 | 93.14% | 100% | 88.46% | 95.56% | |
| InceptionNetv2 + SVM | 96.67% | 98.25% | 93.33% | 95.76% | |
| VGG19 | 98.03% | 100% | 98.29% | 99.51% | |
| VGG19 + SVM | 97.33% | 100% | 98.51% | 100% | |
| ResNet50 | 96.05% | 88.99% | 92.31% | 90.10% | |
| ResNet50 + SVM | 95.52% | 91.29% | 91.76% | 90.77% | |
| GoogleNet | 95.39% | 96.30% | 94.87% | 90.10% | |
| GoogleNet + SVM | 95.41% | 94.82% | 97.01% | 90.40% | |
4.4.4. Discussion About the Achieved Results
5. Conclusions
Author Contributions
Funding
Institutional Review Board Statement
Informed Consent Statement
Data Availability Statement
Conflicts of Interest
References
- Savarese, G.; Becher, P.M.; Lund, L.H.; Seferovic, P.; Rosano, G.M.C.; Coats, A.J.S. Global burden of heart failure: A comprehensive and updated review of epidemiology. Cardiovasc. Res. 2023, 118, 3272–3287. [Google Scholar] [CrossRef] [PubMed]
- Schläpfer, J.; Wellens, H.J. Computer-Interpreted Electrocardiograms. J. Am. Coll. Cardiol. 2017, 70, 1183–1192. [Google Scholar] [CrossRef] [PubMed]
- Yu, C.W.; Hong, S.J.; Kim, E.J.; Kim, Y.H.; Moon, J.; Kim, J.-H.; Cha, J.-J.; Joo, H.J. Deep learning model for identifying acute heart failure patients using electrocardiography in the emergency room. Eur. Heart J. Acute Cardiovasc. Care 2025, 14, 74–82. [Google Scholar] [CrossRef]
- Nanda, A.; Im, W.; Choi, K.-S.; Yang, H.S. Combined center dispersion loss function for deep facial expression recognition. Pattern Recognit. Lett. 2021, 141, 8–15. [Google Scholar] [CrossRef]
- Xia, Y.; Wulan, N.; Wang, K.; Zhang, H. Detecting atrial fibrillation by deep convolutional neural networks. Comput. Biol. Med. 2018, 93, 84–92. [Google Scholar] [CrossRef]
- Acharya, U.R.; Oh, S.L.; Hagiwara, Y.; Tan, J.H.; Adam, M.; Gertych, A.; San Tan, R. A deep convolutional neural network model to classify heartbeats. Comput. Biol. Med. 2017, 89, 389–396. [Google Scholar] [CrossRef]
- Sadad, T.; Safran, M.; Khan, I.; Alfarhood, S.; Khan, R.; Ashraf, I. Efficient Classification of ECG Images Using a Lightweight CNN with Attention Module and IoT. Sensors 2023, 23, 7697. [Google Scholar] [CrossRef]
- Kurian, T.; Thangam, S. Deep Convolution Neural Network-Based Classification and Diagnosis of Heart Disease using ElectroCardioGram (ECG) Images. In Proceedings of the 2023 IEEE 8th International Conference for Convergence in Technology (I2CT), Lonavla, India, 7–9 April 2023; IEEE: Piscataway, NJ, USA; pp. 1–6. [Google Scholar] [CrossRef]
- Khorsheed, M.S.; Karim, A.A. Enhancing Diagnostics: A Novel CNN-Based Method for Categorizing ECG Images with Attention Mechanism and Enhanced Data Augmentation. Ing. Des Syst. d’Information 2024, 29, 2011–2020. [Google Scholar] [CrossRef]
- Liu, Y.; Li, D.; Zhao, J.; Liang, Y. Enhancing heart failure diagnosis through multi-modal data integration and deep learning. Multimed. Tools Appl. 2023, 83, 55259–55281. [Google Scholar] [CrossRef]
- Alsayat, A.; Mahmoud, A.A.; Alanazi, S.; Mostafa, A.M.; Alshammari, N.; Alrowaily, M.A.; Shabana, H.; Ezz, M. Enhancing cardiac diagnostics: A deep learning ensemble approach for precise ECG image classification. J. Big Data 2025, 12, 7. [Google Scholar] [CrossRef]
- Ao, R.; He, G. Image based deep learning in 12-lead ECG diagnosis. Front. Artif. Intell. 2023, 5, 1087370. [Google Scholar] [CrossRef] [PubMed]
- Khan, A.H.; Hussain, M.; Malik, M.K. Cardiac Disorder Classification by Electrocardiogram Sensing Using Deep Neural Network. Complexity 2021, 2021, 5512243. [Google Scholar] [CrossRef]
- Omarov, B.; Momynkulov, Z. Hybrid deep learning model for heart disease detection on 12-lead electrocardiograms. Procedia Comput. Sci. 2024, 241, 439–444. [Google Scholar] [CrossRef]
- Reznichenko, S.; Whitaker, J.; Ni, Z.; Zhou, S. Comparing ECG Lead Subsets for Heart Arrhythmia/ECG Pattern Classification: Convolutional Neural Networks and Random Forest. CJC Open 2024, 7, 176–186. [Google Scholar] [CrossRef]
- Kumar, S.; Mallik, A.; Kumar, A.; Del Ser, J.; Yang, G. Fuzz-ClustNet: Coupled fuzzy clustering and deep neural networks for Arrhythmia detection from ECG signals. Comput. Biol. Med. 2023, 153, 106511. [Google Scholar] [CrossRef]
- Miao, J.; Miao, K. Cardiovascular Disease Diagnosis Using Cardiovascular Imaging and Artificial Intelligence. JACC 2022, 79 (Suppl. S9), 1343. [Google Scholar] [CrossRef]
- Hasan, M.N.; Hossain, M.A.; Rahman, M.A. An ensemble based lightweight deep learning model for the prediction of cardiovascular diseases from electrocardiogram images. Eng. Appl. Artif. Intell. 2024, 141, 109782. [Google Scholar] [CrossRef]
- Ahmed, Z.; Fathi, H.; AbdElminaam, D.S.; Shdefat, A.Y.; Nawaz, A.; Nabil, A.; Rana, M.R.R.; Alsekait, D.M. Heart-Net: A Multi-Modal Deep Learning Approach for Diagnosing Cardiovascular Diseases. Comput. Mater. Contin. 2024, 80, 3967–3990. [Google Scholar] [CrossRef]
- Jayanthi, S.; Devi, S.P. AutoRhythmAI: A Hybrid Machine and Deep Learning Approach for Automated Diagnosis of Arrhythmias. Comput. Mater. Contin. 2024, 78, 2137–2158. [Google Scholar] [CrossRef]
- Sowmya, S.; Jose, D. Contemplate on ECG signals and classification of arrhythmia signals using CNN-LSTM deep learning model. Meas. Sensors 2022, 24, 100558. [Google Scholar] [CrossRef]
- Mandava, M.; Reddy Vinta, S. MDensNet201-IDRSRNet: Efficient cardiovascular disease prediction system using hybrid deep learning. Biomed. Signal Process. Control. 2024, 93, 106147. [Google Scholar] [CrossRef]
- Haseeb, M.; Javid, S.; Kumar, S.; Nashwan, A.J.; Zaveri, S.; Muzammil, M.A.; Afridi, A.K.; Siddineni, R.; Shahabi, M.; Fariha, F. Artificial intelligence-enhanced electrocardiography for accurate diagnosis and management of cardiovascular diseases. J. Electrocardiol. 2024, 83, 30–40. [Google Scholar] [CrossRef]
- Luo, J.; Jin, H.; Qiu, T.; Dong, S.; Wang, C.; Xia, S.; Chen, J.; Deng, Y.; Ni, J.; Xuan, W. Large-area stretchable dynamic 18-lead ECG monitoring patch integrated with deep learning for cardiovascular disease diagnosis. Cell Rep. Phys. Sci. 2024, 5, 102077. [Google Scholar] [CrossRef]
- Zabihi, F.; Safara, F.; Ahadzadeh, B. An electrocardiogram signal classification using a hybrid machine learning and deep learning approach. Healthc. Anal. 2024, 6, 100366. [Google Scholar] [CrossRef]
- Zhang, D.; Yang, S.; Yuan, X.; Zhang, P. Interpretable deep learning for automatic diagnosis of 12-lead electrocardiogram. iScience 2021, 24, 102373. [Google Scholar] [CrossRef]
- Azad, A.; Hossain, A.; Alam Sathi, T.; Jany, R.; Hussain, I.; Ela, R.Z.; Alyami, S.A. An interpretable electrocardiogram-based model for predicting arrhythmia and ischemia in cardiovascular disease. Results Eng. 2024, 24, 103381. [Google Scholar] [CrossRef]
- Tian, Y.; Liu, Y.; Wang, M.; Wei, X.; Liu, J.; Li, Z.; Jin, Y.; Zhao, L.; Liu, C. Cardiologist-level interpretable knowledge-fused deep neural network for automatic arrhythmia diagnosis. Commun. Med. 2024, 4, 31. [Google Scholar] [CrossRef]
- Dharmarathne, G.; Bogahawaththa, M.; Rathnayake, U.; Meddage, D.P.P. Integrating explainable machine learning and user-centric model for diagnosing cardiovascular disease: A novel approach. Intell. Syst. Appl. 2024, 23, 200428. [Google Scholar] [CrossRef]
- Abubaker, M.B.; Babayiğit, B. Detection of Cardiovascular Diseases in ECG Images Using Machine Learning and Deep Learning Methods. IEEE Trans. Artif. Intell. 2023, 4, 373–382. [Google Scholar] [CrossRef]
- Peters, N.S.; Kramer, D.B.; Zhang, B.; Wu, H.; Sau, A.; Waks, J.W.; Bajaj, N.; Ng, F.S.; Patel, K.H.K.; Shi, X.; et al. A fully-automated paper ECG digitisation algorithm using deep learning. Sci. Rep. 2022, 12, 20963. [Google Scholar] [CrossRef]
- Attallah, O. ECG-BiCoNet: An ECG-based pipeline for COVID-19 diagnosis using Bi-Layers of deep features integration. Comput. Biol. Med. 2022, 142, 105210. [Google Scholar] [CrossRef] [PubMed]
- Attallah, O. An Intelligent ECG-Based Tool for Diagnosing COVID-19 via Ensemble Deep Learning Techniques. Biosensors 2022, 12, 299. [Google Scholar] [CrossRef] [PubMed]
- Mainardi, L.; Brukamp, K.; van Gils, M.; Vehkaoja, A.; Corino, V.D.; García-Isla, G.; Moreno-Sánchez, P.A. ECG-based data-driven solutions for diagnosis and prognosis of cardiovascular diseases: A systematic review. Comput. Biol. Med. 2024, 172, 108235. [Google Scholar] [CrossRef]
- Tsampras, T.; Karamanidou, T.; Papanastasiou, G.; Stavropoulos, T.G. Deep learning for cardiac imaging: Focus on myocardial diseases, a narrative review. Hell. J. Cardiol. 2024, 81, 18–24. [Google Scholar] [CrossRef]
- Gorriz, J.M.; Alinejad-Rokny, H.; Ling, S.H.; Zhang, Y.-D.; Wang, S.-H.; Alizadehsani, R.; Jafari, M.; Khosravi, A.; Ghassemi, N.; Moridian, P.; et al. Automated diagnosis of cardiovascular diseases from cardiac magnetic resonance imaging using deep learning models: A review. Comput. Biol. Med. 2023, 160, 106998. [Google Scholar] [CrossRef]
- Mhamdi, L.; Dammak, O.; Cottin, F.; Dhaou, I.B. Artificial Intelligence for Cardiac Diseases Diagnosis and Prediction Using ECG Images on Embedded Systems. Biomedicines 2022, 10, 2013. [Google Scholar] [CrossRef]
- Ashtaiwi, A.A.; Khalifa, T.; Alirr, O. Enhancing heart disease diagnosis through ECG image vectorization-based classification. Heliyon 2024, 10, e37574. [Google Scholar] [CrossRef]
- Fatema, K.; Montaha, S.; Rony, M.A.H.; Azam, S.; Hasan, M.Z.; Jonkman, M. A Robust Framework Combining Image Processing and Deep Learning Hybrid Model to Classify Cardiovascular Diseases Using a Limited Number of Paper-Based Complex ECG Images. Biomedicines 2022, 10, 2835. [Google Scholar] [CrossRef]
- Otsu, N. A threshold selection method from gray-level histograms. IEEE Trans. Syst. Man Cybern. 1979, 9, 62–66. [Google Scholar] [CrossRef]
- Szegedy, C.; Vanhoucke, V.; Ioffe, S.; Shlens, J.; Wojna, Z. Rethinking the Inception Architecture for Computer Vision. In Proceedings of the 2016 IEEE Conference on Computer Vision and Pattern Recognition (CVPR), Las Vegas, NV, USA, 27–30 June 2016; IEEE: Piscataway, NJ, USA; pp. 2818–2826. [Google Scholar] [CrossRef]
- He, K.; Zhang, X.; Ren, S.; Sun, J. Deep Residual Learning for Image Recognition. In Proceedings of the 2016 IEEE Conference on Computer Vision and Pattern Recognition (CVPR), Las Vegas, NV, USA, 27–30 June 2016; IEEE: Piscataway, NJ, USA; pp. 770–778. [Google Scholar] [CrossRef]
- Simonyan, K.; Zisserman, A. Very Deep Convolutional Networks for Large-Scale Image Recognition, September 2014. Available online: http://arxiv.org/abs/1409.1556 (accessed on 8 June 2025).
- Szegedy, C.; Liu, W.; Jia, Y.; Sermanet, P.; Reed, S.; Anguelov, D.; Erhan, D.; Vanhoucke, V.; Rabinovich, A. Going deeper with convolutions. In Proceedings of the 2015 IEEE Conference on Computer Vision and Pattern Recognition (CVPR), Boston, MA, USA, 7–12 June 2015; pp. 1–9. [Google Scholar] [CrossRef]
- Khan, A.H.; Hussain, M.; Malik, M.K. ECG Images dataset of Cardiac and COVID-19 Patients. Data Brief 2021, 34, 106762. [Google Scholar] [CrossRef]
- Wang, Z.; Bovik, A.C.; Sheikh, H.R.; Simoncelli, E.P. Image quality assessment: From error visibility to structural similarity. IEEE Trans. Image Process. 2004, 13, 600–612. [Google Scholar] [CrossRef]


| Training Solver | Mini Batch Size | Max Epochs | Initial Learn Rate | Validation Frequency | |
|---|---|---|---|---|---|
| InceptionNetV2 | SGDM | 10 | 40 | 1 × 10⁻⁴ | 20 |
| ResNet50 | SGDM | 20 | 20 | 1 × 10⁻⁴ | 20 |
| VGG16 | SGDM | 10 | 60 | 1 × 10⁻⁴ | 20 |
| VGG19 | SGDM | 10 | 60 | 1 × 10⁻⁴ | 20 |
| GoogleNet | SGDM | 50 | 100 | 1 × 10⁻⁴ | 60 |
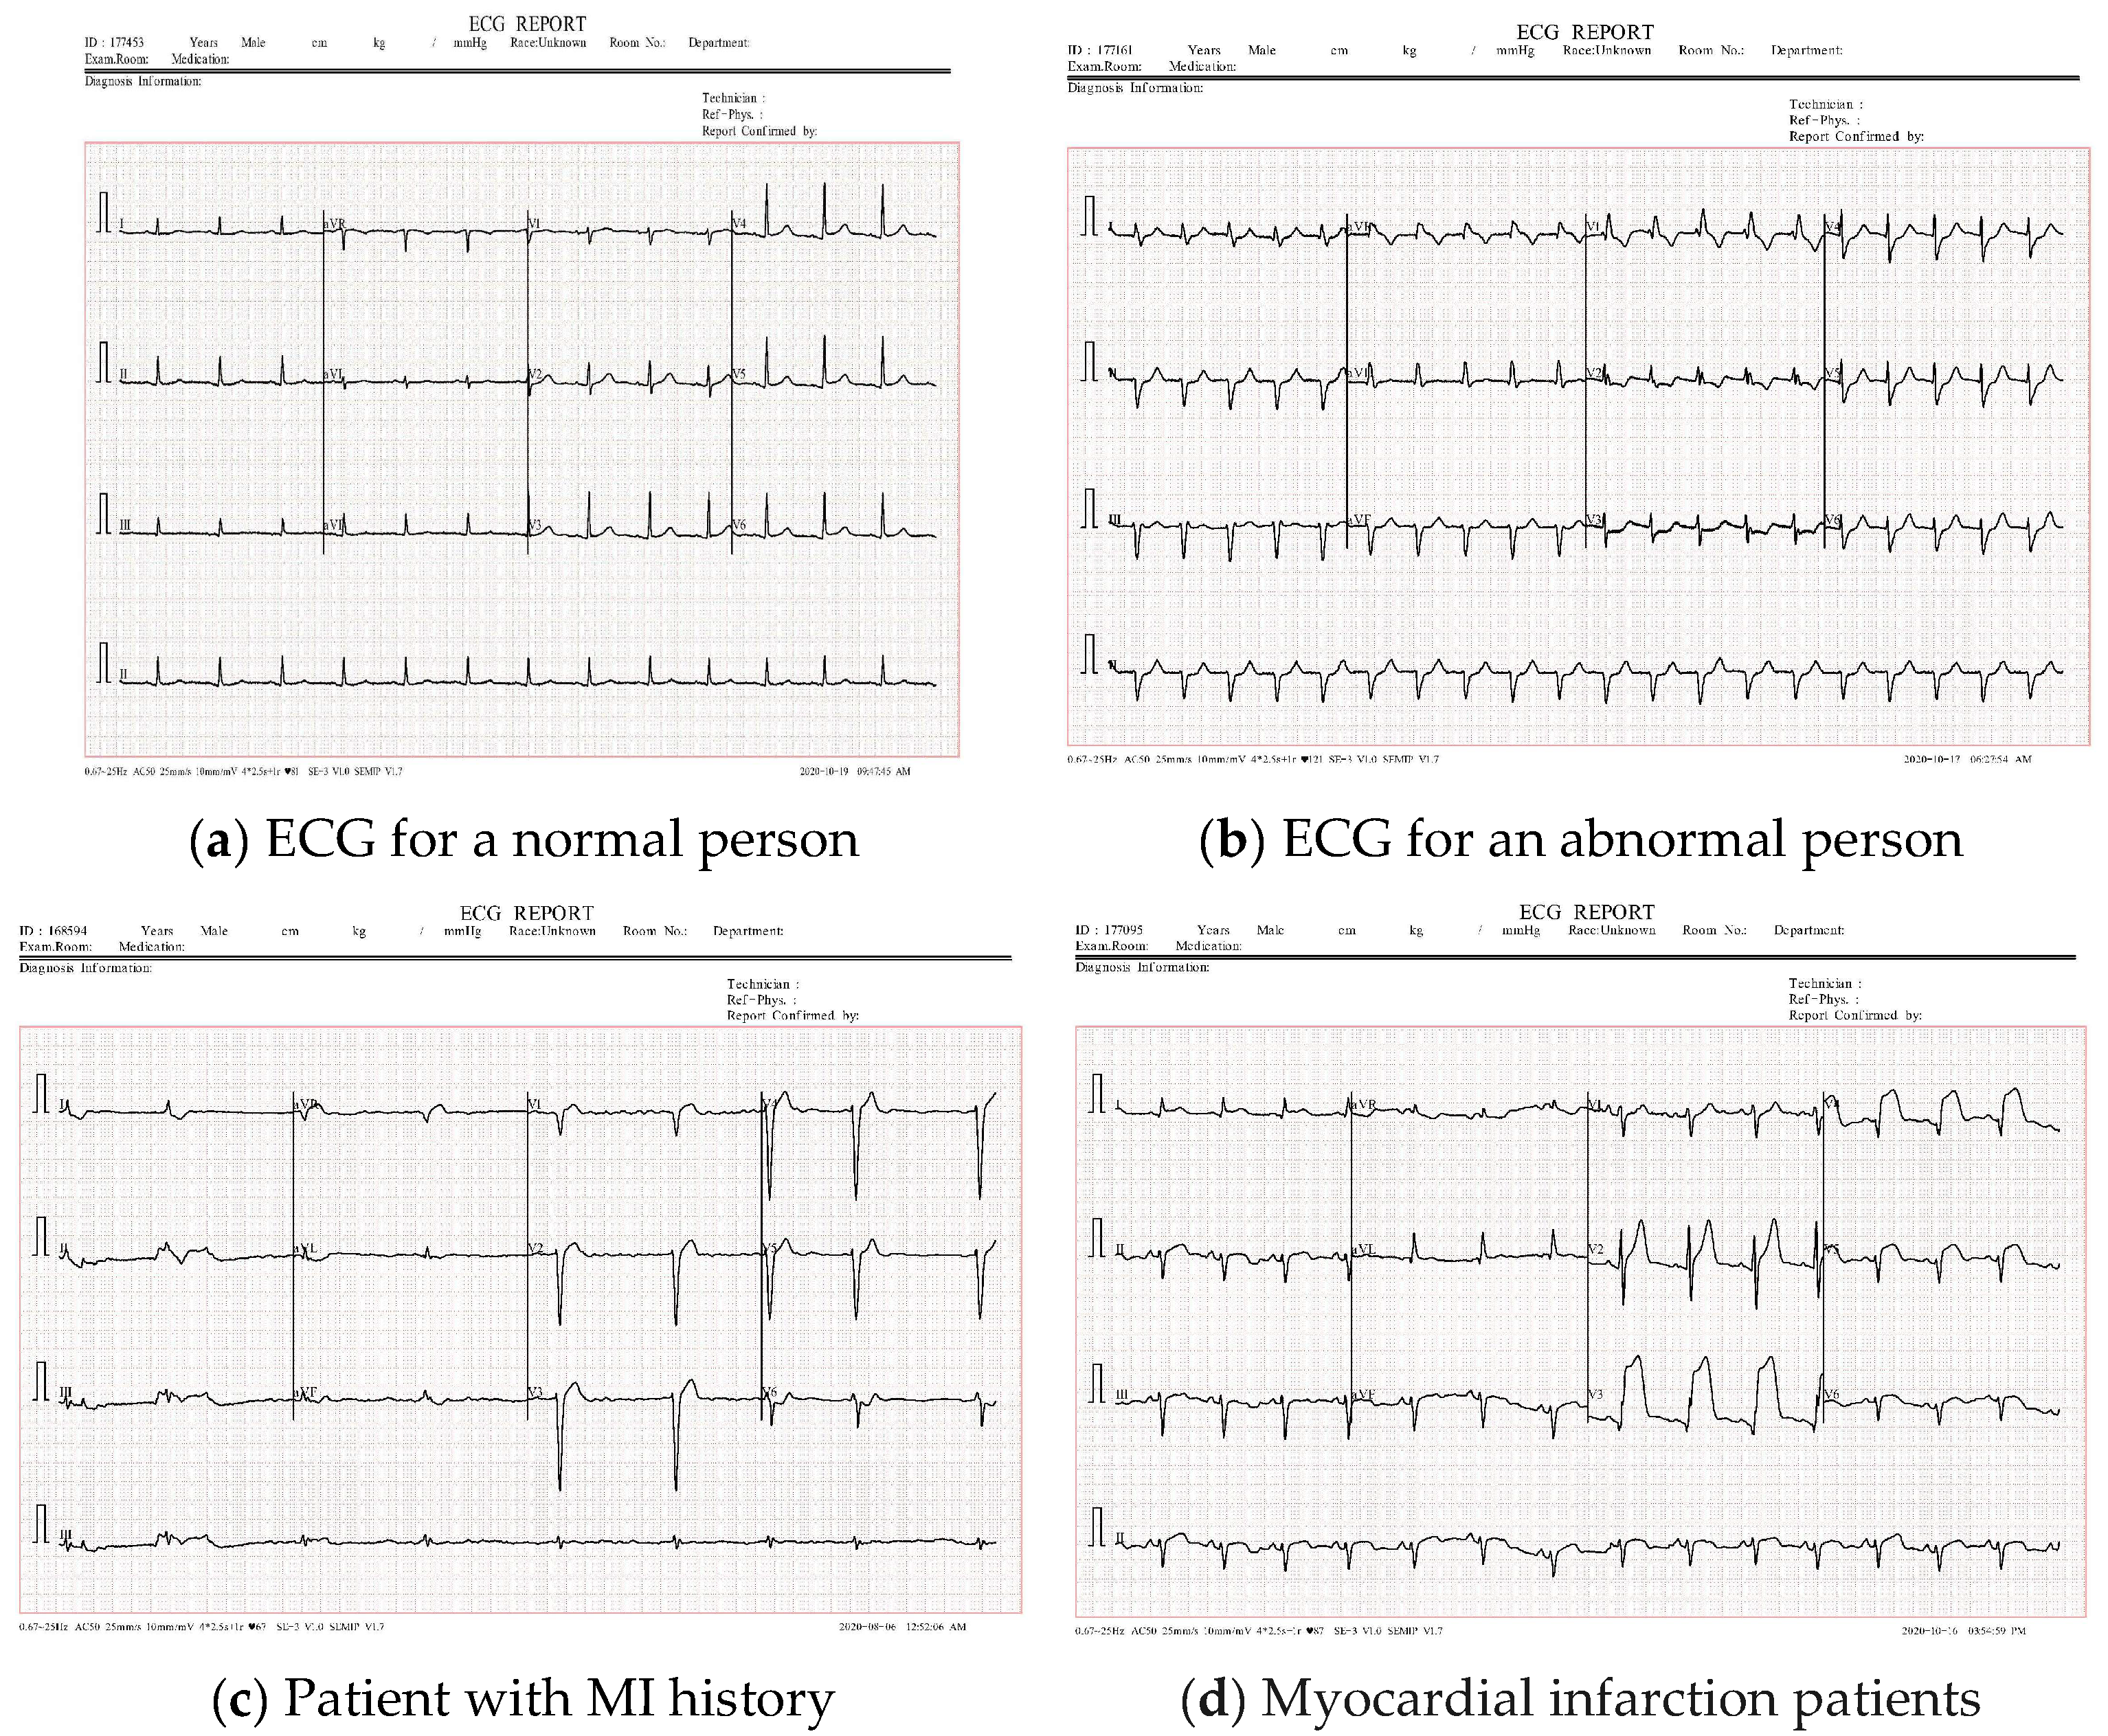
| No. | Category | Training Set | Testing Set | Total ECG Images |
|---|---|---|---|---|
| 1 | Normal | 199 | 85 | 284 |
| 2 | History of MI | 116 | 50 | 166 |
| 3 | Abnormal | 157 | 67 | 224 |
| 4 | Total dataset | 472 | 202 | 674 |
| Parameter | Value |
|---|---|
| Gaussian blur ( | 0.7 |
| Search window for seed point (α) | 150 pixels |
| Search window for subsequent signal point (β) | 75 pixels |
| Validating candidate signal point (γ) | 15 pixels |
| Results Using the Original ECG Dataset | Results Using the Reconstructed ECG Dataset | |||||||
|---|---|---|---|---|---|---|---|---|
| Overall Precision | Overall Recall | F1 Score | Accuracy | Overall Precision | Overall Recall | F1 Score | Accuracy | |
| VGG16 | 97.17% | 97.76% | 97.46% | 97.44% | 97.17% | 97.76% | 97.46% | 97.44% |
| VGG16 + SVM | 97.17% | 97.76% | 97.46% | 97.76% | 97.17% | 97.76% | 97.46% | 97.76% |
| InceptionNetv2 | 94.59% | 95.56% | 95.07% | 94.87% | 88.68% | 89.60% | 89.14% | 88.46% |
| InceptionNetv2 + SVM | 94.59% | 95.56% | 95.07% | 95.56% | 92.31% | 93.33% | 92.82% | 93.33% |
| VGG19 | 97.46% | 97.76% | 97.17% | 97.44% | 98.08% | 98.51% | 98.29% | 98.29% |
| VGG19 + SVM | 97.17% | 97.76% | 97.46% | 97.76% | 98.08% | 98.51% | 98.29% | 98.51% |
| ResNet50 | 94.00% | 93.76% | 93.88% | 94.02% | 92.52% | 91.76% | 92.14% | 92.31% |
| ResNet50 + SVM | 96.51% | 96.51% | 96.51% | 96.51% | 91.49% | 91.01% | 91.25% | 91.76% |
| GoogleNet | 95.45% | 96.27% | 95.86% | 95.73% | 94.64% | 95.52% | 95.08% | 94.87% |
| GoogleNet + SVM | 96.30% | 97.01% | 96.65% | 97.01% | 96.30% | 97.01% | 96.65% | 97.01% |
| Results Using the Original ECG Dataset | Results Using the Reconstructed ECG Dataset | |||||||
|---|---|---|---|---|---|---|---|---|
| Overall Precision | Overall Recall | F1 Score | Accuracy | Overall Precision | Overall Recall | F1 Score | Accuracy | |
| VGG16 | 100% | 100% | 100% | 100% | 100% | 100% | 100% | 100% |
| VGG16 + SVM | 100% | 100% | 100% | 100% | 100% | 100% | 100% | 100% |
| InceptionNetv2 | 100% | 100% | 100% | 100% | 100% | 100% | 100% | 100% |
| InceptionNetv2 + SVM | 100% | 100% | 100% | 100% | 97.14% | 98.25% | 97.69% | 98.25% |
| VGG19 | 100% | 100% | 100% | 100% | 98.85% | 98% | 98.42% | 98.52% |
| VGG19 + SVM | 100% | 100% | 100% | 100% | 98.85% | 98% | 98.42% | 98% |
| ResNet50 | 98.85% | 98% | 98.42% | 98.52% | 89.63% | 88.69% | 89.29% | 88.99% |
| ResNet50 + SVM | 98.85% | 98% | 98.42% | 98% | 90.12% | 91.29% | 90.71% | 91.29% |
| GoogleNet | 100% | 100% | 100% | 100% | 95.45% | 97.06% | 96.25% | 96.30% |
| GoogleNet + SVM | 100% | 100% | 100% | 100% | 95.62% | 94.82% | 95.22% | 94.82% |
| Using the Original ECG Dataset | Using the Reconstructed ECG Dataset | |||||||
|---|---|---|---|---|---|---|---|---|
| Overall Precision | Overall Recall | F1 Score | Accuracy | Overall Precision | Overall Recall | F1 Score | Accuracy | |
| VGG16 | 97.93% | 98.08% | 98.01% | 98.03% | 97.93% | 98.08% | 98.01% | 98.03 |
| VGG16 + SVM | 97.93% | 98.08% | 98.01% | 98.08% | 97.93% | 98.08% | 98.01% | 98.08% |
| InceptionNetv2 | 96.29% | 95.79% | 96.04% | 96.08% | 94.53% | 92.22% | 93.36% | 93.14% |
| InceptionNetv2 + SVM | 97.87% | 98.25% | 98.06% | 95.79% | 97.50% | 96.67% | 97.08% | 96.67% |
| VGG19 | 99.42% | 99.25% | 99.34% | 99.34% | 97.93% | 98.08% | 98.01% | 98.03% |
| VGG19 + SVM | 99.42% | 99.25% | 99.34% | 99.25% | 97.33% | 97.33% | 97.33% | 97.33% |
| ResNet50 | 98.85% | 98.51% | 98.68% | 98.68% | 96.70% | 95.52% | 96.11% | 96.05% |
| ResNet50 + SVM | 98.30% | 97.76% | 98.03% | 97.76% | 96.70% | 95.52% | 96.11% | 95.52% |
| GoogleNet | 96.16% | 95.84% | 96.00% | 96.05% | 95.27% | 95.41% | 95.34% | 95.39% |
| GoogleNet + SVM | 96.74% | 96.58% | 96.66% | 96.58% | 95.27% | 95.41% | 95.34% | 95.41% |
| Results Using the Original ECG Dataset | Results Using the Reconstructed ECG Dataset | |||||||
|---|---|---|---|---|---|---|---|---|
| Overall Precision | Overall Recall | F1 Score | Accuracy | Overall Precision | Overall Recall | F1 Score | Accuracy | |
| VGG16 | 97.93% | 98.08% | 98.01% | 98.03% | 97.93% | 98.08% | 98.01% | 98.03 |
| VGG16 + SVM | 97.93% | 98.08% | 98.01% | 98.08% | 97.93% | 98.08% | 98.01% | 98.08% |
| InceptionNetv2 | 96.29% | 95.79% | 96.04% | 96.08% | 94.53% | 92.22% | 93.36% | 93.14% |
| InceptionNetv2 + SVM | 97.87% | 98.25% | 98.06% | 95.79% | 97.50% | 96.67% | 97.08% | 96.67% |
| VGG19 | 99.42% | 99.25% | 99.34% | 99.34% | 97.93% | 98.08% | 98.01% | 98.03% |
| VGG19 + SVM | 99.42% | 99.25% | 99.34% | 99.25% | 97.33% | 97.33% | 97.33% | 100% |
| ResNet50 | 98.85% | 98.51% | 98.68% | 98.68% | 96.70% | 95.52% | 96.11% | 96.05% |
| ResNet50 + SVM | 98.30% | 97.76% | 98.03% | 97.76% | 96.70% | 95.52% | 96.11% | 95.52% |
| GoogleNet | 96.16% | 95.84% | 96.00% | 96.05% | 95.27% | 95.41% | 95.34% | 95.39% |
| GoogleNet + SVM | 96.74% | 96.58% | 96.66% | 96.58% | 95.27% | 95.41% | 95.34% | 95.41% |
Disclaimer/Publisher’s Note: The statements, opinions and data contained in all publications are solely those of the individual author(s) and contributor(s) and not of MDPI and/or the editor(s). MDPI and/or the editor(s) disclaim responsibility for any injury to people or property resulting from any ideas, methods, instructions or products referred to in the content. |
© 2025 by the authors. Licensee MDPI, Basel, Switzerland. This article is an open access article distributed under the terms and conditions of the Creative Commons Attribution (CC BY) license (https://creativecommons.org/licenses/by/4.0/).
Share and Cite
Ahmad, M.; Ahmed, A.; Hashim, H.; Farsi, M.; Mahmoud, N. Enhancing Heart Disease Diagnosis Using ECG Signal Reconstruction and Deep Transfer Learning Classification with Optional SVM Integration. Diagnostics 2025, 15, 1501. https://doi.org/10.3390/diagnostics15121501
Ahmad M, Ahmed A, Hashim H, Farsi M, Mahmoud N. Enhancing Heart Disease Diagnosis Using ECG Signal Reconstruction and Deep Transfer Learning Classification with Optional SVM Integration. Diagnostics. 2025; 15(12):1501. https://doi.org/10.3390/diagnostics15121501
Chicago/Turabian StyleAhmad, Mostafa, Ali Ahmed, Hasan Hashim, Mohammed Farsi, and Nader Mahmoud. 2025. "Enhancing Heart Disease Diagnosis Using ECG Signal Reconstruction and Deep Transfer Learning Classification with Optional SVM Integration" Diagnostics 15, no. 12: 1501. https://doi.org/10.3390/diagnostics15121501
APA StyleAhmad, M., Ahmed, A., Hashim, H., Farsi, M., & Mahmoud, N. (2025). Enhancing Heart Disease Diagnosis Using ECG Signal Reconstruction and Deep Transfer Learning Classification with Optional SVM Integration. Diagnostics, 15(12), 1501. https://doi.org/10.3390/diagnostics15121501