
Longitudinal Analysis of P100 Wave Amplitude and Latency in Multiple Sclerosis: A 19-Year Retrospective VEP Study

 , and
, and 
Abstract
:1. Introduction
2. Materials and Methods
Statistical Analysis
3. Results
4. Discussion
5. Conclusions
Author Contributions
Funding
Institutional Review Board Statement
Informed Consent Statement
Data Availability Statement
Conflicts of Interest
References
- Kamm, C.P.; Uitdehaag, B.M.; Polman, C.H. Multiple Sclerosis: Current Knowledge and Future Outlook. Eur. Neurol. 2014, 72, 132–141. [Google Scholar] [CrossRef] [PubMed]
- Browne, P.; Chandraratna, D.; Angood, C.; Tremlett, H.; Baker, C.; Taylor, B.V.; Thompson, A.J. Atlas of Multiple Sclerosis 2013: A growing global problem with widespread inequity. Neurology 2014, 83, 1022–1024. [Google Scholar] [CrossRef] [PubMed]
- Dobson, R.; Giovannoni, G. Multiple sclerosis—A review. Eur. J. Neurol. 2018, 26, 27–40. [Google Scholar] [CrossRef]
- Pawlitzki, M.; Horbrügger, M.; Loewe, K.; Kaufmann, J.; Opfer, R.; Wagner, M.; Al-Nosairy, K.O.; Meuth, S.G.; Hoffmann, M.B.; Schippling, S. MS optic neuritis-induced long-term structural changes within the visual pathway. Neurol. Neuroimmunol. Neuroinflamm. 2020, 7, e665. [Google Scholar] [CrossRef] [PubMed]
- Bennett, J.L. Optic Neuritis. CONTINUUM Lifelong Learn. Neurol. 2019, 25, 1236–1264. [Google Scholar] [CrossRef]
- Redler, Y.; Levy, M. Rodent Models of Optic Neuritis. Front. Neurol. 2020, 11, 580951. [Google Scholar] [CrossRef]
- Donica, V.C.; Alexa, A.I.; Pavel, I.A.; Danielescu, C.; Ciapă, M.A.; Donica, A.L.; Bogdănici, C.M. The Evolvement of OCT and OCT-A in Identifying Multiple Sclerosis Biomarkers. Biomedicines 2023, 11, 3031. [Google Scholar] [CrossRef]
- Thompson, A.J.; Banwell, B.L.; Barkhof, F.; Carroll, W.M.; Coetzee, T.; Comi, G.; Correale, J.; Fazekas, F.; Filippi, M.; Freedman, M.S.; et al. Diagnosis of multiple sclerosis: 2017 revisions of the McDonald criteria. Lancet Neurol. 2018, 17, 162–173. [Google Scholar] [CrossRef]
- Behbehani, R.; Ali, A.; Al-Omairah, H.; Rousseff, R.T. Optimization of spectral domain optical coherence tomography and visual evoked potentials to identify unilateral optic neuritis. Mult. Scler. Relat. Disord. 2020, 41, 101988. [Google Scholar] [CrossRef]
- Halliday, A.M.; Mcdonald, W.I.; Mushin, J. DELAYED VISUAL EVOKED RESPONSE IN OPTIC NEURITIS. Lancet 1972, 299, 982–985. [Google Scholar] [CrossRef]
- Berman, S.; Backner, Y.; Krupnik, R.; Paul, F.; Petrou, P.; Karussis, D.; Levin, N.; Mezer, A.A. Conduction delays in the visual pathways of progressive multiple sclerosis patients covary with brain structure. NeuroImage 2020, 221, 117204. [Google Scholar] [CrossRef] [PubMed]
- Abel, A.; McClelland, C.; Lee, M.S. Critical review: Typical and atypical optic neuritis. Surv. Ophthalmol. 2019, 64, 770–779. [Google Scholar] [CrossRef]
- Luo, J.J.; Bumanlag, F.; Dun, N. Low-contrast visual evoked potential and early detection of optic demyelination. J. Neurol. Sci. 2019, 399, 108–110. [Google Scholar] [CrossRef]
- Yang, E.B.; Hood, D.C.; Rodarte, C.; Zhang, X.; Odel, J.G.; Behrens, M.M. Improvement in Conduction Velocity after Optic Neuritis Measured with the Multifocal VEP. Investig. Opthalmol. Vis. Sci. 2007, 48, 692. [Google Scholar] [CrossRef] [PubMed]
- Oertel, F.C.; Krämer, J.; Motamedi, S.; Keihani, A.; Zimmermann, H.G.; Dimitriou, N.G.; Condor-Montes, S.; Bereuter, C.; Cordano, C.; Abdelhak, A.; et al. Visually Evoked Potential as Prognostic Biomarker for Neuroaxonal Damage in Multiple Sclerosis From a Multicenter Longitudinal Cohort. Neurol. Neuroimmunol. Neuroinflamm. 2023, 10, e200092. [Google Scholar] [CrossRef] [PubMed]
- Amezcua, L.; Robers, M.V.; Soneji, D.; Manouvakhova, O.; Martinez, A.; Islam, T. Inclusion of optic neuritis in dissemination in space improves the performance of McDonald 2017 criteria in Hispanic people with suspected multiple sclerosis. Mult. Scler. J. 2023, 29, 1748–1754. [Google Scholar] [CrossRef]
- Vidal-Jordana, A.; Rovira, A.; Calderon, W.; Arrambide, G.; Castilló, J.; Moncho, D.; Rahnama, K.; Collorone, S.; Toosy, A.T.; Ciccarelli, O.; et al. Adding the Optic Nerve in Multiple Sclerosis Diagnostic Criteria: A Longitudinal, Prospective, Multicenter Study. Neurology 2024, 102, e200805. [Google Scholar] [CrossRef]
- Roldán, M.; Caballé, N.; Sainz, C.; Pérez-Rico, C.; Ayuso, L.; Blanco, R. Assessing the visual afferent pathway with the multifocal visual evoked potentials in the radiologically isolated syndrome. Sci. Rep. 2024, 14, 20169. [Google Scholar] [CrossRef]
- Vecchio, D.; Barbero, P.; Galli, G.; Virgilio, E.; Naldi, P.; Comi, C.; Cantello, R. Prognostic Role of Visual Evoked Potentials in Non-Neuritic Eyes at Multiple Sclerosis Diagnosis. J. Clin. Med. 2023, 12, 2382. [Google Scholar] [CrossRef]
- Nikolic, B.; Zaletel, I.; Ivancevic, N.; Rovcanin, B.; Pepic, A.; Samardzic, J.; Jancic, J. The usefulness of visual evoked potentials in the assessment of the pediatric multiple sclerosis. Eur. J. Paediatr. Neurol. 2022, 36, 130–136. [Google Scholar] [CrossRef]
- Filgueiras, T.G.; Oyamada, M.K.; Hokazono, K.; Cunha, L.P.; Apóstolos-Pereira, S.L.; Callegaro, D.; Monteiro, M.L.R. Comparison of Visual Evoked Potentials in Patients Affected by Optic Neuritis From Multiple Sclerosis or Neuromyelitis Optica Spectrum Disorder. J. Neuro-Ophthalmol. 2021, 42, e32–e39. [Google Scholar] [CrossRef] [PubMed]
- Ekayanti, M.S.; Mahama, C.N.; Ngantung, D.J. Normative values of visual evoked potential in adults. Indian J. Ophthalmol. 2021, 69, 2328–2332. [Google Scholar] [CrossRef]
- Donica, V.C.; Donica, A.L.; Pavel, I.A.; Danielescu, C.; Alexa, A.I.; Bogdănici, C.M. Variabilities in Retinal Hemodynamics Across the Menstrual Cycle in Healthy Women Identified Using Optical Coherence Tomography Angiography. Life 2024, 15, 22. [Google Scholar] [CrossRef]
- Fortepiani, L.; Foutch, B.K.; Wilson, M.R. The Effects of Sex, Oral Contraception, and Menstrual Cycle Phase on Intraocular Pressure, Central Corneal Thickness, and Foveal Thickness: A Descriptive Analysis. Vision 2021, 5, 48. [Google Scholar] [CrossRef]
- Vander Wall, R.; Basavarajappa, D.; Palanivel, V.; Sharma, S.; Gupta, V.; Klistoner, A.; Graham, S.; You, Y. VEP Latency Delay Reflects Demyelination Beyond the Optic Nerve in the Cuprizone Model. Investig. Ophthalmol. Vis. Sci. 2024, 65, 50. [Google Scholar] [CrossRef] [PubMed]
- Papadopoulou, A.; Pfister, A.; Tsagkas, C.; Gaetano, L.; Sellathurai, S.; D’Souza, M.; Cerdá-Fuertes, N.; Gugleta, K.; Descoteaux, M.; Chakravarty, M.M.; et al. Visual evoked potentials in multiple sclerosis: P100 latency and visual pathway damage including the lateral geniculate nucleus. Clin. Neurophysiol. 2024, 161, 122–132. [Google Scholar] [CrossRef]
- Ciapă, M.A.; Șalaru, D.L.; Stătescu, C.; Sascău, R.A.; Bogdănici, C.M. Optic Neuritis in Multiple Sclerosis—A Review of Molecular Mechanisms Involved in the Degenerative Process. Curr. Issues Mol. Biol. 2022, 44, 3959–3979. [Google Scholar] [CrossRef] [PubMed]
- Schurz, N.; Sariaslani, L.; Altmann, P.; Leutmezer, F.; Mitsch, C.; Pemp, B.; Rommer, P.; Zrzavy, T.; Berger, T.; Bsteh, G. Evaluation of Retinal Layer Thickness Parameters as Biomarkers in a Real-World Multiple Sclerosis Cohort. Eye Brain 2021, 13, 59–69. [Google Scholar] [CrossRef]
- Tepavčević, V.; Lubetzki, C. Oligodendrocyte progenitor cell recruitment and remyelination in multiple sclerosis: The more, the merrier? Brain 2022, 145, 4178–4192. [Google Scholar] [CrossRef]
- Deschamps, R.; Shor, N.; Vignal, C.; Guillaume, J.; Boudot de la Motte, M.; Salviat, F.; Lecler, A.; Marignier, R.; Hage, R.; Coulette, S.; et al. Prospective longitudinal study on prognostic factors of visual recovery and structural change after a first episode of optic neuritis. Eur. J. Neurol. 2022, 29, 2781–2791. [Google Scholar] [CrossRef]
- Carroll, W.M.; Jennings, A.R.; Mastaglia, F.L. The origin of remyleinating oligodendrocytes in antiserum-mediated demyelinative optic neuropathy. Brain 1990, 113, 953–973. [Google Scholar] [CrossRef] [PubMed]
- Prineas, J.W.; Barnard, R.O.; Kwon, E.E.; Sharer, L.R.; Cho, E. Multiple sclerosis: Remyelination of nascent lesions: Remyelination of nascent lesions. Ann. Neurol. 1993, 33, 137–151. [Google Scholar] [CrossRef]
- Lucchinetti, C.F.; Brück, W.; Rodriguez, M.; Lassmann, H. Distinct Patterns of Multiple Sclerosis Pathology Indicates Heterogeneity in Pathogenesis. Brain Pathol. 1996, 6, 259–274. [Google Scholar] [CrossRef]
- Hanafy, K.A.; Sloane, J.A. Regulation of remyelination in multiple sclerosis. FEBS Lett. 2011, 585, 3821–3828. [Google Scholar] [CrossRef]
- Wu, L.; Williams, A.; Delaney, A.; Sherman, D.; Brophy, P. Increasing Internodal Distance in Myelinated Nerves Accelerates Nerve Conduction to a Flat Maximum. Curr. Biol. 2012, 22, 1957–1961. [Google Scholar] [CrossRef]
- Cordano, C.; Sin, J.H.; Timmons, G.; Yiu, H.H.; Stebbins, K.; Guglielmetti, C.; Cruz-Herranz, A.; Xin, W.; Lorrain, D.; Chan, J.R.; et al. Validating visual evoked potentials as a preclinical, quantitative biomarker for remyelination efficacy. Brain 2022, 145, 3943–3952. [Google Scholar] [CrossRef] [PubMed]
- Saridas, F.; Hojjati, F.; Alizada, S.; Lazrak, S.; Koc, E.R.; Turan, O.F. Effects of disease-modifying therapies on remyelination in multiple sclerosis; evaluation via visual evoked potential test. Mult. Scler. Relat. Disord. 2024, 91, 105850. [Google Scholar] [CrossRef]
- Hauser, S.L.; Cree, B.A.C. Treatment of Multiple Sclerosis: A Review. Am. J. Med. 2020, 133, 1380–1390.e2. [Google Scholar] [CrossRef] [PubMed]
- Barton, J.L.; Garber, J.Y.; Klistorner, A.; Barnett, M.H. The electrophysiological assessment of visual function in Multiple Sclerosis. Clin. Neurophysiol. Pract. 2019, 4, 90–96. [Google Scholar] [CrossRef]
- Odom, J.V.; Bach, M.; Brigell, M.; Holder, G.E.; McCulloch, D.L.; Mizota, A.; Tormene, A.P. ISCEV standard for clinical visual evoked potentials: (2016 update). Doc. Ophthalmol. 2016, 133, 1–9. [Google Scholar] [CrossRef]
- Vidal-Jordana, A.; Rovira, A.; Arrambide, G.; Otero-Romero, S.; Río, J.; Comabella, M.; Nos, C.; Castilló, J.; Galan, I.; Cabello, S.; et al. Optic Nerve Topography in Multiple Sclerosis Diagnosis: The Utility of Visual Evoked Potentials. Neurology 2021, 96, e482–e490. [Google Scholar] [CrossRef] [PubMed]


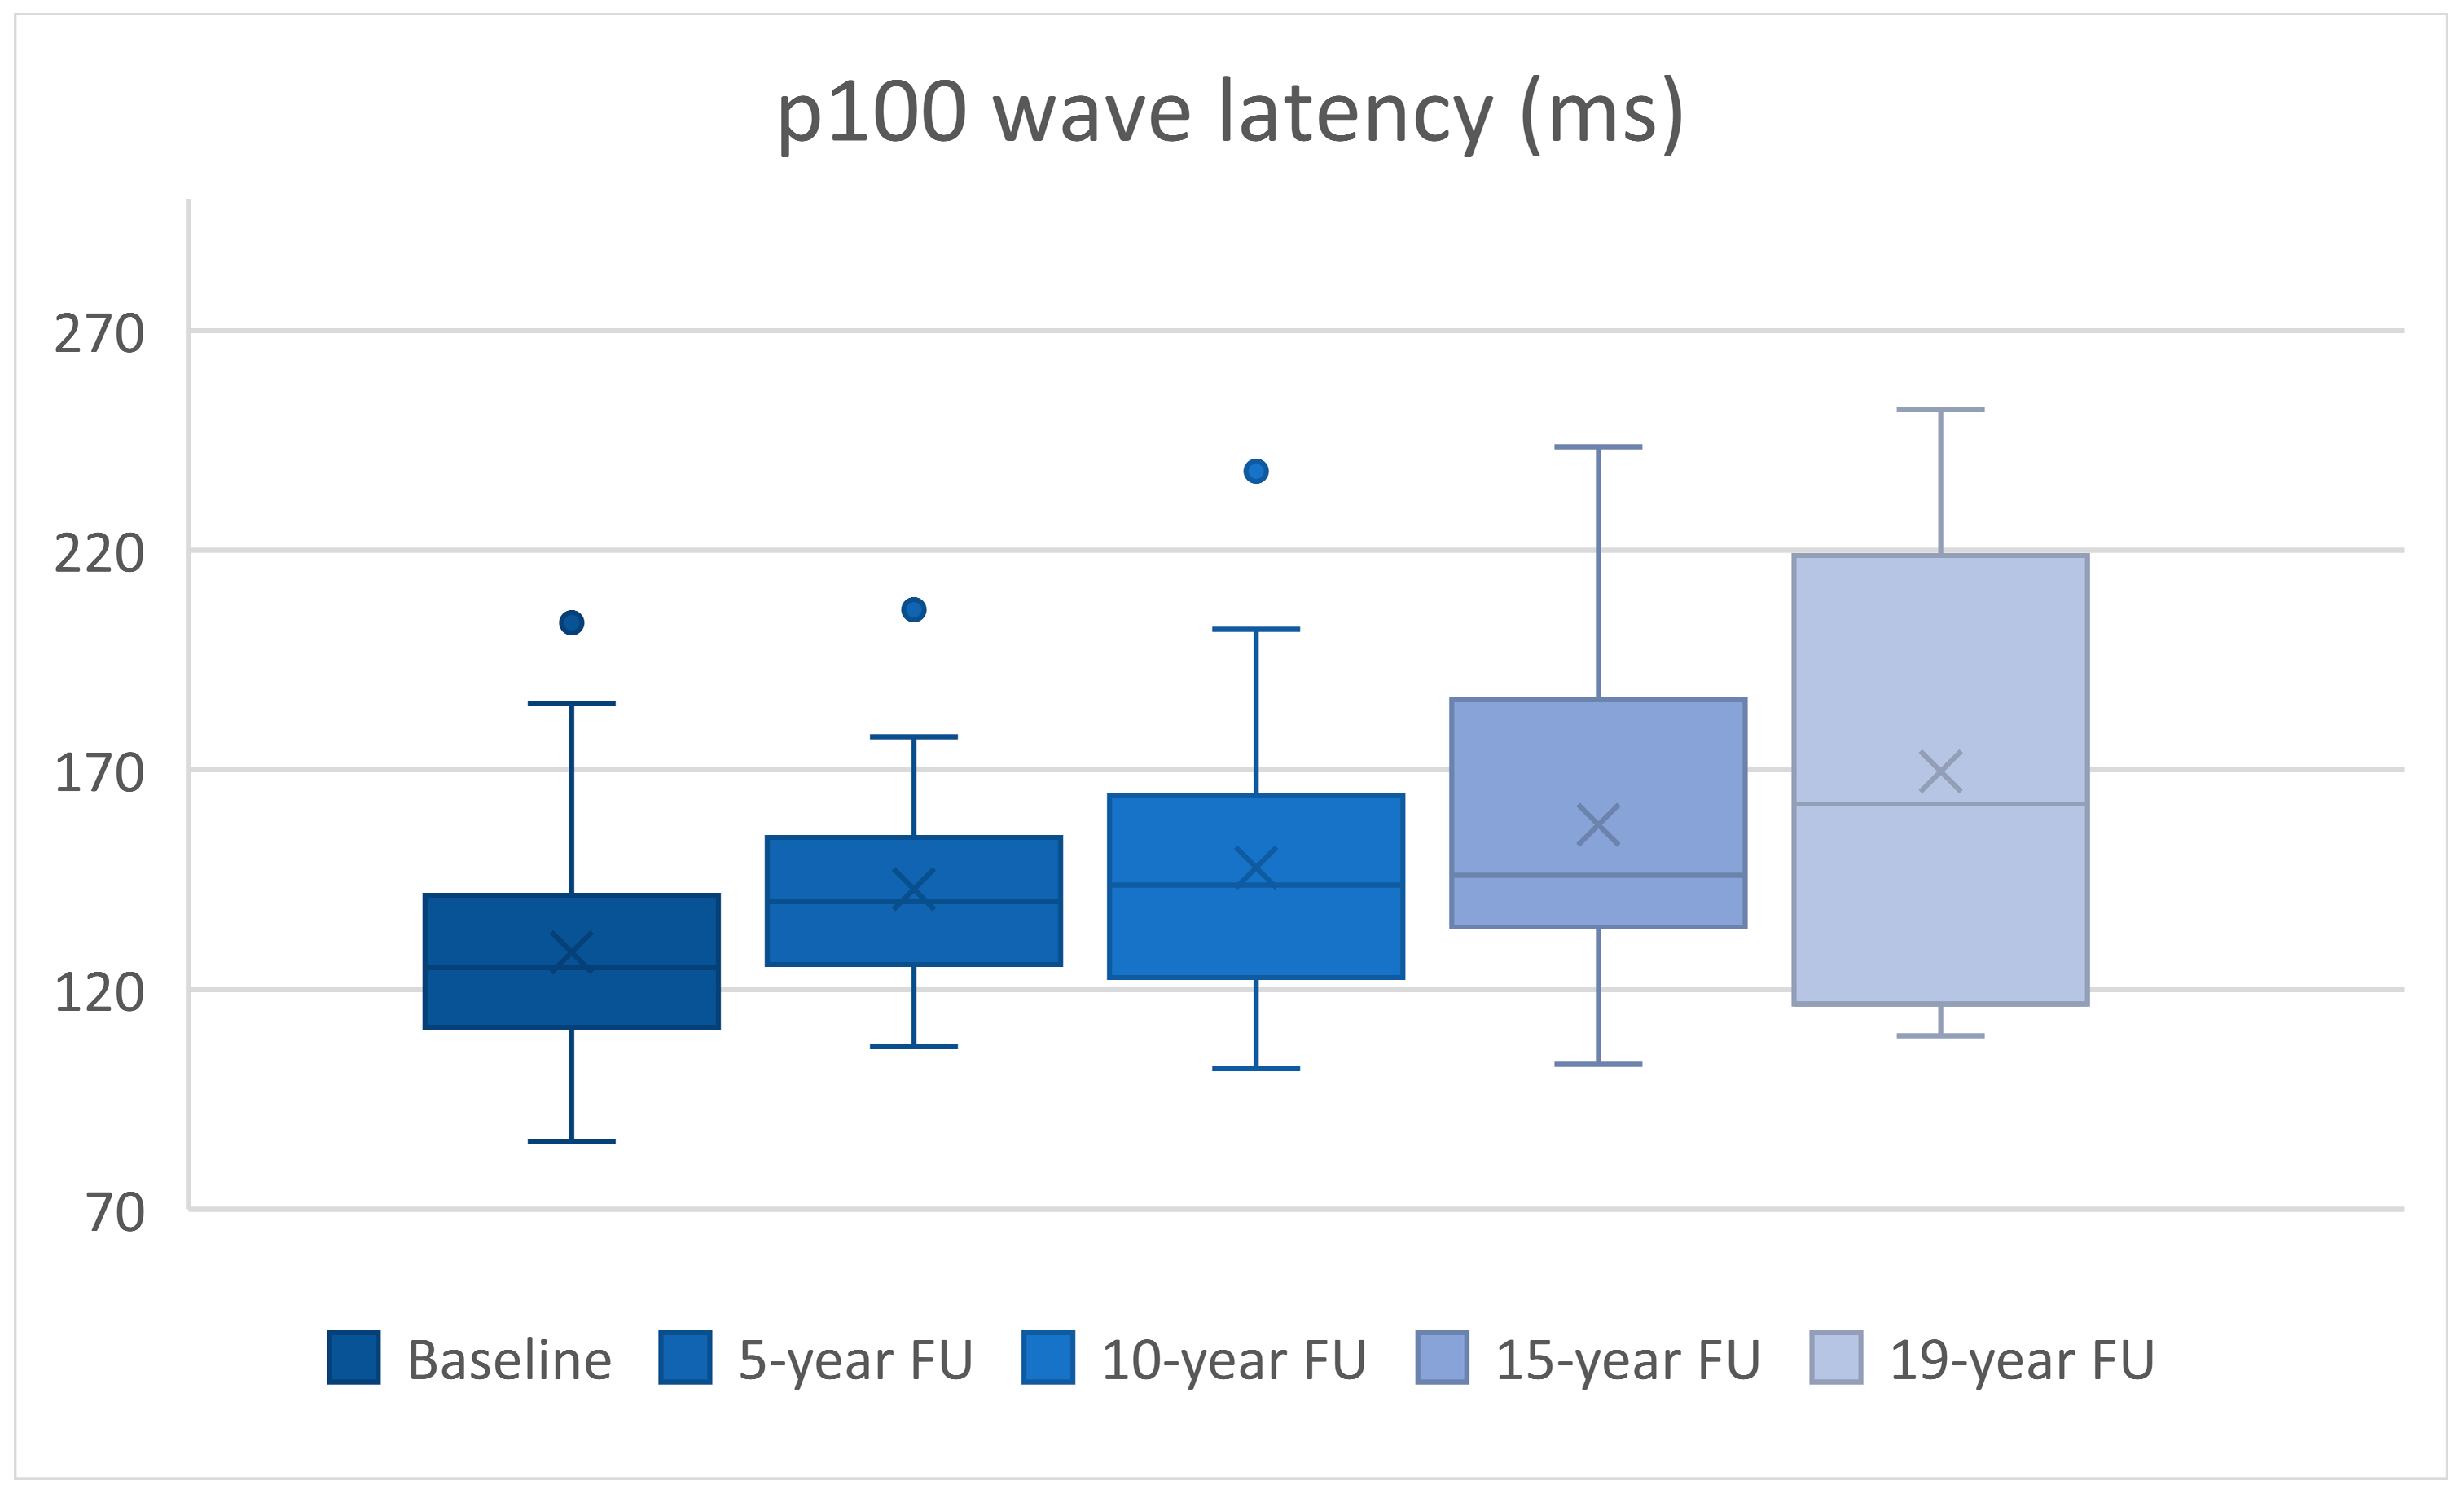
| n | Latency (ms) | p | Amplitude (mV) | p | |
|---|---|---|---|---|---|
| Baseline vs. 5-year FU | 30 | 14.35 ± 4.47 | p = 0.003 | 0.68 ± 0.43 | p = 0.123 |
| Baseline vs. 10-year FU | 30 | 19.26 ± 4.87 | p < 0.0005 | 2.29 ± 0.52 | p < 0.0005 |
| Baseline vs. 15-year FU | 24 | 31.39 ± 7.8 | p = 0.001 | 2.51 ± 0.6 | p < 0.0005 |
| Baseline vs. 19-year FU | 10 | 53.45 ± 18.42 | p = 0.018 | 4.06 ± 1.32 | p = 0.014 |
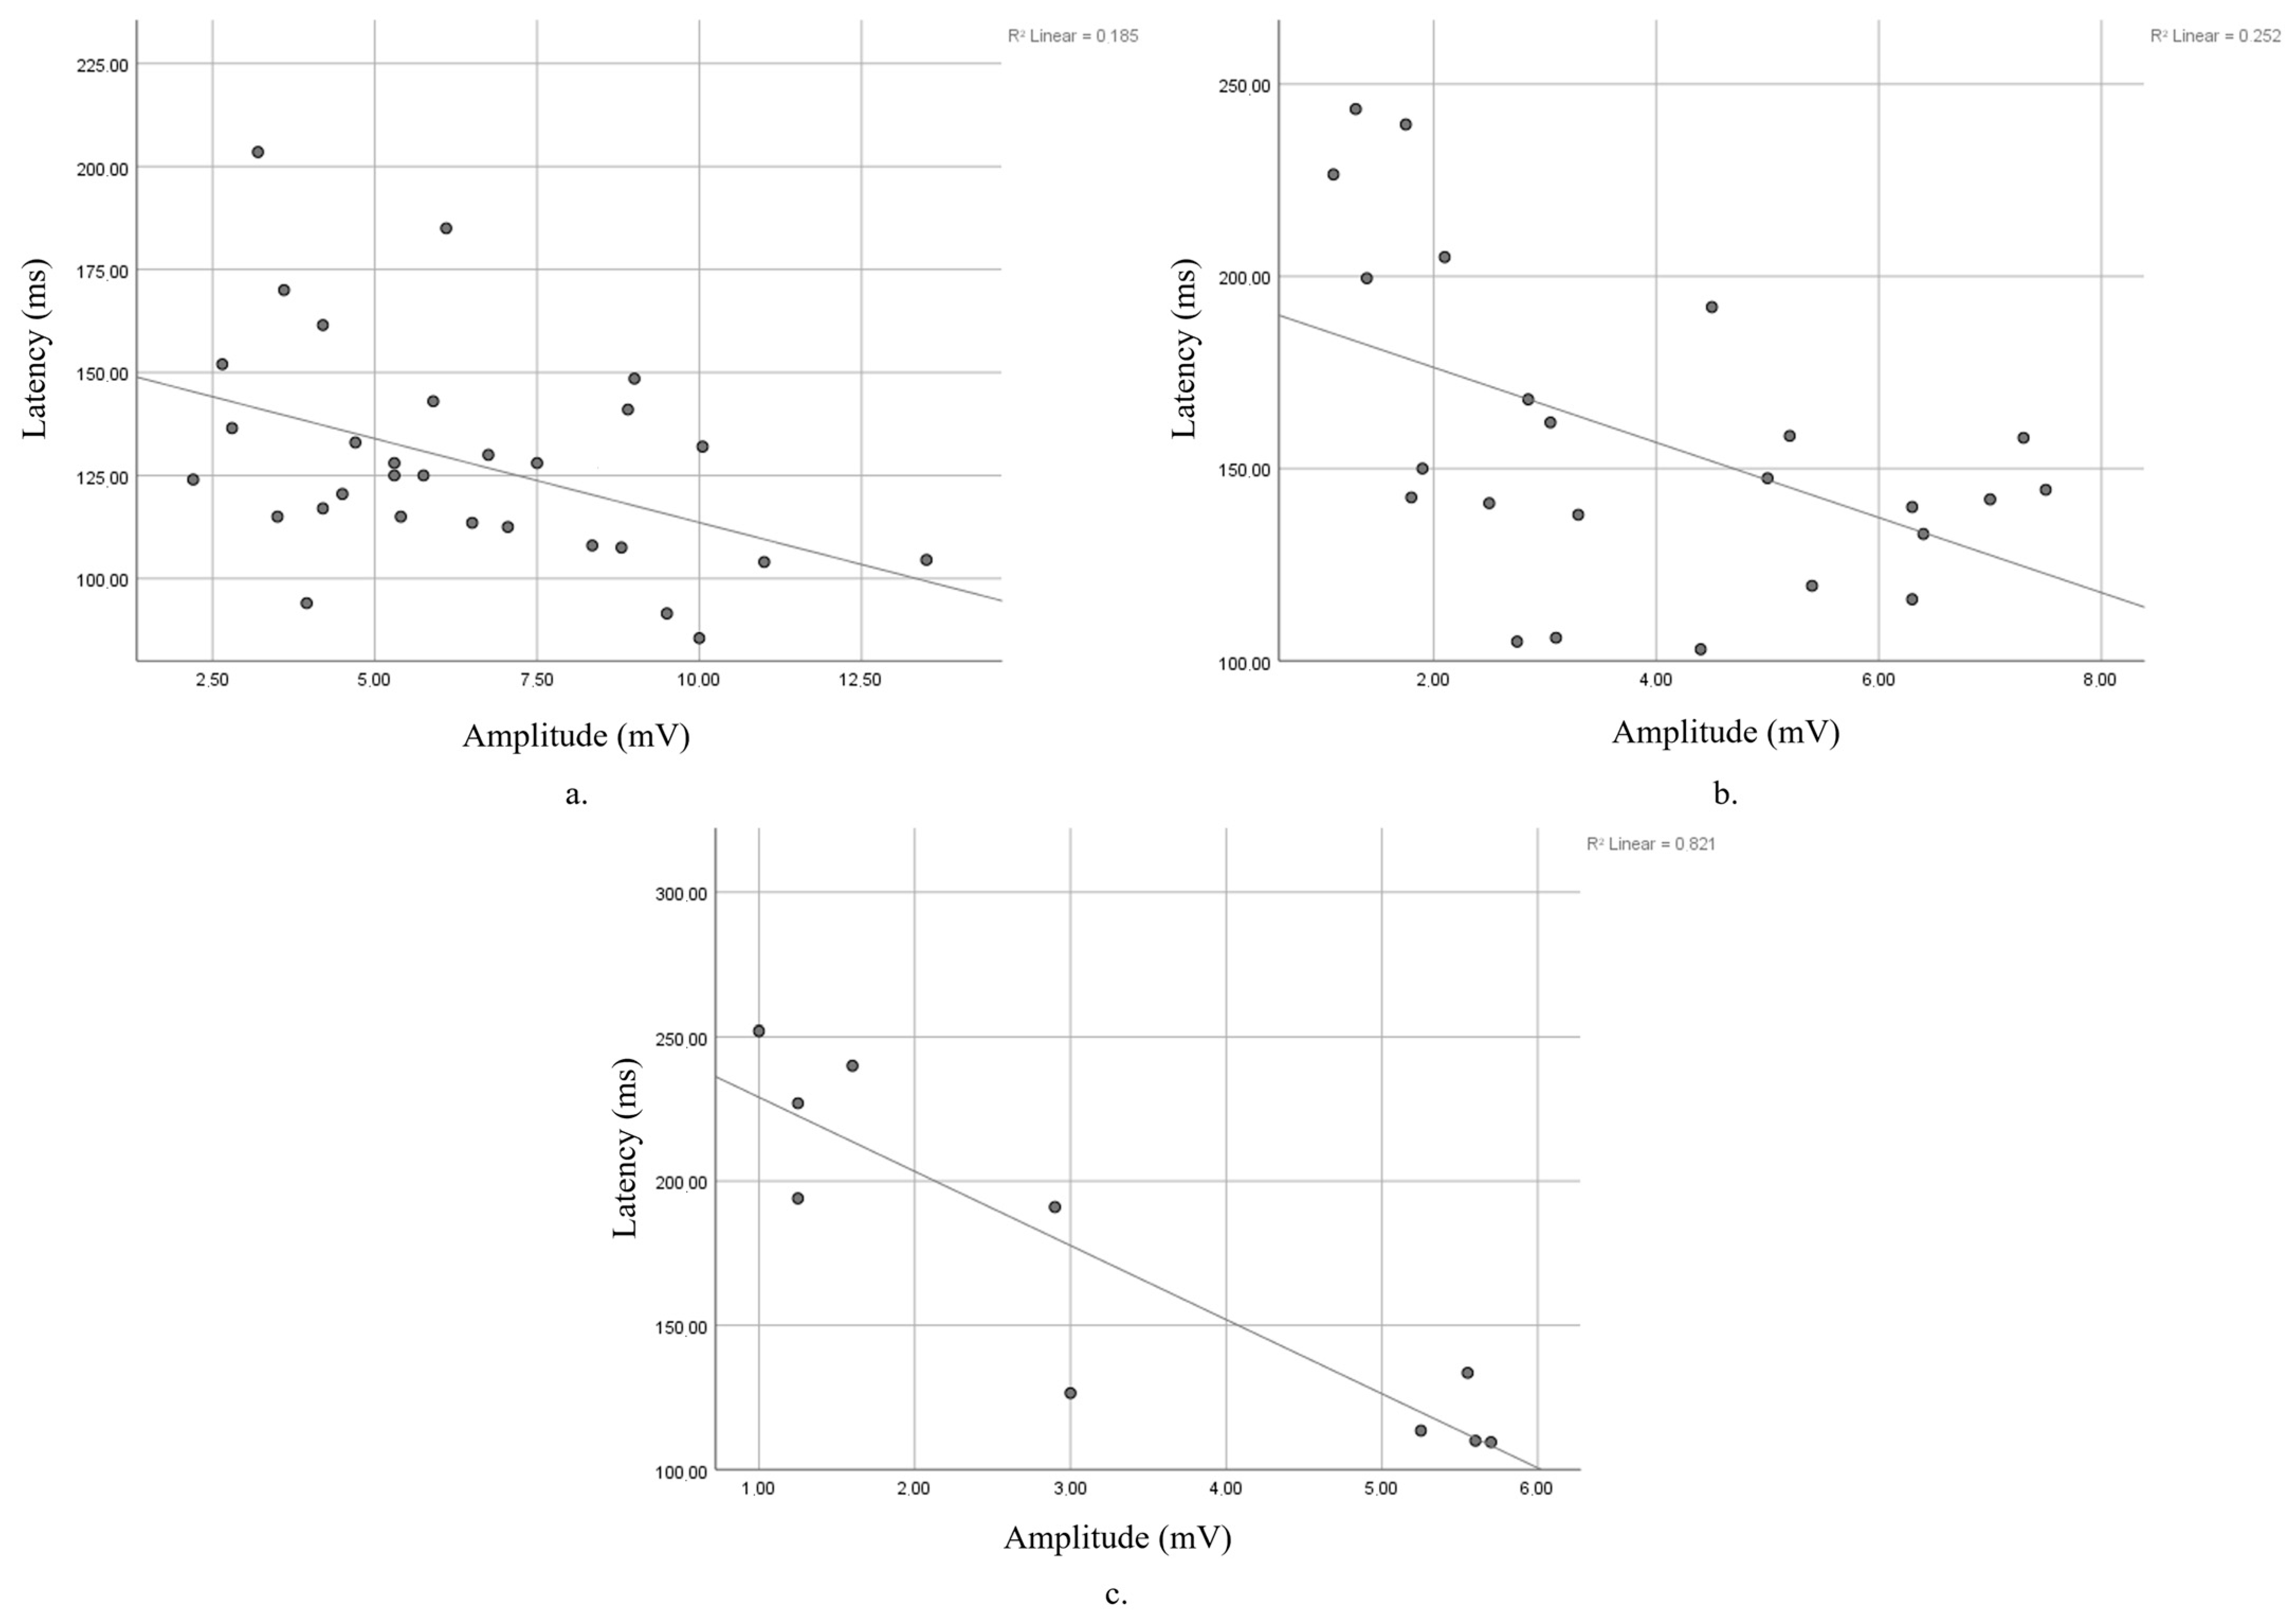
| n | r | p | |
|---|---|---|---|
| Baseline | 30 | −0.43 | p = 0.018 |
| 5-year FU | 30 | −0.225 | p = 0.232 |
| 10-year FU | 30 | −0.251 | p = 0.181 |
| 15-year FU | 24 | −0.502 | p = 0.012 |
| 19-year FU | 10 | −0.906 | p < 0.0005 |
Disclaimer/Publisher’s Note: The statements, opinions and data contained in all publications are solely those of the individual author(s) and contributor(s) and not of MDPI and/or the editor(s). MDPI and/or the editor(s) disclaim responsibility for any injury to people or property resulting from any ideas, methods, instructions or products referred to in the content. |
© 2025 by the authors. Licensee MDPI, Basel, Switzerland. This article is an open access article distributed under the terms and conditions of the Creative Commons Attribution (CC BY) license (https://creativecommons.org/licenses/by/4.0/).
Share and Cite
Ciapă, M.A.; Donica, V.C.; Costea, C.F.; Bogdănici, C.M. Longitudinal Analysis of P100 Wave Amplitude and Latency in Multiple Sclerosis: A 19-Year Retrospective VEP Study. Diagnostics 2025, 15, 1189. https://doi.org/10.3390/diagnostics15101189
Ciapă MA, Donica VC, Costea CF, Bogdănici CM. Longitudinal Analysis of P100 Wave Amplitude and Latency in Multiple Sclerosis: A 19-Year Retrospective VEP Study. Diagnostics. 2025; 15(10):1189. https://doi.org/10.3390/diagnostics15101189
Chicago/Turabian StyleCiapă, Manuela Andreea, Vlad Constantin Donica, Claudia Florida Costea, and Camelia Margareta Bogdănici. 2025. "Longitudinal Analysis of P100 Wave Amplitude and Latency in Multiple Sclerosis: A 19-Year Retrospective VEP Study" Diagnostics 15, no. 10: 1189. https://doi.org/10.3390/diagnostics15101189
APA StyleCiapă, M. A., Donica, V. C., Costea, C. F., & Bogdănici, C. M. (2025). Longitudinal Analysis of P100 Wave Amplitude and Latency in Multiple Sclerosis: A 19-Year Retrospective VEP Study. Diagnostics, 15(10), 1189. https://doi.org/10.3390/diagnostics15101189