
Machine Learning Approach for Analyzing 3-Year Outcomes of Patients with Brain Arteriovenous Malformation (AVM) after Stereotactic Radiosurgery (SRS)

 ,
, 
 ,
,
Abstract
:1. Introduction
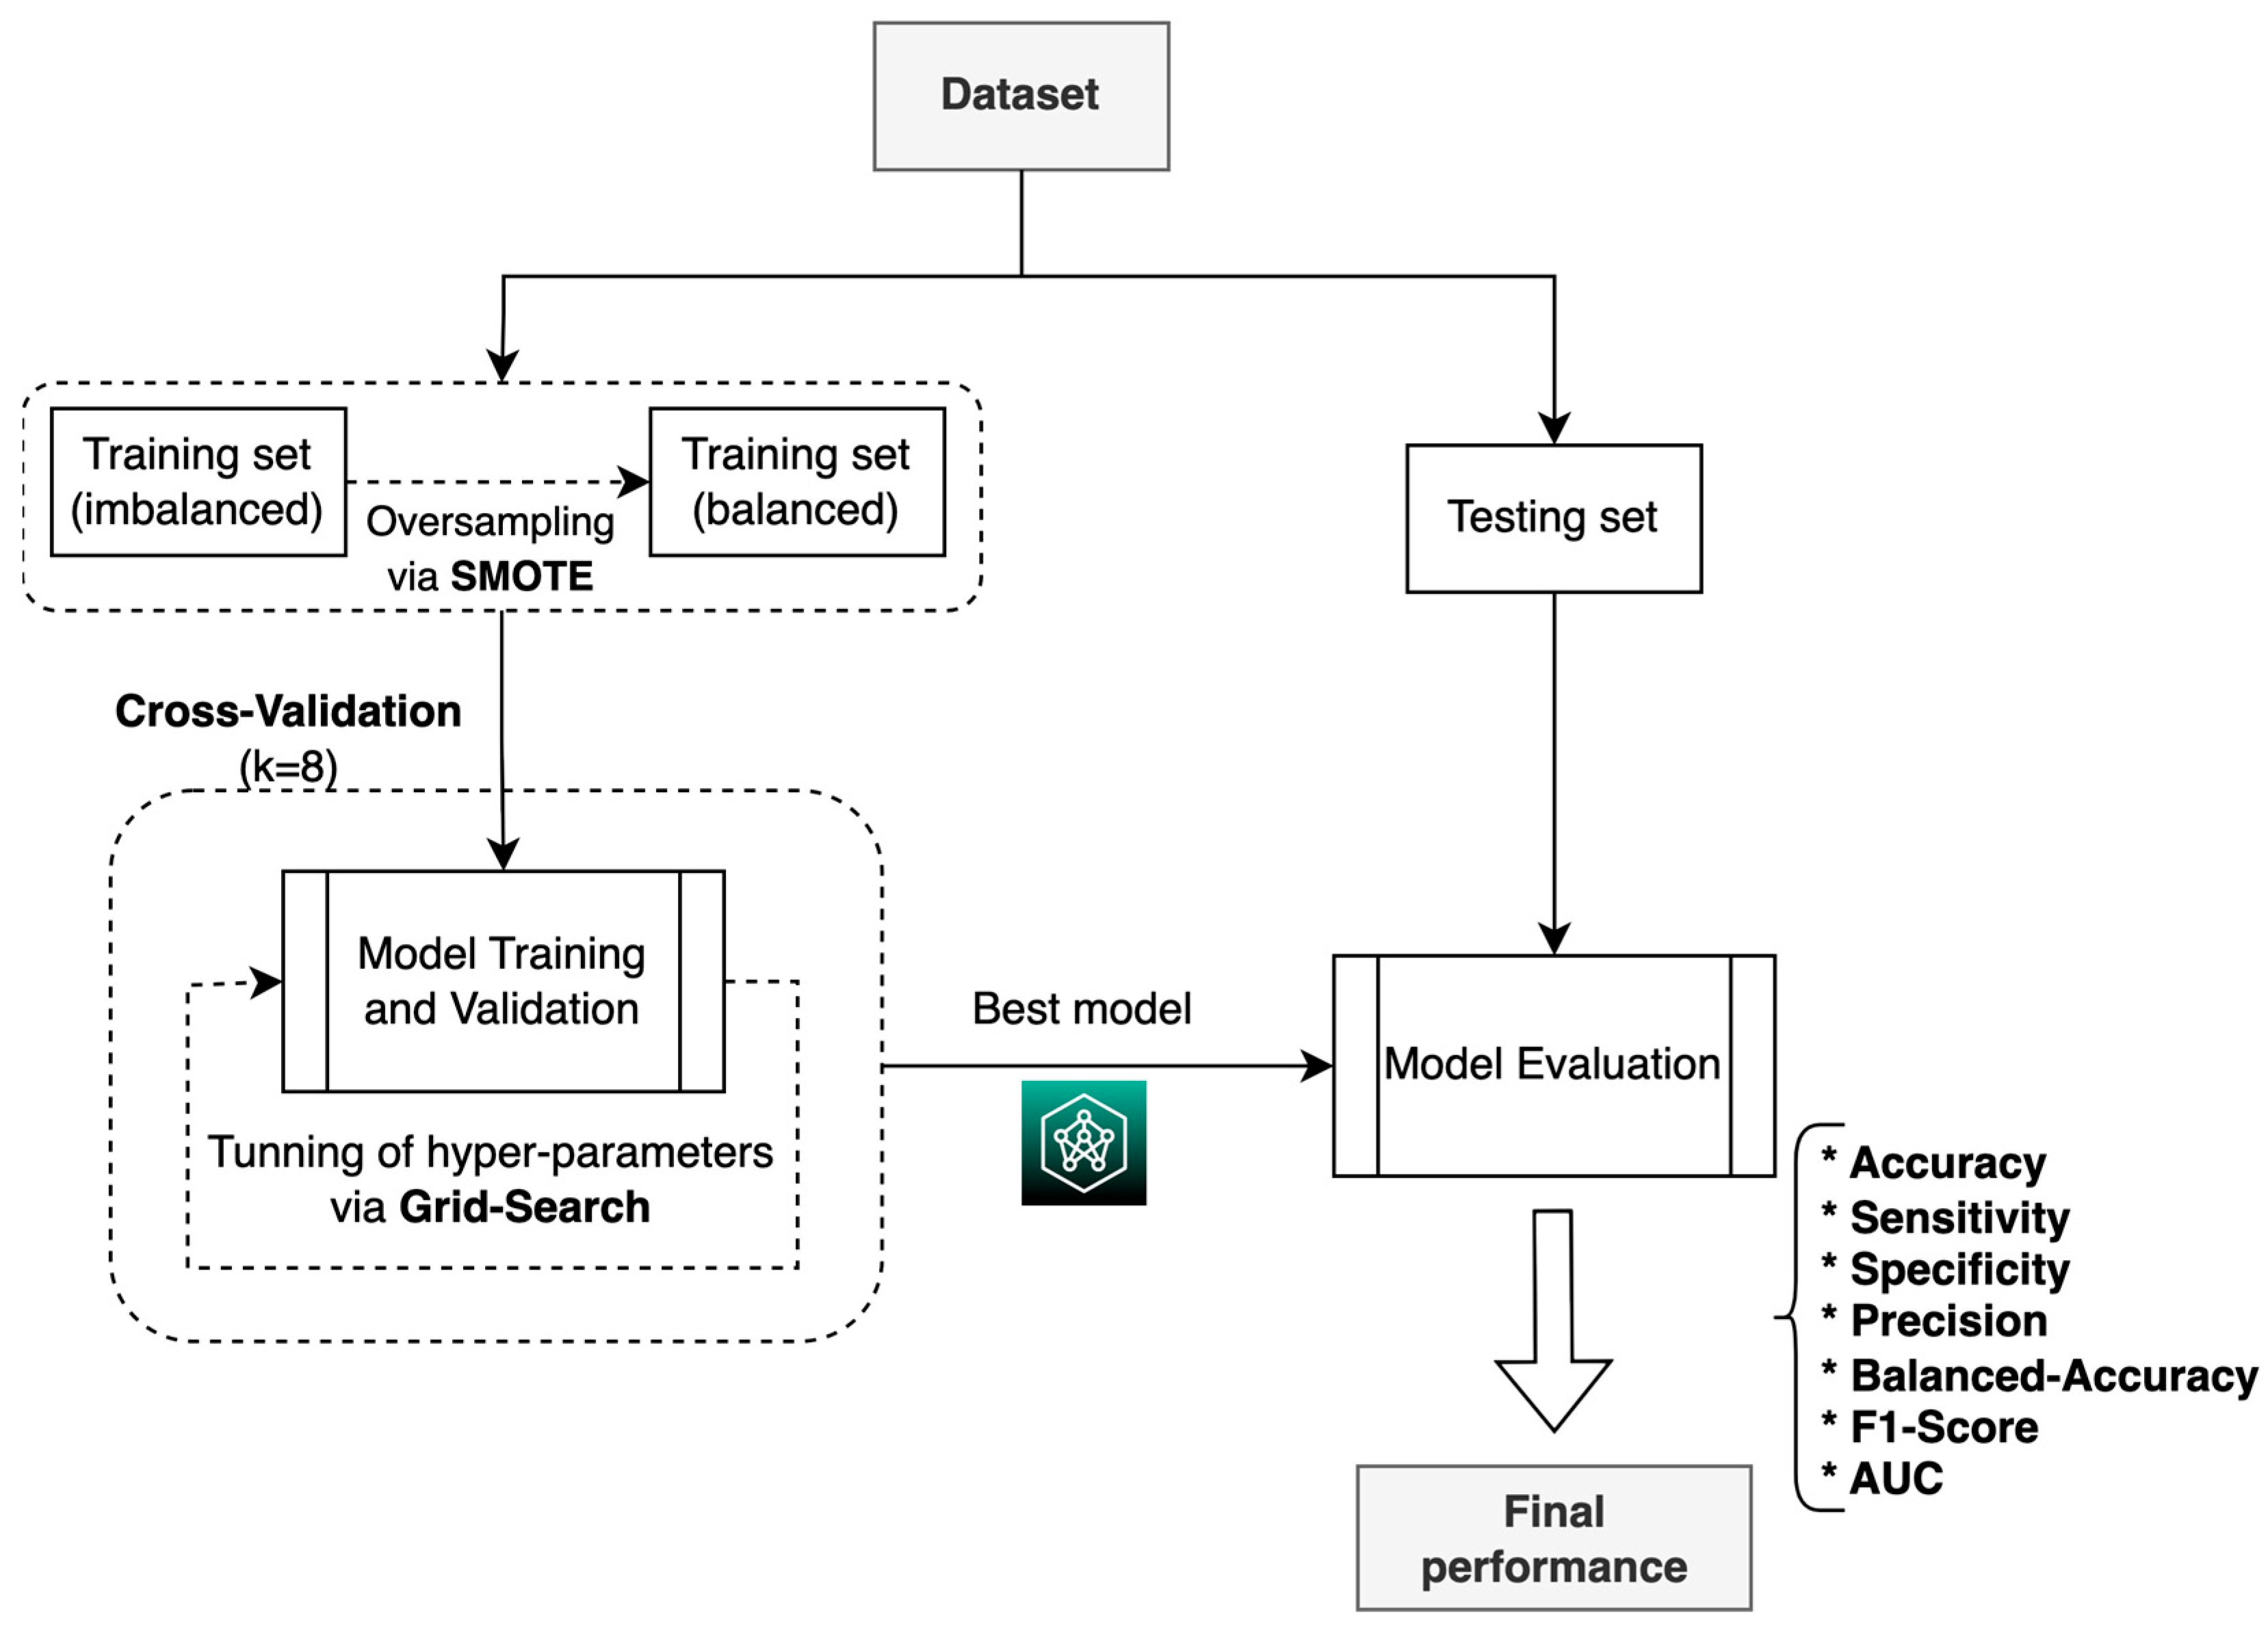
2. Materials and Methods
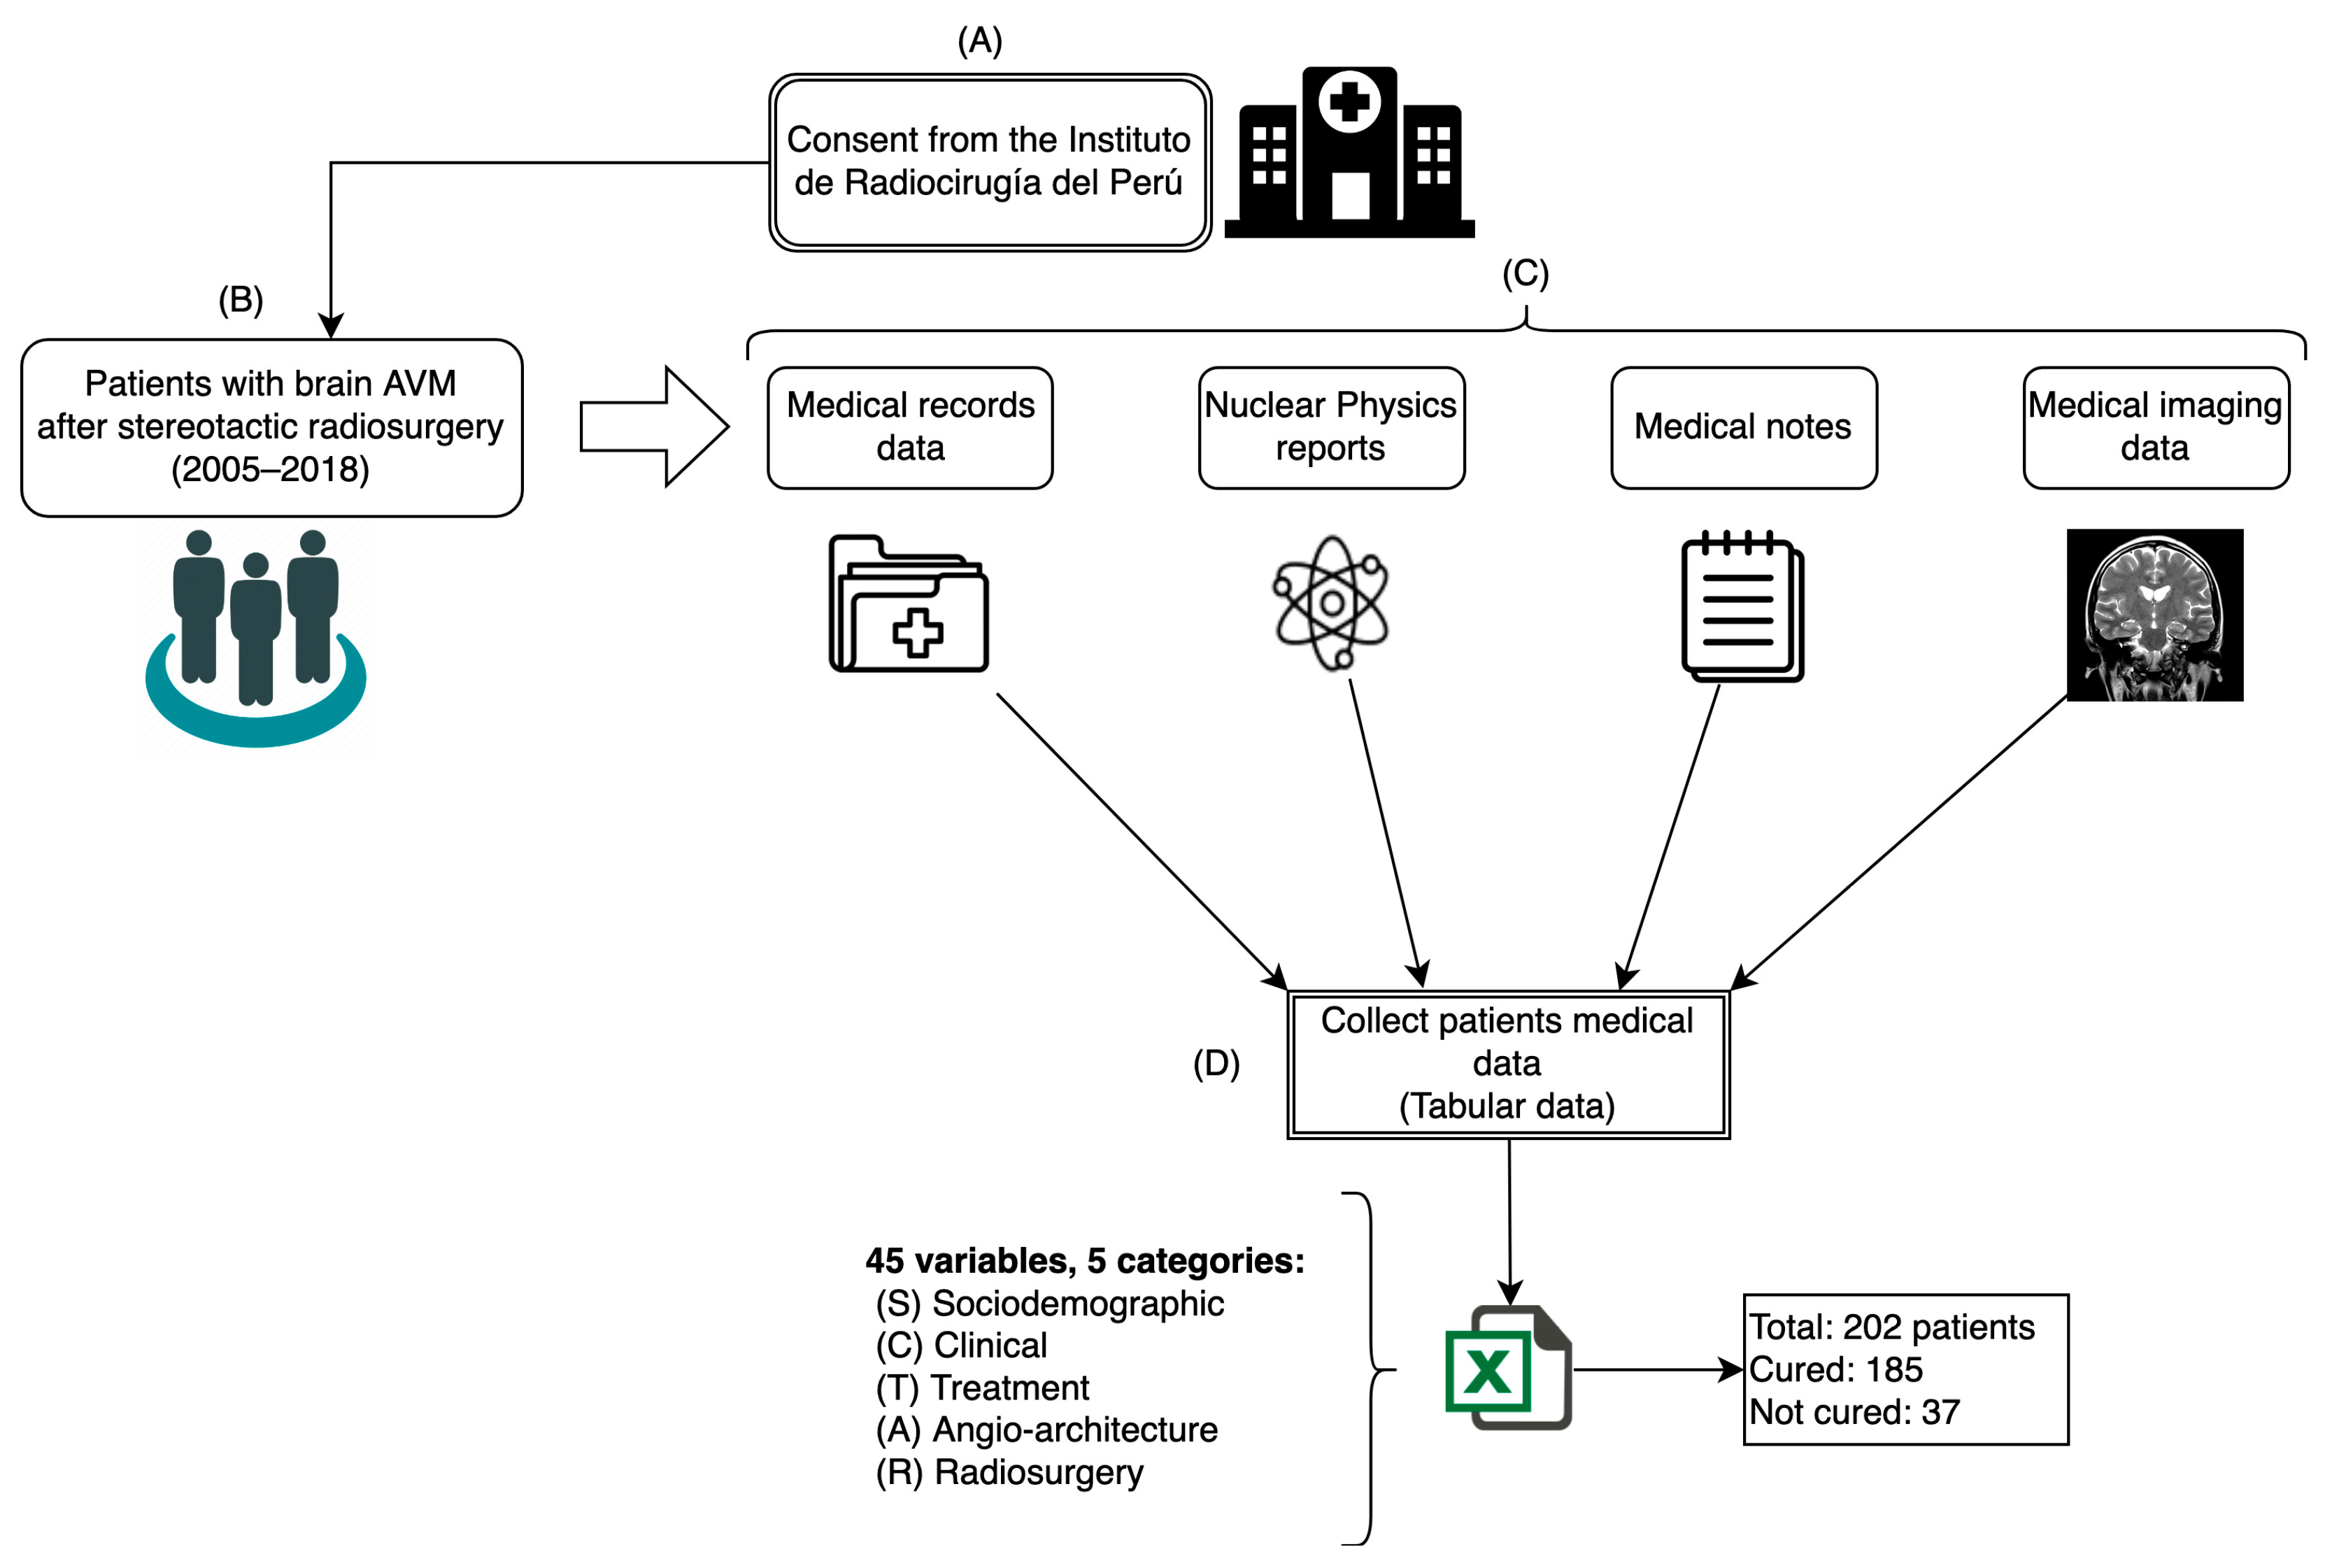
2.1. Dataset
2.2. Data Preprocessing
2.2.1. Variable Selection
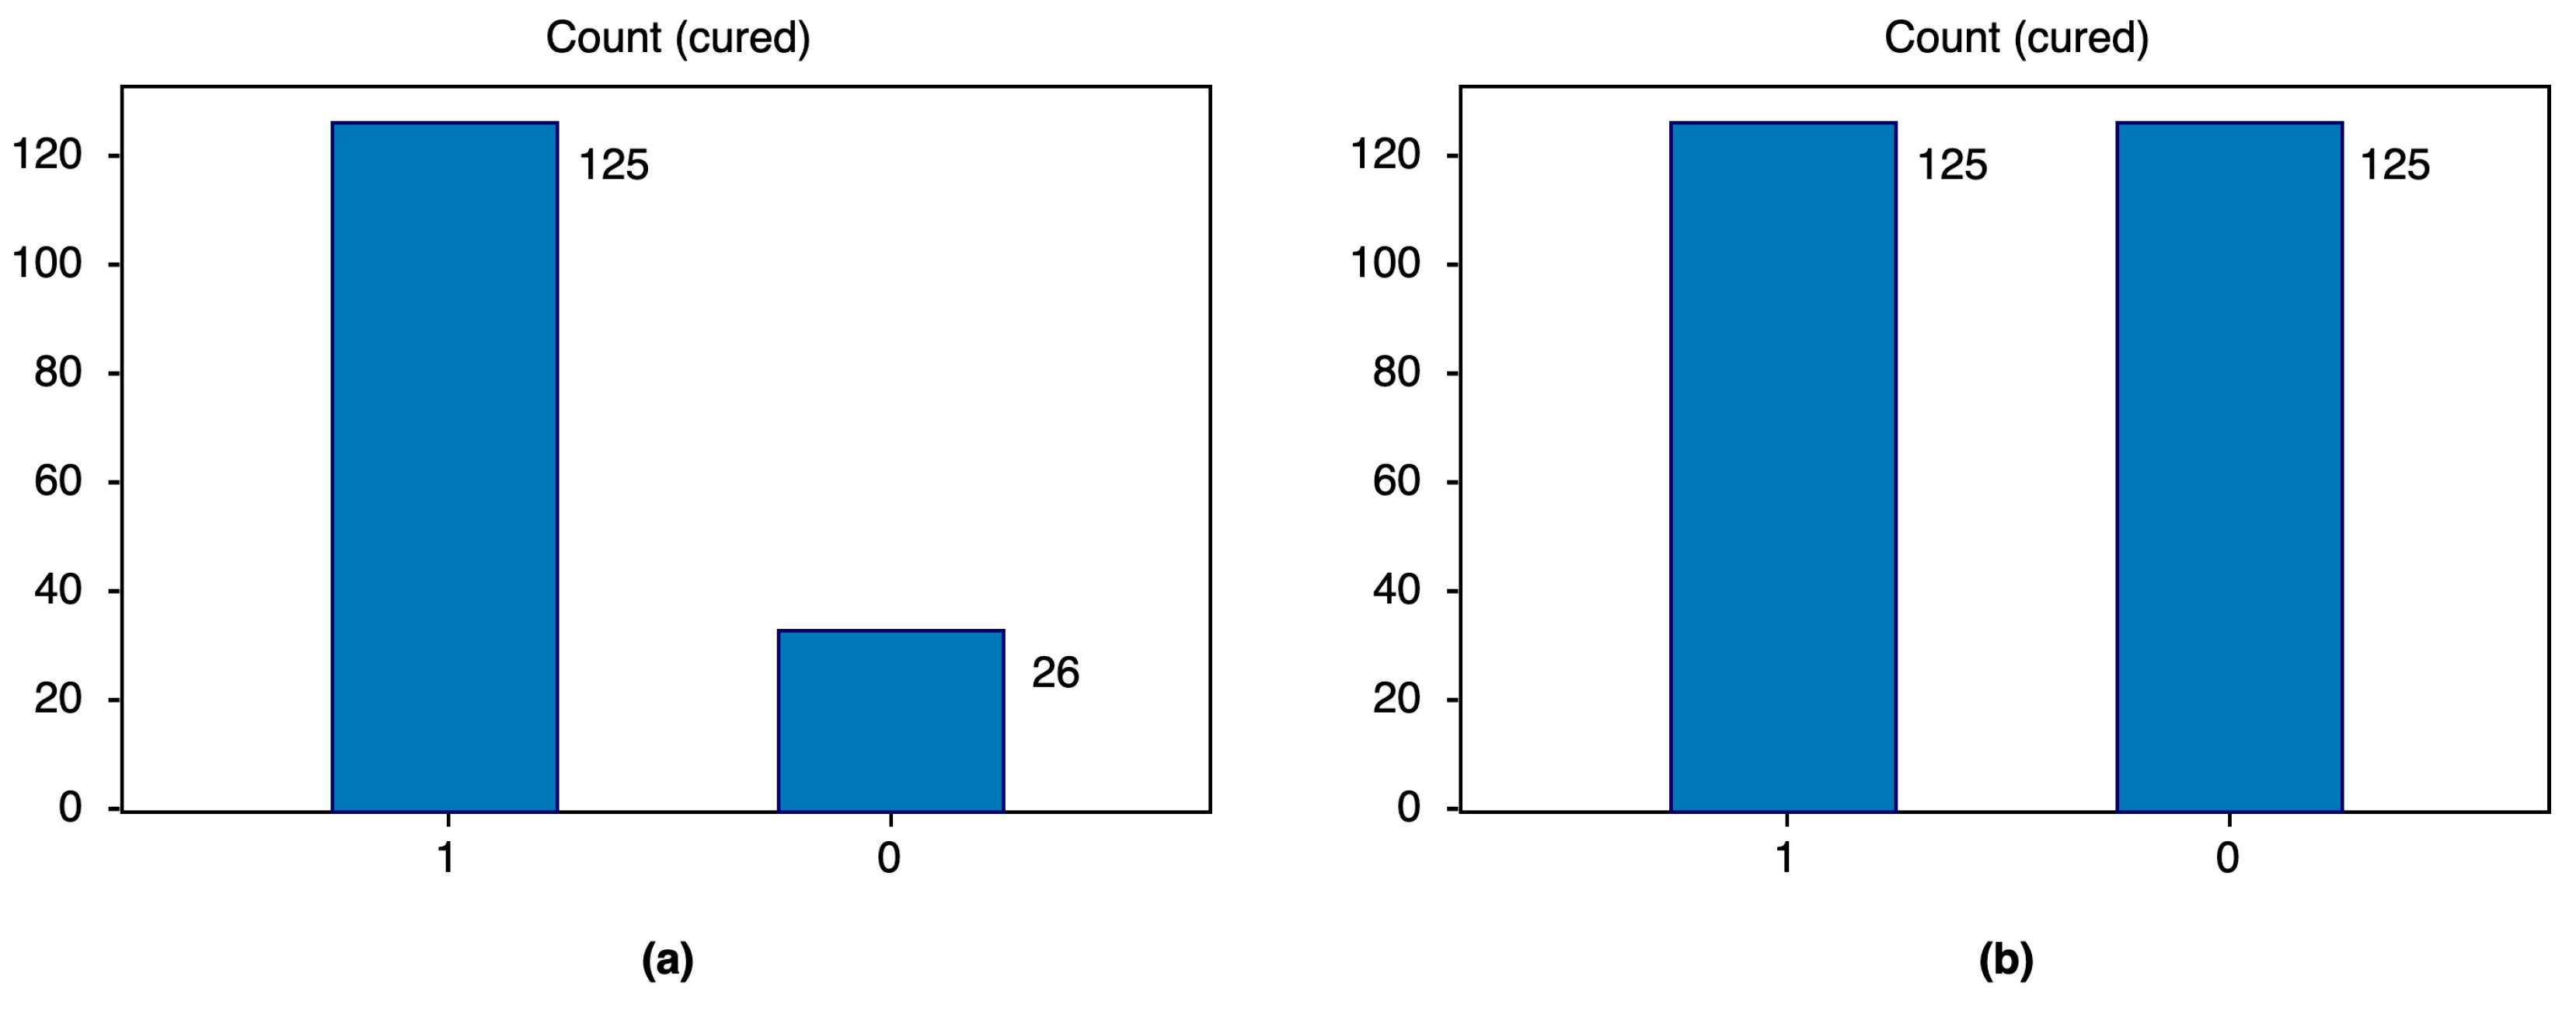
2.2.2. Data Balancing
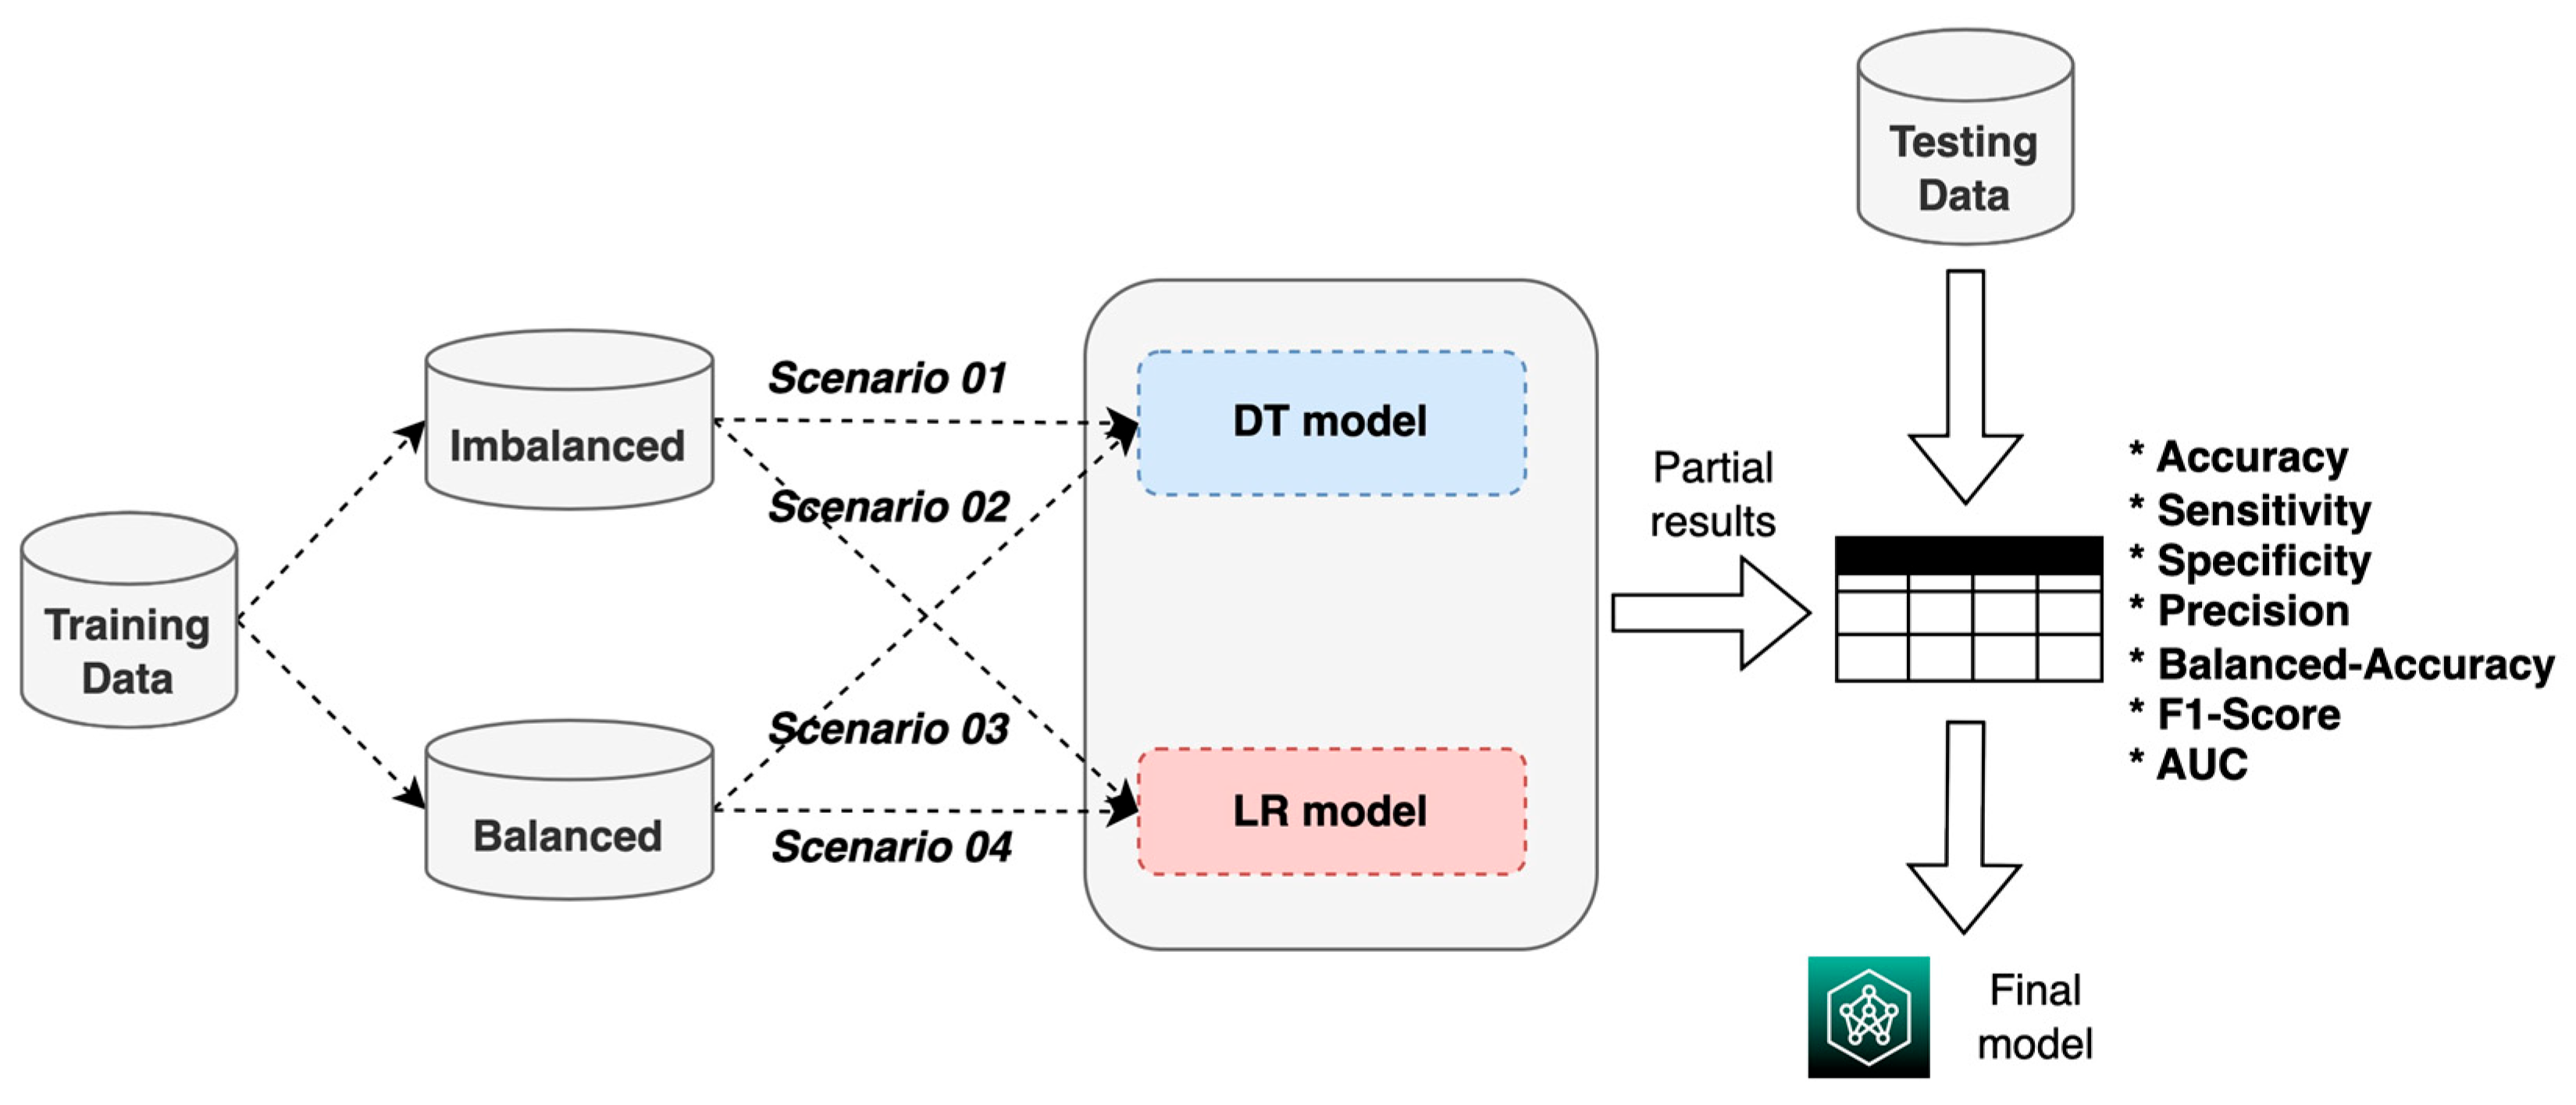
2.3. Machine Learning Models
3. Results
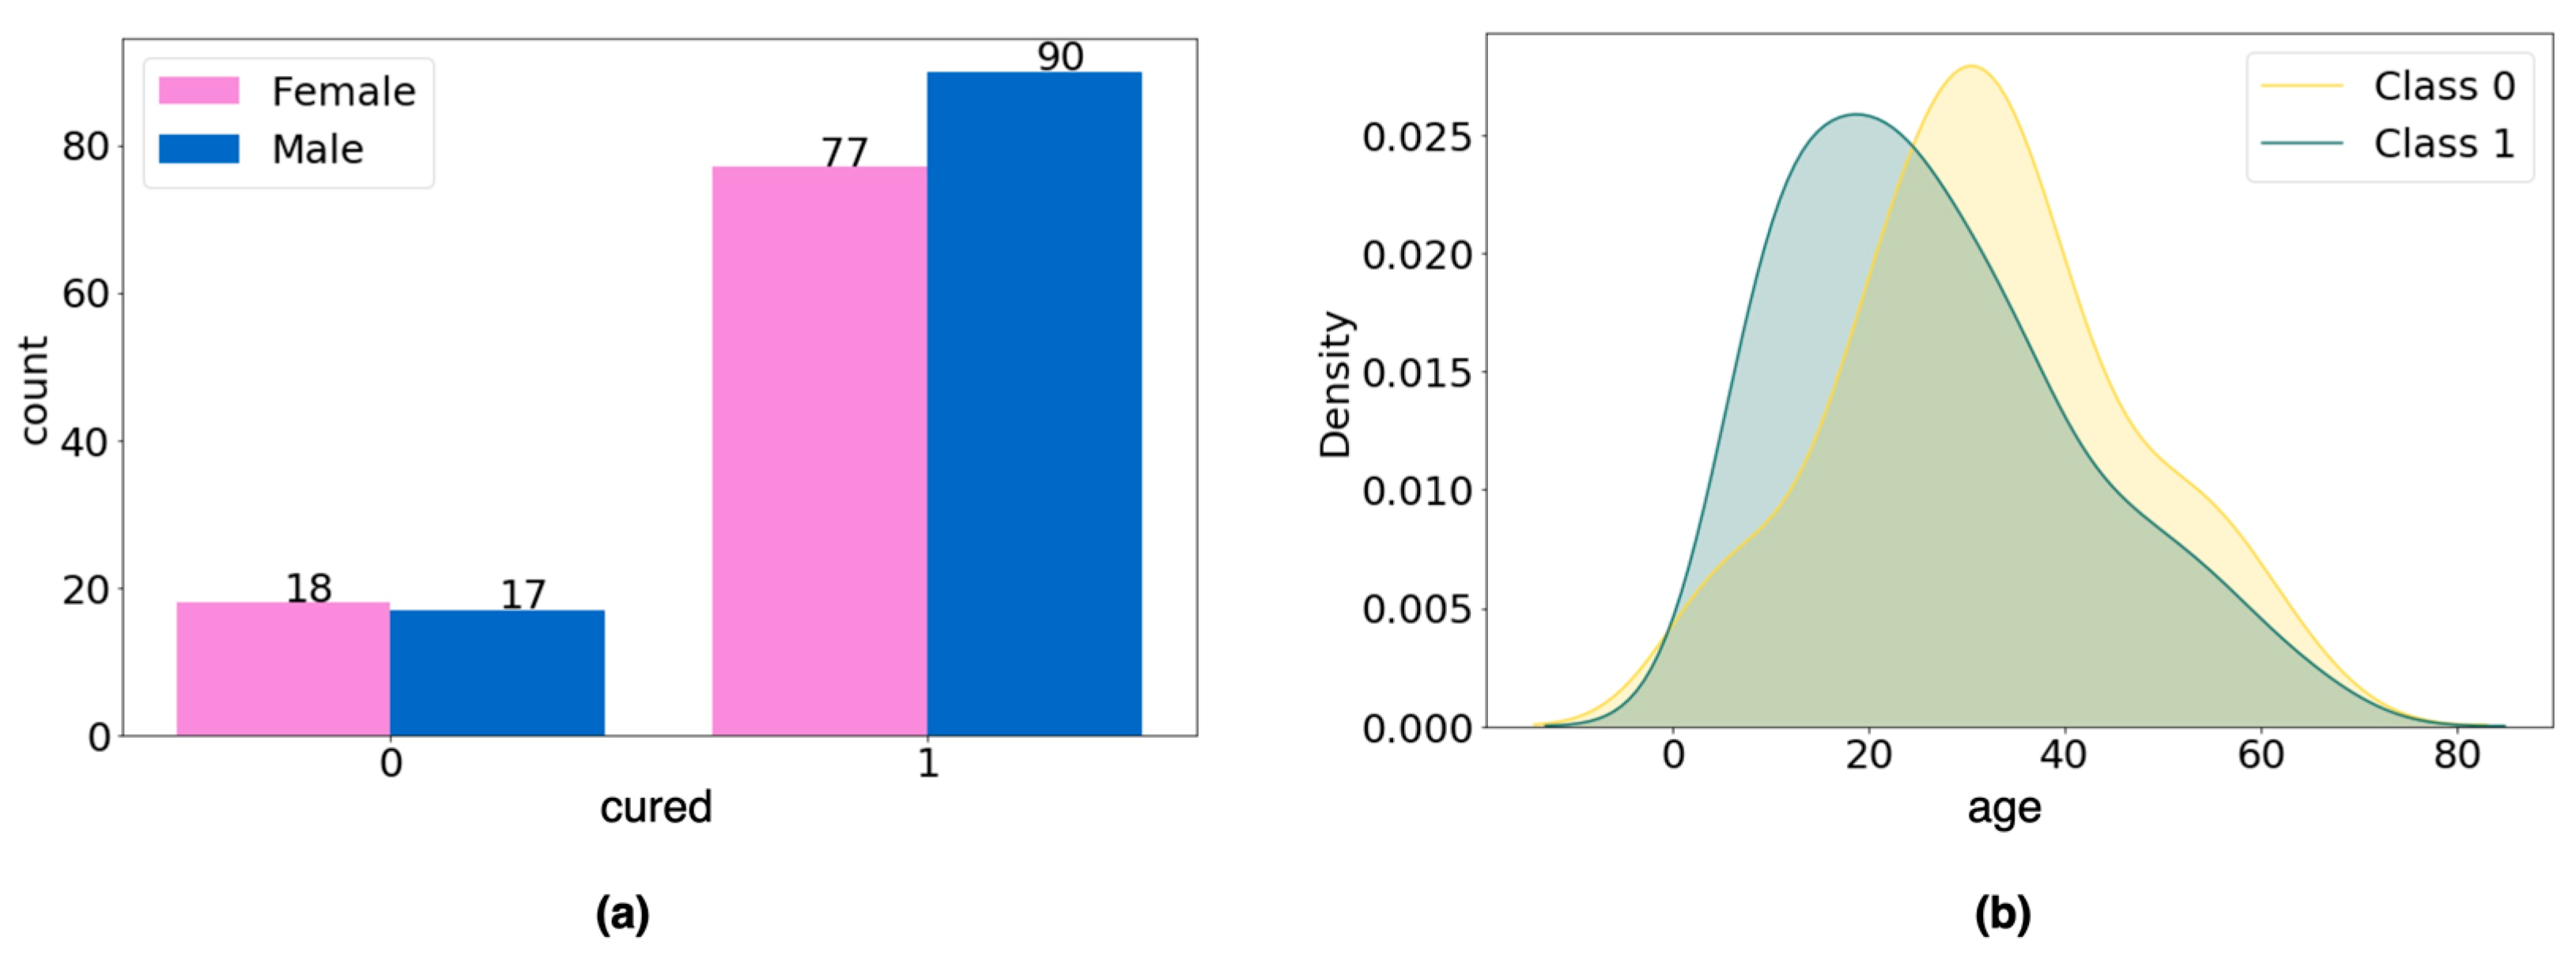
3.1. Study Population
3.2. Performance of Prediction Models
3.3. Explainability of Models
4. Discussion
Supplementary Materials
Author Contributions
Funding
Institutional Review Board Statement
Informed Consent Statement
Data Availability Statement
Conflicts of Interest
References
- Solomon, R.A.; Connolly, E.S. Arteriovenous Malformations of the Brain. N. Engl. J. Med. 2017, 376, 1859–1866. [Google Scholar] [CrossRef] [PubMed]
- Friedman, W.A.; Bova, F.J. Radiosurgery for Arteriovenous Malformations. Neurol. Res. 2011, 33, 803–819. [Google Scholar] [CrossRef] [PubMed]
- Plasencia, A.R.; Santillan, A. Embolization and Radiosurgery for Arteriovenous Malformations. Surg. Neurol. Int. 2012, 3, S90–S104. [Google Scholar] [CrossRef] [PubMed]
- Ding, D.; Liu, K.C. Predictive Capability of the Spetzler-Martin versus Supplementary Grading Scale for Microsurgical Outcomes of Cerebellar Arteriovenous Malformations. J. Cerebrovasc. Endovasc. Neurosurg. 2013, 15, 307–310. [Google Scholar] [CrossRef] [PubMed]
- Kim, H.; Abla, A.A.; Nelson, J.; McCulloch, C.E.; Bervini, D.; Morgan, M.K.; Stapleton, C.; Walcott, B.P.; Ogilvy, C.S.; Spetzler, R.F.; et al. Validation of the Supplemented Spetzler-Martin Grading System for Brain Arteriovenous Malformations in a Multicenter Cohort of 1009 Surgical Patients. Neurosurgery 2015, 76, 25–31. [Google Scholar] [CrossRef] [PubMed]
- Starke, R.M.; Yen, C.-P.; Ding, D.; Sheehan, J.P. A Practical Grading Scale for Predicting Outcome after Radiosurgery for Arteriovenous Malformations: Analysis of 1012 Treated Patients. J. Neurosurg. 2013, 119, 981–987. [Google Scholar] [CrossRef]
- Segato, A.; Marzullo, A.; Calimeri, F.; De Momi, E. Artificial Intelligence for Brain Diseases: A Systematic Review. APL Bioeng. 2020, 4, 041503. [Google Scholar] [CrossRef] [PubMed]
- Basu, K.; Sinha, R.; Ong, A.; Basu, T. Artificial Intelligence: How Is It Changing Medical Sciences and Its Future? Indian J. Dermatol. 2020, 65, 365–370. [Google Scholar] [CrossRef]
- Senders, J.T.; Staples, P.C.; Karhade, A.V.; Zaki, M.M.; Gormley, W.B.; Broekman, M.L.D.; Smith, T.R.; Arnaout, O. Machine Learning and Neurosurgical Outcome Prediction: A Systematic Review. World Neurosurg. 2018, 109, 476–486.e1. [Google Scholar] [CrossRef]
- Yang, Y.J.; Bang, C.S. Application of Artificial Intelligence in Gastroenterology. World J. Gastroenterol. 2019, 25, 1666–1683. [Google Scholar] [CrossRef]
- Panesar, S.S.; D’Souza, R.N.; Yeh, F.-C.; Fernandez-Miranda, J.C. Machine Learning Versus Logistic Regression Methods for 2-Year Mortality Prognostication in a Small, Heterogeneous Glioma Database. World Neurosurg. X 2019, 2, 100012. [Google Scholar] [CrossRef] [PubMed]
- Marcus, J.L.; Sewell, W.C.; Balzer, L.B.; Krakower, D.S. Artificial Intelligence and Machine Learning for HIV Prevention: Emerging Approaches to Ending the Epidemic. Curr. HIV/AIDS Rep. 2020, 17, 171–179. [Google Scholar] [CrossRef] [PubMed]
- Vega-Huerta, H.; Villanueva-Alarcón, R.; Mauricio, D.; Moreno, J.G.; Vilca, H.D.C.; Rodriguez, D.; Rodriguez, C. Convolutional Neural Networks on Assembling Classification Models to Detect Melanoma Skin Cancer. Int. J. Online Biomed. Eng. IJOE 2022, 18, 59–76. [Google Scholar] [CrossRef]
- Uspenskaya-Cadoz, O.; Alamuri, C.; Wang, L.; Yang, M.; Khinda, S.; Nigmatullina, Y.; Cao, T.; Kayal, N.; O’Keefe, M.; Rubel, C. Machine Learning Algorithm Helps Identify Non-Diagnosed Prodromal Alzheimer’s Disease Patients in the General Population. J. Prev. Alzheimers Dis. 2019, 6, 185–191. [Google Scholar] [CrossRef] [PubMed]
- Ghafouri-Fard, S.; Taheri, M.; Omrani, M.D.; Daaee, A.; Mohammad-Rahimi, H. Application of Artificial Neural Network for Prediction of Risk of Multiple Sclerosis Based on Single Nucleotide Polymorphism Genotypes. J. Mol. Neurosci. MN 2020, 70, 1081–1087. [Google Scholar] [CrossRef] [PubMed]
- Tao, W.; Yan, L.; Zeng, M.; Chen, F. Factors Affecting the Performance of Brain Arteriovenous Malformation Rupture Prediction Models. BMC Med. Inform. Decis. Mak. 2021, 21, 142. [Google Scholar] [CrossRef] [PubMed]
- Hong, J.-S.; Lin, C.-J.; Lin, Y.-H.; Lee, C.-C.; Yang, H.-C.; Meng, L.-H.; Lin, T.-M.; Hu, Y.-S.; Guo, W.-Y.; Chu, W.-F.; et al. Machine Learning Application with Quantitative Digital Subtraction Angiography for Detection of Hemorrhagic Brain Arteriovenous Malformations. EEE Access 2020, 8, 204573–204584. [Google Scholar] [CrossRef]
- Wang, T.; Lei, Y.; Tian, S.; Jiang, X.; Zhou, J.; Liu, T.; Dresser, S.; Curran, W.J.; Shu, H.-K.; Yang, X. Learning-Based Automatic Segmentation of Arteriovenous Malformations on Contrast CT Images in Brain Stereotactic Radiosurgery. Med. Phys. 2019, 46, 3133–3141. [Google Scholar] [CrossRef]
- Asadi, H.; Kok, H.K.; Looby, S.; Brennan, P.; O’Hare, A.; Thornton, J. Outcomes and Complications After Endovascular Treatment of Brain Arteriovenous Malformations: A Prognostication Attempt Using Artificial Intelligence. World Neurosurg. 2016, 96, 562–569.e1. [Google Scholar] [CrossRef]
- Oermann, E.K.; Rubinsteyn, A.; Ding, D.; Mascitelli, J.; Starke, R.M.; Bederson, J.B.; Kano, H.; Lunsford, L.D.; Sheehan, J.P.; Hammerbacher, J.; et al. Using a Machine Learning Approach to Predict Outcomes after Radiosurgery for Cerebral Arteriovenous Malformations. Sci. Rep. 2016, 6, 21161. [Google Scholar] [CrossRef]
- Loyola-González, O. Black-Box vs. White-Box: Understanding Their Advantages and Weaknesses from a Practical Point of View. IEEE Access 2019, 7, 154096–154113. [Google Scholar] [CrossRef]
- Lunsford, L.D.; Niranjan, A.; Kano, H.; Kondziolka, D. The Technical Evolution of Gamma Knife Radiosurgery for Arteriovenous Malformations. Prog. Neurol. Surg. 2013, 27, 22–34. [Google Scholar] [CrossRef] [PubMed]
- Rao, A.; Monteiro, J.M.; Mourao-Miranda, J.; Alzheimer’s Disease Initiative. Predictive Modelling Using Neuroimaging Data in the Presence of Confounds. NeuroImage 2017, 150, 23–49. [Google Scholar] [CrossRef] [PubMed]
- Cramer, H. Mathematical Methods of Statistics; Princeton Mathematical Series; Princeton University Press: Princeton, NJ, USA, 1946. [Google Scholar]
- Mukaka, M. A Guide to Appropriate Use of Correlation Coefficient in Medical Research. Malawi Med. J. J. Med. Assoc. Malawi 2012, 24, 69–71. [Google Scholar]
- Zychlinski, S. Dython: A Set of Data Tools in Python. Available online: http://shakedzy.xyz/dython (accessed on 20 June 2023).
- Ahsan, M.M.; Mahmud, M.A.P.; Saha, P.K.; Gupta, K.D.; Siddique, Z. Effect of Data Scaling Methods on Machine Learning Algorithms and Model Performance. Technologies 2021, 9, 52. [Google Scholar] [CrossRef]
- Chawla, N.V.; Bowyer, K.W.; Hall, L.O.; Kegelmeyer, W.P. SMOTE: Synthetic Minority Over-Sampling Technique. J. Artif. Intell. Res. 2002, 16, 321–357. [Google Scholar] [CrossRef]
- Zhu, T.; Lin, Y.; Liu, Y. Synthetic Minority Oversampling Technique for Multiclass Imbalance Problems. Pattern Recognit. 2017, 72, 327–340. [Google Scholar] [CrossRef]
- Meng, X.; Gao, D.; He, H.; Sun, S.; Liu, A.; Jin, H.; Li, Y. A Machine Learning Model Predicts the Outcome of SRS for Residual Arteriovenous Malformations after Partial Embolization: A Real-World Clinical Obstacle. World Neurosurg. 2022, 163, e73–e82. [Google Scholar] [CrossRef]
- Bzdok, D.; Altman, N.; Krzywinski, M. Statistics versus Machine Learning. Nat. Methods 2018, 15, 233–234. [Google Scholar] [CrossRef]
- Zhang, Y.; Yang, Y. Cross-Validation for Selecting a Model Selection Procedure. J. Econom. 2015, 187, 95–112. [Google Scholar] [CrossRef]
- Franklin, J. The Elements of Statistical Learning: Data Mining, Inference and Prediction. Math. Intell. 2005, 27, 83–85. [Google Scholar] [CrossRef]
- Pedregosa, F.; Varoquaux, G.; Gramfort, A.; Michel, V.; Thirion, B.; Grisel, O.; Blondel, M.; Prettenhofer, P.; Weiss, R.; Dubourg, V.; et al. Scikit-Learn: Machine Learning in Python. J. Mach. Learn. Res. 2011, 12, 2825–2830. [Google Scholar]
- Szumilas, M. Explaining Odds Ratios. J. Can. Acad. Child Adolesc. Psychiatry 2010, 19, 227–229. [Google Scholar] [PubMed]
- Brnabic, A.; Hess, L.M. Systematic Literature Review of Machine Learning Methods Used in the Analysis of Real-World Data for Patient-Provider Decision Making. BMC Med. Inform. Decis. Mak. 2021, 21, 54. [Google Scholar] [CrossRef] [PubMed]
- Kavitha, C.; Mani, V.; Srividhya, S.R.; Khalaf, O.I.; Tavera Romero, C.A. Early-Stage Alzheimer’s Disease Prediction Using Machine Learning Models. Front. Public Health 2022, 10, 853294. [Google Scholar] [CrossRef] [PubMed]
- Magesh, P.R.; Myloth, R.D.; Tom, R.J. An Explainable Machine Learning Model for Early Detection of Parkinson’s Disease Using LIME on DaTSCAN Imagery. Comput. Biol. Med. 2020, 126, 104041. [Google Scholar] [CrossRef] [PubMed]
- Chandra, J.; Muthupalaniappan, S.; Shang, Z.; Deng, R.; Lin, R.; Tolkova, I.; Butts, D.; Sul, D.; Marzouk, S.; Bose, S.; et al. Screening of Parkinson’s Disease Using Geometric Features Extracted from Spiral Drawings. Brain Sci. 2021, 11, 1297. [Google Scholar] [CrossRef]
- Hu, M.; Qian, X.; Liu, S.; Koh, A.J.; Sim, K.; Jiang, X.; Guan, C.; Zhou, J.H. Structural and Diffusion MRI Based Schizophrenia Classification Using 2D Pretrained and 3D Naive Convolutional Neural Networks. Schizophr. Res. 2022, 243, 330–341. [Google Scholar] [CrossRef]
- Pintelas, E.; Liaskos, M.; Livieris, I.E.; Kotsiantis, S.; Pintelas, P. Explainable Machine Learning Framework for Image Classification Problems: Case Study on Glioma Cancer Prediction. J. Imaging 2020, 6, 37. [Google Scholar] [CrossRef]
- Maqsood, S.; Damaševičius, R.; Maskeliūnas, R. Multi-Modal Brain Tumor Detection Using Deep Neural Network and Multiclass SVM. Medicina 2022, 58, 1090. [Google Scholar] [CrossRef]
- Yamamoto, M.; Jimbo, M.; Kobayashi, M.; Toyoda, C.; Ide, M.; Tanaka, N.; Lindquist, C.; Steiner, L. Long-Term Results of Radiosurgery for Arteriovenous Malformation: Neurodiagnostic Imaging and Histological Studies of Angiographically Confirmed Nidus Obliteration. Surg. Neurol. 1992, 37, 219–230. [Google Scholar] [CrossRef]
- Nicolato, A.; Longhi, M.; Tommasi, N.; Ricciardi, G.K.; Spinelli, R.; Foroni, R.I.; Zivelonghi, E.; Zironi, S.; Dall’Oglio, S.; Beltramello, A.; et al. Leksell Gamma Knife for Pediatric and Adolescent Cerebral Arteriovenous Malformations: Results of 100 Cases Followed up for at Least 36 Months. J. Neurosurg. Pediatr. 2015, 16, 736–747. [Google Scholar] [CrossRef]


| Cat. | Variable Name | Description | Values |
|---|---|---|---|
| (S) | gender | Sexual/gender identity | 1 = male; 0 = female |
| (S) | age | Chronological age | 4–75 |
| (S) | residence | Place of residence (city where patient lived during treatment) | 1 = Lima or Callao, Peru; 2 = outside Lima or Callao in Peru; 3 = outside Peru |
| (S) | occupation | Principal work or business | 1 = professional with bachelor’s or technical degree; 2 = general worker; 3 = housewife; 4 = police officer or similar; 5 = undergraduate student; 6 = school student; 7 = unemployed; 8 = self-employed |
| (S) | education_level | Level of education | 1 = preschool; 2 = primary school; 3 = secondary school; 4 = higher education |
| (S) | health_insurance | Type of health insurance | 1 = private; 2 = EsSalud; 3 = SIS; 4 = personal; 5 = military or similar |
| (C) | hemorrhage | Presence of bleeding on a computerized tomography (CT) scan in brain AVM before radiosurgery | 1 = yes; 0 = no |
| (C) | hemorrhage_type | Type of bleeding in brain AVM | 1 = parenchymal; 2 = ventricular; 3 = parenchymal and ventricular; 4 = no hemorrhage present |
| (C) | headache | Persistent headache before radiosurgery | 1 = yes; 0 = no |
| (C) | seizures | Presence of seizures at time of diagnosis | 1 = yes; 0 = no |
| (C) | encephalomalacia | Localized softening of brain substance due to bleeding or inflammation before radiosurgery | 1 = yes; 0 = no |
| (C) | other_diseases | Presence of other systemic or degenerative diseases | 1 = yes; 0 = no |
| (C) | deficit | Type of deficit in patient’s senses before radiosurgery | 1 = motor deficit; 2 = sensory deficit; 3 = cognitive deficit; 4 = no deficit observed |
| (C) | karnofsky_scale | Measurement for classification of functional impairment | 0–100% |
| (C) | glasgow_coma_scale | Assessment of impaired consciousness in response to defined stimuli | 3–15 |
| (C) | spetzler_martin_scale | Estimation of risk of open neurosurgery for patients with brain AVM, by evaluating AVM size, pattern of venous drainage, and eloquence of brain location | 0–5 |
| (C) | buffalo_scale | Grading system for endovascular treatment of brain AVMs | |
| (C) | virginia_scale | Scale to predict favorable outcomes for brain AVM patients treated with gamma knife radiosurgery | 0–4 |
| (T) | prev_cran_surgery | Previous open cranial surgery | 1 = yes; 0 = no |
| (T) | embolization | Embolization procedure to occlude brain AVM before radiosurgery | 1 = yes; 0 = no |
| (T) | embolization_agent | Type of material used for embolization procedure | 1 = Onyx; 2 = Histoacryl; 3 = none |
| (T) | prev_surgery_or_embolization | Surgery or embolization before radiosurgery procedure | 1 = surgery; 2 = embolization; 3 = surgery and embolization; 4 = none |
| (A) | localization_avm | Anatomical location of brain AVM | 1 = frontal lobe; 2 = temporal lobe; 3 = parietal lobe; 4 = occipital lobe; 5 = cerebral corpus callosum; 6 = insular cortex; 7 = basal ganglia; 8 = cerebellum; 9 = ventricular; 10 = vermis; 11 = frontomesial; 12 = frontoparietal; 13 = frontotemporal; 14 = mesencephalon; 15 = mesio-occipital; 16 = mesio-parietal; 17 = parieto-occipital; 18 = protuberance; 19 = mesio-temporal; 20 = temporo-occipital; 21 = temporo-parietal; 22 = brainstem |
| (A) | venous_aneurysm | Presence of venous aneurysm along with brain AVM | 1 = yes; 0 = no |
| (A) | arterial_aneurysm | Presence of arterial aneurysm along with brain AVM | 1 = yes; 0 = no |
| (A) | dolichoectasia | Elongation, dilatation, and distension of brain AVM drainage veins | 1 = yes; 0 = no |
| (A) | num_afferent_vessels | Number of arteries feeding brain AVM | Number |
| (A) | depth_avm | Depth of brain AVM inside cranial structure | 1 = cortical; 2 = subcortical; 3 = cortico-subcortical; 4 = deep; 5 = ventricular |
| (A) | diameter_avm | Largest diameter of brain AVM in centimeters | 0.5–8.0 cm |
| (A) | side_avm | Brain side where AVM is located | 1 = right; 2 = left; 3 = middle |
| (A) | expansion_shape_avm | Shape of AVM expansion in cerebral area | 1 = compact; 2 = fuzzy; 3 = scattered mixed |
| (A) | type_venous_drainage | Drainage type of venous blood in brain AVM | 1 = superficial; 2 = deep; 3 = mixed |
| (A) | eloquence | Brain AVM is in a zone that compromises vital functions | 1 = yes; 0 = no |
| (A) | type_circulation_drainage | Type of circulation of drainage in brain AVM | 1 = superficial venous; 2 = deep venous |
| (A) | blood_flow_velocity | Blood flow velocity in brain AVM | 1 = slow; 2 = moderate; 3 = fast |
| (A) | venous_stenosis | Narrowing of venous vessel lumen at outlet of drainage of brain AVM | 1 = yes; 0 = no |
| (A) | volume_avm | Volume of brain AVM mass in cubic centimeters | 0.05–75 cc |
| (A) | num_radiosurgeries | Number of radiosurgeries needed to stabilize brain AVM | Number |
| (A) | mri_examination | Brain AVM was examined by magnetic resonance imaging (MRI) | 1 = yes; 0 = no |
| (A) | ct_examination | Brain AVM was examined by CT | 1 = yes; 0 = no |
| (A) | das_examination | Brain AVM was examined by digital angiography system (DAS) | 1 = yes; 0 = no |
| (R) | num_isocenters | Number of iso-centers to cover and treat brain AVM | Number |
| (R) | radiation_doses | Dose of radiation applied to brain AVM during radiosurgery in Gray units | 1–50 Gy |
| (R) | isodosis | Percentage of isodosis applied during radiosurgery of brain AVM | 40–80% |
| (R) | cured | Brain AVM is cured within 3 years of radiosurgery, as indicated by cerebral angiography | 1 = patient was cured; 0 = patient was not cured |
| Discarded Variables | Method | Threshold |
|---|---|---|
| residence, education_level, health_insurance, mri_examination, ct_examination, das_examination | Expert judgment | n.a. |
| hemorrhage_type, embolization_agent, prev_surgery_or_embolization, spetzler_martin_scale, type_circulation_drainage | Cramer’s V test | 0.7 |
| diameter_avm | Pearson’s test | 0.7 |
| Id | Variable Name | Id | Variable Name | Id | Variable Name |
|---|---|---|---|---|---|
| 1 | gender | 12 | buffalo_scale | 23 | expansion_shape_avm |
| 2 | age | 13 | virginia_scale | 24 | type_venous_drainage |
| 3 | occupation | 14 | prev_cran_surgery | 25 | eloquence |
| 4 | hemorrhage | 15 | embolization | 26 | blood_flow_velocity |
| 5 | headache | 16 | localization_avm | 27 | venous_stenosis |
| 6 | seizures | 17 | venous_aneurysm | 28 | volume_avm |
| 7 | encephalomalacia | 18 | arterial_aneurysm | 29 | num_radiosurgeries |
| 8 | other_diseases | 19 | dolichoectasia | 30 | num_isocenters |
| 9 | deficit | 20 | num_afferent_vessels | 31 | radiation_doses |
| 10 | karnofsky_scale | 21 | depth_avm | 32 | isodosis |
| 11 | glasgow_coma_scale | 22 | side_avm | 33 | cured * |
| Model | Parameters | Grid Search Space |
|---|---|---|
| Decision tree (DT) | max_depth | 2–9 |
| criterion | gini, entropy | |
| Logistic regression (LR) | penalty | l1, l2 |
| solver | liblinear | |
| C | 0.001, 0.01, 0.1, 1, 10, 100, 100 | |
| max_iter | 1000, 5000 |
| Scenario | Dataset + Model | Parameters | Value |
|---|---|---|---|
| 01 | Imbalanced + DT | max_depth | 4 |
| criterion | gini | ||
| 02 | Balanced + DT | max_depth | 9 |
| criterion | entropy | ||
| 03 | Imbalanced + LR | penalty | l1 |
| solver | liblinear | ||
| C | 10 | ||
| max_iter | 1000 | ||
| 04 | Balanced + LR | penalty | l1 |
| solver | liblinear | ||
| C | 10 | ||
| max_iter | 1000 |
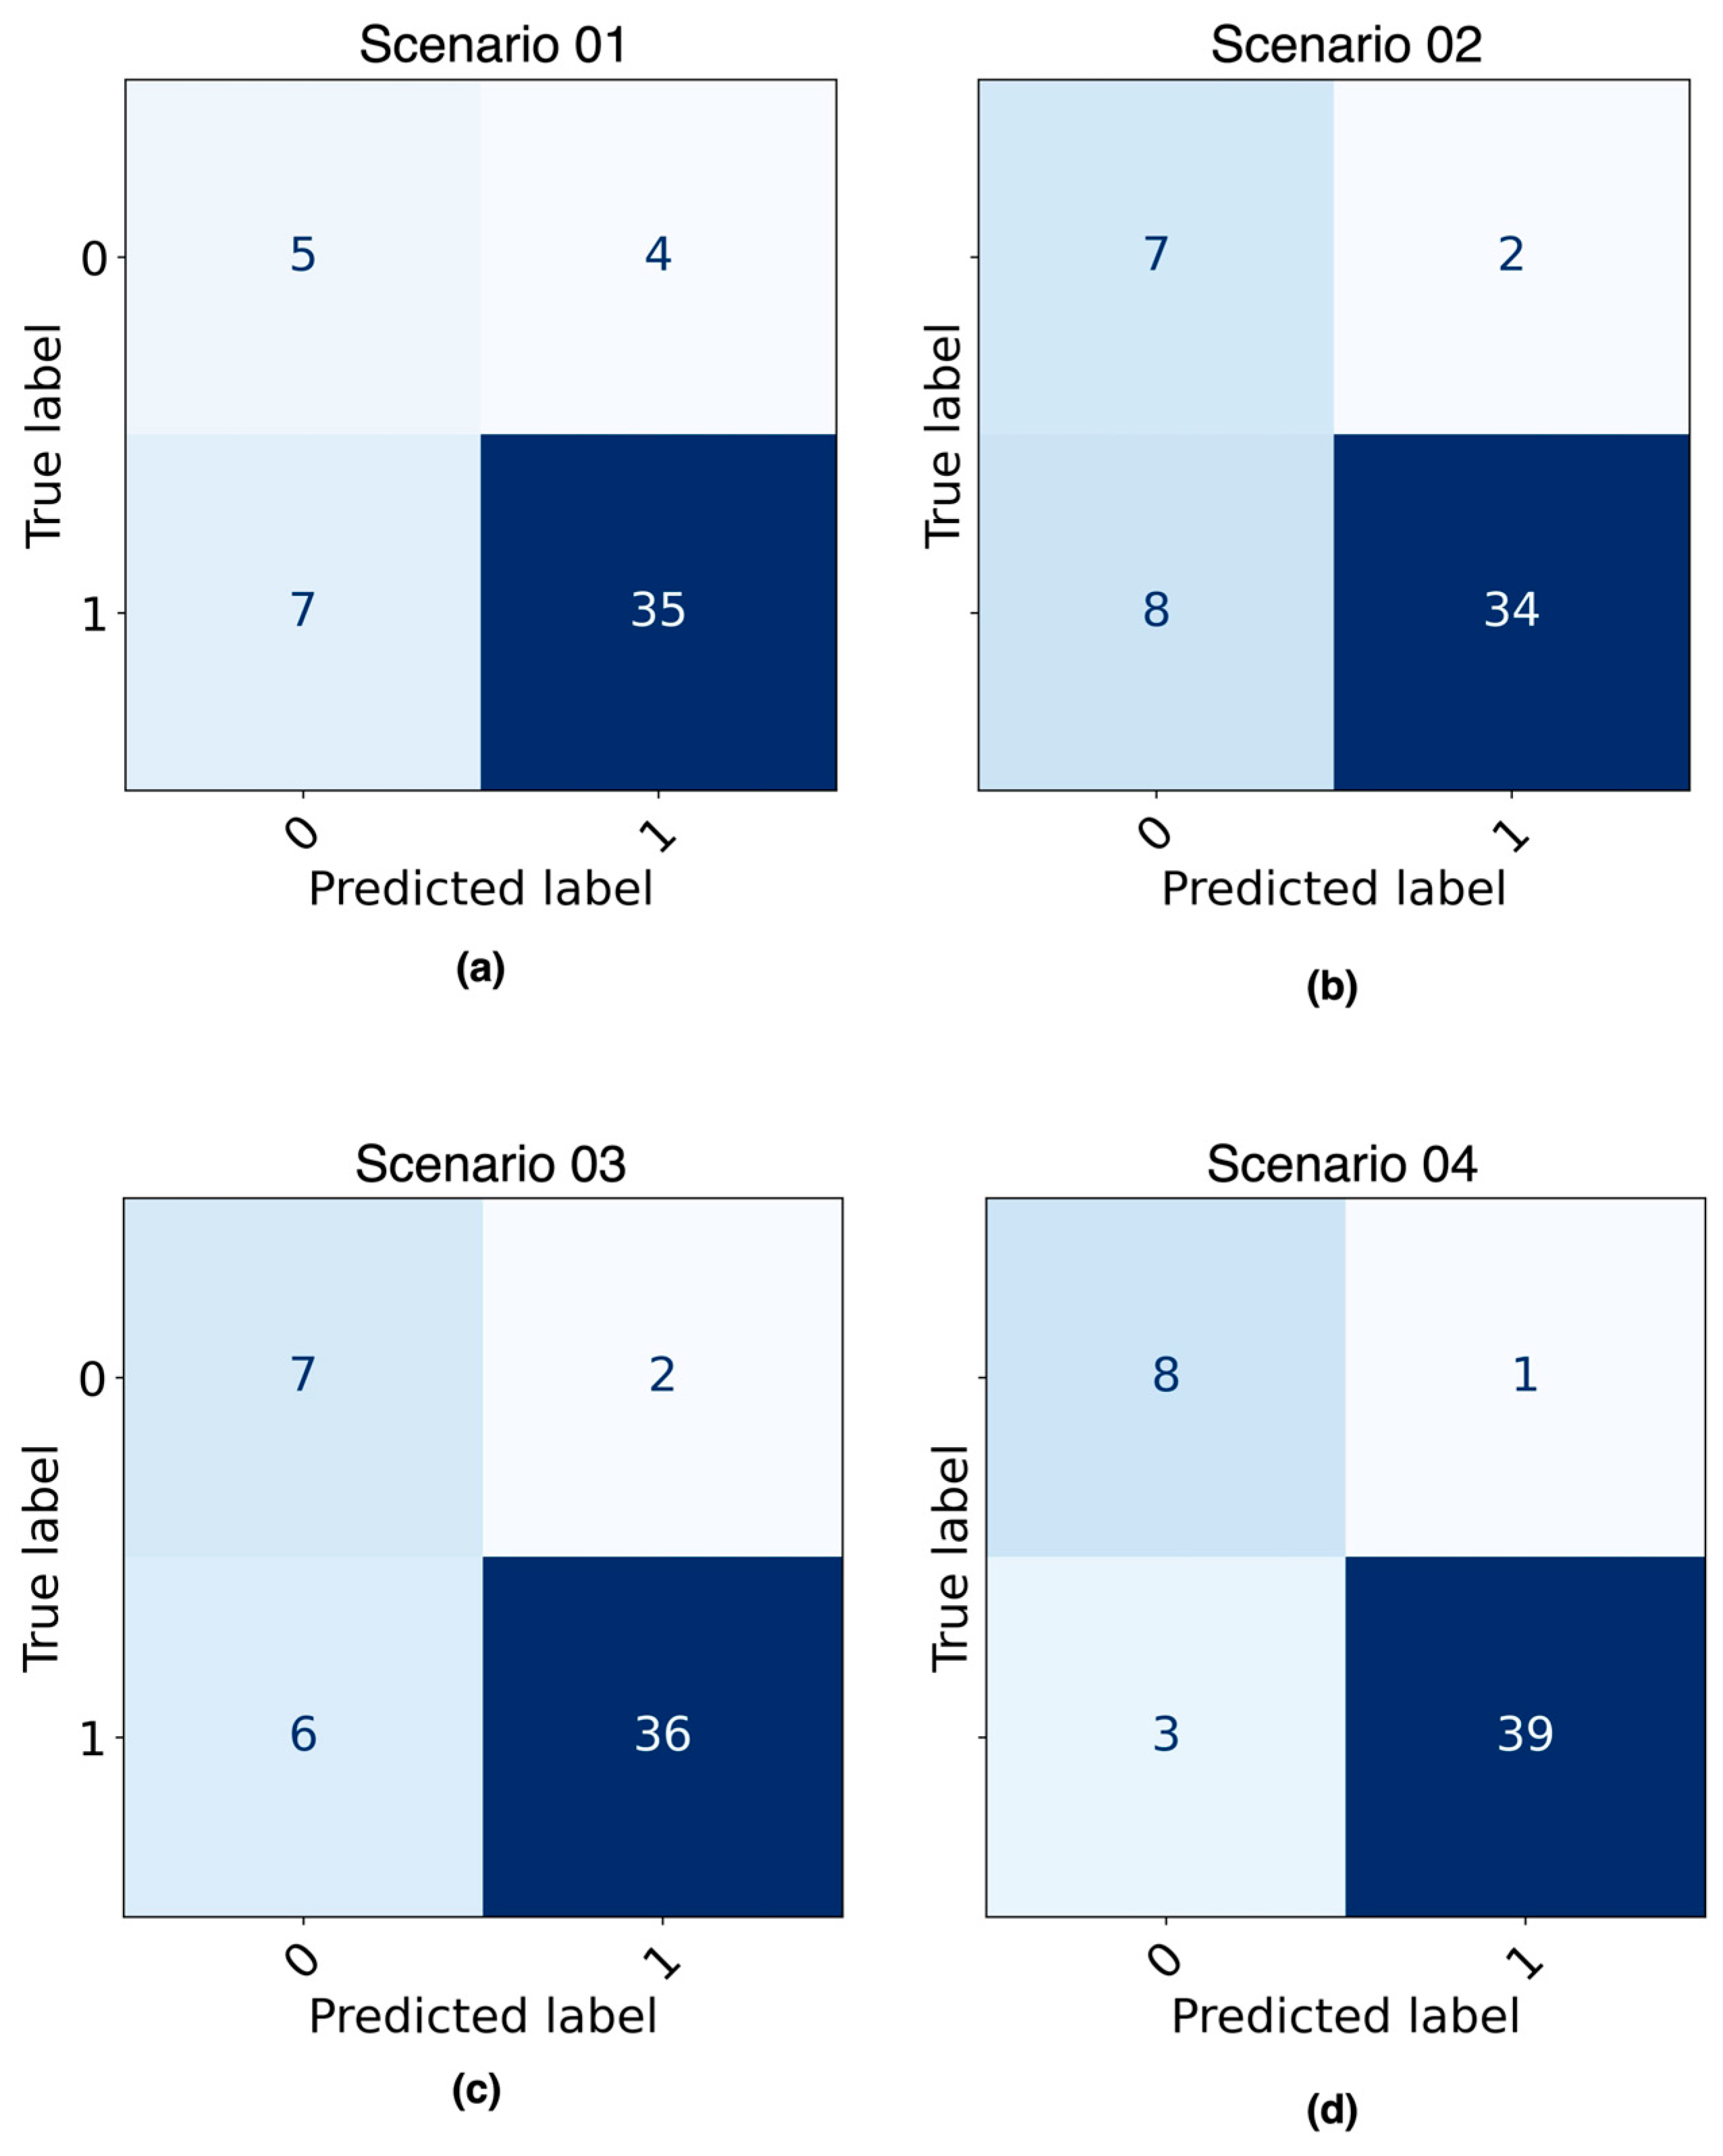
| Dataset | Model Name | Accuracy | Sensitivity | Specificity | Precision | Bal. Accuracy | F1-Score | AUC |
|---|---|---|---|---|---|---|---|---|
| Training | DT * | 0.92 | 0.93 | 0.88 | 0.97 | 0.91 | 0.95 | 0.94 |
| DT (imbalanced) | 0.94 | 0.96 | 0.85 | 0.97 | 0.90 | 0.96 | 0.92 | |
| DT (balanced) | 0.98 | 0.98 | 0.99 | 0.99 | 0.98 | 0.98 | 0.98 | |
| LR * | 0.95 | 0.96 | 0.92 | 0.98 | 0.94 | 0.97 | 0.96 | |
| LR (imbalanced) | 0.97 | 0.96 | 1.00 | 1.00 | 0.98 | 0.98 | 0.99 | |
| LR (balanced) | 0.96 | 0.97 | 0.96 | 0.96 | 0.96 | 0.96 | 0.99 | |
| Testing | DT * | 0.76 | 0.86 | 0.33 | 0.86 | 0.60 | 0.86 | 0.62 |
| DT (imbalanced) | 0.78 | 0.83 | 0.56 | 0.90 | 0.69 | 0.86 | 0.75 | |
| DT (balanced) | 0.80 | 0.81 | 0.78 | 0.94 | 0.79 | 0.87 | 0.79 | |
| LR * | 0.80 | 0.81 | 0.78 | 0.94 | 0.79 | 0.87 | 0.93 | |
| LR (imbalanced) | 0.84 | 0.86 | 0.78 | 0.95 | 0.82 | 0.90 | 0.94 | |
| LR (balanced) | 0.92 | 0.93 | 0.89 | 0.98 | 0.91 | 0.95 | 0.98 |
| Feature | Coef. | Importance |
|---|---|---|
| side_avm | 3.69 | 3.99 × 101 |
| occupation | 3.68 | 3.98 × 101 |
| hemorrhage | 3.61 | 3.71 × 101 |
| prev_cran_surgery | 2.81 | 1.66 × 101 |
| type_venous_drainage | 2.12 | 8.35 × 100 |
| deficit | 1.01 | 2.74 × 100 |
| eloquence | 0.98 | 2.66 × 100 |
| gender | 0.48 | 1.61 × 100 |
| seizures | 0.43 | 1.53 × 100 |
| karnofsky_scale | 0.00 | 1.00 × 100 |
| virginia_scale | 0.00 | 1.00 × 100 |
| num_isocenters | 0.00 | 1.00 × 100 |
| num_radiosurgeries | 0.00 | 1.00 × 100 |
| arterial_aneurysm | 0.00 | 1.00 × 100 |
| headache | −0.01 | 9.90 × 10⁻¹ |
| glasgow_coma_scale | −0.06 | 9.39 × 10⁻¹ |
| buffalo_scale | −0.59 | 5.52 × 10⁻¹ |
| venous_stenosis | −1.08 | 3.39 × 10⁻¹ |
| radiation_doses | −1.11 | 3.28 × 10⁻¹ |
| num_afferent_vessels | −1.23 | 2.93 × 10⁻¹ |
| other_diseases | −1.29 | 2.74 × 10⁻¹ |
| venous_aneurysm | −1.34 | 2.61 × 10⁻¹ |
| age | −2.23 | 1.07 × 10⁻¹ |
| encephalomalacia | −3.07 | 4.64 × 10⁻² |
| localization_avm | −3.11 | 4.47 × 10⁻² |
| depth_avm | −3.23 | 3.95 × 10⁻² |
| expansion_shape_avm | −4.01 | 1.81 × 10⁻² |
| isodosis | −4.73 | 8.82 × 10⁻³ |
| embolization | −4.74 | 8.75 × 10⁻³ |
| dolichoectasia | −5.67 | 3.46 × 10⁻³ |
| blood_flow_velocity | −7.41 | 6.07 × 10⁻⁴ |
| volume_avm | −21.47 | 4.75 × 10⁻¹⁰ |
Disclaimer/Publisher’s Note: The statements, opinions and data contained in all publications are solely those of the individual author(s) and contributor(s) and not of MDPI and/or the editor(s). MDPI and/or the editor(s) disclaim responsibility for any injury to people or property resulting from any ideas, methods, instructions or products referred to in the content. |
© 2023 by the authors. Licensee MDPI, Basel, Switzerland. This article is an open access article distributed under the terms and conditions of the Creative Commons Attribution (CC BY) license (https://creativecommons.org/licenses/by/4.0/).
Share and Cite
Rodríguez Mallma, M.J.; Vilca-Aguilar, M.; Zuloaga-Rotta, L.; Borja-Rosales, R.; Salas-Ojeda, M.; Mauricio, D. Machine Learning Approach for Analyzing 3-Year Outcomes of Patients with Brain Arteriovenous Malformation (AVM) after Stereotactic Radiosurgery (SRS). Diagnostics 2024, 14, 22. https://doi.org/10.3390/diagnostics14010022
Rodríguez Mallma MJ, Vilca-Aguilar M, Zuloaga-Rotta L, Borja-Rosales R, Salas-Ojeda M, Mauricio D. Machine Learning Approach for Analyzing 3-Year Outcomes of Patients with Brain Arteriovenous Malformation (AVM) after Stereotactic Radiosurgery (SRS). Diagnostics. 2024; 14(1):22. https://doi.org/10.3390/diagnostics14010022
Chicago/Turabian StyleRodríguez Mallma, Mirko Jerber, Marcos Vilca-Aguilar, Luis Zuloaga-Rotta, Rubén Borja-Rosales, María Salas-Ojeda, and David Mauricio. 2024. "Machine Learning Approach for Analyzing 3-Year Outcomes of Patients with Brain Arteriovenous Malformation (AVM) after Stereotactic Radiosurgery (SRS)" Diagnostics 14, no. 1: 22. https://doi.org/10.3390/diagnostics14010022
APA StyleRodríguez Mallma, M. J., Vilca-Aguilar, M., Zuloaga-Rotta, L., Borja-Rosales, R., Salas-Ojeda, M., & Mauricio, D. (2024). Machine Learning Approach for Analyzing 3-Year Outcomes of Patients with Brain Arteriovenous Malformation (AVM) after Stereotactic Radiosurgery (SRS). Diagnostics, 14(1), 22. https://doi.org/10.3390/diagnostics14010022