
DDPM: A Dengue Disease Prediction and Diagnosis Model Using Sentiment Analysis and Machine Learning Algorithms

 , , , ,
Abstract
1. Introduction
- Using techniques from the field of machine learning, such as the KNN classifier, decision tree, random forest, Gaussian naive Bayes, and support vector classifier (SVC), among others.
- Creating a diagnostic model based on machine learning for fast detection and prognosis of dengue disease to aid medical professionals in making decisions.
- The K-Fold method is used here for the purpose of result validation.
2. Related Work
3. Materials and Methods
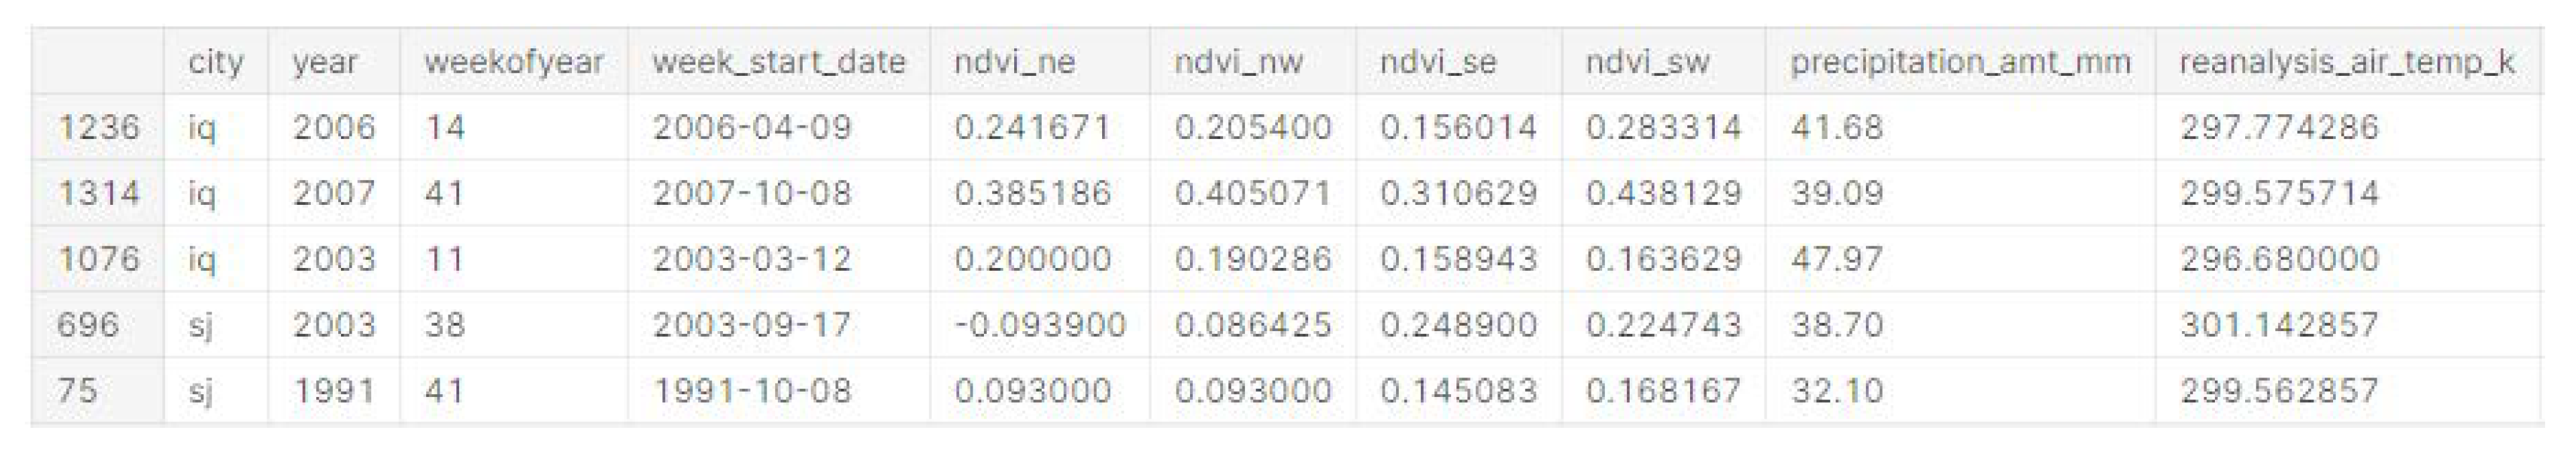
3.1. Data Collection
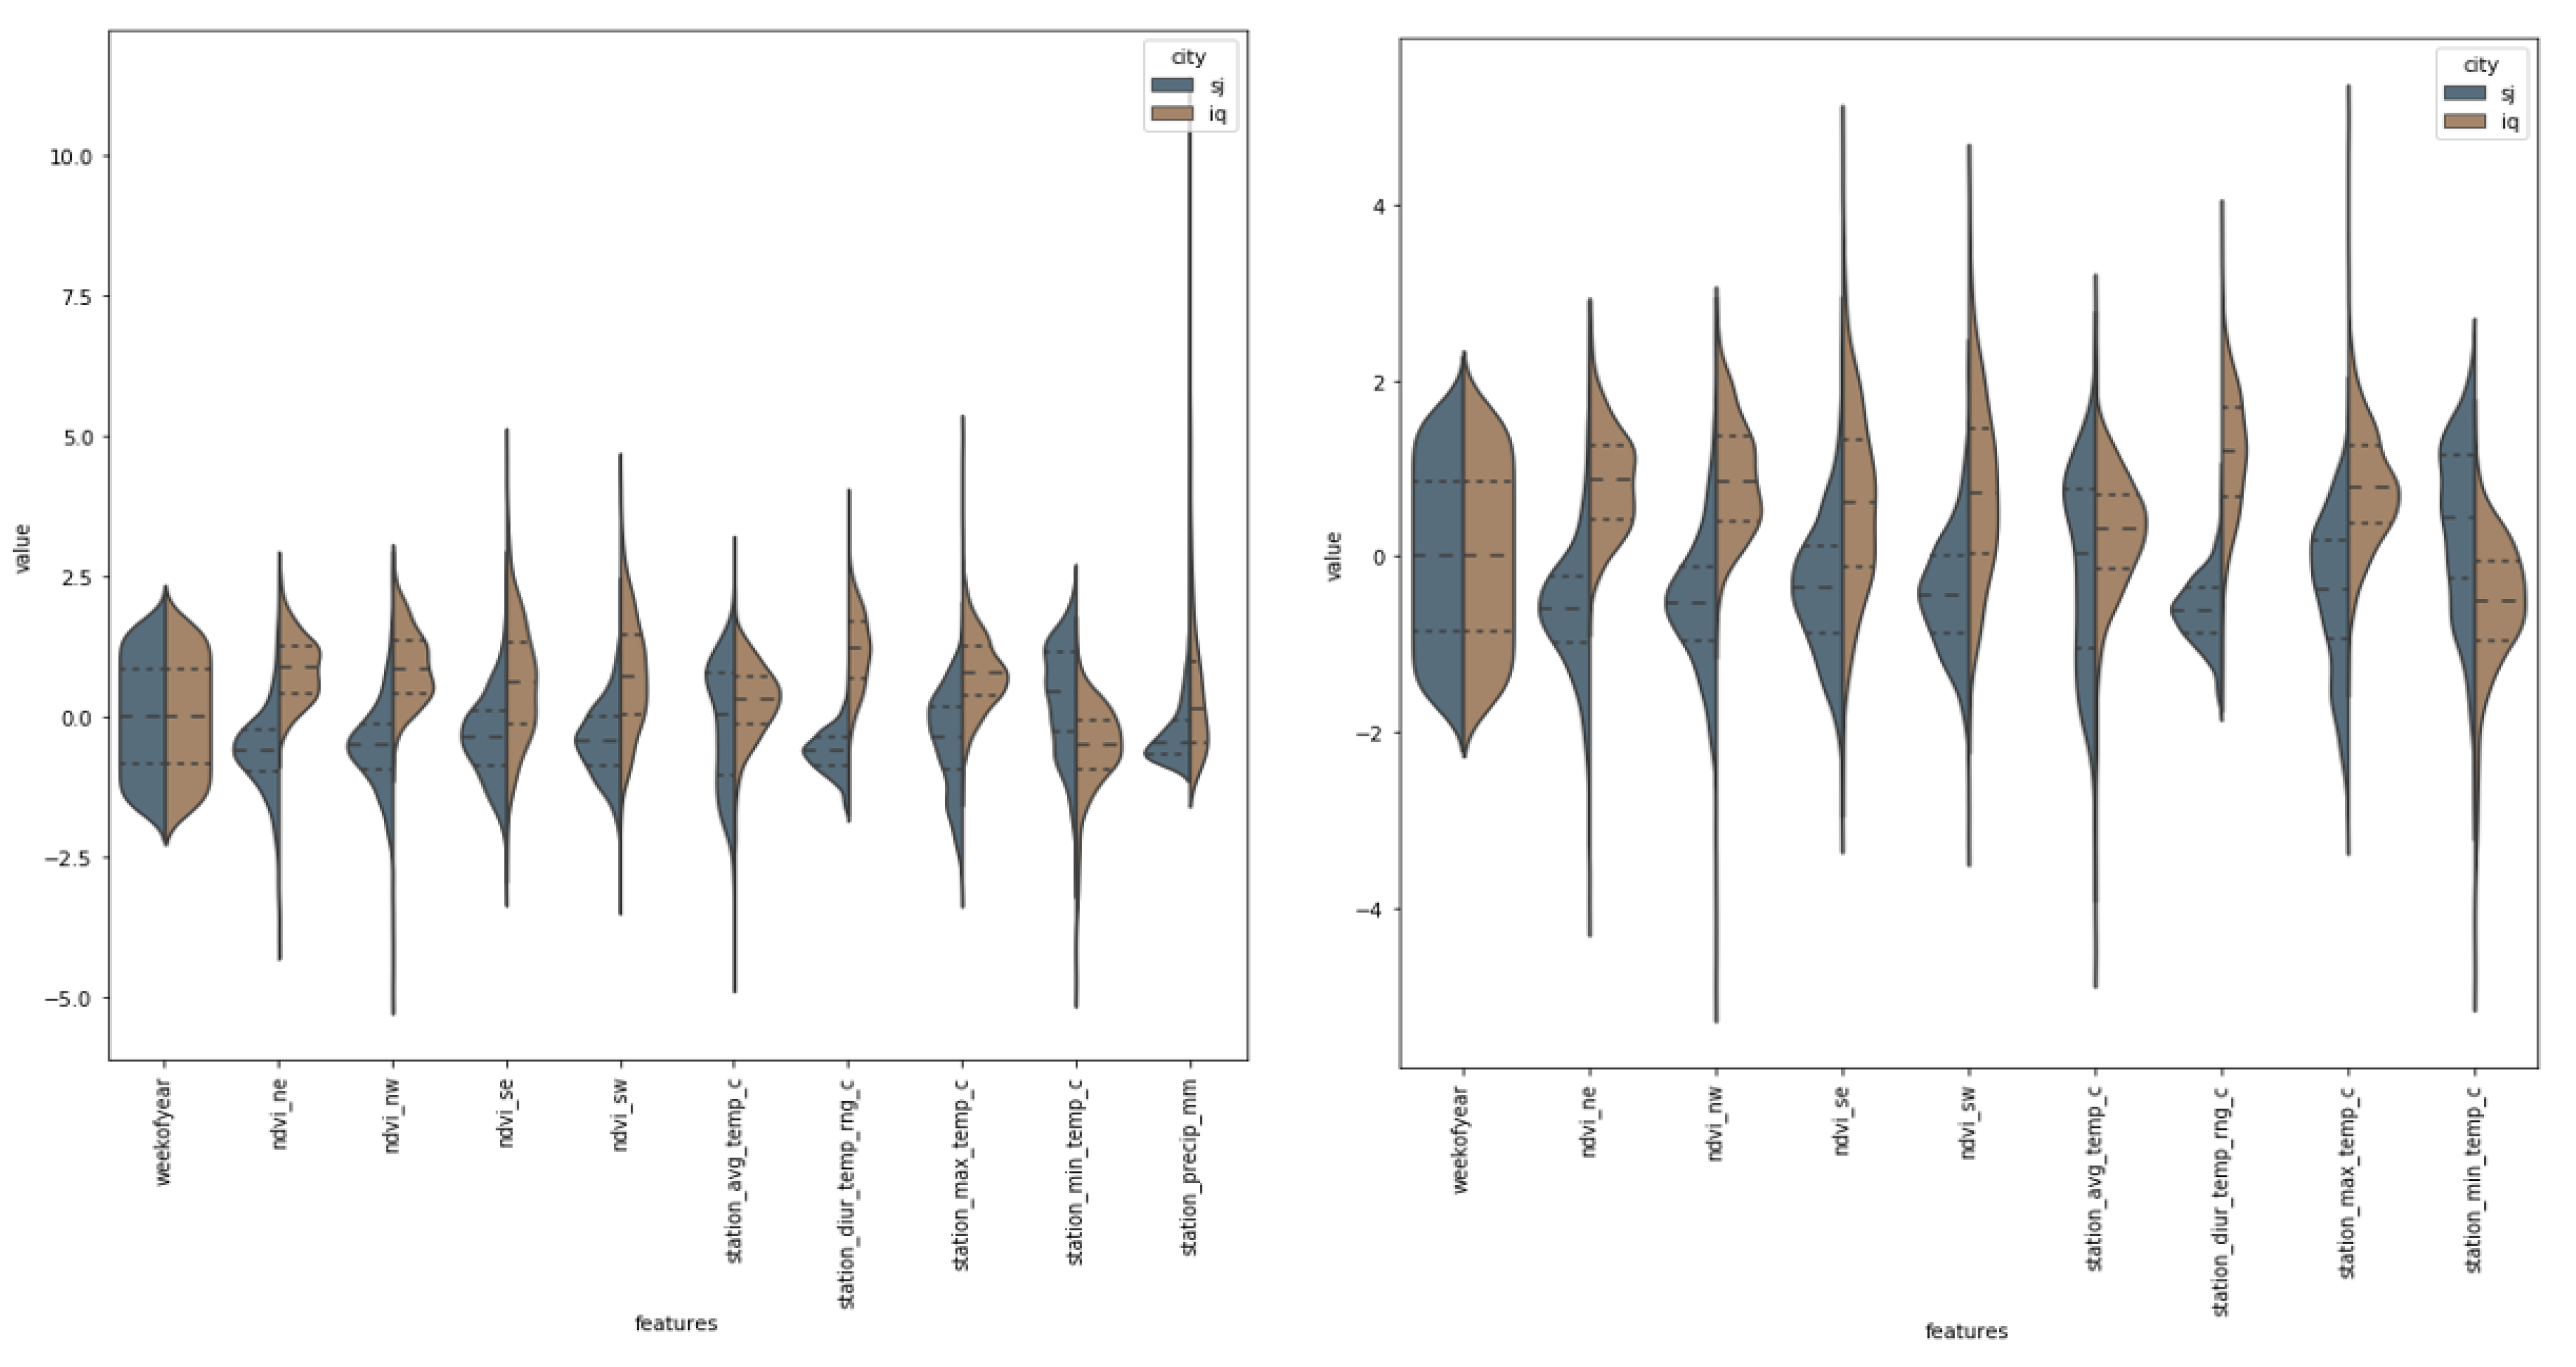
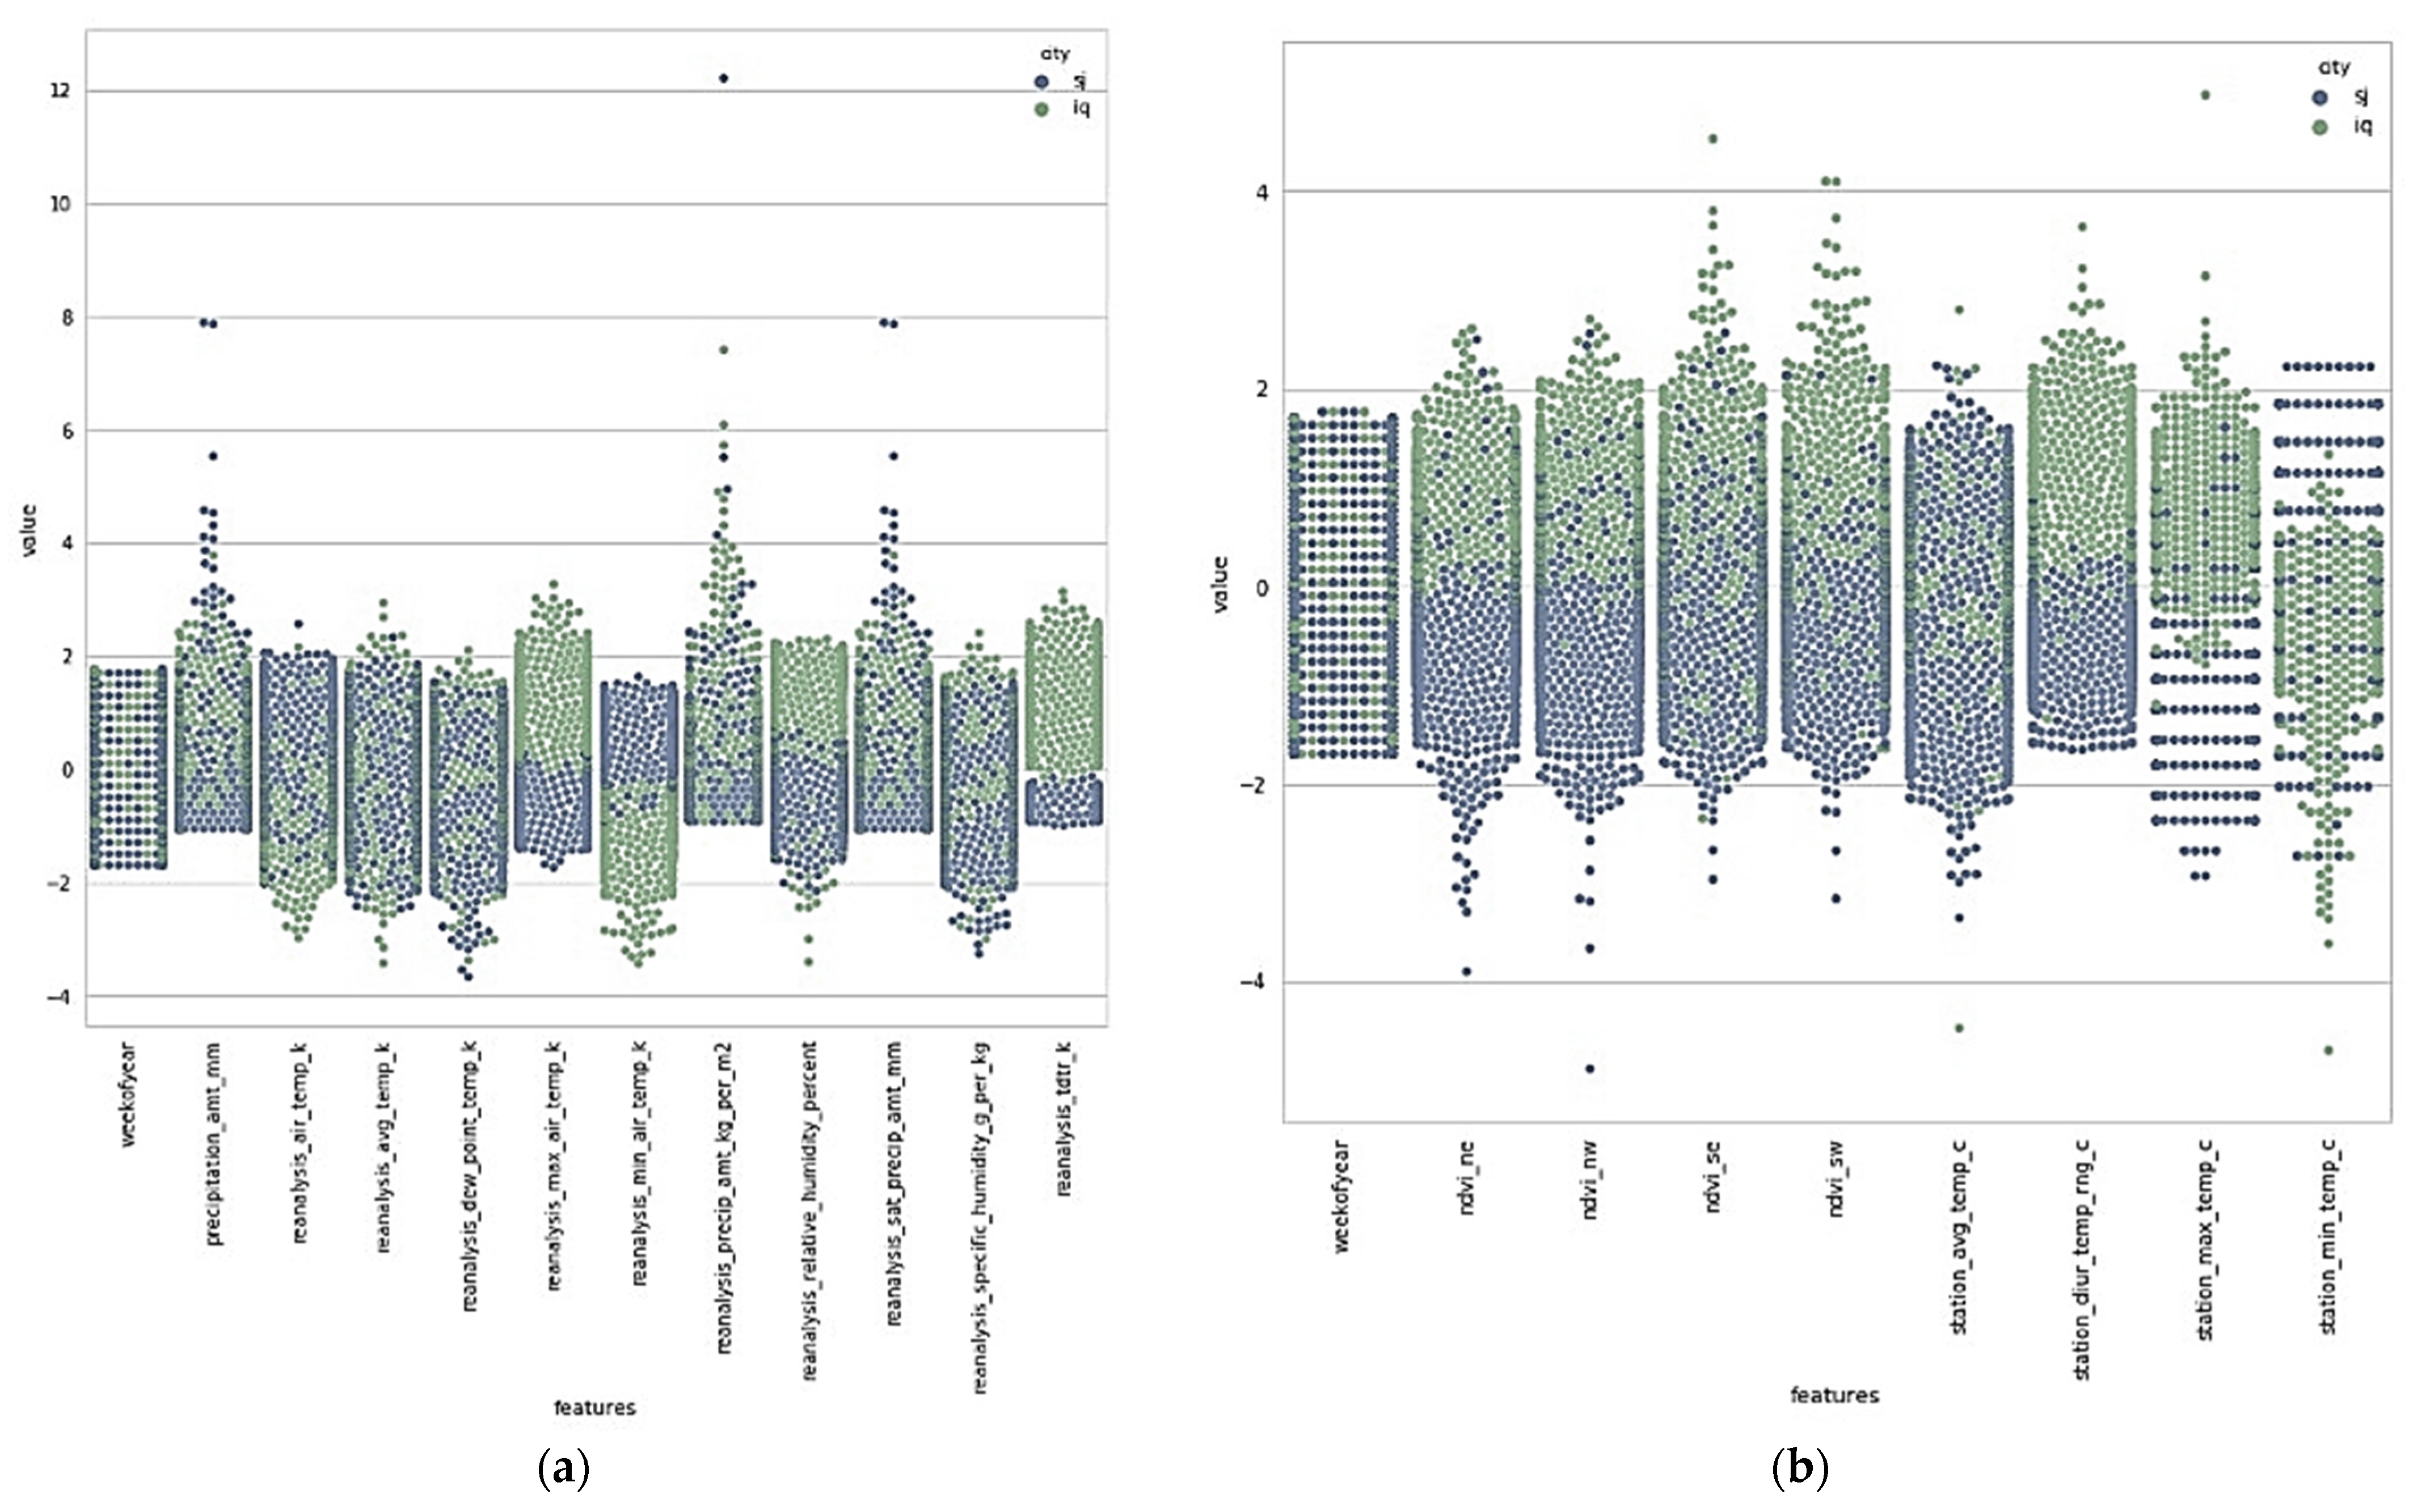
3.2. Data Preprocessing
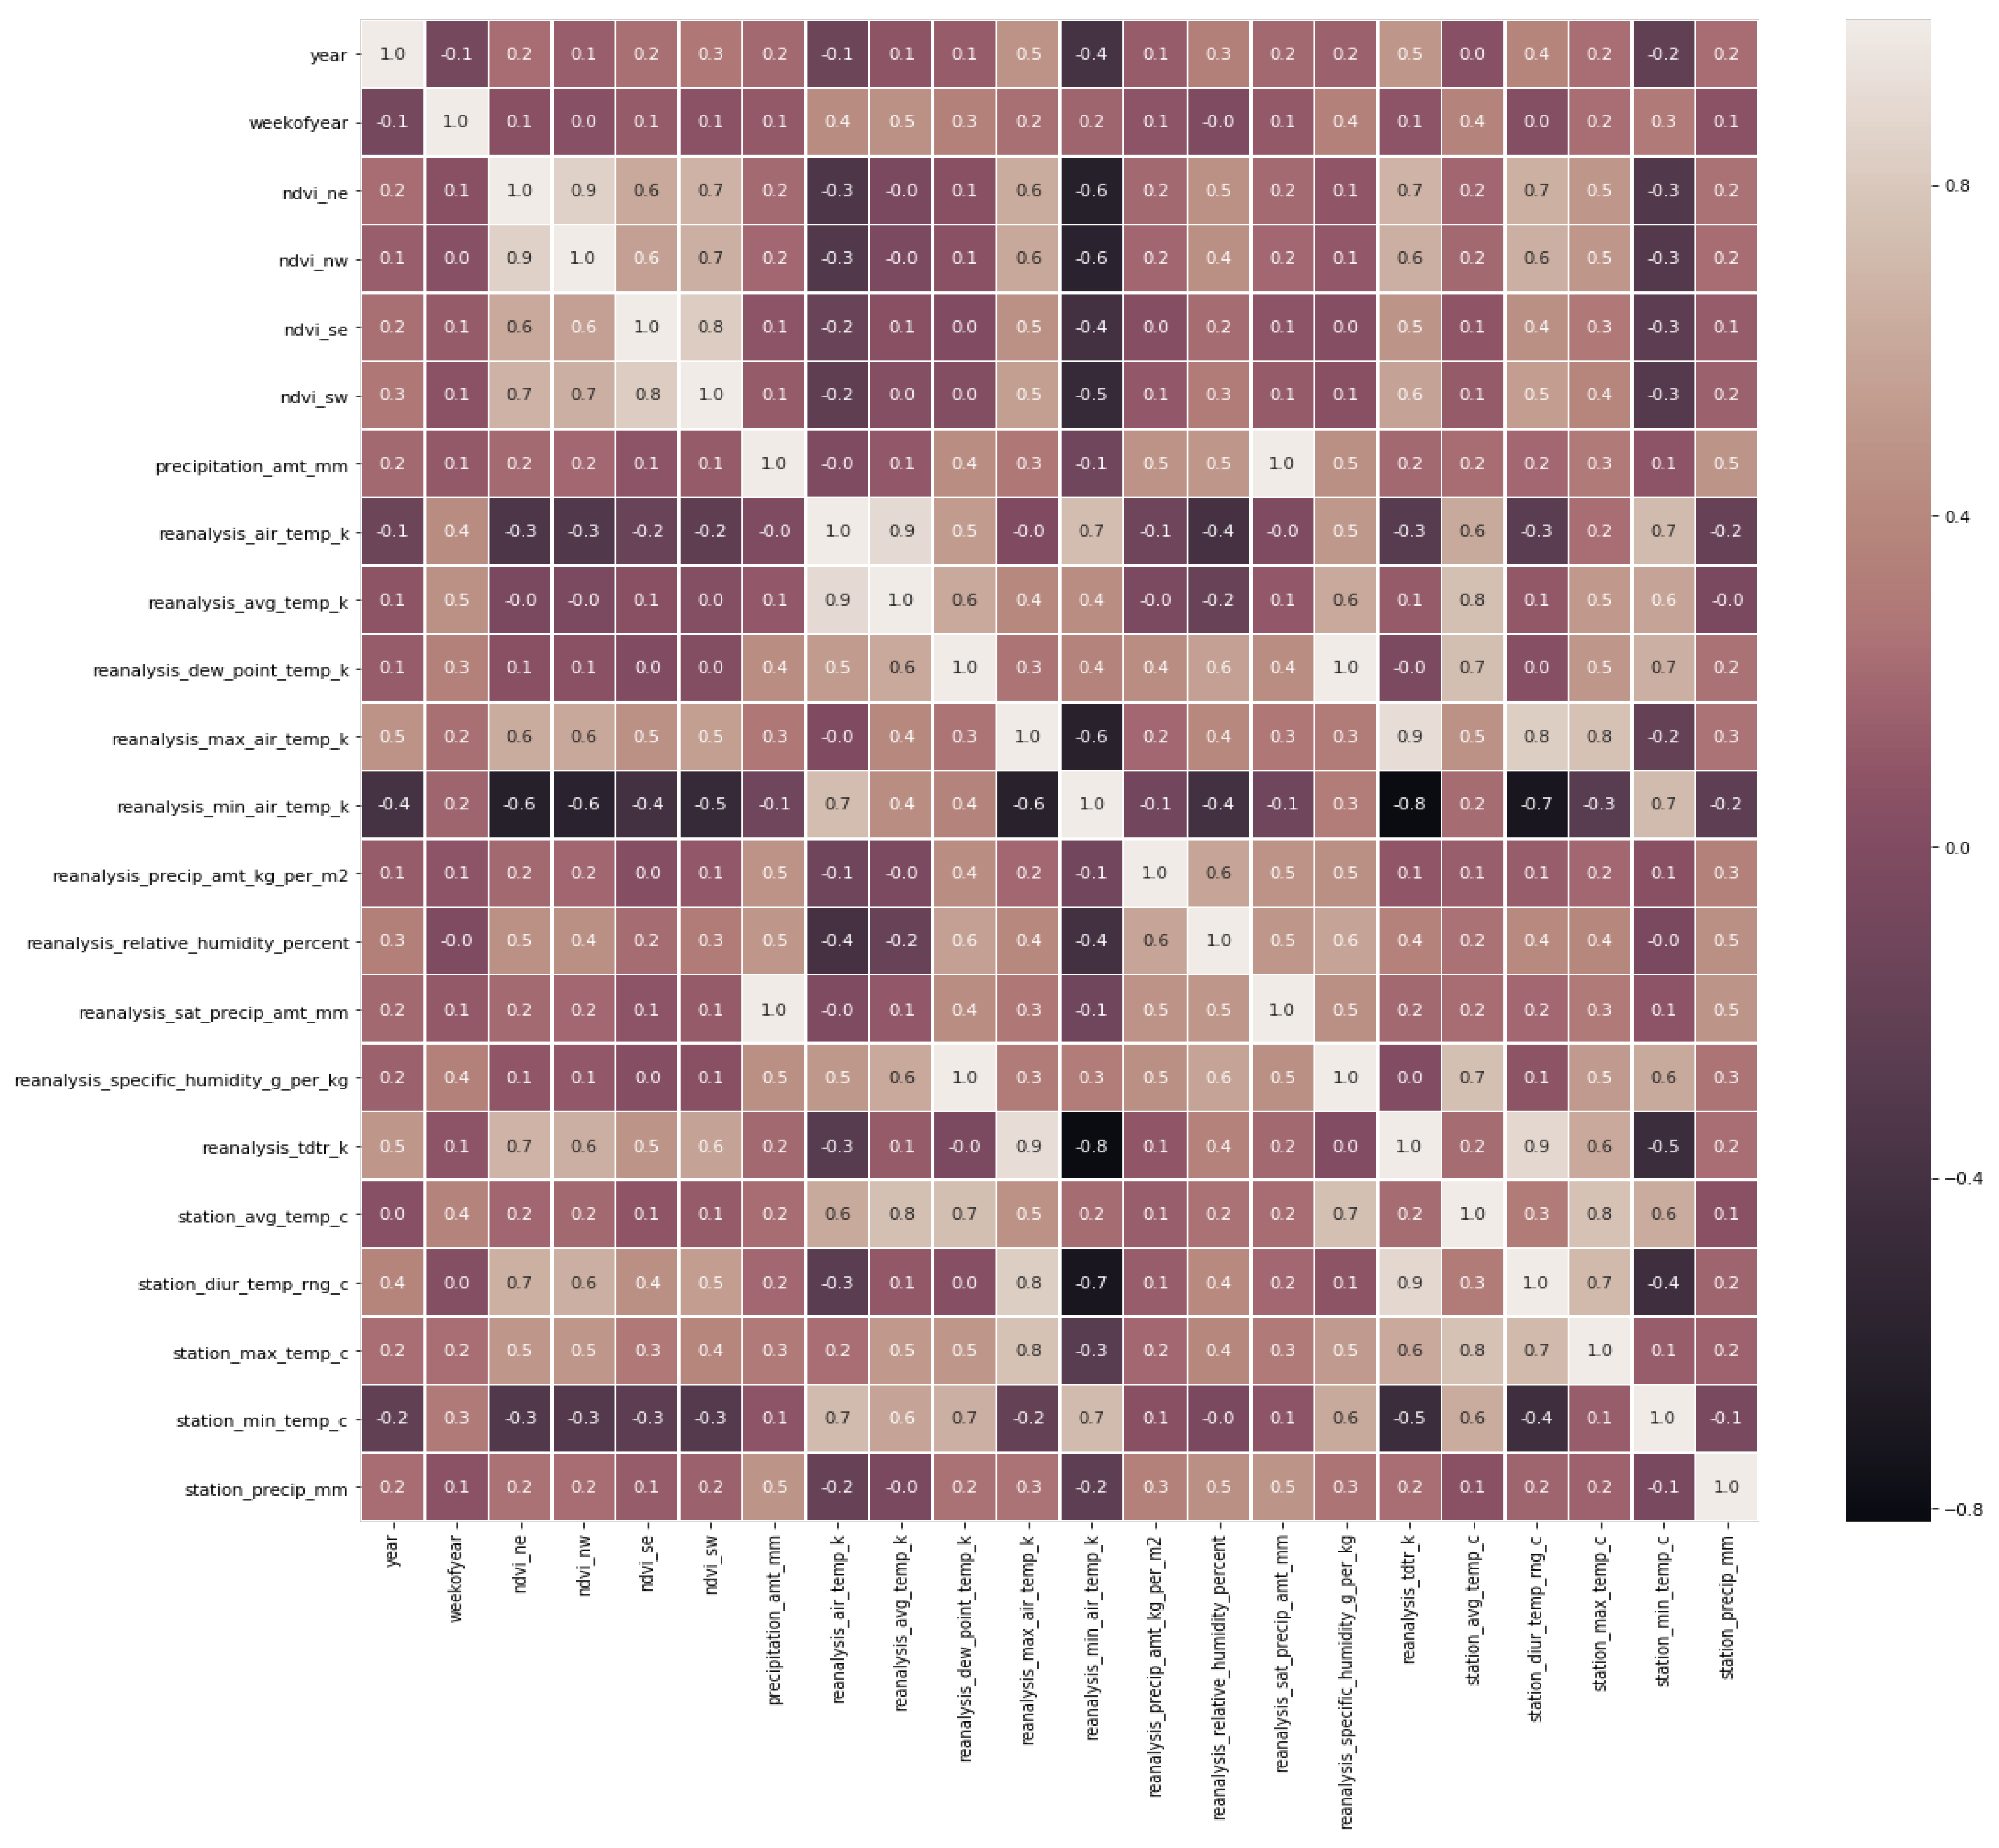
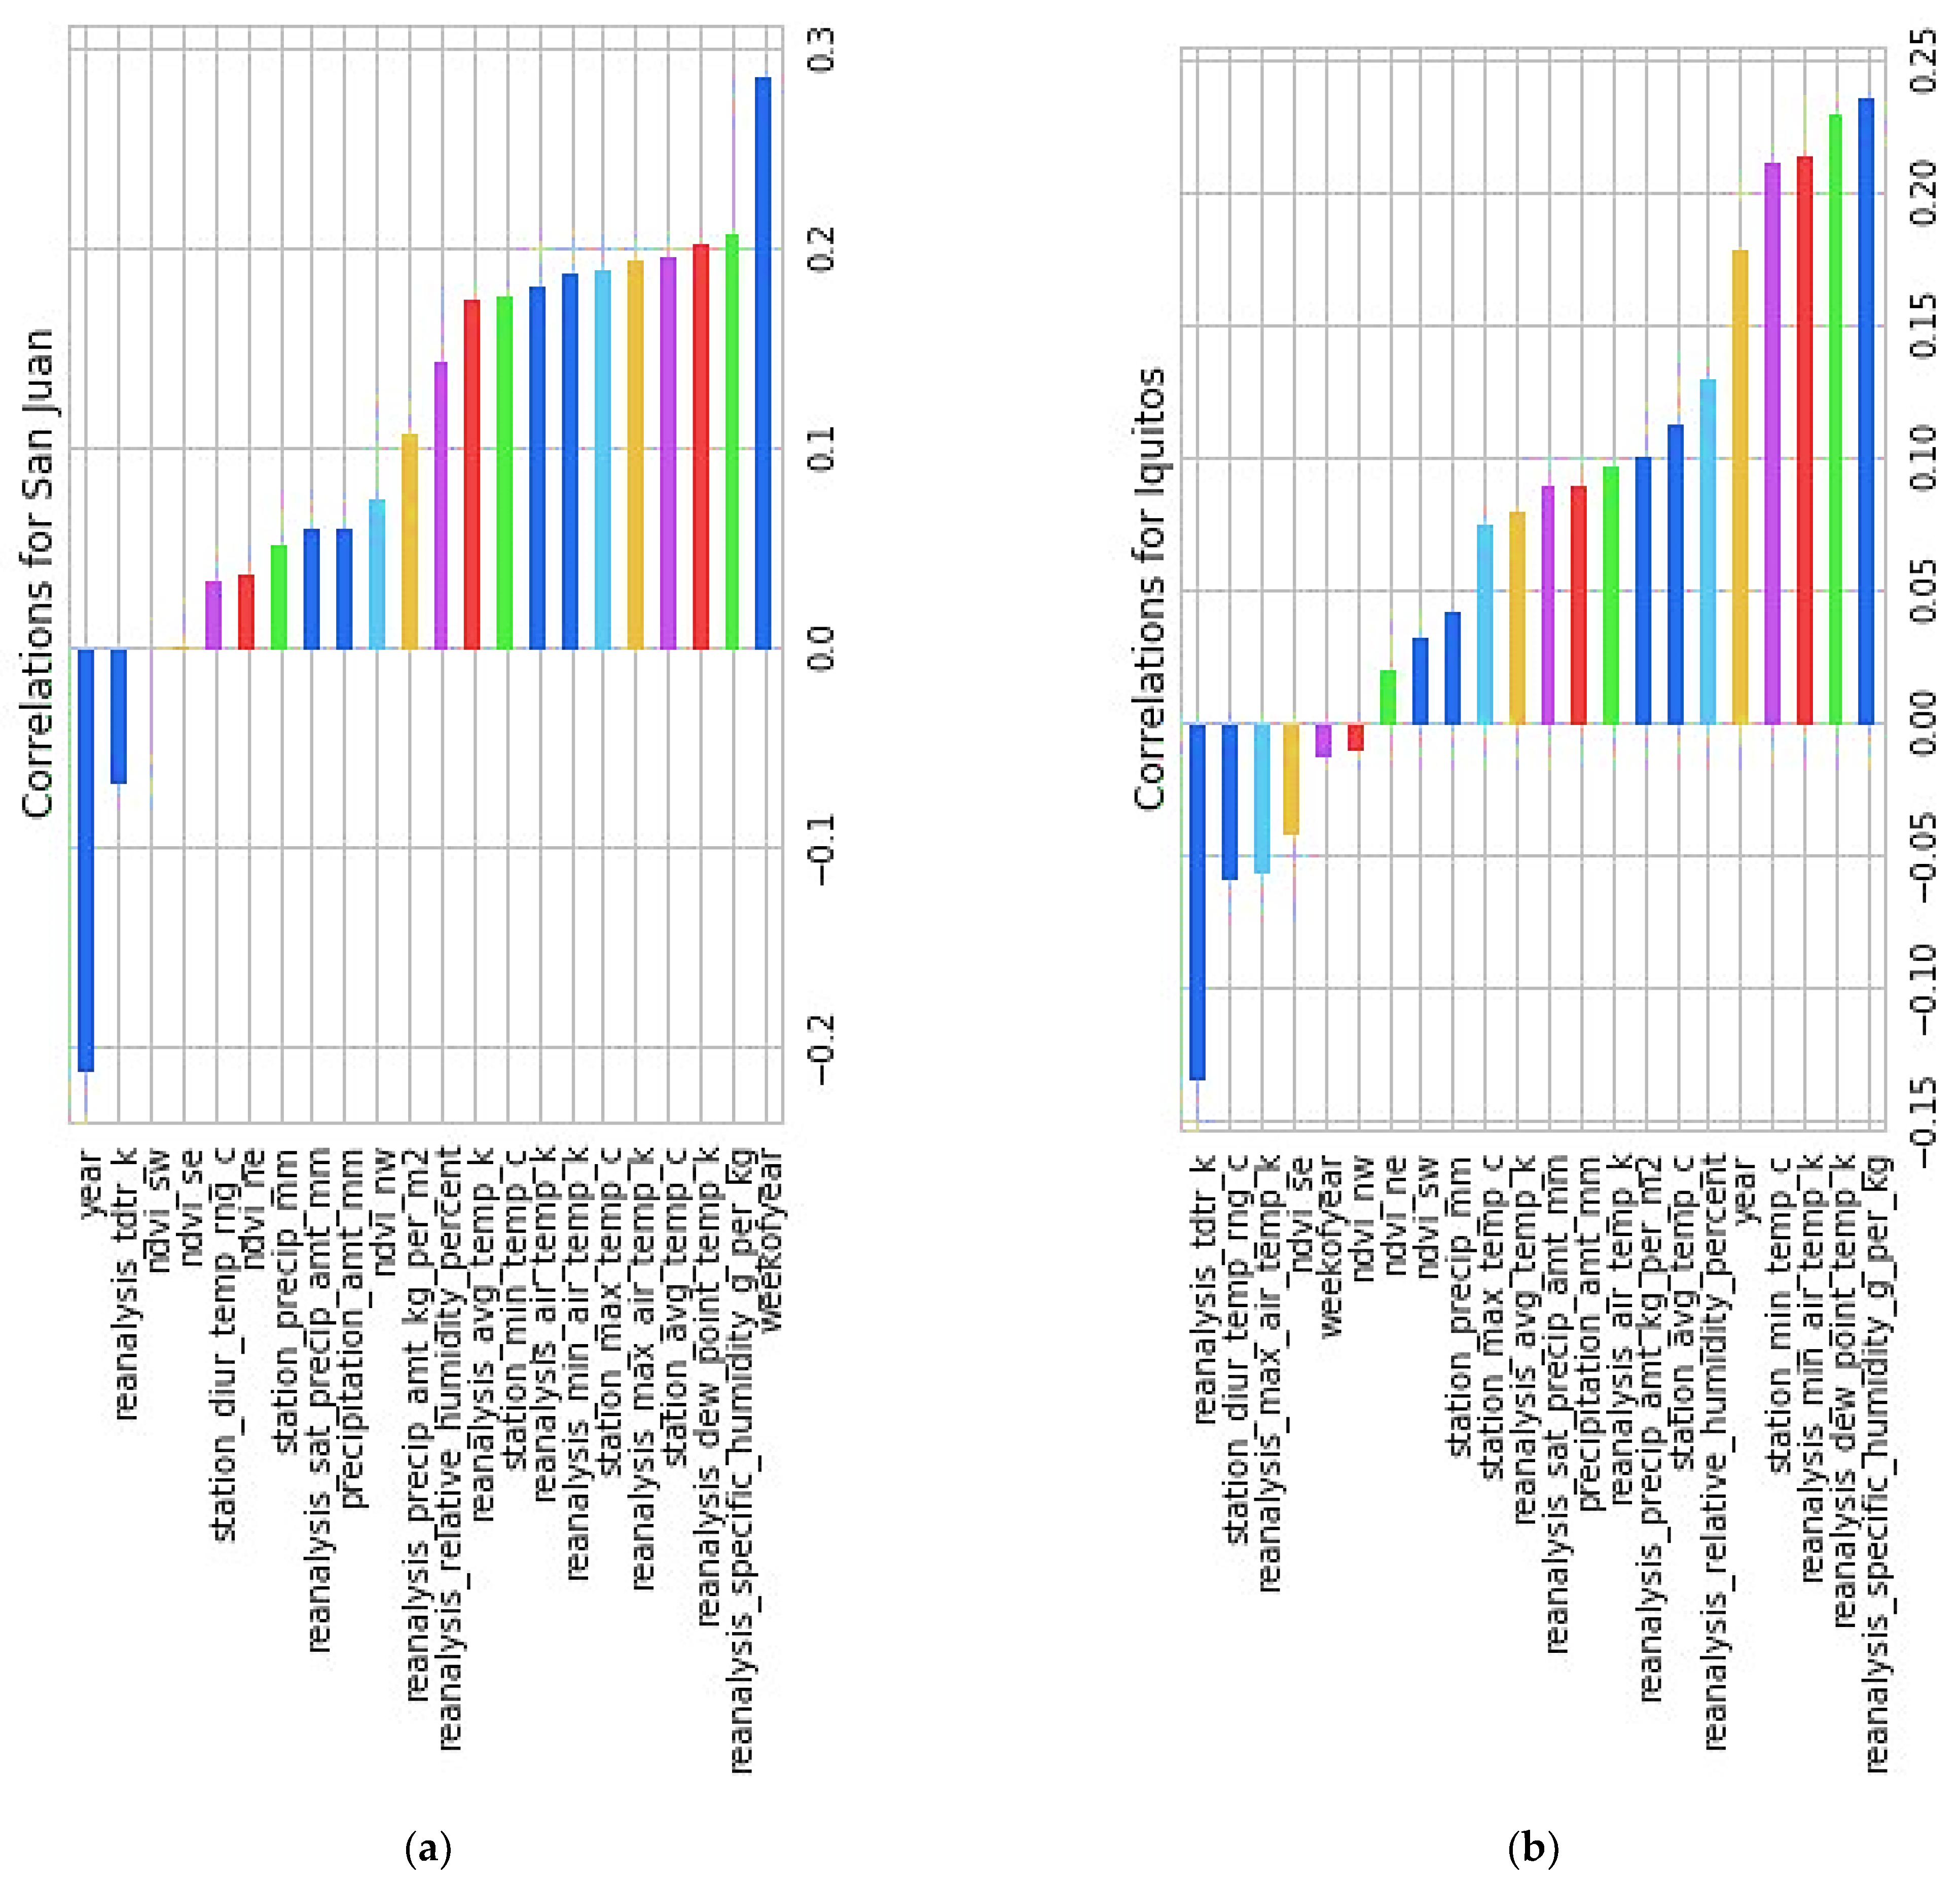
3.3. Features Selection
- reanalysis_specific_humidity_g_per_kg
- reanalysis_dew_point_temp_k
- reanalysis_min_air_temp_k
4. Results of Different Classifiers
5. Discussion and Conclusions
Author Contributions
Funding
Institutional Review Board Statement
Informed Consent Statement
Data Availability Statement
Acknowledgments
Conflicts of Interest
References
- Hoyos, W.; Aguilar, J.; Toro, M. Dengue models based on machine learning techniques: A systematic literature review. Artif. Intell. Med. 2021, 119, 102157. [Google Scholar] [CrossRef] [PubMed]
- Halstead, S.B. Pathogenesis of Dengue: Challenges to molecular biology. Science 1988, 239, 476–481. [Google Scholar] [CrossRef] [PubMed]
- Kurane, I. Dengue hemorrhagic fever with particular emphasis on immunopathogenesis. Comp. Immunol. Microbiol. Infect. Dis. 2007, 30, 329–340. [Google Scholar] [CrossRef] [PubMed]
- Guzman, M.G.; Halstead, S.B.; Artsob, H.; Buchy, P.; Farrar, J.; Gubler, D.J.; Hunsperger, E.; Kroeger, A.; Margolis, H.S.; Martínez, E.; et al. Dengue: A continuing global threat. Nat. Rev. Genet. 2010, 8, S7–S16. [Google Scholar] [CrossRef]
- Linares, E.M.; Pannuti, C.S.; Kubota, L.T.; Thalhammer, S. Immunospot assay based on fluorescent nanoparticles for Dengue fever detection. Biosens. Bioelectron. 2013, 41, 180–185. [Google Scholar] [CrossRef]
- San Martín, J.L.; Brathwaite, O.; Zambrano, B.; Solórzano, J.O.; Bouckenooghe, A.; Dayan, G.H.; Guzmán, M.G. The epidemiology of Dengue in the Americas over the last three decades: A disturbing reality. Am. J. Trop. Med. Hyg. 2010, 82, 128. [Google Scholar] [CrossRef]
- Gupta, N.; Gupta, N.; Srivastava, S.; Jain, A.; Chaturvedi, U.C. Dengue in India. Indian J. Med. Res. 2012, 136, 373. [Google Scholar]
- Thomas, E.A.; John, M.; Bhatia, A. Cutaneous manifestations of dengue viral infection in Punjab (north India). Int. J. Dermatol. 2007, 46, 715–719. [Google Scholar] [CrossRef]
- Arshad, I.; Malik, F.A.; Hussain, A.; Shah, S.A. Dengue fever: Clinico-pathologic correlations and their association with poor outcome. Prof. Med. J. 2011, 18, 57–63. [Google Scholar] [CrossRef]
- Whitehorn, J.; Farrar, J. Dengue. Br. Med. Bull. 2010, 95, 161–173. [Google Scholar] [CrossRef]
- World Health Organization. Dengue: Guidelines for Diagnosis, Treatment, Prevention and Control; World Health Organization: Geneva, Switzerland, 2009.
- Ranjit, S.; Kissoon, N. Dengue hemorrhagic fever and shock syndromes*. Pediatr. Crit. Care Med. 2011, 12, 90–100. [Google Scholar] [CrossRef]
- Ahmed, F.U.; Mahmood, C.B.; Sharma, J.D.; Hoque, S.M.; Zaman, R. Dengue and Dengue Haemorrhagic Fever in children during the 2000 outbreak in Chittagong, Bangladesh. 2001. Available online: https://apps.who.int/iris/handle/10665/163693 (accessed on 9 March 2023).
- Chen, L.H.; E Wilson, M. Dengue and chikungunya infections in travelers. Curr. Opin. Infect. Dis. 2010, 23, 438–444. [Google Scholar] [CrossRef] [PubMed]
- Jain, A. Machine Learning Techniques for Medical Diagnosis: A Review; D.U., Conference Center: New Delhi, India, 2015. [Google Scholar]
- Kononenko, I. Machine learning for medical diagnosis: History, state of the art and perspective. Artif. Intell. Med. 2001, 23, 89–109. [Google Scholar] [CrossRef] [PubMed]
- Raval, D.; Bhatt, D.; Kumhar, M.K.; Parikh, V.; Vyas, D. Medical diagnosis system using machine learning. Int. J. Comput. Sci. Commun. 2016, 7, 177–182. [Google Scholar]
- Cetiner, B.G.; Sari, M.; Aburas, H. Recognition of Dengue Disease Patterns Using Artificial Neural Networks. In Proceedings of the 5th International Advanced Technologies Symposium (IATS’09), Karabük, Turkey, 13—15 May 2009. [Google Scholar]
- Rachata, N.; Charoenkwan, P.; Yooyativong, T.; Chamnongthal, K.; Lursinsap, C.; Higuchi, K. Automatic prediction system of dengue hemorrhagic-fever outbreak risk by using entropy and artificial neural network. In Proceedings of the 2008 International Symposium on Communications and Information Technologies, Vientiane, Laos, 21–23 October 2008; IEEE: Piscataway, NJ, USA, 2008. [Google Scholar]
- Wu, Y.; Lee, G.; Fu, X.; Hu, T. Detect climatic factors contributing to dengue outbreak based on a wavelet, support vector machines, and genetic algorithm. In Proceedings of the World Congress on Engineering 2018, London, UK, 2–4 July 2008. [Google Scholar]
- Ahmad, S.; Khan, S.; AlAjmi, M.F.; Dutta, A.K.; Dang, L.M.; Joshi, G.P.; Moon, H. Deep Learning Enabled Disease Diagnosis for Secure Internet of Medical Things. Comput. Mater. Contin. 2022, 73, 965–979. [Google Scholar] [CrossRef]
- Gomes, A.L.V.; Wee, L.J.K.; Khan, A.M.; Gil, L.H.V.G.; Marques, E.; Calzavara-Silva, C.E.; Tan, T.W. Classification of Dengue Fever Patients Based on Gene Expression Data Using Support Vector Machines. PLOS ONE 2010, 5, e11267. [Google Scholar] [CrossRef]
- Guo, P.; Liu, T.; Zhang, Q.; Wang, L.; Xiao, J.; Zhang, Q.; Luo, G.; Li, Z.; He, J.; Zhang, Y.; et al. Developing a dengue forecast model using machine learning: A case study in China. PLOS Neglected Trop. Dis. 2017, 11, e0005973. [Google Scholar] [CrossRef]
- Carvajal, T.M.; Viacrusis, K.M.; Hernandez, L.F.T.; Ho, H.T.; Amalin, D.M.; Watanabe, K. Machine learning methods reveal the temporal pattern of dengue incidence using meteorological factors in metropolitan Manila, Philippines. BMC Infect. Dis. 2018, 18, 1–15. [Google Scholar] [CrossRef]
- Panwar, A.; Bhatnagar, V.; Khari, M.; Salehi, A.W.; Gupta, G. A Blockchain Framework to Secure Personal Health Record (PHR) in IBM Cloud-Based Data Lake. Comput. Intell. Neurosci. 2022, 2022, 3045107. [Google Scholar] [CrossRef]
- Alrashed, F.A.; Alsubiheen, A.M.; Alshammari, H.; Mazi, S.I.; Al-Saud, S.A.; Alayoubi, S.; Kachanathu, S.J.; Albarrati, A.; Aldaihan, M.M.; Ahmad, T.; et al. Stress, Anxiety, and Depression in Pre-Clinical Medical Students: Prevalence and Association with Sleep Disorders. Sustainability 2022, 14, 11320. [Google Scholar] [CrossRef]
- Kalansuriya, C.S.; Aponso, A.C.; Basukoski, A. Machine Learning-Based Approaches for Location Based Dengue Prediction. In Fourth International Congress on Information and Communication Technology; Springer: Berlin/Heidelberg, Germany, 2020. [Google Scholar]
- Haq, A.U.; Li, J.P.; Ahmad, S.; Khan, S.; Alshara, M.A.; Alotaibi, R.M. Diagnostic Approach for Accurate Diagnosis of COVID-19 Employing Deep Learning and Transfer Learning Techniques through Chest X-ray Images Clinical Data in E-Healthcare. Sensors 2021, 21, 8219. [Google Scholar] [CrossRef] [PubMed]
- Gupta, G.; Salehi, A.W.; Sharma, B.; Kumar, N.; Sonia, G.; Vaidya, P. COVID-19: Automated Detection and Monitoring of Patients Worldwide Using Machine Learning, in Modeling, Control and Drug Development for COVID-19 Outbreak Prevention; Springer: Berlin/Heidelberg, Germany, 2022; pp. 731–761. [Google Scholar]
- Thomas, S.J.; L’Azou, M.; Barrett, A.D.; Jackson, N.A. Fast-track Zika vaccine development—Is it possible? New Engl. J. Med. 2016, 375, 1212–1216. [Google Scholar] [CrossRef]
- Gupta, G.; Gupta, N.; Gupta, A.; Vaidya, P.; Singh, G.K.; Jaiswal, V. Prediction of Alzheimer associated proteins (PAAP): A perspective to understand Alzheimer disease for therapeutic design. Int. J. Bioinform. Res. Appl. 2021, 17, 363–374. [Google Scholar] [CrossRef]
- Thakur, B.; Kumar, N.; Gupta, G. Machine learning techniques with ANOVA for the prediction of breast cancer. Int. J. Adv. Technol. Eng. Explor. 2022, 9, 232. [Google Scholar]
- Yousef, R.; Gupta, G.; Yousef, N.; Khari, M. A holistic overview of deep learning approach in medical imaging. Multimedia Syst. 2022, 28, 881–914. [Google Scholar] [CrossRef]
- Gill, H.S.; Murugesan, G.; Khehra, B.S.; Sajja, G.S.; Gupta, G.; Bhatt, A. Fruit recognition from images using deep learning applications. Multimedia Tools Appl. 2022, 81, 33269–33290. [Google Scholar] [CrossRef]
- Macrae, A.; de Colella, C.S.; Sebastian, E. CS229 Project: Classification of Dengue Fever Outcomes from Early Transcriptional Patterns. Available online: https://www.semanticscholar.org/paper/CS-229-Project-%3A-Classification-of-Dengue-fever-Macrae-Colella/b8e1ba4d0d2555fef4466be15207ff276b61d49f (accessed on 9 March 2023).
- Iqbal, N.; Islam, M. Machine learning for Dengue outbreak prediction: An outlook. Int. J. Adv. Res. Comput. Sci. 2017, 8, 93–102. [Google Scholar]
- Focks, D.A.; Daniels, E.; Haile, D.G.; Keesling, J.E. A Simulation Model of the Epidemiology of Urban Dengue Fever: Literature Analysis, Model Development, Preliminary Validation, and Samples of Simulation Results. Am. J. Trop. Med. Hyg. 1995, 53, 489–506. [Google Scholar] [CrossRef]
- Hopp, M.J.; Foley, J.A. Global-Scale Relationships between Climate and the Dengue Fever Vector, Aedes Aegypti. Clim. Chang. 2001, 48, 441–463. [Google Scholar] [CrossRef]
- Hartley, L.; Donnelly, C.; Garnett, G. The seasonal pattern of Dengue in endemic areas: Mathematical models of mechanisms. Trans. R. Soc. Trop. Med. Hyg. 2002, 96, 387–397. [Google Scholar] [CrossRef]
- De Paula, S.O.; Fonseca, B.A.L.D. Dengue: A review of the laboratory tests a clinician must know to achieve a correct diagnosis. Braz. J. Infect. Dis. 2004, 8, 390–398. [Google Scholar] [CrossRef] [PubMed]
- Ibrahim, F.; Taib, M.N.; Abas, W.A.B.W.; Guan, C.C.; Sulaiman, S. A novel dengue fever (D.F.) and dengue hemorrhagic fever (DHF) analysis using artificial neural network (ANN). Comput. Methods Programs Biomed. 2005, 79, 273–281. [Google Scholar] [CrossRef]
- Fink, J.; Gu, F.; Ling, L.; Tolfvenstam, T.; Olfat, F.; Chin, K.C.; Aw, P.; George, J.; Kuznetsov, V.A.; Schreiber, M.; et al. Host Gene Expression Profiling of Dengue Virus Infection in Cell Lines and Patients. PLOS Neglected Trop. Dis. 2007, 1, e86. [Google Scholar] [CrossRef] [PubMed]
- A Gadkari, R.; Srinivasan, N. Prediction of protein-protein interactions in dengue virus coat proteins guided by low resolution cryoEM structures. BMC Struct. Biol. 2010, 10, 17. [Google Scholar] [CrossRef]
- Tanner, L.; Schreiber, M.; Low, J.G.H.; Ong, A.; Tolfvenstam, T.; Lai, Y.L.; Ng, L.C.; Leo, Y.S.; Puong, L.T.; Vasudevan, S.; et al. Decision Tree Algorithms Predict the Diagnosis and Outcome of Dengue Fever in the Early Phase of Illness. PLOS Neglected Trop. Dis. 2008, 2, e196. [Google Scholar] [CrossRef]
- Butt, N.; Abbassi, A.; Munir, S.M.; Ahmad, S.M.; Sheikh, Q.H. Haematological and biochemical indicators for the early diagnosis of dengue viral infection. J. Coll. Physicians Surg. Pak. 2008, 18, 282–285. [Google Scholar]
- Choudhury, Z.M.; Banu, S.; Islam, A.M. Forecasting Dengue Incidence in Dhaka, Bangladesh: A Time Series Analysis. 2008. Available online: https://apps.who.int/iris/handle/10665/170465 (accessed on 9 March 2023).
- De Kruif, M.D.; Setiati, T.E.; Mairuhu, A.T.A.; Koraka, P.; Aberson, H.A.; Spek, C.A.; Osterhaus, A.D.M.E.; Reitsma, P.H.; Brandjes, D.P.M.; Soemantri, A.; et al. Differential Gene Expression Changes in Children with Severe Dengue Virus Infections. PLOS Neglected Trop. Dis. 2008, 2, e215. [Google Scholar] [CrossRef]
- Rissino, S.; Lambert-Torres, G. Rough Set Theory—Fundamental Concepts, Principals, Data Extraction, and Applications. In Data Mining and Knowledge Discovery in Real Life Applications; IntechOpen: Cambridge, UK, 2009. [Google Scholar]
- Aburas, H.M.; Cetiner, B.G.; Sari, M. Dengue confirmed-cases prediction: A neural network model. Expert Syst. Appl. 2010, 37, 4256–4260. [Google Scholar] [CrossRef]
- Madhu, G.; Reddy, G.; Kiranmai, C. Hypothetical description for intelligent data mining. Int. J. Comput. Sci. Eng. 2010, 2, 2349–2352. [Google Scholar]
- Althouse, B.M.; Ng, Y.Y.; Cummings, D.A.T. Prediction of Dengue Incidence Using Search Query Surveillance. PLOS Neglected Trop. Dis. 2011, 5, e1258. [Google Scholar] [CrossRef] [PubMed]
- Gomide, J.; Veloso, A.; Meira, W.; Almeida, V.; Benevenuto, F.; Ferraz, F.; Teixeira, M. Dengue surveillance based on a computational model of spatio-temporal locality of Twitter. In Proceedings of the 3rd International Web Science Conference, Koblenz, Germany, 15–17 June 2011; p. 3. [Google Scholar]
- Brasier, A.; Scott, T.W.; Morrison, A.C.; Kochel, T.J.; Spratt, H.M.; Bazan, I.; Forshey, B.M.; Garcia, J.; Victor, S.S.; Rocha, C.; et al. A Three-Component Biomarker Panel for Prediction of Dengue Hemorrhagic Fever. Am. J. Trop. Med. Hyg. 2012, 86, 341–348. [Google Scholar] [CrossRef] [PubMed]


| Year | Reference | Machine Learning/Other Techniques | Findings |
|---|---|---|---|
| 1995 | [37] |
|
|
| 2001 | [38] |
|
|
| 2002 | [39] |
|
|
| 2004 | [40] |
|
|
| 2005 | [41] |
|
|
| 2007 | [42] |
|
|
| 2008 | [43] |
|
|
| 2008 | [44] |
|
|
| 2008 | [45] |
|
|
| 2008 | [46] |
|
|
| 2008 | [47] |
|
|
| 2009 | [48] |
|
|
| 2010 | [22] |
|
|
| 2010 | [49] |
|
|
| 2010 | [43] |
|
|
| 2010 | [4] |
|
|
| 2010 | [50] |
|
|
| 2010 | [19] |
|
|
| 2011 | [51] |
|
|
| 2011 | [52] |
|
|
| 2012 | [53] |
|
|
| Dataset | Data |
|---|---|
| Training | 1456 |
| Testing | 416 |
| Total | 1872 |
| Parameter | Correlation (1/0.9) |
|---|---|
| 1 | |
| 1 | |
| 0.9 | |
| 0.9 | |
| 0.9 | |
| 0.9 | |
| 0.9 | |
| 0.9 | |
| 0.9 | |
| 0.9 |
| City | Features | Labels |
|---|---|---|
| San Juan | 936, 24 | 936, 4 |
| Iquitos | 520, 24 | 520, 4 |
| Total Features | 1456, 24 | 1456, 4 |
| City | Increase in Cases (Range in Weeks) | Increase in Outbreak (Range in Weeks) |
|---|---|---|
| San Juan | 35th–45th | 35th–45th |
| Iquitos | 45th–50th | 45th–50th |
| ML Classifier | K Fold = 10 | Mean | |||||||||
|---|---|---|---|---|---|---|---|---|---|---|---|
| Scoring Accuracies | |||||||||||
| 1 | 2 | 3 | 4 | 5 | 6 | 7 | 8 | 9 | 10 | ||
| KNN | 0.095890 | 0.034246 | 0.082191 | 0.082191 | 0.082191 | 0.054794 | 0.041379 | 0.027586 | 0.062068 | 0.068965 | 6.315068 |
| Decision Tree | 0.075342 | 0.068493 | 0.109589 | 0.068493 | 0.068493 | 0.109589 | 0.055172 | 0.068965 | 0.048275 | 0.048275 | 7.206896 |
| Random Forest | 0.075342 | 0.082191 | 0.082191 | 0.143835 | 0.047945 | 0.109589 | 0.075862 | 0.096551 | 0.082758 | 0.075862 | 8.721303 |
| Gaussian NB | 0.075342 | 0.082191 | 0.047945 | 0.068493 | 0.047945 | 0.095890 | 0.062068 | 0.048275 | 0.089655 | 0.082758 | 7.005668 |
| Support Vector Classifier | 0.068493 | 0.068493 | 0.061643 | 0.068493 | 0.061643 | 0.075342 | 0.062068 | 0.055172 | 0.075862 | 0.089655 | 6.868682 |
Disclaimer/Publisher’s Note: The statements, opinions and data contained in all publications are solely those of the individual author(s) and contributor(s) and not of MDPI and/or the editor(s). MDPI and/or the editor(s) disclaim responsibility for any injury to people or property resulting from any ideas, methods, instructions or products referred to in the content. |
© 2023 by the authors. Licensee MDPI, Basel, Switzerland. This article is an open access article distributed under the terms and conditions of the Creative Commons Attribution (CC BY) license (https://creativecommons.org/licenses/by/4.0/).
Share and Cite
Gupta, G.; Khan, S.; Guleria, V.; Almjally, A.; Alabduallah, B.I.; Siddiqui, T.; Albahlal, B.M.; Alajlan, S.A.; AL-subaie, M. DDPM: A Dengue Disease Prediction and Diagnosis Model Using Sentiment Analysis and Machine Learning Algorithms. Diagnostics 2023, 13, 1093. https://doi.org/10.3390/diagnostics13061093
Gupta G, Khan S, Guleria V, Almjally A, Alabduallah BI, Siddiqui T, Albahlal BM, Alajlan SA, AL-subaie M. DDPM: A Dengue Disease Prediction and Diagnosis Model Using Sentiment Analysis and Machine Learning Algorithms. Diagnostics. 2023; 13(6):1093. https://doi.org/10.3390/diagnostics13061093
Chicago/Turabian StyleGupta, Gaurav, Shakir Khan, Vandana Guleria, Abrar Almjally, Bayan Ibrahimm Alabduallah, Tamanna Siddiqui, Bader M. Albahlal, Saad Abdullah Alajlan, and Mashael AL-subaie. 2023. "DDPM: A Dengue Disease Prediction and Diagnosis Model Using Sentiment Analysis and Machine Learning Algorithms" Diagnostics 13, no. 6: 1093. https://doi.org/10.3390/diagnostics13061093
APA StyleGupta, G., Khan, S., Guleria, V., Almjally, A., Alabduallah, B. I., Siddiqui, T., Albahlal, B. M., Alajlan, S. A., & AL-subaie, M. (2023). DDPM: A Dengue Disease Prediction and Diagnosis Model Using Sentiment Analysis and Machine Learning Algorithms. Diagnostics, 13(6), 1093. https://doi.org/10.3390/diagnostics13061093