Abstract
In this study, we looked at the viability of utilizing serum to differentiate between gallbladder (GB) stones and GB polyps using Surface-enhanced Raman spectroscopy (SERS), which has the potential to be a quick and accurate means of diagnosing benign GB diseases. Rapid and label-free SERS was used to conduct the tests on 148 serum samples, which included those from 51 patients with GB stones, 25 patients with GB polyps and 72 healthy persons. We used an Ag colloid as a Raman spectrum enhancement substrate. In addition, we employed orthogonal partial least squares discriminant analysis (OPLS-DA) and principal component linear discriminant analysis (PCA-LDA) to compare and diagnose the serum SERS spectra of GB stones and GB polyps. The diagnostic results showed that the sensitivity, specificity, and area under curve (AUC) values of the GB stones and GB polyps based on OPLS-DA algorithm reached 90.2%, 97.2%, 0.995 and 92.0%, 100%, 0.995, respectively. This study demonstrated an accurate and rapid means of combining serum SERS spectra with OPLS-DA to identify GB stones and GB polyps.
1. Introduction
Benign gallbladder (GB) disease usually presents as luminal lesions and localized or diffuse thickening of the GB wall. GB stones and GB polyps are the two most prevalent benign disorders and have a 5–10% probability of becoming cancerous (malignant) [1]. These benign diseases include adenomyomatosis, acute cholecystitis and others [2], which exhibit a range of clinical signs and symptoms. Patients may be asymptomatic or may suffer from acute biliary colic, jaundice and fever. Required treatment and management strategies differ accordingly. In addition, benign GB diseases can resemble GB cancers and present with a variety of imaging appearances [3,4]. Therefore, differentiating these diseases for the purposes of therapy and prognosis is essential.
Currently, abdominal B ultrasound, computed tomography (CT) and other imaging technologies are commonly used to identify GB stones and GB polyps, but they all require expensive software and hardware as well as visual observation of imaging physicians to determine results. They also have the problem of low sensitivity [5,6,7]. Laboratory results have revealed the leukocytosis with a left shift and minimal increase in the levels of bilirubin and alkaline phosphatase. Overall, GB stones and GB polyps can be neither confirmed nor ruled out by a single clinical finding or laboratory test [3]. Therefore, finding a rapid and accurate diagnostic method to identify benign GB disease is necessary.
Surface-enhanced Raman spectroscopy (SERS) is a method of boosting the Raman signals of biomolecules by utilizing nanometerized metal substrates, including metal colloids [8]. SERS makes it easier to identify alterations in the molecular “fingerprint” of biological fluids related to cancer, including blood [9], urine [10] and saliva [11]. SERS has become common in the examination of biofluids for diagnosing various illnesses, particularly cancer [12,13]. Several studies have been conducted on SERS of blood serum or plasma samples [14,15,16,17]. Feng et al. [18] used silver sol as an active substrate for SERS in conjunction with plasma detection to provide a simple and noninvasive method for plasma detection of nasopharyngeal cancer. After analyzing the SERS spectra of 43 patients with nasopharyngeal cancer and those of 33 healthy individuals, the researchers discovered that when compared to the plasma of normal people, that of patients with nasopharyngeal cancer contained higher percentages of nucleic acids, collagen, phospholipids and phenylalanine but lower percentages of amino acids and carbohydrates. In addition, the researchers used principal component linear discriminant analysis (PCA-LDA) to identify a sensitivity and specificity of 90.7% and 100%, respectively, with the two types of plasma. However, serum SERS technology has yet to be used in diagnosing GB stones and GB polyps.
Multivariate statistical analysis combined with SERS for data analysis has been widely used in disease diagnosis [19]. Commonly used algorithms in multivariate statistical analysis include orthogonal partial least squares discriminant analysis (OPLS-DA), partial least squares discrimination analysis (PLS-DA), and principal component analysis (PCA). In contrast with PCA, OPLS-DA is a supervised statistical method used for DA, and its most important feature is that it can remove data variations in the independent variable X which are not related to those of categorical variable Y. Categorical information is mainly concentrated in a single principal component. Therefore, the model is simple and easy to interpret. In addition, its discriminant effect as well as visualization of the principal component score plot is more obvious [20]. OPLS-DA is used most commonly in metabolomics analysis [21,22]. Li et al., using SERS and OPLS-DA methods to study serum after total body irradiation in mice exposed to different radiation doses [23]. Kai et al., used SERS combined with OPLS-DA to differentiate between benign and malignant pleural effusions [24]. Driskell et al. studied the SERS spectra of eight rotavirus strains using PLS-DA and classified each strain at a >96% accuracy [25]. However, SERS combined with the OPLS-DA algorithm has yet to be applied to the classification diagnosis of GB stones and GB polyps.
In this study, we used SERS technology combined with multiple statistical analyses to establish a classification diagnostic model for healthy people and for patients with GB stones and GB polyps. The model obtained high diagnostic accuracy, revealing the tremendous potential that SERS technology has in differential diagnosis of benign GB diseases.
2. Materials and Methods
2.1. Serum Sample Collection and Preparation
In this case, 148 serum samples from the First Affiliated Hospital of Xinjiang Medical University were used in our investigation. Clinical diagnostics identified 51 cases of GB stone patients and 25 of GB polyp patients, with 72 cases identified as the healthy control group. Table 1 lists basic information about these participants, including their ages and gender. The medical ethics committee of the First Affiliated Hospital of Xinjiang Medical University approved the trial, and each patient completed an informed consent form (Approval No. K202107-16). Based on the standard operating protocols of clinical laboratories, blood samples were drawn. The serum was then separated from the blood samples by centrifuging them at 3000 rpm for 15 min. Finally, the serum samples were frozen (−80 °C) until the SERS measurement time was recorded.

Table 1.
Age and gender information of patients with GB stone, GB polyp, and healthy volunteers.
2.2. Serum SERS Spectra Measurements
The SERS spectra of the serum samples were examined using a Raman micro-spectrometer (ATR6500-785, Optosky, China) coupled with a 785-nm laser [26]. The serum samples were defrosted at room temperature prior to SERS measurements. A 1:1 ratio of 5 µL each of serum and Ag colloid was then produced. A 10-µL sample was taken from this combination and placed on an aluminum slide. Following air-drying at room temperature, SERS spectra were recorded [27]. Ag colloid was purchased from Nanjing Jianzhi Instrument Equipment Co., Ltd., Nanjing, China. The preparation method of Ag nanoparticles (Ag NPs) was reported by Leopold and Lendl [28]. Briefly, 200 mL of 1.0 mM silver nitrate solution were first heated to a boil, and then 5.0 mL of 1% trisodium citrate were added dropwise with vigorous stirring. The mixture was then allowed to boil for an additional hour until it turned gray. Add distilled water to the solution after it has cooled so that the volume remains at 200 mL [14]. Prior to each online capture, a wavelength calibration was performed. The laser power and integration time were 5 mW and 3 s, respectively. The spectral range of the data was 600–1800 cm−1 and was collected using a 20× objective lens. Each sample was tested five times, and the average result was then used to determine the sample’s spectral data.
2.3. Spectral Data Pre-Processing
SERS data were preprocessed using smoothing, baseline correction and normalization methods. We used the SavitzkyGolay algorithm (order 5.9 points window) to smooth filter the collected serum spectral data, which not only improved the smoothness of the spectrum but also reduced the interference of noise [10]. The baseline was removed using the adaptive iteratively reweighted penalized least squares algorithm [29]. Vector normalization processing was conducted on each spectrum [30]. This processing was performed using MATLAB R2020a and Origin 64 software.
2.4. Data Analysis
We used SIMCA 14.0 software (Umetrics, Umea, Sweden) to conduct an analysis of Raman spectrum data. The principal component scores of the OPLS-DA models were used to accurately reflect the classification of diseases, and the performance of the OPLS model was assessed using the goodness-of-fit parameters R2 and Q2 [31] as related to the explained and predicted variances, respectively. The accurate performances of the diagnostic models under various illnesses were validated using a receiver operating characteristic (ROC) curve. The AUC values of these models were used to measure their quantitative performance, where higher AUC values indicated better model performance. The AUC values typically range from 0.5 to 1.0 [32]. Additionally, we used MATLAB R2021a software to perform PCA-LDA analysis and compared the results with the OPLA-DA classification model using three different metrics: sensitivity, specificity, and accuracy. As assessment criteria for the models, sensitivity and specificity were also used to gauge how well the models distinguished between patients with benign GB disease and controls. In this study, sensitivity refers to the probability that the model correctly diagnoses patients with benign GB disease [33]. In addition, the classifier and capacity of the OPLS-DA models in categorizing unidentified samples were assessed using 10-fold cross validation. For validation, the model was resampled 100 times under the null hypothesis using random permutations of the Y matrix [34].
3. Results and Discussion
3.1. Raman Spectral Analysis
Figure S1 displays the spectral preprocessing of a representative serum sample from a healthy person. Due to instrument noise and outside ambient noise, denoising was first conducted to enhance the spectral signals in the spectrum collection operations of the serum samples. Note that the spectrum then had to be adjusted for baseline because the Raman signal was accompanied by the development of an autofluorescence signal in the biological material. Finally, each spectrum underwent vector normalization.
In this investigation, the Ag colloid served as an improved substrate. The results of an Ag nanoparticle (NP) UV absorption spectra and transmission electron microscopy micrograph with a 50-nm bar are shown in Figure S2. The UV absorption spectra at a high absorption peak of 417 nm demonstrated the purity of these Ag NPs [35]. Ag NPs used in this measurement had excellent purity. We obtained the SERS and Raman spectra from the same GB-stone serum patient to demonstrate the boosting effects of the Ag colloid. SERS signals were evident, as shown in Figure 1, demonstrating that our Ag colloid considerably enhanced the serum’s Raman spectra. Therefore, as a substrate, the Ag colloid may be more effectively used.
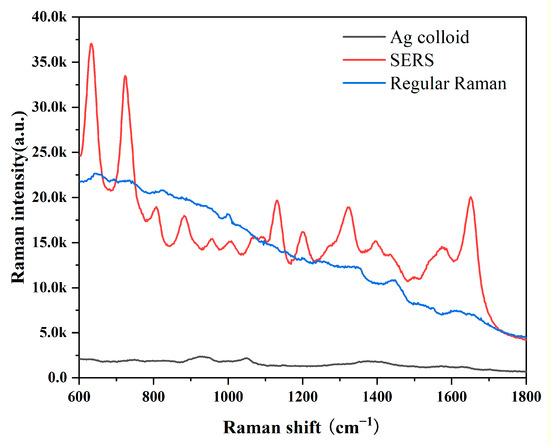
Figure 1.
Comparison of SERS, RS and background Raman signal of Ag colloid; The blood serum patient with GB stone was mixed with Ag colloid in a 1:1 ratio to obtain SERS spectra of the serum (Red line); Conventional Raman spectra of free Ag colloid in the same sample (Blue line); Background Raman signal of Ag colloid (Black line).
Datasets from the SRES spectra of 51 patients with GB stones, 25 patients with GB polyps and 72 healthy control subjects were gathered. A spectral data range of 600–1800 cm−1 was studied and provided the most diagnostically helpful information. Figure 2a–c shows the mean and difference spectrograms for GB stones and GB polyps, GB stones and healthy controls, and GB polyps and healthy controls, respectively, where the shaded areas represent the standard deviations of the means. The characteristic peaks of the three groups were mainly distributed in 637, 722, 810, 888, 1003, 1134, 1203, 1333, 1432, 1557 and 1652 cm−1. The histogram of the average intensity values of the serum SERS peaks with corresponding standard deviations is shown in Figure 2d. One-way analysis of variance was used to identify the significantly different peaks across the three groups with a p value (i.e., probability) cut-off of 0.05. These variations showed the changes in the components of serum biomolecules with GB disease progress. The attribution of each spectral peak is shown in Table 2 [13,14,15,17,36,37,38]. Based on a comparison of GB stones and GB polyps, the main peaks of difference characteristics were found to be 637 cm−1 (L-tyrosine, lactose), 722 cm−1 (coenzyme A), 1203 cm−1 (phenylalanine), 1432 cm−1 (D-glucosamine) and 1652 cm−1 (lipids), with all peaks showing statistical significance (p < 0.05). The characteristic peaks of GB stones and healthy controls were mainly distributed in 637 cm−1 (L-tyrosine, lactose), 722 cm−1 (coenzyme A), 1203 cm−1 (phenylalanine) and 1652 cm−1 (lipids), with all peaks showing statistical significance (p < 0.05). The characteristic peaks of GB polyps and healthy controls were mainly distributed in 637 cm−1 (L-tyrosine, lactose), 722 cm−1 (coenzyme A), 1134 cm−1 (D-mannose), 1203 cm−1 (phenylalanine), 1432 cm−1 (D-glucosamine) and 1652 cm−1 (lipids), with all peaks showing statistical significance (p < 0.05). At 637 cm−1 (L-tyrosine, lactose) and 1134 cm−1 (D-mannose) characteristic peaks, a significant upregulation or downregulation between the GB stone and GB polyp groups was observed, indicating the presence of abnormalities in serum glucose metabolism. Previous studies have reported that GB polyps have precancerous potential [39] and therefore are associated with glucose metabolism, which has been reported in other cancer research [18]. At 722 cm−1 (coenzyme A), the three groups exhibited significant differences, where coenzyme was a major factor in regulating sugar and fat as well as protein metabolism. In addition, at 1652 cm−1 (lipids), significant differences were observed between the three groups. The occurrence of GB polyps is generally believed to be closely related to cholesterol metabolism, and abnormal lipid metabolism may promote the formation of GB polyps [40]. The serum SERS signal of GB stone patients was significantly lower than that of healthy individuals at 888 cm−1 (Glutathione) peaks, indicating a decrease in the percentage of amino acids in the serum of GB stone patients, similar phenomena have been found in other areas of cancer research [41]. The serum SERS signal in the GB polyp group was higher than that in the healthy group at 1203 cm−1 (phenylalanine). It can be seen that the content of Phenylalanine in the serum of GB patients was significantly higher than that of healthy people, this may be because GB polyp was the cause of precancerous lesions, which was present in cervical cancer and other cancers [42]. Some studies have reported that due to the specific anatomical location of the gallbladder, when damage to the gallbladder occurs, obstruction of bile flow can affect the metabolic function of the liver, resulting in disorders of lipid metabolism and amino acid metabolism [3,43]. In our study, the differences between the spectral characteristic peaks suggested that the differential markers of the three groups were likely related to lipid or amino acid metabolism. Although differences were observed in certain SERS characteristic peaks of the three groups of serum, the three groups had similar spectral profiles. As a powerful classification algorithm, OPLS-DA and PCA-LDA was used to develop the classification model, to provide accurate results in measuring SERS performance, and thus to distinguish among the serum of GB stone and GB polyp patients and that of healthy controls.
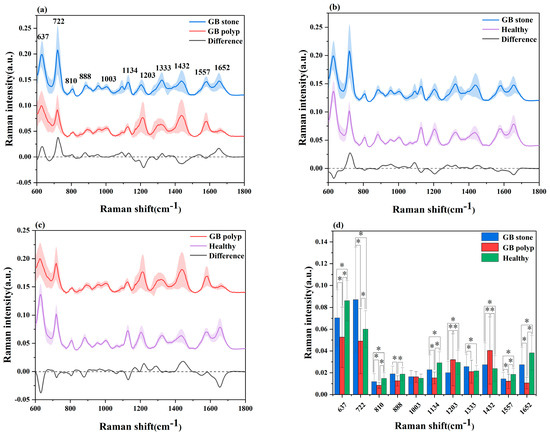
Figure 2.
(a) Comparison of average SERS spectra of a GB stone and GB polyp patients, (b) GB stone and Healthy objects, (c) GB polyp and Healthy objects. The shaded areas represent the standard deviations of the means. In addition shown at the bottom is the difference spectrum. (d) The corresponding histograms of the average intensities and standard deviations of SERS peaks among the three groups. * p < 0.05.
Table 2.
Tentative assignments of main peaks observed in SERS spectra of serum samples according to the literature.
3.2. Multivariate Analysis and Classification
The SERS spectral differences of the three types of serum were investigated using the OPLS-DA multivariate algorithm to evaluate the accuracy of screening utilizing serum SERS spectra. To create the model, 148 samples were used. We first compared the differences in serum SERS spectra of GB stones, GB polyps, and healthy controls using the supervised learning OPLS-DA of the SIMCA software, and we modelled the three types of samples for comparison. The score plot of the three group comparisons is shown in Figure 3a, where each point on the plot represents a sample. The horizontal and vertical coordinates represent the score values of principal components 1 and 2, respectively, and the ellipse represents the 95% confidence interval of the full sample analytical results. The plot shows significant differences among the serum SERS spectra of GB stones, GB polyps, and healthy individuals. The method can thus be used to clearly distinguish the three groups, where a clear tendency of separation is revealed between groups and aggregation within groups. Based on the following criteria, the robustness of these models was evaluated. R2X (cum), R2Y (cum) and Q2 (cum) are cumulative sums of squares (SS) of all x (PC) and y (SS) variables explained by all extracted components. Q2 (cum) is the proportion of all x (PC) and y variables that can be predicted for the extracted component [44]. For the triple classification model, R2X (cum) = 0.89, R2Y (cum) = 0.714 and Q2 (cum) = 0.609, indicating that the model has good predictive power. The permutation test was used to check the validity of the model and overfitting of the algorithm [34]. SIMCA was used to conduct 100 permutation tests on the dataset. The results of the three classification models are shown in Figure 4a, where the R2 and Q2 intercepts were 0.16 and −0.388, respectively. In general, when R2 was less than 0.3–0.4 and Q2 was less than 0.05, the model could be considered well-constructed. The results of this analysis demonstrated that the model developed by the OPLS-DA method was stable and could be applied to the classification of the three types of serum SERS spectra.
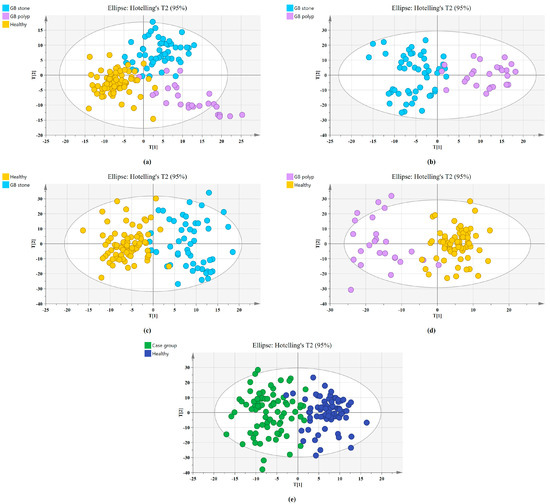
Figure 3.
Principal component score plots of the SERS spectra based on OPLS-DA. (a) Score plot for Healthy, GB stone, and GB polyp serum samples. (b) Score plot for GB stone, and GB polyp serum samples. (c) Score plot for Healthy, and GB stone serum samples. (d) Score plot for Healthy, and GB polyp serum samples. (e) Score plot for Healthy, and Case group* serum samples. (*Case group, GB stone, and GB polyp Group).
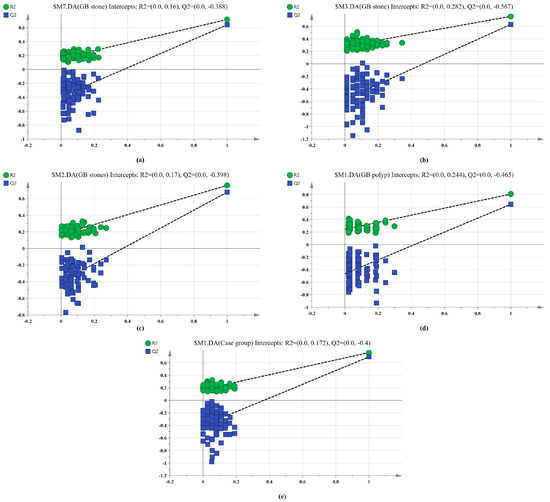
Figure 4.
100-permutation test of the SERS data for three types of serum based on OPLS-DA. (a) Healthy, GB stone, and GB polyp classification models. (b) GB stone vs. GB polyp classification models. (c) Healthy vs. GB stone classification models. (d) Healthy vs. GB polyp classification models. (e) Healthy vs. Case group classification models.
We also established a binary classification model based on OPLS-DA. Figure 3b–e shows the score plots of GB stones and GB polyps, GB stones and the healthy group, GB polyps and the healthy group, the case group (GB stones and GB polyps) and healthy group, respectively. Good quality parameters were shown by the OPLS-DA model, where R2X (cum), R2Y (cum) and Q2 (cum) for the classification models of GB stones and GB polyps were 0.82, 0.76 and 0.63, respectively. For the GB stones and healthy group, these same parameters were 0.84, 0.76 and 0.68, respectively. For the GB polyps and healthy group, they were 0.82, 0.81 and 0.64, respectively. Finally, for the case and healthy groups, they were 0.85, 0.76 and 0.69, respectively. Figure 4b–e shows the results of 100 permutation tests, where the intercepts of R2 and Q2 were 0.282, 0.172, 0.245, 0.171 and −0.562, −0.301, −0.462, −0.40, respectively. The intercepts of R2 and Q2 were less than 0.30 and 0.05, respectively, indicating that the model showed good robustness. This indicated that no overfitting occurs in our model, and the model has good prediction ability. These findings further reveal the effectiveness of the OPLS-DA-based serum SERS spectral classification method in differentiating between the two types of serum samples.
In addition, we used the PCA-LDA algorithm to classify and diagnose three sets of SERS data in order to compare with each other with the OPLS-DA algorithm. First, PCA was performed to reduce the dimensionality of the spectral dataset and extract PC features. The score plot of the three group comparisons was shown in Figure S3a, and we can see the classification effect of the PCA-LDA algorithm on the three sets of serum. The loading plot of the first PC (PC1), which was responsible for 41.4% of the overall variance, was displayed in Figure S3b. The findings of PC1 loading can be found to be in good accord with the variations in SERS spectra between the groups depicted in Figure 2a. Figure S4a–d shows the PCA score plots for groups GB stones and GB polyps, GB stones and the healthy group, GB polyps and the healthy group, the case group and healthy group, respectively. It can be found that the PCA-LDA algorithm was significantly worse than the OPLS-DA algorithm in classifying the two groups of serum.
The confusion matrix of the triple classification results based on the OPLS-DA and PCA-LDA algorithm was shown in Table 3. The overall classification accuracy of the OPLS-DA and PCA-LDA algorithms were 92.6% and 83.8%, and the diagnostic sensitivity for the healthy, GB stone, and GB polyp groups were 98.60%, 90.20%, 80.00% and 83.30%, 84.30%, 84.00%, respectively. Figure 5 shows the calculated ROC curves using SIMCA software, where AUC (healthy Group) = 0.993, AUC (GB stone) = 0.989 and AUC (GB polyp) = 0.987, and the AUCs of all three approximated 1, indicating that the OPLS-DA model exhibited a good classification effect. Our binary classification results were shown in Table 4, where the overall classification accuracy of the OPLS-DA algorithms was greater than 93%, and the AUC values were higher than 0.99 in all four groups. The overall classification accuracy of the PCA-LDA algorithm ranged from 80–90%, and the AUC values for the four groups ranged from 0.874–0.905. The table thus shows that the classification model based on SERS and combined with the OPLS-DA algorithm has good diagnostic efficacy for benign GB diseases. In a previous study, Tung et al. [45] used bile juices as test specimens and employed the SERS technique to identify GB stone and GB polyp patients. However, the model exhibited poor discriminatory ability. In addition, Jin et al. [46] attempted infrared spectroscopic identification of GB polyps and GB stones using bile juices as specimens, achieving an overall classification accuracy of 78.6%. In our study, we used serum as specimens and the SERS technique to classify and diagnose GB stones and GB polyps with high accuracy. The serum test we employed was a non-invasive test as compared with that using bile juices. Here, accurate classification and diagnosis of disease could be achieved with just a single drop of blood serum from a patient. SERS-based technologies are quick, reliable, and accurate in terms of disease diagnostics and molecular identification. In addition, label-free SERS can utilize extensive fingerprint data for diagnosis and screening without having to label participants [47]. This study is a preliminary exploration of serum SERS technology combined with machine learning algorithms for diagnosing benign GB disease. A future work will investigate the metabolomics and other studies of serum from patients with GB disease to identify their specific diagnostic markers.
Table 3.
The results of triple classification confusion matrix based on OPLS-DA and PCA-LDA analysis.
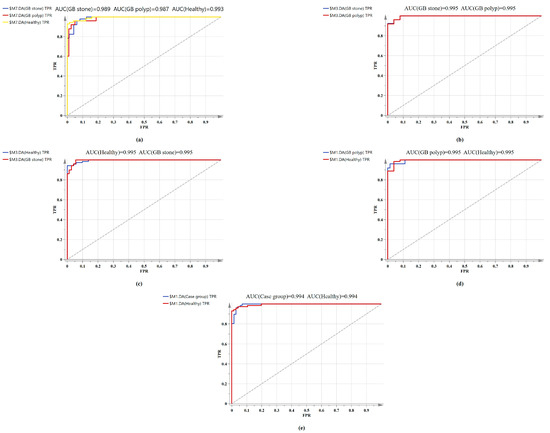
Figure 5.
Comparison of ROC curves of serum SERS spectral utilizing the OPLS-DA algorithm. (a) Healthy vs. GB stone vs. and GB polyp serum samples. (b) GB stone serum samples vs. GB polyp serum samples. (c) Healthy serum samples vs. GB stone serum samples. (d) Healthy serum samples vs. GB polyp serum samples. (e) Healthy serum samples vs. Case group serum samples.
Table 4.
The results of binary classification confusion matrix based on OPLS-DA and PCA-LDA analysis.
4. Conclusions
This study demonstrated for the first time the feasibility of SERS in discriminating between GB stones and GB polyps using serum samples. A portable Raman spectrometer was employed to obtain the SERS spectra of GB stone and GB polyp patients and healthy controls with only a small amount of serum, and the changes in biochemical components in the serum of patients as compared with normal subjects was reflected in the differences among the spectra. The OPLS-DA and PCA-LDA algorithms were combined with SERS to classify the SERS spectra of different serum types. The results showed that the sensitivity and specificity of the OPLS-DA algorithm for classifying GB stones, GB polyps and healthy groups were better than those of the PCA-LDA algorithm. This preliminary study is expected to set up a new path in developing a new clinical method for detecting GB stones and GB polyps. Our next step will be to collect a greater number of serum samples and conduct a more detailed investigation to evaluate the feasibility of the method.
Supplementary Materials
The following supporting information can be downloaded at: https://www.mdpi.com/article/10.3390/diagnostics13040619/s1, Figure S1: SERS spectral preprocessing results of a selected Healthy sample; (a) Raw spectrum; (b) The spectrum of the raw spectrum after denoising; (c) Baseline corrected spectrum; (d) Normalized spectrum; Figure S2: (a) The UV/visible absorption spectrum of the Ag colloid. The absorption maximum is located at 417 nm; (b) Transmission electron microscopy (TEM) image of Ag nanoparticles (NPs). Figure S3: (a) Principal component score plots of the SERS spectra based on PCA-LDA; (b) Loading plot for the first PC. The first PC accounting for 41.4% of the total variance. Figure S4: Principal component score plots of the SERS spectra based on PCA-LDA. (a) Score plot for GB stone, and GB polyp serum samples. (b) Score plot for Healthy, and GB stone serum samples. (c) Score plot for Healthy, and GB polyp serum samples. (d) Score plot for Healthy, and Case group serum samples.
Author Contributions
Conceptualization, methodology, formal analysis, and software, W.D.; validation, and investigation, J.D.; resources, J.L.; data curation, H.L.; writing—original draft preparation, H.Z.; writing—review and editing, L.S.; visualization, J.C.; supervision, R.L.; project administration, and funding acquisition, G.L. All authors have read and agreed to the published version of the manuscript.
Funding
This research was funded by “Special Funds for Development of Local Science and Technology from Central Government, grant number ZYYD2022B06” and “The State Key Laboratory of Pathogenesis, Prevention and Treatment of High Incidence Diseases in Central Asian, grant number SKL-HIDCA-2021-YG1 and SKL-HIDCA-2020-BC3”.
Institutional Review Board Statement
The study was conducted in accordance with the Declaration of Helsinki, and approved by the Ethics Committee of First Affiliated Hospital of Xinjiang Medical University (Approval Number: K202107-16).
Informed Consent Statement
Informed consent was obtained from all subjects involved in the study.
Data Availability Statement
Data underlying the results presented in this paper are not publicly available at this time but may be obtained from the authors upon reasonable request.
Conflicts of Interest
The authors declare no conflict of interest. The funders had no role in the design of the study; in the collection, analyses, or interpretation of data; in the writing of the manuscript, or in the decision to publish the results.
References
- Yu, M.H.; Kim, Y.J.; Park, H.S.; Jung, S.I. Benign gallbladder diseases: Imaging techniques and tips for differentiating with malignant gallbladder diseases. World J. Gastroenterol. 2020, 26, 2967–2986. [Google Scholar] [CrossRef] [PubMed]
- Chatterjee, A.; Vendrami, C.L.; Nikolaidis, P.; Mittal, P.K.; Bandy, A.J.; Menias, C.O.; Hammond, N.A.; Yaghmai, V.; Yang, G.-Y.; Miller, F.H. Uncommon Intraluminal Tumors of the Gallbladder and Biliary Tract: Spectrum of Imaging Appearances. Radiographics 2019, 39, 388–412. [Google Scholar] [CrossRef] [PubMed]
- Lam, R.; Zakko, A.; Petrov, J.C.; Kumar, P.; Duffy, A.J.; Muniraj, T. Gallbladder Disorders: A Comprehensive Review. Disease-A-Month 2021, 67, 101130. [Google Scholar] [CrossRef] [PubMed]
- Serra, C.; Felicani, C.; Mazzotta, E.; Gabusi, V.; Grasso, V.; De Cinque, A.; Giannitrapani, L.; Soresi, M. CEUS in the differential diagnosis between biliary sludge, benign lesions and malignant lesions. J. Ultrasound 2018, 21, 119–126. [Google Scholar] [CrossRef]
- Wennmacker, S.; Lamberts, M.; Di Martino, M.; Drenth, J.; Gurusamy, K.; van Laarhoven, C. Transabdominal ultrasound and endoscopic ultrasound for diagnosis of gallbladder polyps. Cochrane Database Syst. Rev. 2018, 8, CD012233. [Google Scholar] [CrossRef]
- Martin, E.; Gill, R.; Debru, E. Diagnostic accuracy of transabdominal ultrasonography for gallbladder polyps: Systematic review. Can. J. Surg. 2018, 61, 200–207. [Google Scholar] [CrossRef]
- Pinto, A.; Re, G.L.; Cagini, L.; Coppolino, F.; Ianora, A.A.S.; Bracale, R.; Giganti, M.; Romano, L. Accuracy of ultrasonography in the diagnosis of acute calculous cholecystitis: Review of the literature. Crit. Ultrasound J. 2013, 5 (Suppl. 1), S11. [Google Scholar] [CrossRef]
- Mosier-Boss, P.A. Review of SERS Substrates for Chemical Sensing. Nanomaterials 2017, 7, 142. [Google Scholar] [CrossRef]
- Su, N.; Dawuti, W.; Hu, Y.; Zhao, H. Noninvasive cholangitis and cholangiocarcinoma screening based on serum Raman spectroscopy and support vector machine. Photodiagnosis Photodyn. Ther. 2022, 40, 103156. [Google Scholar] [CrossRef]
- Dawuti, W.; Zheng, X.; Liu, H.; Zhao, H.; Dou, J.; Sun, L.; Chu, J.; Lin, R.; Lü, G. Urine surface-enhanced Raman spectroscopy combined with SVM algorithm for rapid diagnosis of liver cirrhosis and hepatocellular carcinoma. Photodiagnosis Photodyn. Ther. 2022, 38, 102811. [Google Scholar] [CrossRef]
- Blanco-Formoso, M.; Alvarez-Puebla, R.A. Cancer Diagnosis through SERS and Other Related Techniques. Int. J. Mol. Sci. 2020, 21, 2253. [Google Scholar] [CrossRef]
- Tahir, M.A.; Dina, N.E.; Cheng, H.; Valev, V.K.; Zhang, L. Correction: Surface-enhanced Raman spectroscopy for bioanalysis and diagnosis. Nanoscale 2021, 13, 13906. [Google Scholar] [CrossRef]
- Zhang, K.; Hao, C.; Huo, Y.; Man, B.; Zhang, C.; Yang, C.; Liu, M.; Chen, C. Label-free diagnosis of lung cancer with tissue-slice surface-enhanced Raman spectroscopy and statistical analysis. Lasers Med. Sci. 2019, 34, 1849–1855. [Google Scholar] [CrossRef]
- Kashif, M.; Majeed, M.I.; Hanif, M.A.; Rehman, A.U. Surface Enhanced Raman Spectroscopy of the serum samples for the diagnosis of Hepatitis C and prediction of the viral loads. Spectrochim. Acta Part A Mol. Biomol. Spectrosc. 2020, 242, 118729. [Google Scholar] [CrossRef]
- Li, S.; Zhang, Y.; Xu, J.; Li, L.; Zeng, Q.; Lin, L.; Guo, Z.; Liu, Z.; Xiong, H.; Liu, S. Noninvasive prostate cancer screening based on serum surface-enhanced Raman spectroscopy and support vector machine. Appl. Phys. Lett. 2014, 105, 091104. [Google Scholar] [CrossRef]
- Hong, Y.; Li, Y.; Huang, L.; He, W.; Wang, S.; Wang, C.; Zhou, G.; Chen, Y.; Zhou, X.; Huang, Y.; et al. Label-free diagnosis for colorectal cancer through coffee ring-assisted surface-enhanced Raman spectroscopy on blood serum. J. Biophotonics 2020, 13, e201960176. [Google Scholar] [CrossRef]
- Zhang, K.; Liu, X.; Man, B.; Yang, C.; Zhang, C.; Liu, M.; Zhang, Y.; Liu, L.; Chen, C. Label-free and stable serum analysis based on Ag-NPs/PS surface-enhanced Raman scattering for noninvasive lung cancer detection. Biomed Opt Express. 2018, 9, 4345–4358. [Google Scholar] [CrossRef]
- Feng, S.; Chen, R.; Lin, J.; Pan, J.; Chen, G.; Li, Y.; Cheng, M.; Huang, Z.; Chen, J.; Zeng, H. Nasopharyngeal cancer detection based on blood plasma surface-enhanced Raman spectroscopy and multivariate analysis. Biosens. Bioelectron. 2010, 25, 2414–2419. [Google Scholar] [CrossRef]
- Wang, J.; Lin, D.; Lin, J.; Yu, Y.; Huang, Z.; Chen, Y.; Lin, J.; Feng, S.; Li, B.; Liu, N.; et al. Label-free detection of serum proteins using surface-enhanced Raman spectroscopy for colorectal cancer screening. J. Biomed. Opt. 2014, 19, 087003. [Google Scholar] [CrossRef]
- Vu, T.; Riekeberg, E.; Qiu, Y.; Powers, R. Comparing normalization methods and the impact of noise. Metabolomics 2018, 14, 108. [Google Scholar] [CrossRef]
- Fu, J.; Yu, H.-D.; Wu, L.; Zhang, C.; Yun, Y.-H.; Zhang, W. Authentication of Geographical Origin in Hainan Partridge Tea (Mallotus obongifolius) by Stable Isotope and Targeted Metabolomics Combined with Chemometrics. Foods 2021, 10, 2130. [Google Scholar] [CrossRef] [PubMed]
- Tang, J.; Wang, Y.; Luo, Y.; Fu, J.; Zhang, Y.; Li, Y.; Xiao, Z.; Lou, Y.; Qiu, Y.; Zhu, F. Computational advances of tumor marker selection and sample classification in cancer proteomics. Comput. Struct. Biotechnol. J. 2020, 18, 2012–2025. [Google Scholar] [CrossRef] [PubMed]
- Li, L.; Xiao, R.; Wang, Q.; Rong, Z.; Zhang, X.; Zhou, P.; Fu, H.; Wang, S.; Wang, Z. SERS detection of radiation injury biomarkers in mouse serum. RSC Adv. 2018, 8, 5119–5126. [Google Scholar] [CrossRef] [PubMed]
- Liu, K.; Jin, S.; Song, Z.; Jiang, L. High accuracy detection of malignant pleural effusion based on label-free surface-enhanced Raman spectroscopy and multivariate statistical analysis. Spectrochim. Acta Part A Mol. Biomol. Spectrosc. 2019, 226, 117632. [Google Scholar] [CrossRef] [PubMed]
- Driskell, J.; Zhu, Y.; Kirkwood, C.D.; Zhao, Y.; Dluhy, R.A.; Tripp, R.A. Rapid and Sensitive Detection of Rotavirus Molecular Signatures Using Surface Enhanced Raman Spectroscopy. PLoS ONE 2010, 5, e10222. [Google Scholar] [CrossRef]
- Gao, N.; Wang, Q.; Tang, J.; Yao, S.; Li, H.; Yue, X.; Fu, J.; Zhong, F.; Wang, T.; Wang, J. Non-invasive SERS serum detection technology combined with multivariate statistical algorithm for simultaneous screening of cervical cancer and breast cancer. Anal. Bioanal. Chem. 2021, 413, 4775–4784. [Google Scholar] [CrossRef]
- Li, J.; Ding, J.; Liu, X.; Tang, B.; Bai, X.; Wang, Y.; Li, S.; Wang, X. Label-free serum detection of Trichinella spiralis using surface-enhanced Raman spectroscopy combined with multivariate analysis. Acta Trop. 2019, 203, 105314. [Google Scholar] [CrossRef]
- Leopold, N.; Lendl, B. A New Method for Fast Preparation of Highly Surface-Enhanced Raman Scattering (SERS) Active Silver Colloids at Room Temperature by Reduction of Silver Nitrate with Hydroxylamine Hydrochloride. J. Phys. Chem. B 2003, 107, 5723–5727. [Google Scholar] [CrossRef]
- Zhang, Z.-M.; Chen, S.; Liang, Y.-Z. Baseline correction using adaptive iteratively reweighted penalized least squares. Analyst 2010, 135, 1138–1146. [Google Scholar] [CrossRef]
- Gautam, R.; Vanga, S.; Ariese, F.; Umapathy, S. Review of multidimensional data processing approaches for Raman and infrared spectroscopy. EPJ Tech. Instrum. 2015, 2, 8. [Google Scholar] [CrossRef]
- Lussier, F.; Thibault, V.; Charron, B.; Wallace, G.Q.; Masson, J.-F. Deep learning and artificial intelligence methods for Raman and surface-enhanced Raman scattering. TrAC Trends Anal. Chem. 2020, 124, 115796. [Google Scholar] [CrossRef]
- Jin, H.; Ling, C. Using AUC and accuracy in evaluating learning algorithms. IEEE Trans. Knowl. Data Eng. 2005, 17, 299–310. [Google Scholar]
- Narkhede, S. Understanding auc-roc curve, Towards Data. Science 2018, 26, 220–227. [Google Scholar]
- Bai, Y.; Yu, Z.; Yi, S.; Yan, Y.; Huang, Z.; Qiu, L. Raman spectroscopy-based biomarker screening by studying the fingerprint characteristics of chronic lymphocytic leukemia and diffuse large B-cell lymphoma. J. Pharm. Biomed. Anal. 2020, 190, 113514. [Google Scholar] [CrossRef]
- Lin, Y.; Gao, J.; Tang, S.; Zhao, X.; Zheng, M.; Gong, W.; Xie, S.; Gao, S.; Yu, Y.; Lin, J. Label-free diagnosis of breast cancer based on serum protein purification assisted surface-enhanced Raman spectroscopy. Spectrochim. Acta Part A Mol. Biomol. Spectrosc. 2021, 263, 120234. [Google Scholar] [CrossRef]
- Li, S.-X.; Zeng, Q.-Y.; Li, L.-F.; Zhang, Y.-J.; Wan, M.-M.; Liu, Z.-M.; Xiong, H.-L.; Guo, Z.-Y.; Liu, S.-H. Study of support vector machine and serum surface-enhanced Raman spectroscopy for noninvasive esophageal cancer detection. J. Biomed. Opt. 2013, 18, 027008. [Google Scholar] [CrossRef]
- Zhang, Y.; Ye, X.; Xu, G.; Jin, X.; Luan, M.; Lou, J.; Wang, L.; Huang, C.; Ye, J. Identification and distinction of non-small-cell lung cancer cells by intracellular SERS nanoprobes. RSC Adv. 2016, 6, 5401–5407. [Google Scholar] [CrossRef]
- Nargis, H.; Nawaz, H.; Bhatti, H.; Jilani, K.; Saleem, M. Comparison of surface enhanced Raman spectroscopy and Raman spectroscopy for the detection of breast cancer based on serum samples. Spectrochim. Acta Part A Mol. Biomol. Spectrosc. 2020, 246, 119034. [Google Scholar] [CrossRef]
- Wiles, R.; Varadpande, M.; Muly, S.; Webb, J. Growth rate and malignant potential of small gallbladder polyps–Systematic review of evidence. Surgeon 2014, 12, 221–226. [Google Scholar] [CrossRef]
- Yu, Z.; Yang, C.; Bai, X.; Yao, G.; Qian, X.; Gao, W.; Huang, Y.; Tian, X.; Cheng, S.; Zheng, Y. Risk factors for cholesterol polyp formation in the gallbladder are closely related to lipid metabolism. Lipids Heal. Dis. 2021, 20, 1–6. [Google Scholar] [CrossRef]
- Feng, S.; Chen, R.; Lin, J.; Pan, J.; Wu, Y.; Li, Y.; Chen, J.; Zeng, H. Gastric cancer detection based on blood plasma surface-enhanced Raman spectroscopy excited by polarized laser light. Biosens. Bioelectron. 2011, 26, 3167–3174. [Google Scholar] [CrossRef] [PubMed]
- Feng, S.; Lin, D.; Lin, J.; Li, B.; Huang, Z.; Chen, G.; Zhang, W.; Wang, L.; Pan, J.; Chen, R.; et al. Blood plasma surface-enhanced Raman spectroscopy for non-invasive optical detection of cervical cancer. Analyst 2013, 138, 3967–3974. [Google Scholar] [CrossRef] [PubMed]
- van Dooren, M.; de Reuver, P. Gallbladder polyps and the challenge of distinguishing benign lesions from cancer. United Eur. Gastroenterol. J. 2022, 10, 625–626. [Google Scholar] [CrossRef] [PubMed]
- Shao, L.; Zhang, A.; Rong, Z.; Wang, C.; Jia, X.; Zhang, K.; Xiao, R.; Wang, S. Fast and non-invasive serum detection technology based on surface-enhanced Raman spectroscopy and multivariate statistical analysis for liver disease. Nanomedicine: Nanotechnology, Biol. Med. 2017, 14, 451–459. [Google Scholar] [CrossRef]
- Vu, T.D.; Sohng, W.; Jang, E.; Choi, D.; Chung, H. Feasibility of discrimination of gall bladder (GB) stone and GB polyp using voltage-applied SERS measurement of bile juice samples in conjunction with two-trace two-dimensional (2T2D) correlation analysis. Analyst 2020, 146, 1091–1098. [Google Scholar] [CrossRef]
- Hwang, J.; Chung, H.; Lee, K.G.; Kim, H.J.; Choi, D. Feasibility of infrared spectroscopy for discrimination between gallbladder polyp and gallbladder stone using bile juices. Microchem. J. 2015, 123, 118–124. [Google Scholar] [CrossRef]
- Zong, C.; Xu, M.; Xu, L.-J.; Wei, T.; Ma, X.; Zheng, X.-S.; Hu, R.; Ren, B. Surface-Enhanced Raman Spectroscopy for Bioanalysis: Reliability and Challenges. Chem. Rev. 2018, 118, 4946–4980. [Google Scholar] [CrossRef]


Disclaimer/Publisher’s Note: The statements, opinions and data contained in all publications are solely those of the individual author(s) and contributor(s) and not of MDPI and/or the editor(s). MDPI and/or the editor(s) disclaim responsibility for any injury to people or property resulting from any ideas, methods, instructions or products referred to in the content. |
© 2023 by the authors. Licensee MDPI, Basel, Switzerland. This article is an open access article distributed under the terms and conditions of the Creative Commons Attribution (CC BY) license (https://creativecommons.org/licenses/by/4.0/).