Abstract
Early detection of colorectal cancer is crucial for improving outcomes and reducing mortality. While there is strong evidence of effectiveness, currently adopted screening methods present several shortcomings which negatively impact the detection of early stage carcinogenesis, including low uptake due to patient discomfort. As a result, developing novel, non-invasive alternatives is an important research priority. Recent advancements in the field of breathomics, the study of breath composition and analysis, have paved the way for new avenues for non-invasive cancer detection and effective monitoring. Harnessing the utility of Volatile Organic Compounds in exhaled breath, breathomics has the potential to disrupt colorectal cancer screening practices. Our goal is to outline key research efforts in this area focusing on machine learning methods used for the analysis of breathomics data, highlight challenges involved in artificial intelligence application in this context, and suggest possible future directions which are currently considered within the framework of the European project ONCOSCREEN.
1. Introduction
Cancer is a group of complex diseases linked to abnormal cell growth with devastating consequences for the patient. It ranks as a leading cause of death and a profound barrier to increasing life expectancy worldwide [1]. Detection of cancer in early stages along with timely and appropriate treatment is a critical component of reducing cancer-related mortality and morbidity [2]. Currently, there is a lack of reliable screening modalities for highly fatal cancers like pancreatic and gastric cancer [3]. Similarly, for highly prevalent malignancies such as breast and colorectal cancer (CRC), there is plenty of room for enhancing the existing screening practices. In particular, colonoscopy and fecal immunochemical test (FIT) are widely accepted as the cornerstones for the early detection of CRC [4]. During a colonoscopy procedure, early precancerous lesions can be detected and removed by a clinical expert. Nevertheless, colonoscopy is an invasive and costly procedure with low rates of compliance [5]. FIT serves as a complementary or alternative screening modality to colonoscopy for patients that decline the latter [4]; it is a non-invasive and low-cost test that serves as a widely adopted screening procedure for the large part of the average-risk population. Nevertheless, FIT shows modest accuracy in detecting CRC and advanced adenoma (AA), with sensitivity remaining under 70% and 50%, respectively [6]. Hence, CRC screening suffers from both low rates of adherence to the test (e.g., colonoscopy) as well as low detection rates (e.g., FIT).
In an effort to address the aforementioned problems, recent technological advances have brought up new novel non- or minimally invasive approaches such as breath, blood, and imaging-based tests [7,8]. In recent years, metabolomics has steadily gained momentum in various frontiers including disease detection and personalized medicine [9,10]. Breath volatolomics, also known as breathomics, can be seen as a branch of metabolomics, focusing on human breath. Breathomics studies volatile organic compounds (VOCs) and their metabolites that come from our respiratory system and internal organs. By simply exhaling air through a breathing device, it becomes possible to capture and analyze the profile of VOCs that are exhaled and present in the sample. Typically, a “breath biopsy” can be acquired in a non-invasive manner through the use of analytical methods like gas chromatography–mass spectrometry (GC-MS) or by utilizing sensors of various electronic nose devices [11]. Over two thousand VOCs have been reported to emanate from the human body [12], forming an inexhaustible treasure trove of biomarkers, which in turn have been linked to various diseases, including cancer [13,14]. Cancer cells undergo metabolic alterations which can result in the release of specific VOCs. For example, it has been shown that these cells tend to metabolize glucose via aerobic glycolysis rather than oxidative phosphorylation, an effect known as the Warburg effect [15]. Researchers posit the hypothesis that these VOCs are released into the bloodstream and eventually expelled through exhalation, passing through the endobronchial cavity [16]. A free web-based database, also known as the Cancer Odor Database (COD), contains comprehensive information about cancer-related VOCs, with its data being extracted directly from the scientific literature [17]. Another more general and recent database, the Human Breathomics Database (HBD) [18], contains comprehensive information about VOCs reported in 2766 publications. It provides biomedical information, underlying biochemical pathways and current scientific evidence regarding the association of each VOC with various diseases. In particular, research efforts on the determination of cancer-related VOCs have shown that some may contribute to more than five different cancer types [14,19]. For example, Nakhleh et al. utilized 13 VOCs for the detection and discrimination between 17 different disease conditions from 813 patients [14]. Despite the fact that breath analysis is still in early stages of development, analyzing breath composition holds significant potential for contributing to several subfields of cancer research such as detection [11,13], screening/monitoring [20], prognosis [21], and treatment response [11,22]. This review will focus on the relevance of volatolomics to CRC and recent theoretical and technological advancements derived from the field of breathomics in this regard.
GC-MS is undeniably the gold standard in breath analysis in terms of precision, as it enables separation, identification, and quantification of the different VOCs in the exhaled breath gas. Alternative ways such as sensor-based techniques have also been introduced with increasing interest [23]. Since GC-MS is resource-intensive, time-consuming, and requires special expertise, sensor arrays in the form of breathing electronic devices/noses (e-noses) constitute mobile, cost-effective, and user-friendly diagnostic alternatives that are capable of providing quick results. Studies employing e-noses and breath-based VOCs towards detection of CRC and AA are emerging at an increasing rate [24,25,26,27,28]. As a trade-off for their virtues, the latter detect mixtures of VOCs instead of identifying the actual mass of specific compounds. In other words, sensor arrays or e-noses are designed to imitate the human olfactory system with the use of chemical sensors [29]. Applications of e-nose devices in terms of odor perception are most often treated as black box models, focusing more on the accuracy of the task to be performed (e.g., diagnosis/monitoring) and less on understanding of how and why the subsequent results are derived [29].
While the use of chemical sensors holds the potential to revolutionize today’s medical diagnostics on CRC breath, it also faces significant challenges and limitations [30]. First and foremost, confounding factors such as age, diet, genetics, and smoking habits can introduce variability in breath composition, threatening with inaccurate results [14]. Second, timing and method of breath sample collection are critical considerations also, as exhaled breath profiles can change rapidly with fluctuations in blood chemistry [31]. Third, standardized protocols for uniform and repeatable breath sampling are imperative. Technical sensitivity, particularly regarding sensor responses to temperature and humidity, presents obstacles that necessitate controlled and sterile environments for analysis [32]. Fourth, data analysis also poses difficulties, with the choice of statistical methods, validation, and complex modeling needing careful consideration [33]. For example, the breath signature of CRC derives from statistical procedure; one has to seek differences between hundreds of VOCs that might be present. Searching for statistically significant differences between breath profiles of CRC patients and healthy controls, one needs to take into account the multiple comparison problem to ensure no false discoveries [33]. Today, breath-based VOCs reported as biomarkers for CRC detection exhibit a substantial amount of variation in the scientific literature [8,34,35,36,37,38,39,40,41,42,43,44]. Fifth, achieving strong predictive values for disease diagnosis and monitoring large-scale, multicenter clinical trials with blind validation are required [30]. Sixth, special emphasis on reproducibility and adaptation to real-world clinical conditions have to be given so as to formulate widely accepted technical and clinical standards in order to accelerate research and finally integrate breath analysis into routine medical testing. A study discussing technical standards and recommendations for sample collection and analytic approaches for lung disease can be found in [45]. Addressing these challenges is crucial to establishing breath-based diagnosis in the clinical practice.
In this article we particularly focus on how advancements from the field of machine learning (ML) and artificial intelligence (AI) can be used towards useful, reliable, accurate, and reproducible research towards breath-based diagnosis. It is the first review article that exclusively focuses on AI applications for CRC detection using breathomics; it aims to present the latest findings reported on the use of AI techniques and methods targeting breath-based VOCs for CRC diagnosis and has been performed in the context of the Horizon Europe project ONCOSCREEN (https://oncoscreen.health/, accessed on 10 December 2023). The project seeks to develop novel methodologies for cancer screening and early detection, ultimately aiming to enhance citizen awareness, participation, and adherence to relevant protocols. Among the various solutions proposed by the project, CRC diagnosis using breath-based VOCs is planned to be pursued utilizing both analytical and sensor-based methodologies. As a first step, a GC-MS instrument will be used for collecting prospective breath samples from healthy controls as well as CRC-diagnosed patients, thereby establishing a VOC signature database. Subsequently, a previously developed sensor array-based breath analyzer prototype [46], originally used for the detection of gastric cancer VOCs, will be modified based on the gas biomarkers defined in the GC-MS analysis phase. The basic analytical principle of the breath analyzer is based on the activity of a gold nanoparticle sensor array. This array was made of 8 different chemistries detecting the transient effect of the breath sample on the resistance of each of these sensors for 60 s. This led to the generation of 8 × 60 observations for each breath sample. The recent model has been upgraded to harbor 48 sensors resulting in 48 × 60 time points for each breath sample to enable a richer picture best analyzed by different AI frameworks. In our opinion, this mode of VOC mixture detection and labeling best resembles the principle of smell distinction existing in the mammalian olfactory bulb. Finally, an AI module of the device will be trained on electrochemical signal responses between healthy and CRC samples. The resulting new prototype will be tested prospectively for its ability to offer a portable and quick way of early CRC diagnosis. The project foresees a comprehensive testing and validation process, including a clinical validation study involving the enrollment of 4100 patients/citizens.
The rest of the article is structured as follows: we start with a brief introduction around CRC and then we explore its breath blueprint as it is derived from past studies. We then report the capabilities of contemporary diagnosis models for CRC and, subsequently, we dive into each step of a typical AI pipeline towards the diagnosis of CRC. We place special emphasis on identifying future challenges and considerations for the extension of the existing breathomics AI toolbox against CRC. We hope that this overview forms a basis upon which the community can further elaborate towards new advances taking into consideration the current challenges. A schematic representation of the topics discussed in this work can be seen in Figure 1.
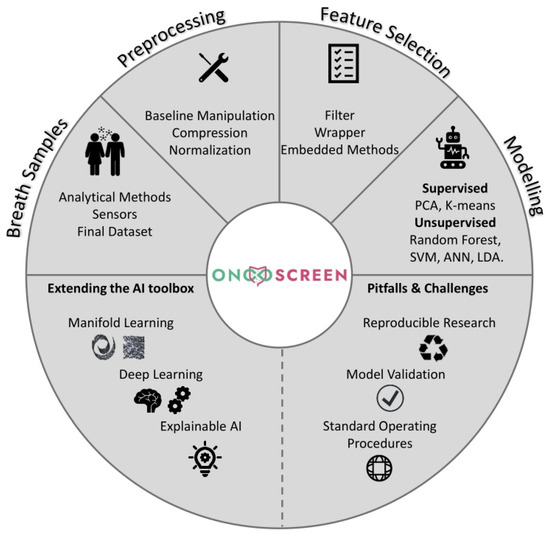
Figure 1.
Schematic representation of the topics discussed within the scope of this study.
2. Colorectal Cancer
Colorectal cancer can be categorized as colon or rectal cancer depending on where it initially develops. Despite their differences, these cancers are often grouped together [47]. The majority of colorectal tumors emerge from small clusters called polyps on the inner lining of the colon or rectum. The probability of a polyp transforming into cancer varies greatly depending on its type, with some of them never turning into cancer [48]. Polyps can be widely characterized as adenomatous, hyperplastic, inflammatory, or sessile serrated [49]. Hyperplastic and inflammatory polyps are frequently detected, with the adenomatous polyps being considered precancerous [50]. Due to a higher risk of developing into CRC, polyps characterized as sessile serrated are also regarded as adenomas [51]. Certain characteristics of polyps such as the size being larger than 1 cm, the segregation of more than three of them, or the detection of dysplasia after removal are linked with elevated risk of cancer development [52,53]. Over time, some precancerous polyps progress into cancerous growths within the walls of the colon or rectum [54]. The majority of CRC cases are adenocarcinomas originating from mucus-producing cells in the inner layer that play the role of lubrication and protection for the colon and rectum [55]. Of the adenocarcinomas, signet ring cell and mucinous cancers may have a less favorable prognosis [56,57]. Finally, less common types of CRC include carcinoid and gastrointestinal tumors, lymphomas, and sarcomas [58,59]. Typically, the progression of a polyp to a malignant state takes several years [54]. In many cases, patients do not experience symptoms until the cancer has already progressed to either an early or advanced stage of development [60,61]. Therefore, early detection, diagnosis, and staging by making use of diverse biomarkers are essential for effective cancer treatment [62].
3. Breath Blueprint as Biomarker for Early Detection and Monitoring of CRC
Scientific efforts towards the discovery of a CRC blueprint in breath began in the early 2000s [44,63,64]. Overall, CRC has been consistently linked with classes of VOCs such as alcohols, alkanes, aldehydes, and ketones [65,66], with the last two commonly found in cancer metabolism [67]. Multiple studies have tried to come up with a CRC breath profile [8,14,38,42,43,44,64]. Typically, these studies conduct VOC analysis in breath samples using GC-MS analysis and later check for differences between groups of CRC patients and healthy controls. If statistically significant differences are found in the levels of VOC prevalence between groups, then these VOCs are suggested as potential biomarkers for the disease. However, due to several differences in methodologies, technical equipment, pre-processing routine, sample sizes, or even different cancer stages (known to affect the VOC profile), a reliable and reproducible pattern of VOCs as biomarkers for general clinical practice is yet to become available. The list of CRC breath-based VOC biomarkers that have been reported in the scientific literature can be inspected in Table 1. Their underlying biochemical pathways and functionalities are further explored in [38,65,68].

Table 1.
Biomarkers reported for CRC.
Meta-analyses on the diagnosis of cancer focusing exclusively on breath-based VOCs have consistently shown optimistic results [68,69]. Specifically, on a systematic review and meta-analysis on different cancer types, Hanna et al. reported that despite a substantial variability among 63 studies, the pooled sensitivity reached 79% along with a pooled specificity of 89%. Xiang et al. further ratified previous results by focusing exclusively on gastrointestinal cancer and CRC, thus reporting pooled sensitivity of 85% and pooled specificity of 89%. They both concluded that while breath-based VOCs have the potential for clinical screening, standardized tools and protocols have to be introduced in an effort to mitigate the heterogeneity in the discriminatory VOCs reported and the subsequent diagnostic metrics. Finally, a more recent meta-analysis [23] considering 52 studies and 3677 patients with cancer, including CRC, reported 90% sensitivity and 87% specificity. The study exclusively focused on the diagnostic power of e-noses and though the authors reported optimistic results, they stated that most of the studies considered involved a small sample size and poor standardization.
Apart from meta-analyses relying only on breath-based VOCs, there have been some studies considering VOCs coming from different sources, such as fecal and urine VOCs. That being said, according to a meta-analysis on CRC screening using VOCs from different sources [70], the authors considered 10 studies spanning from 2012 to the end of 2019. The reported pooled sensitivity and specificity were found to be 82% and 79%, respectively. The results suggested that VOCs can be considered a stable and robust tool for CRC screening but not as a single and exclusive diagnostic test. Interestingly, VOCs associated with breath exhibited higher sensitivity and specificity than their counterparts (e.g., VOCs from feces and urine). Another meta-analysis from Wang. et al. [71] focused on diagnosis of neoplasms of the digestive system including CRC, using VOCs from different sources. Specifically for CRC, the authors included 16 studies (out of a total of 36 with over 3000 participants) and reported 84% pooled sensitivity and 82% specificity. Remarkably, the authors reported that breath-based VOCs behaved better (i.e., in terms of diagnostic metrics) than VOCs from other sources. Specifically, by considering only breath-based studies, the reported pooled sensitivity and specificity were both 87%. In Table 2 we present sensitivity and specificity rates reported in studies using breath-based VOCs as biomarkers for diagnosing CRC.
Table 2.
Reported sensitivity and specificity on diagnosis of CRC based on exhaled VOCs.
4. Applications of Machine Learning in Exhaled Breath Analysis: The Case of CRC
Machine learning (ML) can be seen as a part of AI that revolves around the development of methods aiming to enable machines to learn from data. Applications of ML span various domains, including medicine and disease diagnosis, particularly in situations where traditional algorithms are impractical and/or insufficient. Roughly speaking, ML approaches can be divided into three broad categories of learning, namely supervised, unsupervised, and reinforcement learning. The main difference between the supervised and the unsupervised learning paradigm lies in the fact that in the first case the computer is learning from labeled examples with known inputs and desired outputs. On the other hand, unsupervised learning tries to discover inherent structures from unlabeled data without explicit guidance, typically with consideration of some measure of similarity between the data entities. Finally, reinforcement learning typically involves an agent that is learning to make decisions through trial and error, receiving feedback in the form of rewards/penalties. Through an iterative process, long-term cumulative rewards are maximized based on the observed outcomes. For the rest of this review, we will focus on the supervised and the unsupervised learning paradigms.
In the following, we sketch the main pillars of the standard ML methodology in VOC analysis. Typically, the analysis pipeline starts with data acquisition, either with an analytical or a sensor-based method (for their relative advantages and disadvantages see Section 1). It continues with the pre-processing and feature extraction steps. Preprocessing is a stage where we transform the raw data into a comprehensible format to augment the downstream analysis. Feature extraction is the process of generating new values (features) from the initial measurements that are informative, non-redundant, and aid in the subsequent learning, ultimately leading to useful and informed models. The next step usually includes feature selection, a level of analysis where we choose the most discriminatory features/biomarkers present in our dataset, towards parsimonious modeling to enhance predictive and generalization capabilities. Then, we proceed to the actual modeling for discrimination between patients and healthy controls in a supervised/unsupervised manner. Finally, model validation takes place to assess the model’s performance and confirm the usefulness of the model in real world applications.
In Table 3 we present the key characteristics of the pipeline used in studies considering breath-based VOCs towards the diagnosis of CRC.
Table 3.
Analysis pipelines of studies using breath-based VOCs towards CRC diagnosis.
4.1. Pre-Processing and Feature Extraction
Pre-processing is the initial stage of processing raw data. Roughly speaking, pre-processing involves transforming raw data into a format that is comprehensible and augments the performance of the following steps. The most commonly applied strategies can be broadly categorized as baseline manipulation, compression, and normalization transforms [74]. The baseline manipulation refers to the transformations that attempt to correct for the baseline of the signal with the aim of suppressing the effect of sensor drifts (e.g., signal slowly deviates independently of the measured property due to changes in temperature, electronic aging of components, etc.). Compression transformations address the problem of dimensionality, effectively reducing the number of measurements trying to optimize the trade-off between an accurate representation and a reasonable size of the final dataset. Normalization transformations are commonly applied to smooth variations between sensors, such as for example an inherently higher signal magnitude of some sensor over the others. Other forms of preprocessing align more to the quality assurance of the data. Such procedures include the removal of artefacts, suppression of noise, and handling the missing values via imputation [34]. These types of transformations can also enhance the performance of ML algorithms in terms of faster convergence in the optimization process, robustness of results, and accuracy [75].
In the context of ML and pattern recognition, feature extraction plays a crucial role as it involves taking an initial set of measurements and generating new values (features) that are informative, non-redundant, and aid in the subsequent learning and generalization processes. Despite the fact that it is very difficult to categorize the different families of methodologies, feature extraction methods can be divided into three main groups, the piecemeal, the curve fitting/statistical measures, and the transformation-based techniques. Regarding the piecemeal features, these are the features that are directly computed on the sensor’s response, including first and second derivatives which can be translated as the reaction rate of the sensor and the acceleration, respectively. Other features in this category involve measures such as the computation of maximum value, the rising and the falling slopes during steady state, transient response, and others [76]. In the case of the curve fitting methods, we actually fit a model on the sensor’s response in order to measure specific model parameters [77]. Models that are commonly used for fitting purposes include polynomial function, exponential, and auto-regressive models. Here, we could also consider statistical measures that are computed directly on the distribution of the sensor-response such as mean, median, skewness, kurtosis, etc. Finally, there are transformation-based methods involving the conversion of our signal to the frequency domain such as the Discrete Fourier Transform (DFT) or the Discrete Wavelet Transform (DWT), which combine the virtues of DFT but also preserves temporal information. An example of successful application of DWT can be found in [78]. The authors pre-processed their data using DWT and later applied Principal Component Analysis (PCA) trying to discriminate between the different odors.
Since the preprocessing routine plays a significant role in the subsequent steps of a long pipeline, it is particularly important to be reported in detail, so as to have a common ground and the diverse results reported by different authors can be compared. In Table 3 the reader can inspect the different preprocessing pipelines used in studies considering breath-based VOCs towards CRC diagnosis. It is remarkable that for 5 out of 14 studies included in Table 3, we did not manage to find comprehensible information on the preprocessing pipeline applied by the authors.
4.2. Feature Selection
Distinct from feature extraction, feature selection focuses on choosing a subset of existing features rather than creating new ones. Overall, feature selection plays a crucial role in enhancing the efficiency and effectiveness of data analysis. It aims to simplify models, reduce computational times, increase accuracy, robustness of learning, and enable the interpretability of the final model (such as suggesting a few biomarkers that are probably connected to a disease) [79]. The rationale/hypothesis behind feature selection is that the data usually contain redundant and/or irrelevant features that can be eliminated without significant information loss. While the simplest approach involves testing each possible subset to minimize the error rate, this exhaustive search is computationally impractical for large feature sets. The feature selection algorithms are divided into three broad categories: filter, wrapper, and embedded methods [24].
Filter methods are computationally efficient and capture the usefulness of the features based on statistical measures such as correlation but are not tuned to a specific model. For example, there is no complex predictive model involved and, thus, no parameter selection is needed. Instead, these methods may measure the degree of association between the target and the independent variables (e.g., in our case, how the healthy population differs from the diseased; with respect to which features?). They tend to produce more general feature sets but they usually score lower in prediction performance than wrappers or embedded methods. Examples of such methods and their applications include the Analysis Of Variance (ANOVA) [36,40], Welch’s t-test [8], and the Mann–Whitney U test [41,43]. Wrapper methods use a predictive model to score feature subsets. Each subset is used to train and test a model with its error rate, producing a final score. While computationally intensive, wrapper methods are most likely to produce better results than filter methods. Examples and applications include stepwise selection [38,72], the recursive feature elimination process [21], and the evolutionary search [72]. Embedded methods incorporate feature selection as part of the model construction process. Examples of such methods and their applications include the Least Absolute Shrinkage and Selection Operator (LASSO), which penalizes regression coefficients using L1 norm regularization [37,80], ridge regression (L2 norm regularization), Elastic Net regularization [36] (which combines L1 and L2 norm regularization), and Random Forests which utilize the Gini impurity index or information gain/entropy for ranking features by relative importance [36,39]. These methods offer a balance between filters and wrappers in terms of computational complexity.
4.3. Modeling and Classification
The most relevant features considered in the previous steps constitute the final feature set that is naturally used for modeling and classification. This can be performed in either a supervised or unsupervised manner. The latter does not involve class labels and tries to blindly find statistical similarities between data points with the ultimate goal of finding associations or distinct clusters of similar data points in a sample. A popular algorithm for data-driven modeling in an unsupervised manner is the Principal Component Analysis (PCA) [73,81], which can be used in conjunction with the K-means clustering algorithm for classification purposes. K-means have been utilized in cancer research including CRC [82,83]. On the other hand, supervised learning uses class labels as ground truth to train a model performing over specific tasks. Applications of supervised learning include algorithms such as Random Forests [35,39], Support Vector Machines (SVM) [36], Logistic Regression [37,38,40], Artificial Neural Networks (ANN) [26,27,41,43,73], and Linear discriminant Analysis (LDA) [8]. Despite the fact that supervised learning is more extensively used in disease diagnosis, unsupervised learning is particularly helpful for visualizing the data through clustering and gaining insights into the nature of a particular phenomenon or disease.
It should be noted that every algorithm has its own strengths and weaknesses and no consensus on the general use of specific algorithms exists in the literature. The algorithms can be further divided into linear and non-linear. The non-linear algorithms assume a nonlinear relationship between the target variable and predictors used for classification. In the linear case, separation between groups can be achieved through a linear combination of the explanatory variables and, in simplifying terms, this can be thought of as a straight line on a 2D plane. The nonlinear case involves nonlinear relationships among predictors to achieve separation. Despite the conceptual superiority of non-linear algorithms and the often better predictive performance, they are more complex and therefore often hinder the ability to interpret the final model [84,85]. Explainability in the context of AI applications refers to our ability to explain why and under which circumstances a decision is made by a trained model. For example, in a clinical setting, medical experts are interested in the clinical inference, which in turn plays a crucial role in the diagnosis, staging, or following of a specific curative treatment [86]. Finally, other factors to consider when it comes to the selection of a specific algorithm are the computational complexity and the proneness to overfitting which must be assessed thoroughly through the process of model validation [87].
4.4. Model Training and Validation
Model training and validation can be seen as two distinct parts towards modelling. Training refers to the process of fitting the best combination of parameters to the model using a training set, while validation refers to the evaluation of performance using a validation set (e.g., to tune hyperparameters) and a test set. In practice, in order to develop an AI model, multiple models are fitted and we ultimately choose the best candidate (with specific parameters and hyperparameters) judging by its performance on the validation set. If we incorrectly assess a model’s performance, then we might choose a useless configuration. Naturally, the validation strategy affects both the internal parameters (such as weights and biases, which are parameters automatically derived during the training process) and hyperparameters (which are essential for optimizing the model and are externally set by the researcher) of a model. In cases where we consider a feature selection process during training (i.e., candidate models consider different feature sets), insufficient validation may affect the suggested biomarkers [88,89,90]. That said, model validation is involved whenever training occurs, either only to estimate (e.g., in an unbiased manner) prediction performance (e.g., accuracy, sensitivity, specificity, etc.) or to tune parameters with respect to them. At last, the final error estimate is obtained when the best candidate model is finally applied on unseen test samples. Of course, we expect that the model scores more or less the same as when applied to the validation data. In a case where the test error is much larger than the validation error, overfitting can occur. Hence, model validation gives us a hint of the expected test error while testing aims for an unbiased estimate of the model’s performance in a real clinical setting, battling the well-known phenomenon of overfitting [88,91]. The test dataset should be independent of the training and validation sets.
Commonly applied validation strategies for both tuning AI algorithms and estimation of performance are the Hold-out strategy (e.g., splitting into train, validation, and test set) and CV. The Hold-out strategy splits the data into training, validation, and test sets and follows the procedure described above. CV divides data into k subsets. The model is trained and evaluated repeatedly k times, each time using different subsets leaving one subset out for validation and the rest for training purposes. Next, performance metrics are obtained and averaged with the aim of providing estimates of the model’s prediction error. When k matches the number of samples in the data set, the method is called Leave One Out Cross Validation (LOOCV). The main difference between the two approaches is that cross-validation utilizes the entire dataset enabling all data to be incorporated in model training and validation. CV may help in reducing the variance in model performance estimates induced by a specific split into training and testing data [91]. The last step is again to test the best candidate model (e.g., based on CV score) on an unseen and independent testing dataset.
Finally, the validation strategy can be characterized as internal or external depending on the cohorts/datasets used for validation. Internal validation refers to the validity of the model inside a single cohort, while external validation refers to the validity of the model spanning external cohorts. External validation is much more powerful than internal in the sense that the model is capable of performing as intended even when there are substantial differences among data sources. For a diagnosis model on CRC, external validation would mean to test the ability of the model to diagnose the disease in cohorts of hospitals in different countries, for patient populations with different demographics, etc. Here, we have to note that none of the 14 studies included in Table 3 used an external dataset to validate findings. Moreover, most of the time the authors reported the validation error (e.g., mainly due to the fact of using limited samples) since the cross validation is applied on the entirety of the available datasets (Table 3).
5. Future Considerations: Extending the AI Toolbox towards Disease Diagnosis
This section delves into future considerations that extend the AI toolbox currently in use, regarding breath-based diagnosis of CRC. These forward-looking directions are framed within the context of the ONCOSCREEN project’s ongoing advancements and developments. We explore three key axes: manifold learning, deep learning, and explainable AI, each representing a critical dimension in the quest to enhance the understanding and performance of the contemporary models on diagnosis of CRC.
Over the past years, linear data-driven approaches such as PCA and LDA have become part of the conventional breath analysis research towards preprocessing, dimensionality reduction, visualization, and modelling in terms of a few “dominant”, discriminatory variables [8,73,81]. In the context of dimensionality reduction, nonlinear alternatives of the aforementioned methodologies have been introduced like the kernel Principal Component Analysis (kPCA), ISOmetric feature MAPping (ISOMAP), Locally linear Embedding (LLE), and Diffusion Maps [92,93,94,95]. Originating from the field of manifold learning, the fundamental assumption is based on the manifold hypothesis, suggesting that high-dimensional data often lie on or near a lower-dimensional manifold within the high-dimensional space. In simpler terms, it is assumed that the data can be effectively represented in a lower-dimensional space taking into account nonlinear (or locally linear) measures (such as the geodesic distance between data points [90]) of similarity between data points. By exploring and leveraging the intrinsic structure of high-dimensional data, one can enhance not only the diagnostic capabilities of a model, but also uncover subtle patterns and relationships within complex datasets. For example, given a number of features resembling either a sensor’s resistance or the levels (e.g., abundance) of VOCs in the breath samples, we can find eigenvectors that capture non-linear combinations of our initial feature set and tentatively follow the intrinsic geometry of the underlying manifold. This may allow for visualization and exploration of non-trivial and subtle properties. Such techniques have been successful in various fields where big, complex data and non-linear phenomena are involved. Applications include the diagnosis of schizophrenia with the use of functional magnetic resonance imaging data [90,96], classification of images of handwritten digits [92], forecasting of brain signals [97] and financial time series [98], bifurcation analysis from spatio-temporal data produced by lattice Boltzmann simulations [99], and others. Specifically, Gallos et al. [96] used a variety of manifold learning techniques to construct (embedded) brain connectivity networks (e.g., by mapping correlation matrices in the low dimensional space prior to network construction), utilizing graph theoretic measures towards diagnosis of schizophrenia. Diffusion Maps outperformed their linear counterparts in terms of diagnostic capability. In a follow up study [90], ISOMAP was also applied to demonstrate that learning and feature selection on the low dimensional space was again beneficial in simplifying and raising the predictive performance of the model, ultimately leading to the discovery of a few informative biomarkers for the disease.
Beyond the classic ML methodologies, a subset of ANN-based frameworks also known as deep learning (DL) led to breakthroughs in several fields such as medical image processing [100] and medical diagnosis [101]. DL’s ability to process large scale data enables the analysis of raw data even without pre-processing, frequently with high precision [24,102]. In particular, applications on breath-based VOCs towards cancer diagnosis have been introduced [103] and frameworks have been suggested. These include time series stemming from e-nose devices [104]. Specifically, for CRC, the efforts have targeted colonoscopic [105], endoscopic [106] and histopathological [107] images, mostly by using Convolutional Neural Networks (CNN), an architecture designed for analyzing visual data. These types of ANNs utilize convolutional layers to automatically extract meaningful features and have achieved remarkable success in computer vision tasks such as image recognition and object detection. A review can be found in [108]. Within the context of DL, different architectures exist. These include Autoencoders, which utilize a bottleneck layer to extract meaningful features or reduce the dimensionality [103]. An additional method is Recurrent Neural Networks (RNN), which consist of recurrent connections to preserve information across time steps, hence allowing for them to capture temporal dependencies. The latter are also suitable for time series analysis and have been applied towards the optimization of e-nose systems [109] and odor classification [110]. Despite their merits, DL frameworks have their own limitations and challenges. Typically, they need vast amounts of data in order to reach their full potential, they are computationally expensive, have elevated probabilities of over-fitting, and are accompanied by high complexity and low interpretability. A comprehensive discussion can be found in [111].
In an effort to address the interpretability of the AI models, remarkable advancements have been made towards the establishment of tools and frameworks that provide understandable explanations regarding outputs and decisions made by the AI models [112,113,114]. In the literature, the predominant terminology for this field is Explainable AI (XAI) [115]. A characteristic framework is the so-called Shapley additive explanations (SHAP), an approach originating from game theory that attempts to explain the output of AI models. The Shapley values can be used in a model agnostic way [116], thus serving as a useful tool that may accompany various machine learning algorithms. Conceptually, it can be regarded as an extension of the Local Interpretable Model-agnostic Explanations (LIME) approach [117]. In simple terms, the absolute Shapley value reflects how each feature contributes to the final outcome as it is derived from an AI model [113]. However, only a few studies have considered such frameworks on CRC [112]. For example [112], tried to classify CRC patients based on the gut microbiome, and managed to both find CRC-associated bacteria and explore subgroups of CRC patients based on PCA that was imposed on SHAP values. Other frameworks include Gradient-weighted Class activation mapping (Grad-Cams), and these can be applied to CNN-based models to provide transparency and visual explanations [118]. Applications on the diagnosis of CRC include the diagnostic evaluation from colonoscopy images [105] and, more recently, CRC diagnosis and grading utilizing histopathological images [107]. Since this methodology is compatible with CNN-based models, it is natural that it can also be used on time series data employing 1D CNN models [119,120] or even encoding (multivariate) time series data (e.g., one univariate time series per sensor of an e-nose) into two-dimensional images (e.g., a correlation matrix or a dissimilarity matrix in general) towards classification/diagnosis (e.g., CRC patients and healthy controls) via pattern recognition [121].
6. Challenges and Pitfalls in the Use of AI Modelling towards Diagnosis
While the use of AI and especially ML towards diagnosis has been predominant in the past years, one has to put a significant emphasis on model validation to ensure their model generalizes into new unseen data [91]. Estimation of the true capabilities of the contemporary AI models should not be taken lightly. First of all, in cases where the dataset is imbalanced, something very common in disease diagnosis, splits of the dataset (e.g., into training and test splits) should be performed in a stratified manner. This means to practically keep the same percentages of classes in each split. Second, in order to avoid data leakage, transformations such as standardization of data or PCA should consider only the training data. This applies because we do not want our model to be trained using information contained on the unseen test dataset, for this would strongly bias our estimates of performance and likely the true capabilities of the model. Third, it is of paramount importance that wherever a CV procedure is used (with the exception for LOOCV), the estimated performance of the model should be reported in terms of average and standard deviation, which reflect the variability of the model’s performance [89]. For even better/refined estimates of model performance or parameter tuning, repeats of CV can also be beneficial [122]. Fourth, even a loop of CV may not be enough to come up with an unbiased estimate of the model’s performance, especially when feature selection is taking place at the same time inside the same loop [90,123]. Fifth, feature selection should be used in conjunction with CV (especially when embedded methods are used), as the opposite has been shown to strongly overestimate model’s performance [122]. To put it simply, it is crucial that the feature selection process does not “see” all data and then use the optimal feature set to evaluate the performance of a model on the same set. Hence, it is strongly advised that the validation of AI models should take place in the form of a nested CV consisting of an inner loop for optimizing hyperparameters and an outer loop of CV for evaluating performance. Sixth, it is highly recommended to always test the final model on an unseen test dataset (i.e., that is not considered during the model construction phase) after estimating the predicted performance of using a CV scheme. Specifically, Varma et al. [123] reported that the difference between the single CV error estimate and the true error was in some cases greater than 20%, which can be dramatically significant, especially in cases where the classification rates are moderate. Finally, it should be made clear that a CV for assessing a model’s performance produces an estimation of prediction error and by no means can this be considered the true test error, which can only be inducted by using sufficiently large unseen test samples (i.e., external validation). This is a common misconception in the scientific community [122,124].
7. Conclusions
This article focused on AI/ML methods used for the analysis of breathomics data in the context of CRC. The needs for improved CRC screening and monitoring were highlighted in parallel with the reported shortcomings of the contemporary standard protocols. VOCs that have been identified as potential biomarkers in previous studies have been presented. Further, we presented the diagnostic performances of contemporary models along the AI pipelines. We explored the main steps of typical AI pipelines in breath analysis for both analytical and sensor-based techniques. The latter are promising methods holding several potential advances over analytical methods in terms of cost, time, portability, and ease of use. Next, we stated future considerations and challenges with a view on extending the AI toolbox that is currently used towards CRC diagnosis via breathomics. The review discusses new potentials in the use of AI, such as the applications of non-linear dimensionality reduction/manifold learning algorithms, DL frameworks, and XAI sets of tools. These tools can potentially enhance diagnostic performance, explore non-linear and complex relationships among features, and provide insights into a “finer” choice of biomarkers with contribution to diagnosis. Despite the optimistic results of breath-based diagnosis in terms of sensitivity and specificity, there is substantial variability among studies and a reliable device and/or pipeline is yet to be developed. In this direction, model training and validation procedures have to be strictly defined and the model’s capabilities need to be reported in terms of both internal and external validation. Finally, preprocessing pipelines should be reported transparently and in more detail towards reproducible research.
Author Contributions
Conceptualization, I.K.G. and D.D.D.; investigation, I.K.G. and D.T.; writing—original draft preparation, I.K.G. and D.T.; writing—review and editing, I.K.G., D.D.D., D.T. and G.S.; supervision, A.A. and H.H.; project administration, D.D.D. and A.A.; funding acquisition, A.A. and D.D.D. All authors have read and agreed to the published version of the manuscript.
Funding
This research has been funded by the European Union’s Horizon Europe research and innovation program under grant agreement No. 101097036 (ONCOSCREEN). Views and opinions expressed are, however, those of the author(s) only and do not necessarily reflect those of the European Union or the European Health and Digital Executive Agency. Neither the European Union nor the granting authority can be held responsible for them.
Data Availability Statement
This study did not generate or analyze any novel data; thus, data sharing does not apply.
Acknowledgments
The authors would like to thank all partners of the ONCOSCREEN Consortium for the insightful collaboration throughout the project activities.
Conflicts of Interest
The authors declare that the research was conducted in the absence of any commercial or financial relationships that could be construed as a potential conflict of interest.
References
- Sung, H.; Ferlay, J.; Siegel, R.L.; Laversanne, M.; Soerjomataram, I.; Jemal, A.; Bray, F. Global Cancer Statistics 2020: GLOBOCAN Estimates of Incidence and Mortality Worldwide for 36 Cancers in 185 Countries. CA Cancer J. Clin. 2021, 71, 209–249. [Google Scholar] [CrossRef]
- Schwartzberg, L.; Broder, M.S.; Ailawadhi, S.; Beltran, H.; Blakely, L.J.; Budd, G.T.; Carr, L.; Cecchini, M.; Cobb, P.; Kansal, A.; et al. Impact of Early Detection on Cancer Curability: A Modified Delphi Panel Study. PLoS ONE 2022, 17, e0279227. [Google Scholar] [CrossRef]
- Krilaviciute, A.; Heiss, J.A.; Leja, M.; Kupcinskas, J.; Haick, H.; Brenner, H. Detection of Cancer through Exhaled Breath: A Systematic Review. Oncotarget 2015, 6, 38643. [Google Scholar] [CrossRef]
- Rex, D.K.; Boland, C.R.; Dominitz, J.A.; Giardiello, F.M.; Johnson, D.A.; Kaltenbach, T.; Levin, T.R.; Lieberman, D.; Robertson, D.J. Colorectal Cancer Screening: Recommendations for Physicians and Patients from the US Multi-Society Task Force on Colorectal Cancer. Gastroenterology 2017, 153, 307–323. [Google Scholar] [CrossRef] [PubMed]
- Gimeno Garcia, A.Z. Factors Influencing Colorectal Cancer Screening Participation. Gastroenterol. Res. Pract. 2012, 2012, 483417. [Google Scholar] [CrossRef] [PubMed]
- Mo, S.; Dai, W.; Wang, H.; Lan, X.; Ma, C.; Su, Z.; Xiang, W.; Han, L.; Luo, W.; Zhang, L.; et al. Early Detection and Prognosis Prediction for Colorectal Cancer by Circulating Tumour DNA Methylation Haplotypes: A Multicentre Cohort Study. EClinicalMedicine 2023, 55, 101717. [Google Scholar] [CrossRef] [PubMed]
- Shaukat, A.; Levin, T.R. Current and Future Colorectal Cancer Screening Strategies. Nat. Rev. Gastroenterol. Hepatol. 2022, 19, 521–531. [Google Scholar] [CrossRef]
- Amal, H.; Leja, M.; Funka, K.; Lasina, I.; Skapars, R.; Sivins, A.; Ancans, G.; Kikuste, I.; Vanags, A.; Tolmanis, I.; et al. Breath Testing as Potential Colorectal Cancer Screening Tool. Int. J. Cancer 2016, 138, 229–236. [Google Scholar] [CrossRef]
- Gowda, G.A.N.; Zhang, S.; Gu, H.; Asiago, V.; Shanaiah, N.; Raftery, D. Metabolomics-Based Methods for Early Disease Diagnostics. Expert. Rev. Mol. Diagn. 2008, 8, 617–633. [Google Scholar] [CrossRef]
- Jacob, M.; Lopata, A.L.; Dasouki, M.; Abdel Rahman, A.M. Metabolomics toward Personalized Medicine. Mass. Spectrom. Rev. 2019, 38, 221–238. [Google Scholar] [CrossRef]
- Vadala, R.; Pattnaik, B.; Bangaru, S.; Rai, D.; Tak, J.; Kashyap, S.; Verma, U.; Yadav, G.; Dhaliwal, R.S.; Mittal, S.; et al. A Review on Electronic Nose for Diagnosis and Monitoring Treatment Response in Lung Cancer. J. Breath. Res. 2023, 17, 024002. [Google Scholar] [CrossRef]
- Drabińska, N.; Flynn, C.; Ratcliffe, N.; Belluomo, I.; Myridakis, A.; Gould, O.; Fois, M.; Smart, A.; Devine, T.; Costello, B.D.L. A Literature Survey of All Volatiles from Healthy Human Breath and Bodily Fluids: The Human Volatilome. J. Breath. Res. 2021, 15, 34001. [Google Scholar] [CrossRef]
- van der Schee, M.; Pinheiro, H.; Gaude, E. Breath Biopsy for Early Detection and Precision Medicine in Cancer. Ecancermedicalscience 2018, 12, ed84. [Google Scholar] [CrossRef] [PubMed]
- Nakhleh, M.K.; Amal, H.; Jeries, R.; Broza, Y.Y.; Aboud, M.; Gharra, A.; Ivgi, H.; Khatib, S.; Badarneh, S.; Har-Shai, L.; et al. Diagnosis and Classification of 17 Diseases from 1404 Subjects via Pattern Analysis of Exhaled Molecules. ACS Nano 2017, 11, 112–125. [Google Scholar] [CrossRef] [PubMed]
- Koppenol, W.H.; Bounds, P.L.; Dang, C.V. Otto Warburg’s Contributions to Current Concepts of Cancer Metabolism. Nat. Rev. Cancer 2011, 11, 325–337. [Google Scholar] [CrossRef] [PubMed]
- Hakim, M.; Broza, Y.Y.; Barash, O.; Peled, N.; Phillips, M.; Amann, A.; Haick, H. Volatile Organic Compounds of Lung Cancer and Possible Biochemical Pathways. Chem. Rev. 2012, 112, 5949–5966. [Google Scholar] [CrossRef]
- Janfaza, S.; Banan Nojavani, M.; Khorsand, B.; Nikkhah, M.; Zahiri, J. Cancer Odor Database (COD): A Critical Databank for Cancer Diagnosis Research. Database 2017, 2017, bax055. [Google Scholar] [CrossRef] [PubMed]
- Kuo, T.-C.; Tan, C.-E.; Wang, S.-Y.; Lin, O.A.; Su, B.-H.; Hsu, M.-T.; Lin, J.; Cheng, Y.-Y.; Chen, C.-S.; Yang, Y.-C.; et al. Human Breathomics Database. Database 2020, 2020, baz139. [Google Scholar] [CrossRef] [PubMed]
- Janfaza, S.; Khorsand, B.; Nikkhah, M.; Zahiri, J. Digging Deeper into Volatile Organic Compounds Associated with Cancer. Biol. Methods Protoc. 2019, 4, bpz014. [Google Scholar] [CrossRef]
- Keogh, R.J.; Riches, J.C. The Use of Breath Analysis in the Management of Lung Cancer: Is It Ready for Primetime? Curr. Oncol. 2022, 29, 7355–7378. [Google Scholar] [CrossRef]
- Wang, C.; Long, Y.; Li, W.; Dai, W.; Xie, S.; Liu, Y.; Zhang, Y.; Liu, M.; Tian, Y.; Li, Q.; et al. Exploratory Study on Classification of Lung Cancer Subtypes through a Combined K-Nearest Neighbor Classifier in Breathomics. Sci. Rep. 2020, 10, 5880. [Google Scholar] [CrossRef] [PubMed]
- De Vries, R.; Muller, M.; Van Der Noort, V.; Theelen, W.; Schouten, R.D.; Hummelink, K.; Muller, S.H.; Wolf-Lansdorf, M.; Dagelet, J.W.F.; Monkhorst, K.; et al. Prediction of Response to Anti-PD-1 Therapy in Patients with Non-Small-Cell Lung Cancer by Electronic Nose Analysis of Exhaled Breath. Ann. Oncol. 2019, 30, 1660–1666. [Google Scholar] [CrossRef] [PubMed]
- Scheepers, M.H.M.C.; Al-Difaie, Z.; Brandts, L.; Peeters, A.; van Grinsven, B.; Bouvy, N.D. Diagnostic Performance of Electronic Noses in Cancer Diagnoses Using Exhaled Breath: A Systematic Review and Meta-Analysis. JAMA Netw. Open 2022, 5, e2219372. [Google Scholar] [CrossRef] [PubMed]
- Rangarajan, M.; Pandya, H.J. Breath VOC Analysis and Machine Learning Approaches for Disease Screening: A Review. J. Breath. Res. 2023, 17, 024001. [Google Scholar]
- Oakley-Girvan, I.; Davis, S.W. Breath Based Volatile Organic Compounds in the Detection of Breast, Lung, and Colorectal Cancers: A Systematic Review. Cancer Biomark. 2018, 21, 29–39. [Google Scholar] [CrossRef]
- Steenhuis, E.G.M.; Schoenaker, I.J.H.; de Groot, J.W.B.; Fiebrich, H.B.; de Graaf, J.C.; Brohet, R.M.; van Dijk, J.D.; van Westreenen, H.L.; Siersema, P.D. Feasibility of Volatile Organic Compound in Breath Analysis in the Follow-up of Colorectal Cancer: A Pilot Study. Eur. J. Surg. Oncol. 2020, 46, 2068–2073. [Google Scholar] [CrossRef]
- van Keulen, K.E.; Jansen, M.E.; Schrauwen, R.W.M.; Kolkman, J.J.; Siersema, P.D. Volatile Organic Compounds in Breath Can Serve as a Non-Invasive Diagnostic Biomarker for the Detection of Advanced Adenomas and Colorectal Cancer. Aliment. Pharmacol. Ther. 2020, 51, 334–346. [Google Scholar] [CrossRef]
- Van De Goor, R.; Leunis, N.; Van Hooren, M.R.A.; Francisca, E.; Masclee, A.; Kremer, B.; Kross, K.W. Feasibility of Electronic Nose Technology for Discriminating between Head and Neck, Bladder, and Colon Carcinomas. Eur. Arch. Oto-Rhino-Laryngol. 2017, 274, 1053–1060. [Google Scholar] [CrossRef]
- Liu, T.; Guo, L.; Wang, M.; Su, C.; Wang, D.; Dong, H.; Chen, J.; Wu, W. Review on Algorithm Design in Electronic Noses: Challenges, Status, and Trends. Intell. Comput. 2023, 2, 12. [Google Scholar] [CrossRef]
- Amor, R.E.; Nakhleh, M.K.; Barash, O.; Haick, H. Breath Analysis of Cancer in the Present and the Future. Eur. Respir. Rev. 2019, 28, 190002. [Google Scholar] [CrossRef]
- Haick, H.; Broza, Y.Y.; Mochalski, P.; Ruzsanyi, V.; Amann, A. Assessment, Origin, and Implementation of Breath Volatile Cancer Markers. Chem. Soc. Rev. 2014, 43, 1423–1449. [Google Scholar] [CrossRef]
- Konvalina, G.; Haick, H. Sensors for Breath Testing: From Nanomaterials to Comprehensive Disease Detection. Acc. Chem. Res. 2014, 47, 66–76. [Google Scholar] [CrossRef] [PubMed]
- Broadhurst, D.I.; Kell, D.B. Statistical Strategies for Avoiding False Discoveries in Metabolomics and Related Experiments. Metabolomics 2006, 2, 171–196. [Google Scholar] [CrossRef]
- Śmiełowska, M.; Ligor, T.; Kupczyk, W.; Szeliga, J.; Jackowski, M.; Buszewski, B. Screening for Volatile Biomarkers of Colorectal Cancer by Analyzing Breath and Fecal Samples Using Thermal Desorption Combined with GC-MS (TD-GC-MS). J. Breath. Res. 2023, 17, 47102. [Google Scholar] [CrossRef] [PubMed]
- Cheng, H.R.; van Vorstenbosch, R.W.R.; Pachen, D.M.; Meulen, L.W.T.; Straathof, J.W.A.; Dallinga, J.W.; Jonkers, D.M.A.E.; Masclee, A.A.M.; van Schooten, F.-J.; Mujagic, Z.; et al. Detecting Colorectal Adenomas and Cancer Using Volatile Organic Compounds in Exhaled Breath: A Proof-of-Principle Study to Improve Screening. Clin. Transl. Gastroenterol. 2022, 13, e00518. [Google Scholar] [CrossRef] [PubMed]
- Woodfield, G.; Belluomo, I.; Laponogov, I.; Veselkov, K.; Lin, G.; Myridakis, A.; Ayrton, O.; Španěl, P.; Vidal-Diez, A.; Romano, A.; et al. Diagnostic Performance of a Noninvasive Breath Test for Colorectal Cancer: COBRA1 Study. Gastroenterology 2022, 163, 1447–1449. [Google Scholar] [CrossRef] [PubMed]
- Politi, L.; Monasta, L.; Rigressi, M.N.; Princivalle, A.; Gonfiotti, A.; Camiciottoli, G.; Perbellini, L. Discriminant Profiles of Volatile Compounds in the Alveolar Air of Patients with Squamous Cell Lung Cancer, Lung Adenocarcinoma or Colon Cancer. Molecules 2021, 26, 550. [Google Scholar] [CrossRef] [PubMed]
- Altomare, D.F.; Picciariello, A.; Rotelli, M.T.; De Fazio, M.; Aresta, A.; Zambonin, C.G.; Vincenti, L.; Trerotoli, P.; De Vietro, N. Chemical Signature of Colorectal Cancer: Case–Control Study for Profiling the Breath Print. BJS Open 2020, 4, 1189–1199. [Google Scholar] [CrossRef]
- Miller-Atkins, G.; Acevedo-Moreno, L.-A.; Grove, D.; Dweik, R.A.; Tonelli, A.R.; Brown, J.M.; Allende, D.S.; Aucejo, F.; Rotroff, D.M. Breath Metabolomics Provides an Accurate and Noninvasive Approach for Screening Cirrhosis, Primary, and Secondary Liver Tumors. Hepatol. Commun. 2020, 4, 1041–1055. [Google Scholar] [CrossRef]
- Markar, S.R.; Chin, S.-T.; Romano, A.; Wiggins, T.; Antonowicz, S.; Paraskeva, P.; Ziprin, P.; Darzi, A.; Hanna, G.B. Breath Volatile Organic Compound Profiling of Colorectal Cancer Using Selected Ion Flow-Tube Mass Spectrometry. Ann. Surg. 2019, 269, 903–910. [Google Scholar] [CrossRef]
- Altomare, D.F.; Di Lena, M.; Porcelli, F.; Travaglio, E.; Longobardi, F.; Tutino, M.; Depalma, N.; Tedesco, G.; Sardaro, A.; Memeo, R.; et al. Effects of Curative Colorectal Cancer Surgery on Exhaled Volatile Organic Compounds and Potential Implications in Clinical Follow-Up. Ann. Surg. 2015, 262, 862–867. [Google Scholar] [CrossRef]
- Wang, C.; Ke, C.; Wang, X.; Chi, C.; Guo, L.; Luo, S.; Guo, Z.; Xu, G.; Zhang, F.; Li, E. Noninvasive Detection of Colorectal Cancer by Analysis of Exhaled Breath. Anal. Bioanal. Chem. 2014, 406, 4757–4763. [Google Scholar] [CrossRef] [PubMed]
- Altomare, D.F.; Di Lena, M.; Porcelli, F.; Trizio, L.; Travaglio, E.; Tutino, M.; Dragonieri, S.; Memeo, V.; De Gennaro, G. Exhaled Volatile Organic Compounds Identify Patients with Colorectal Cancer. J. Br. Surg. 2013, 100, 144–150. [Google Scholar] [CrossRef] [PubMed]
- Peng, G.; Hakim, M.; Broza, Y.Y.; Billan, S.; Abdah-Bortnyak, R.; Kuten, A.; Tisch, U.; Haick, H. Detection of Lung, Breast, Colorectal, and Prostate Cancers from Exhaled Breath Using a Single Array of Nanosensors. Br. J. Cancer 2010, 103, 542–551. [Google Scholar] [CrossRef] [PubMed]
- Horváth, I.; Barnes, P.J.; Loukides, S.; Sterk, P.J.; Högman, M.; Olin, A.-C.; Amann, A.; Antus, B.; Baraldi, E.; Bikov, A.; et al. A European Respiratory Society Technical Standard: Exhaled Biomarkers in Lung Disease. Eur. Respir. J. 2017, 49, 1600965. [Google Scholar] [CrossRef] [PubMed]
- Leja, M.; Kortelainen, J.M.; Polaka, I.; Turppa, E.; Mitrovics, J.; Padilla, M.; Mochalski, P.; Shuster, G.; Pohle, R.; Kashanin, D.; et al. Sensing Gastric Cancer via Point-of-Care Sensor Breath Analyzer. Cancer 2021, 127, 1286–1292. [Google Scholar] [CrossRef] [PubMed]
- Paschke, S.; Jafarov, S.; Staib, L.; Kreuser, E.-D.; Maulbecker-Armstrong, C.; Roitman, M.; Holm, T.; Harris, C.C.; Link, K.-H.; Kornmann, M. Are Colon and Rectal Cancer Two Different Tumor Entities? A Proposal to Abandon the Term Colorectal Cancer. Int. J. Mol. Sci. 2018, 19, 2577. [Google Scholar] [CrossRef]
- Smith, R.A.; Fedewa, S.; Siegel, R. Early Colorectal Cancer Detection—Current and Evolving Challenges in Evidence, Guidelines, Policy, and Practices. Adv. Cancer Res. 2021, 151, 69–107. [Google Scholar] [PubMed]
- Perea García, J.; Arribas, J.; Cañete, Á.; García, J.L.; Álvaro, E.; Tapial, S.; Narváez, C.; Vivas, A.; Brandáriz, L.; Hernández-Villafranca, S.; et al. Association of Polyps with Early-Onset Colorectal Cancer and throughout Surveillance: Novel Clinical and Molecular Implications. Cancers 2019, 11, 1900. [Google Scholar] [CrossRef]
- Kim, M.; Vogtmann, E.; Ahlquist, D.A.; Devens, M.E.; Kisiel, J.B.; Taylor, W.R.; White, B.A.; Hale, V.L.; Sung, J.; Chia, N.; et al. Fecal Metabolomic Signatures in Colorectal Adenoma Patients Are Associated with Gut Microbiota and Early Events of Colorectal Cancer Pathogenesis. mBio 2020, 11, e03186-19. [Google Scholar] [CrossRef]
- Murakami, T.; Sakamoto, N.; Nagahara, A. Endoscopic Diagnosis of Sessile Serrated Adenoma/Polyp with and without Dysplasia/Carcinoma. World J. Gastroenterol. 2018, 24, 3250. [Google Scholar] [CrossRef]
- Eichenseer, P.J.; Dhanekula, R.; Jakate, S.; Mobarhan, S.; Melson, J.E. Endoscopic Mis-Sizing of Polyps Changes Colorectal Cancer Surveillance Recommendations. Dis. Colon. Rectum 2013, 56, 315–321. [Google Scholar] [CrossRef]
- Alecu, M.; Simion, L.; Straja, N.D.; Brătucu, E. Multiple Polyps and Colorectal Cancer. Chir. (Bucur) 2014, 109, 342–346. [Google Scholar]
- Waldum, H.; Fossmark, R. Gastritis, Gastric Polyps and Gastric Cancer. Int. J. Mol. Sci. 2021, 22, 6548. [Google Scholar] [CrossRef] [PubMed]
- Coleman, O.I.; Haller, D. Microbe–Mucus Interface in the Pathogenesis of Colorectal Cancer. Cancers 2021, 13, 616. [Google Scholar] [CrossRef] [PubMed]
- Steel, M.J.; Bukhari, H.; Gentile, L.; Telford, J.; Schaeffer, D.F. Colorectal Adenocarcinomas Diagnosed Following a Negative Faecal Immunochemical Test Show High-Risk Pathological Features in a Colon Screening Programme. Histopathology 2021, 78, 710–716. [Google Scholar] [CrossRef] [PubMed]
- Zhang, J.; Xie, X.; Wu, Z.; Hu, H.; Cai, Y.; Li, J.; Ling, J.; Ding, M.; Li, W.; Deng, Y. Mucinous Adenocarcinoma Predicts Poor Response and Prognosis in Patients with Locally Advanced Rectal Cancer: A Pooled Analysis of Individual Participant Data from 3 Prospective Studies. Clin. Color. Cancer 2021, 20, e240–e248. [Google Scholar] [CrossRef]
- Nitsche, U.; Zimmermann, A.; Späth, C.; Müller, T.; Maak, M.; Schuster, T.; Slotta-Huspenina, J.; Käser, S.A.; Michalski, C.W.; Janssen, K.-P.; et al. Mucinous and Signet-Ring Cell Colorectal Cancers Differ from Classical Adenocarcinomas in Tumor Biology and Prognosis. Ann. Surg. 2013, 258, 775. [Google Scholar] [CrossRef]
- Hu, X.; Li, Y.-Q.; Li, Q.-G.; Ma, Y.-L.; Peng, J.-J.; Cai, S. Mucinous Adenocarcinomas Histotype Can Also Be a High-Risk Factor for Stage II Colorectal Cancer Patients. Cell. Physiol. Biochem. 2018, 47, 630–640. [Google Scholar] [CrossRef]
- Park, E.J.; Baek, J.-H.; Choi, G.-S.; Park, W.C.; Yu, C.S.; Kang, S.-B.; Min, B.S.; Kim, J.H.; Kim, H.R.; Lee, B.H.; et al. The Role of Primary Tumor Resection in Colorectal Cancer Patients with Asymptomatic, Synchronous, Unresectable Metastasis: A Multicenter Randomized Controlled Trial. Cancers 2020, 12, 2306. [Google Scholar] [CrossRef]
- Chow, J.S.; Chen, C.C.; Ahsan, H.; Neugut, A.I. A Population-Based Study of the Incidence of Malignant Small Bowel Tumours: SEER, 1973–1990. Int. J. Epidemiol. 1996, 25, 722–728. [Google Scholar] [CrossRef] [PubMed][Green Version]
- Ogunwobi, O.O.; Mahmood, F.; Akingboye, A. Biomarkers in Colorectal Cancer: Current Research and Future Prospects. Int. J. Mol. Sci. 2020, 21, 5311. [Google Scholar] [CrossRef] [PubMed]
- Probert, C.S.J.; Khalid, T.; Ahmed, I.; Johnson, E.; Smith, S.; Ratcliffe, N.M. Volatile Organic Compounds as Diagnostic Biomarkers in Gastrointestinal and Liver Diseases. J. Gastrointest. Liver Dis. 2009, 18, 337–343. [Google Scholar]
- Vernia, F.; Valvano, M.; Fabiani, S.; Stefanelli, G.; Longo, S.; Viscido, A.; Latella, G. Are Volatile Organic Compounds Accurate Markers in the Assessment of Colorectal Cancer and Inflammatory Bowel Diseases? A Review. Cancers 2021, 13, 2361. [Google Scholar] [CrossRef] [PubMed]
- Chung, J.; Akter, S.; Han, S.; Shin, Y.; Choi, T.G.; Kang, I.; Kim, S.S. Diagnosis by Volatile Organic Compounds in Exhaled Breath from Patients with Gastric and Colorectal Cancers. Int. J. Mol. Sci. 2022, 24, 129. [Google Scholar] [CrossRef]
- De Vietro, N.; Aresta, A.; Rotelli, M.T.; Zambonin, C.; Lippolis, C.; Picciariello, A.; Altomare, D.F. Relationship between Cancer Tissue Derived and Exhaled Volatile Organic Compound from Colorectal Cancer Patients. Preliminary Results. J. Pharm. Biomed. Anal. 2020, 180, 113055. [Google Scholar] [CrossRef]
- Dima, A.C.; Balaban, D.V.; Dima, A. Diagnostic Application of Volatile Organic Compounds as Potential Biomarkers for Detecting Digestive Neoplasia: A Systematic Review. Diagnostics 2021, 11, 2317. [Google Scholar] [CrossRef]
- Xiang, L.; Wu, S.; Hua, Q.; Bao, C.; Liu, H. Volatile Organic Compounds in Human Exhaled Breath to Diagnose Gastrointestinal Cancer: A Meta-Analysis. Front. Oncol. 2021, 11, 606915. [Google Scholar] [CrossRef]
- Hanna, G.B.; Boshier, P.R.; Markar, S.R.; Romano, A. Accuracy and Methodologic Challenges of Volatile Organic Compound–Based Exhaled Breath Tests for Cancer Diagnosis: A Systematic Review and Meta-Analysis. JAMA Oncol. 2019, 5, e182815. [Google Scholar] [CrossRef]
- Zhou, W.; Tao, J.; Li, J.; Tao, S. Volatile Organic Compounds Analysis as a Potential Novel Screening Tool for Colorectal Cancer: A Systematic Review and Meta-Analysis. Medicine 2020, 99, e20937. [Google Scholar] [CrossRef]
- Wang, L.; Li, J.; Xiong, X.; Hao, T.; Zhang, C.; Gao, Z.; Zhong, L.; Zhao, Y. Volatile Organic Compounds as a Potential Screening Tool for Neoplasm of the Digestive System: A Meta-Analysis. Sci. Rep. 2021, 11, 23716. [Google Scholar] [CrossRef] [PubMed]
- Poļaka, I.; Mežmale, L.; Anarkulova, L.; Kononova, E.; Vilkoite, I.; Veliks, V.; Ļeščinska, A.M.; Stonāns, I.; Pčolkins, A.; Tolmanis, I.; et al. The Detection of Colorectal Cancer through Machine Learning-Based Breath Sensor Analysis. Diagnostics 2023, 13, 3355. [Google Scholar] [CrossRef]
- Altomare, D.F.; Porcelli, F.; Picciariello, A.; Pinto, M.; Di Lena, M.; Caputi Iambrenghi, O.; Ugenti, I.; Guglielmi, A.; Vincenti, L.; De Gennaro, G. The Use of the PEN3 E-Nose in the Screening of Colorectal Cancer and Polyps. Tech. Coloproctol. 2016, 20, 405–409. [Google Scholar] [CrossRef] [PubMed]
- Gutierrez-Osuna, R.; Nagle, H.T. A Method for Evaluating Data-Preprocessing Techniques for Odour Classification with an Array of Gas Sensors. IEEE Trans. Syst. Man Cybern. (Cybern.) 1999, 29, 626–632. [Google Scholar] [CrossRef] [PubMed]
- Sola, J.; Sevilla, J. Importance of Input Data Normalization for the Application of Neural Networks to Complex Industrial Problems. IEEE Trans. Nucl. Sci. 1997, 44, 1464–1468. [Google Scholar] [CrossRef]
- Yan, J.; Guo, X.; Duan, S.; Jia, P.; Wang, L.; Peng, C.; Zhang, S. Electronic Nose Feature Extraction Methods: A Review. Sensors 2015, 15, 27804–27831. [Google Scholar] [CrossRef]
- Carmel, L.; Levy, S.; Lancet, D.; Harel, D. A Feature Extraction Method for Chemical Sensors in Electronic Noses. Sens. Actuators B Chem. 2003, 93, 67–76. [Google Scholar] [CrossRef]
- Agustika, D.K.; Triyana, K. Application of Principal Component Analysis and Discrete Wavelet Transform in Electronic Nose for Herbal Drinks Classification. In Proceedings of the AIP Conference Proceedings, Yogyakarta, Indonesia, 11–13 November 2015; AIP Publishing: New York, NY, USA, 2016; Volume 1755, p. 170012. [Google Scholar]
- Guyon, I.; Elisseeff, A. An Introduction to Variable and Feature Selection. J. Mach. Learn. Res. 2003, 3, 1157–1182. [Google Scholar]
- Ranstam, J.; Cook, J.A. LASSO Regression. J. Br. Surg. 2018, 105, 1348. [Google Scholar] [CrossRef]
- Jollife, I.T. Principal Component Analysis, 2nd ed.; Springer: Berlin, Germany, 2002. [Google Scholar]
- Florensa, D.; Mateo-Fornés, J.; Solsona, F.; Pedrol Aige, T.; Mesas Julió, M.; Piñol, R.; Godoy, P. Use of Multiple Correspondence Analysis and K-Means to Explore Associations between Risk Factors and Likelihood of Colorectal Cancer: Cross-Sectional Study. J. Med. Internet Res. 2022, 24, e29056. [Google Scholar] [CrossRef]
- Dubey, A.K.; Gupta, U.; Jain, S. Analysis of K-Means Clustering Approach on the Breast Cancer Wisconsin Dataset. Int. J. Comput. Assist. Radiol. Surg. 2016, 11, 2033–2047. [Google Scholar] [CrossRef]
- Ouyang, F.; Guo, B.; Ouyang, L.; Liu, Z.; Lin, S.; Meng, W.; Huang, X.; Chen, H.; Qiu-Gen, H.; Yang, S. Comparison between Linear and Nonlinear Machine-Learning Algorithms for the Classification of Thyroid Nodules. Eur. J. Radiol. 2019, 113, 251–257. [Google Scholar] [CrossRef]
- Ebrahim, M.; Sedky, A.A.H.; Mesbah, S. Accuracy Assessment of Machine Learning Algorithms Used to Predict Breast Cancer. Data 2023, 8, 35. [Google Scholar] [CrossRef]
- Zhang, Y.; Weng, Y.; Lund, J. Applications of Explainable Artificial Intelligence in Diagnosis and Surgery. Diagnostics 2022, 12, 237. [Google Scholar] [CrossRef]
- Uddin, S.; Khan, A.; Hossain, M.E.; Moni, M.A. Comparing Different Supervised Machine Learning Algorithms for Disease Prediction. BMC Med. Inform. Decis. Mak. 2019, 19, 281. [Google Scholar] [CrossRef]
- Diaz-Uriarte, R.; de Lope, E.; Giugno, R.; Fröhlich, H.; Nazarov, P.V.; Nepomuceno-Chamorro, I.A.; Rauschenberger, A.; Glaab, E. Ten Quick Tips for Biomarker Discovery and Validation Analyses Using Machine Learning. PLoS Comput. Biol. 2022, 18, e1010357. [Google Scholar] [CrossRef] [PubMed]
- Rafało, M. Cross Validation Methods: Analysis Based on Diagnostics of Thyroid Cancer Metastasis. ICT Express 2022, 8, 183–188. [Google Scholar] [CrossRef]
- Gallos, I.K.; Gkiatis, K.; Matsopoulos, G.K.; Siettos, C. ISOMAP and Machine Learning Algorithms for the Construction of Embedded Functional Connectivity Networks of Anatomically Separated Brain Regions from Resting State FMRI Data of Patients with Schizophrenia. AIMS Neurosci. 2021, 8, 295. [Google Scholar] [CrossRef] [PubMed]
- Vazquez-Zapien, G.J.; Mata-Miranda, M.M.; Garibay-Gonzalez, F.; Sanchez-Brito, M. Artificial Intelligence Model Validation before Its Application in Clinical Diagnosis Assistance. World J. Gastroenterol. 2022, 28, 602. [Google Scholar] [CrossRef] [PubMed]
- Tenenbaum, J.B.; De Silva, V.; Langford, J.C. A Global Geometric Framework for Nonlinear Dimensionality Reduction. Science 2000, 290, 2319–2323. [Google Scholar] [CrossRef] [PubMed]
- Roweis, S.T.; Saul, L.K. Nonlinear Dimensionality Reduction by Locally Linear Embedding. Science 2000, 290, 2323–2326. [Google Scholar] [CrossRef] [PubMed]
- Schölkopf, B.; Smola, A.; Müller, K.-R. Kernel Principal Component Analysis. In Proceedings of the Artificial Neural Networks—ICANN’97: 7th International Conference, Lausanne, Switzerland, 8–10 October 1997; Springer: Berlin/Heidelberg, Germany, 2005; pp. 583–588. [Google Scholar]
- Coifman, R.R.; Lafon, S. Diffusion Maps. Appl. Comput. Harmon. Anal. 2006, 21, 5–30. [Google Scholar] [CrossRef]
- Gallos, I.K.; Galaris, E.; Siettos, C.I. Construction of Embedded FMRI Resting-State Functional Connectivity Networks Using Manifold Learning. Cogn. Neurodyn 2021, 15, 585–608. [Google Scholar] [CrossRef] [PubMed]
- Gallos, I.K.; Lehmberg, D.; Dietrich, F.; Siettos, C. Data-Driven Modelling of Brain Activity Using Neural Networks, Diffusion Maps, and the Koopman Operator. arXiv 2023, arXiv:2304.11925. [Google Scholar]
- Papaioannou, P.G.; Talmon, R.; Kevrekidis, I.G.; Siettos, C. Time-Series Forecasting Using Manifold Learning, Radial Basis Function Interpolation, and Geometric Harmonics. Chaos Interdiscip. J. Nonlinear Sci. 2022, 32, 83113. [Google Scholar] [CrossRef]
- Galaris, E.; Fabiani, G.; Gallos, I.; Kevrekidis, I.; Siettos, C. Numerical Bifurcation Analysis of Pdes from Lattice Boltzmann Model Simulations: A Parsimonious Machine Learning Approach. J. Sci. Comput. 2022, 92, 34. [Google Scholar] [CrossRef]
- Razzak, M.I.; Naz, S.; Zaib, A. Deep Learning for Medical Image Processing: Overview, Challenges and the Future. Classif. BioApps Autom. Decis. Mak. 2018, 26, 323–350. [Google Scholar]
- Litjens, G.; Sánchez, C.I.; Timofeeva, N.; Hermsen, M.; Nagtegaal, I.; Kovacs, I.; Hulsbergen-Van De Kaa, C.; Bult, P.; Van Ginneken, B.; Van Der Laak, J. Deep Learning as a Tool for Increased Accuracy and Efficiency of Histopathological Diagnosis. Sci. Rep. 2016, 6, 26286. [Google Scholar] [CrossRef]
- Ye, Z.; Liu, Y.; Li, Q. Recent Progress in Smart Electronic Nose Technologies Enabled with Machine Learning Methods. Sensors 2021, 21, 7620. [Google Scholar] [CrossRef]
- Aslam, M.A.; Xue, C.; Chen, Y.; Zhang, A.; Liu, M.; Wang, K.; Cui, D. Breath Analysis Based Early Gastric Cancer Classification from Deep Stacked Sparse Autoencoder Neural Network. Sci. Rep. 2021, 11, 4014. [Google Scholar] [CrossRef]
- Längkvist, M.; Karlsson, L.; Loutfi, A. A Review of Unsupervised Feature Learning and Deep Learning for Time-Series Modeling. Pattern Recognit. Lett. 2014, 42, 11–24. [Google Scholar] [CrossRef]
- Zhou, D.; Tian, F.; Tian, X.; Sun, L.; Huang, X.; Zhao, F.; Zhou, N.; Chen, Z.; Zhang, Q.; Yang, M.; et al. Diagnostic Evaluation of a Deep Learning Model for Optical Diagnosis of Colorectal Cancer. Nat. Commun. 2020, 11, 2961. [Google Scholar] [CrossRef] [PubMed]
- Park, H.-C.; Kim, Y.-J.; Lee, S.-W. Adenocarcinoma Recognition in Endoscopy Images Using Optimized Convolutional Neural Networks. Appl. Sci. 2020, 10, 1650. [Google Scholar] [CrossRef]
- Zhou, P.; Cao, Y.; Li, M.; Ma, Y.; Chen, C.; Gan, X.; Wu, J.; Lv, X.; Chen, C. HCCANet: Histopathological Image Grading of Colorectal Cancer Using CNN Based on Multichannel Fusion Attention Mechanism. Sci. Rep. 2022, 12, 15103. [Google Scholar] [CrossRef] [PubMed]
- Li, Z.; Liu, F.; Yang, W.; Peng, S.; Zhou, J. A Survey of Convolutional Neural Networks: Analysis, Applications, and Prospects. IEEE Trans. Neural Netw. Learn. Syst. 2021, 33, 6999–7019. [Google Scholar] [CrossRef] [PubMed]
- Zou, Y.; Lv, J. Using Recurrent Neural Network to Optimize Electronic Nose System with Dimensionality Reduction. Electronics 2020, 9, 2205. [Google Scholar] [CrossRef]
- Fukuyama, K.; Matsui, K.; Omatsu, S.; Rivas, A.; Corchado, J.M. Feature Extraction and Classification of Odor Using Attention Based Neural Network. In Distributed Computing and Artificial Intelligence, 16th International Conference; Springer: Cham, Switzerland, 2020; pp. 142–149. [Google Scholar]
- Alzubaidi, L.; Zhang, J.; Humaidi, A.J.; Al-Dujaili, A.; Duan, Y.; Al-Shamma, O.; Santamaría, J.; Fadhel, M.A.; Al-Amidie, M.; Farhan, L. Review of Deep Learning: Concepts, CNN Architectures, Challenges, Applications, Future Directions. J. Big Data 2021, 8, 53. [Google Scholar] [CrossRef]
- Rynazal, R.; Fujisawa, K.; Shiroma, H.; Salim, F.; Mizutani, S.; Shiba, S.; Yachida, S.; Yamada, T. Leveraging Explainable AI for Gut Microbiome-Based Colorectal Cancer Classification. Genome Biol. 2023, 24, 21. [Google Scholar] [CrossRef]
- Massafra, R.; Fanizzi, A.; Amoroso, N.; Bove, S.; Comes, M.C.; Pomarico, D.; Didonna, V.; Diotaiuti, S.; Galati, L.; Giotta, F.; et al. Analyzing Breast Cancer Invasive Disease Event Classification through Explainable Artificial Intelligence. Front. Med. 2023, 10, 1116354. [Google Scholar] [CrossRef]
- Sabol, P.; Sinčák, P.; Hartono, P.; Kočan, P.; Benetinová, Z.; Blichárová, A.; Verbóová, L.; Štammová, E.; Sabolová-Fabianová, A.; Jašková, A. Explainable Classifier for Improving the Accountability in Decision-Making for Colorectal Cancer Diagnosis from Histopathological Images. J. Biomed. Inform. 2020, 109, 103523. [Google Scholar] [CrossRef]
- Gunning, D.; Stefik, M.; Choi, J.; Miller, T.; Stumpf, S.; Yang, G.-Z. XAI—Explainable Artificial Intelligence. Sci. Robot. 2019, 4, eaay7120. [Google Scholar] [CrossRef] [PubMed]
- Rodríguez-Pérez, R.; Bajorath, J. Interpretation of Compound Activity Predictions from Complex Machine Learning Models Using Local Approximations and Shapley Values. J. Med. Chem. 2019, 63, 8761–8777. [Google Scholar] [CrossRef] [PubMed]
- Ribeiro, M.T.; Singh, S.; Guestrin, C. “Why Should i Trust You?” Explaining the Predictions of Any Classifier. In Proceedings of the 22nd ACM SIGKDD International Conference on Knowledge Discovery and Data Mining, San Francisco, CA, USA, 13–17 August 2016; pp. 1135–1144. [Google Scholar]
- Selvaraju, R.R.; Cogswell, M.; Das, A.; Vedantam, R.; Parikh, D.; Batra, D. Grad-Cam: Visual Explanations from Deep Networks via Gradient-Based Localization. In Proceedings of the IEEE International Conference on Computer Vision, Venice, Italy, 22–29 October 2017; pp. 618–626. [Google Scholar]
- Garg, P.; Davenport, E.; Murugesan, G.; Wagner, B.; Whitlow, C.; Maldjian, J.; Montillo, A. Automatic 1D Convolutional Neural Network-Based Detection of Artifacts in MEG Acquired without Electrooculography or Electrocardiography. In Proceedings of the 2017 International Workshop on Pattern Recognition in Neuroimaging (PRNI), Toronto, ON, Canada, 21–23 June 2017; pp. 1–4. [Google Scholar]
- Zhao, X.; Wen, Z.; Pan, X.; Ye, W.; Bermak, A. Mixture Gases Classification Based on Multi-Label One-Dimensional Deep Convolutional Neural Network. IEEE Access 2019, 7, 12630–12637. [Google Scholar] [CrossRef]
- Yang, C.-L.; Chen, Z.-X.; Yang, C.-Y. Sensor Classification Using Convolutional Neural Network by Encoding Multivariate Time Series as Two-Dimensional Colored Images. Sensors 2019, 20, 168. [Google Scholar] [CrossRef]
- Krstajic, D.; Buturovic, L.J.; Leahy, D.E.; Thomas, S. Cross-Validation Pitfalls When Selecting and Assessing Regression and Classification Models. J. Cheminform. 2014, 6, 10. [Google Scholar] [CrossRef]
- Varma, S.; Simon, R. Bias in Error Estimation When Using Cross-Validation for Model Selection. BMC Bioinform. 2006, 7, 91. [Google Scholar] [CrossRef]
- Hastie, T.; Tibshirani, R.; Friedman, J.H.; Friedman, J.H. The Elements of Statistical Learning: Data Mining, Inference, and Prediction; Springer: Berlin/Heidelberg, Germany, 2009; Volume 2. [Google Scholar]
Disclaimer/Publisher’s Note: The statements, opinions and data contained in all publications are solely those of the individual author(s) and contributor(s) and not of MDPI and/or the editor(s). MDPI and/or the editor(s) disclaim responsibility for any injury to people or property resulting from any ideas, methods, instructions or products referred to in the content. |
© 2023 by the authors. Licensee MDPI, Basel, Switzerland. This article is an open access article distributed under the terms and conditions of the Creative Commons Attribution (CC BY) license (https://creativecommons.org/licenses/by/4.0/).