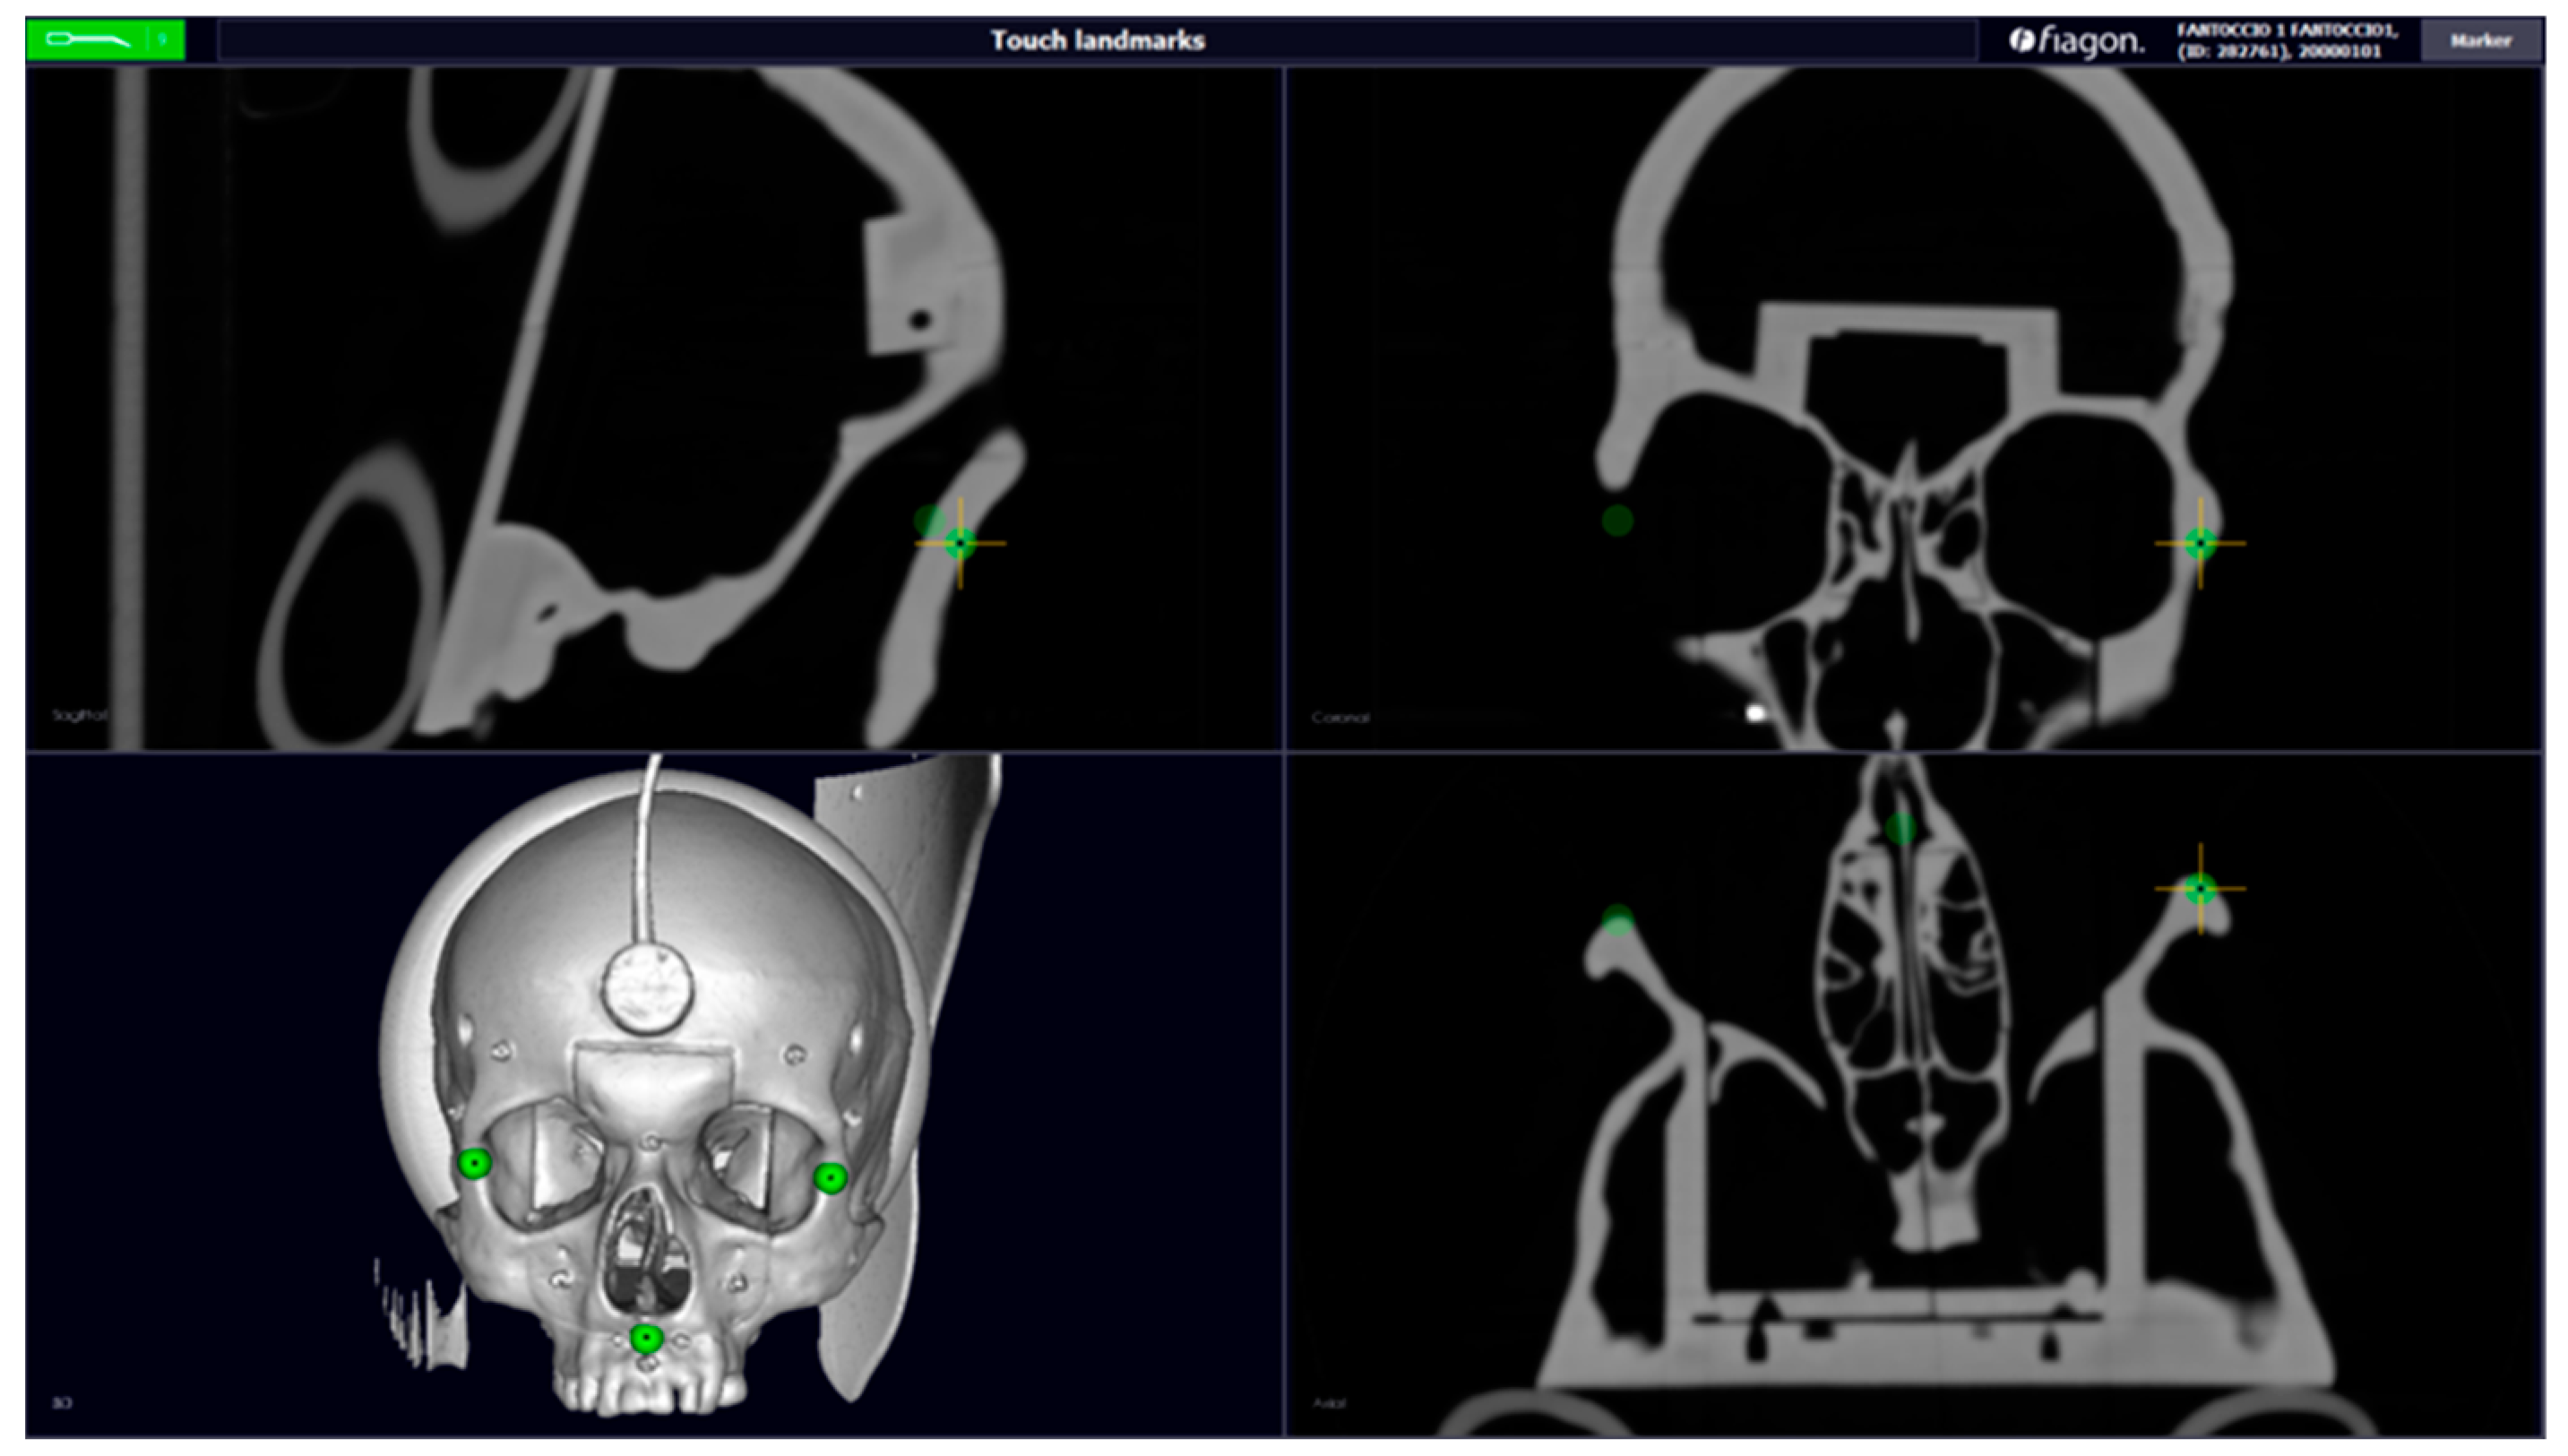
Figure 1.
CT scanning (axial, sagittal, coronal, and 3D) with the dental device, created using CAD software. Green points—Fiducal Landmarks for calibration (maxillo malar suture and anterior nasal spine).
Figure 1.
CT scanning (axial, sagittal, coronal, and 3D) with the dental device, created using CAD software. Green points—Fiducal Landmarks for calibration (maxillo malar suture and anterior nasal spine).
Figure 2.
Volume Cropping.
Figure 2.
Volume Cropping.
Figure 3.
Dental structure of the phantom.
Figure 3.
Dental structure of the phantom.
Figure 4.
Bite obtained from the phantom’s upper dental structure.
Figure 4.
Bite obtained from the phantom’s upper dental structure.
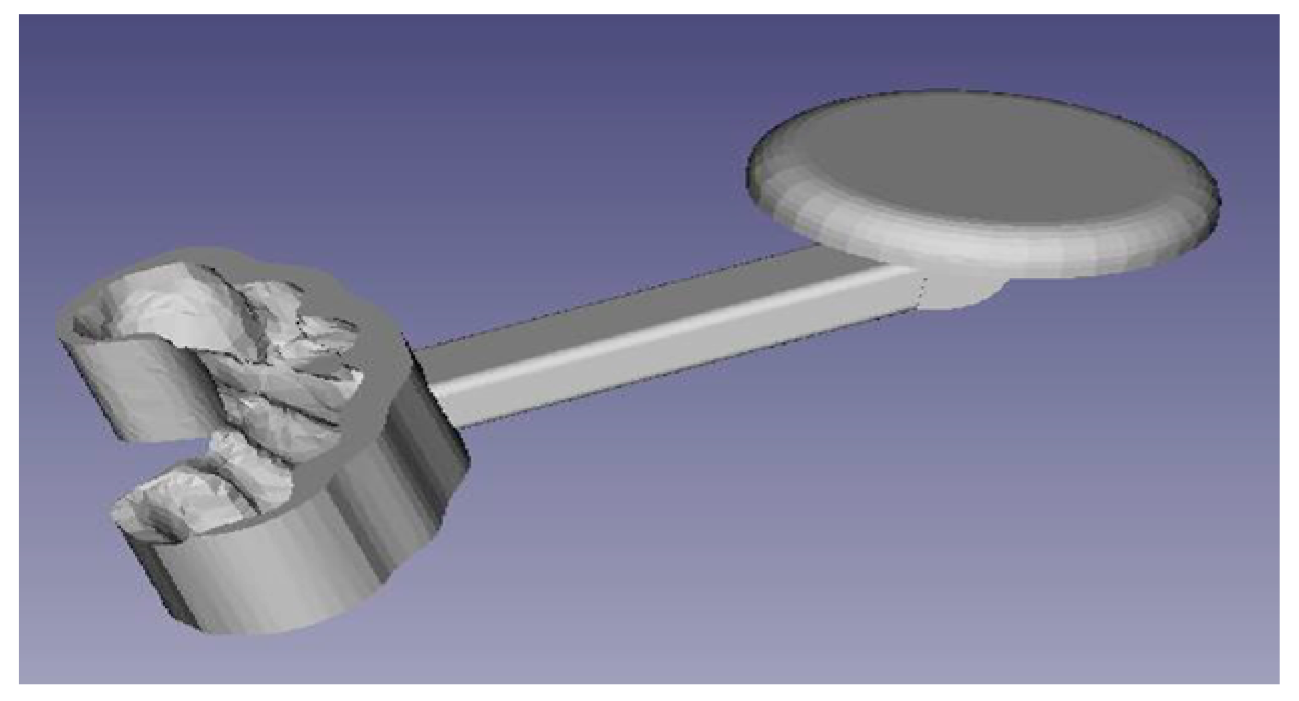
Figure 5.
Sensor support.
Figure 5.
Sensor support.
Figure 7.
Distance between the spheres is indicated by letters. The distances between the spheres measured with the software: (a) frontal right–left, (b) temporal right–left, (c) maxillary right–left, (d) premaxilla right–left, (e) glabella–anterior nasal spine, (f) glabella–right maxilla, (g) glabella–left maxilla.
Figure 8.
Spheres marked with numbers.
Figure 8.
Spheres marked with numbers.
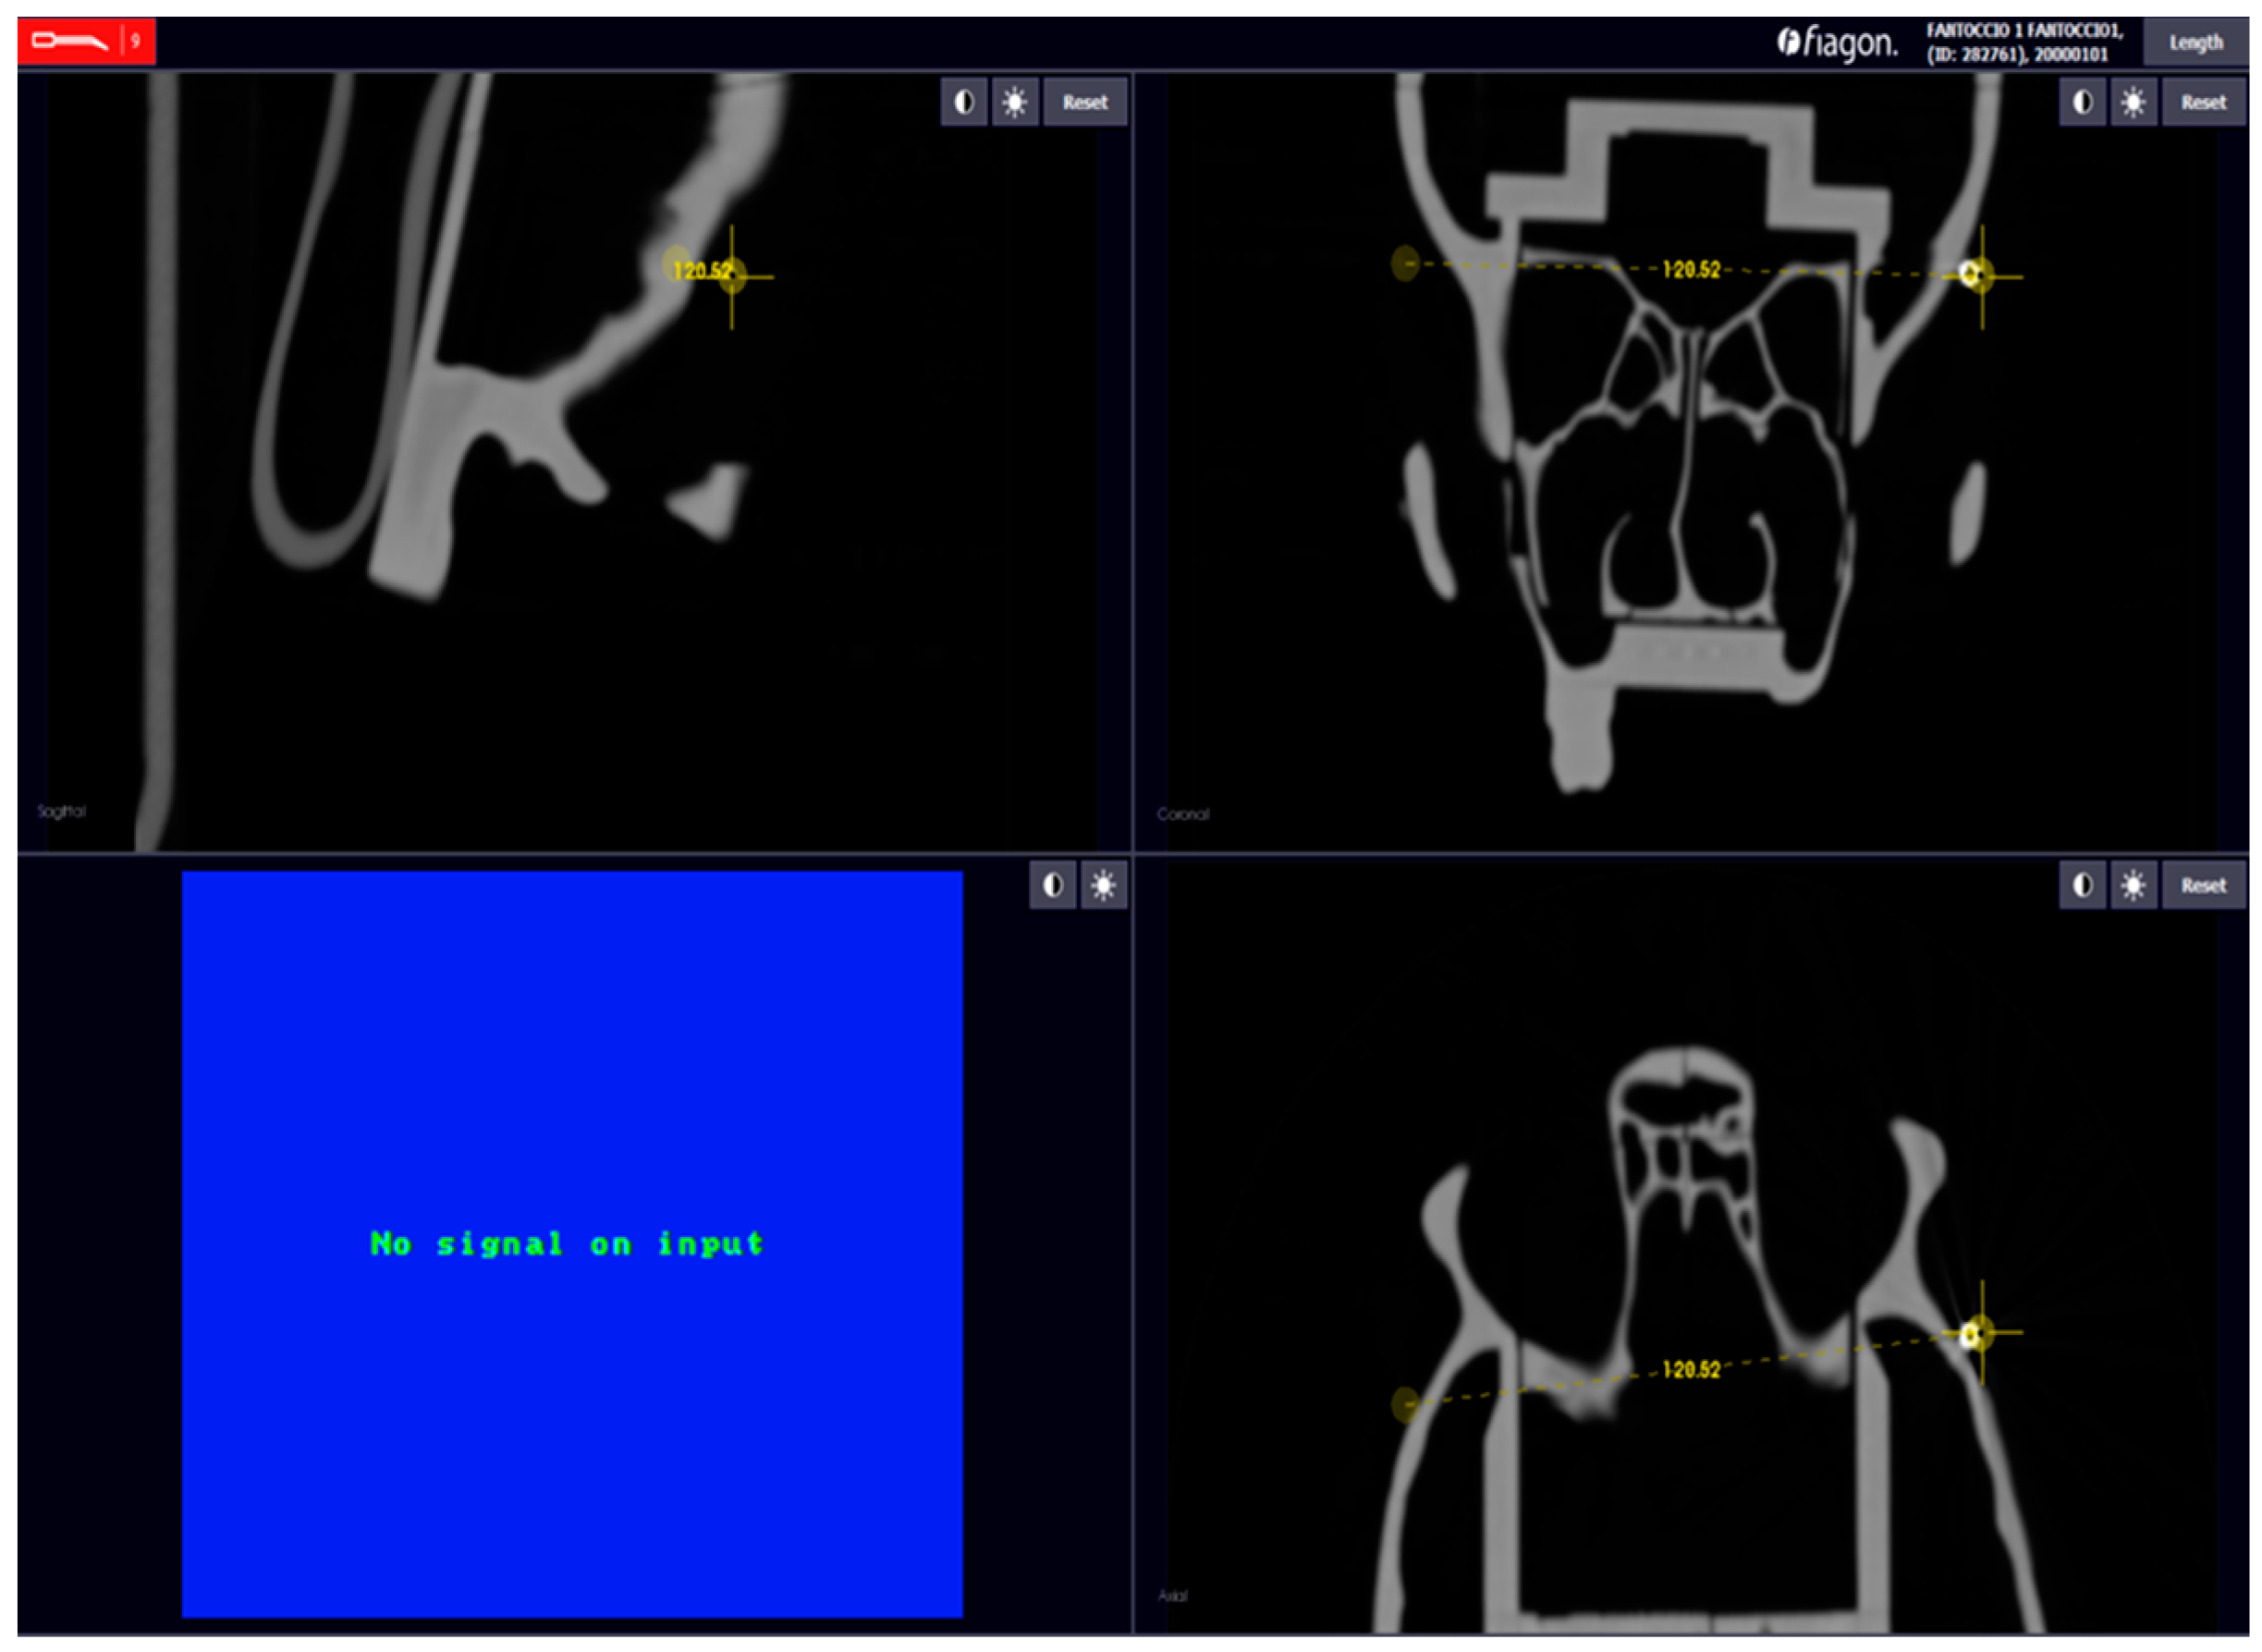
Figure 9.
Example: measure distance.
Figure 9.
Example: measure distance.
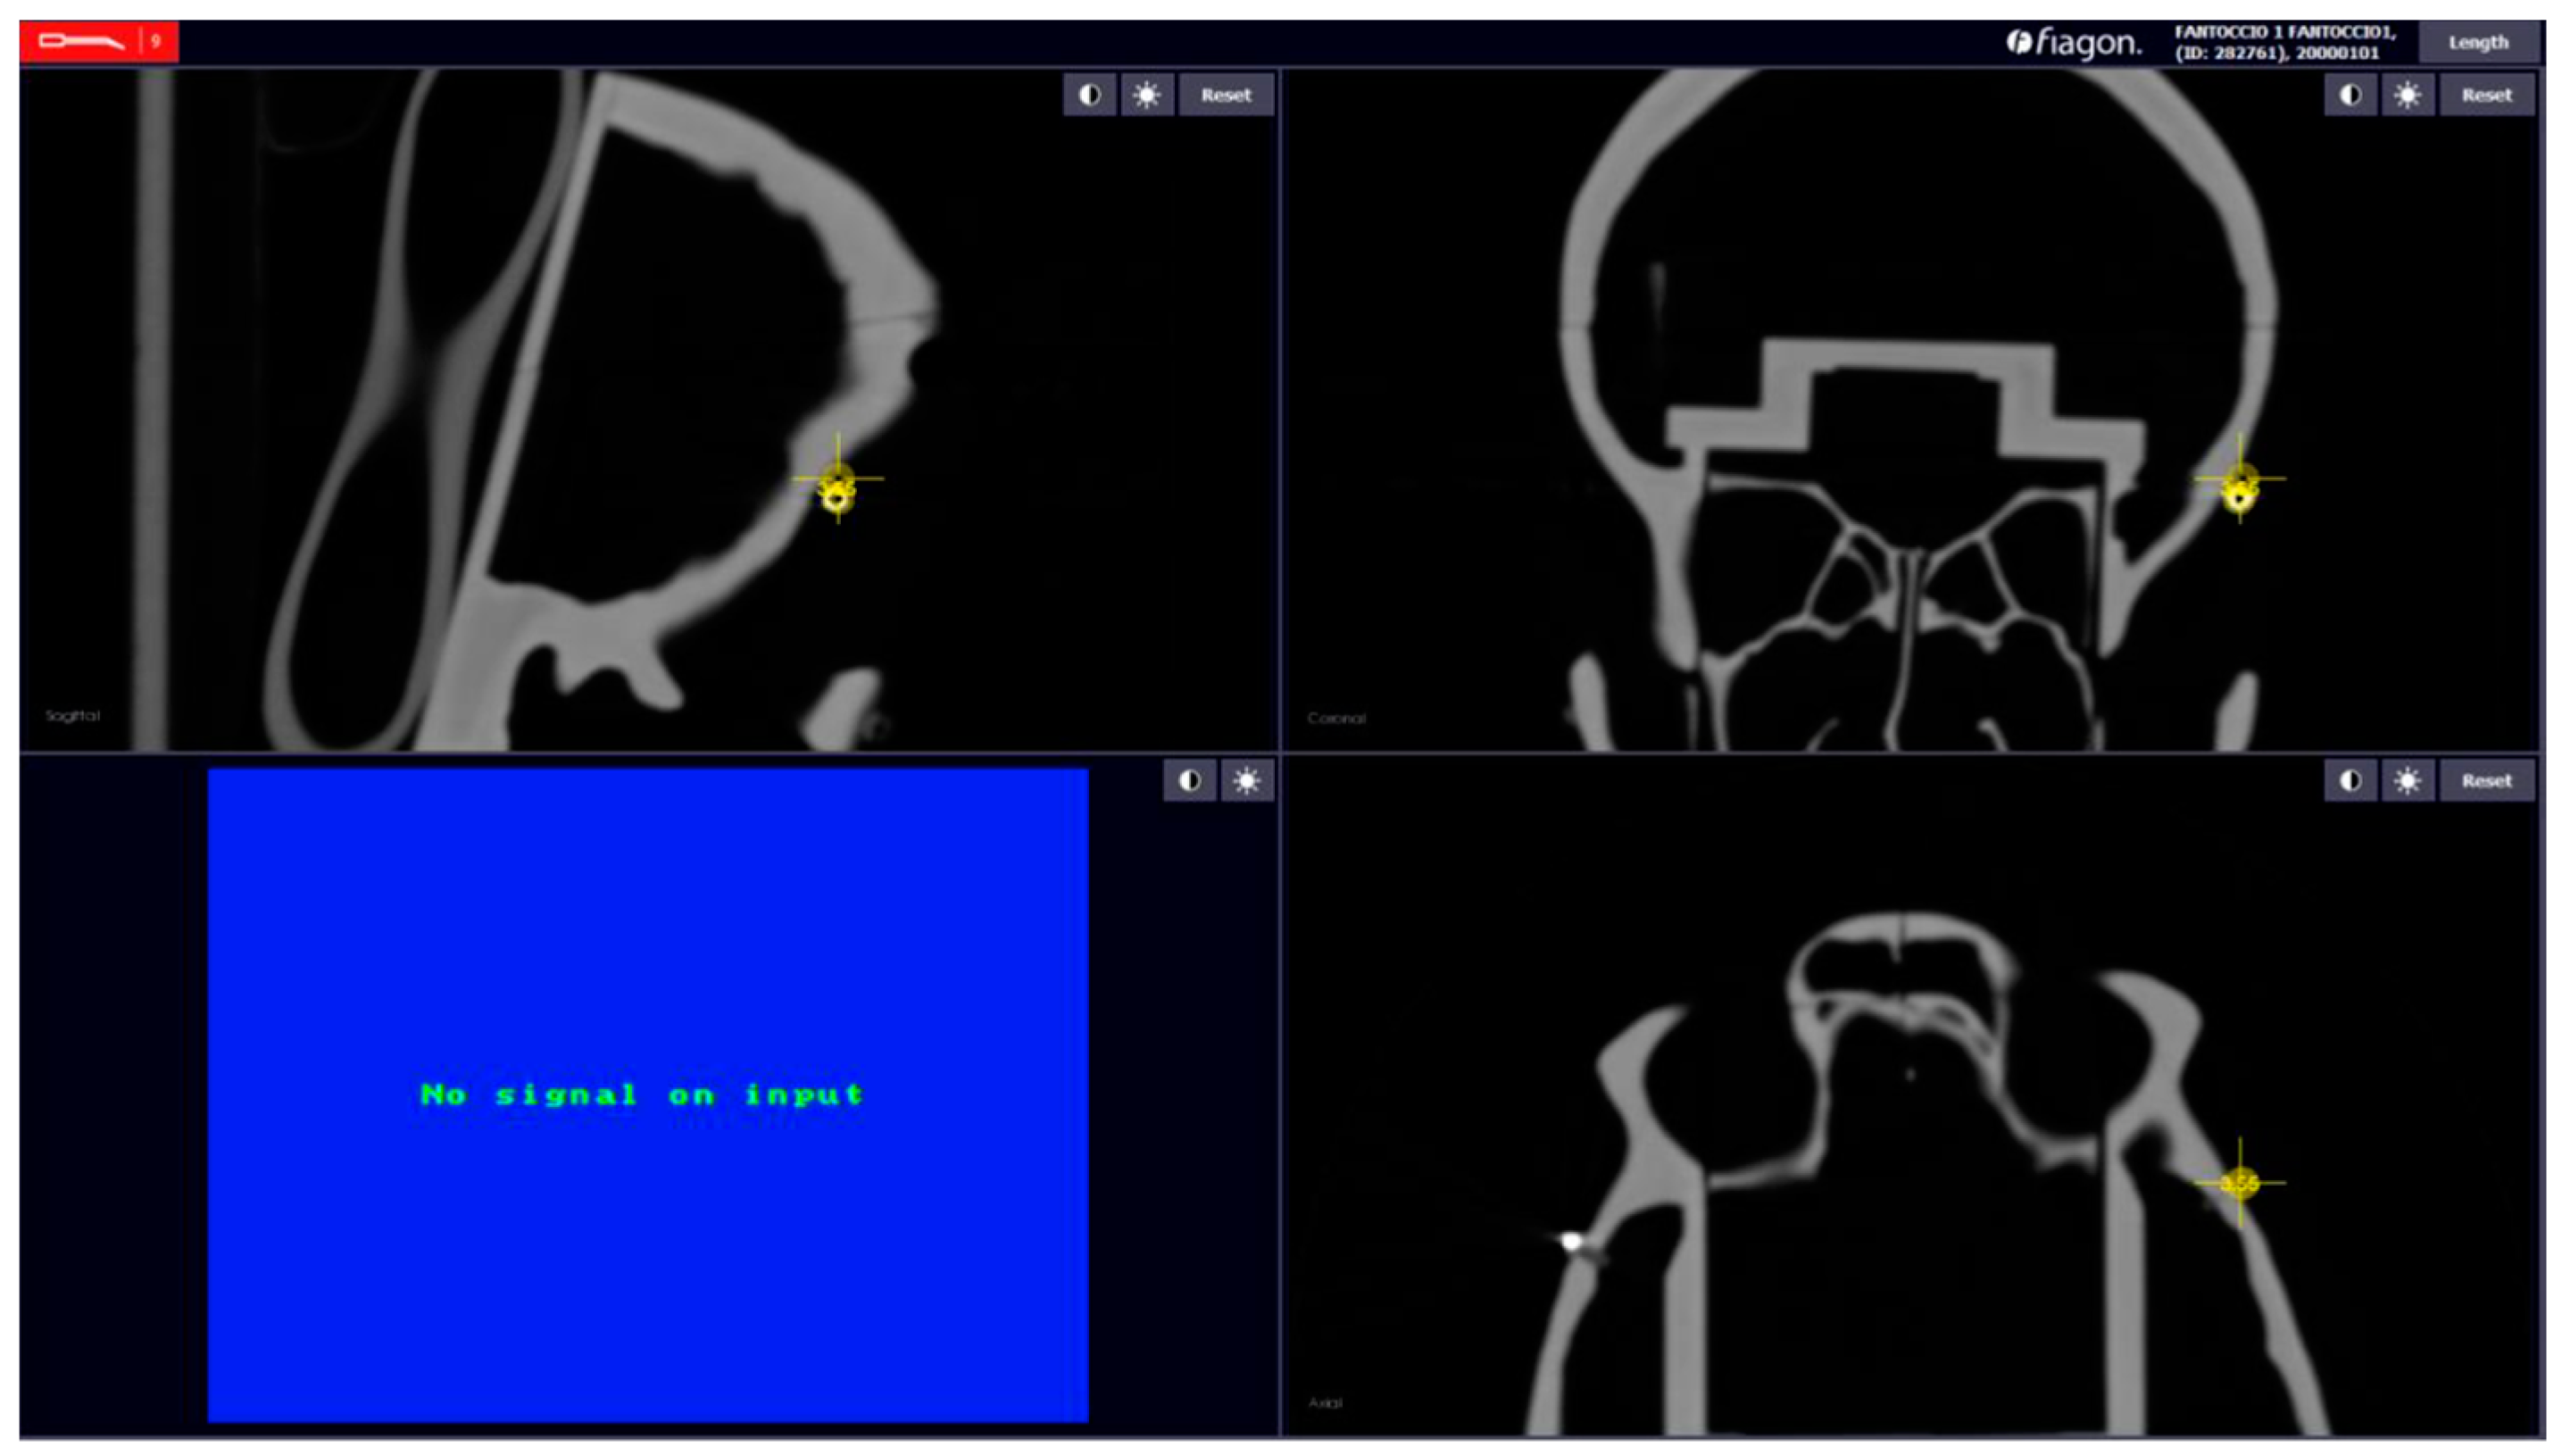
Figure 10.
Error localization sphere nr.5.
Figure 10.
Error localization sphere nr.5.
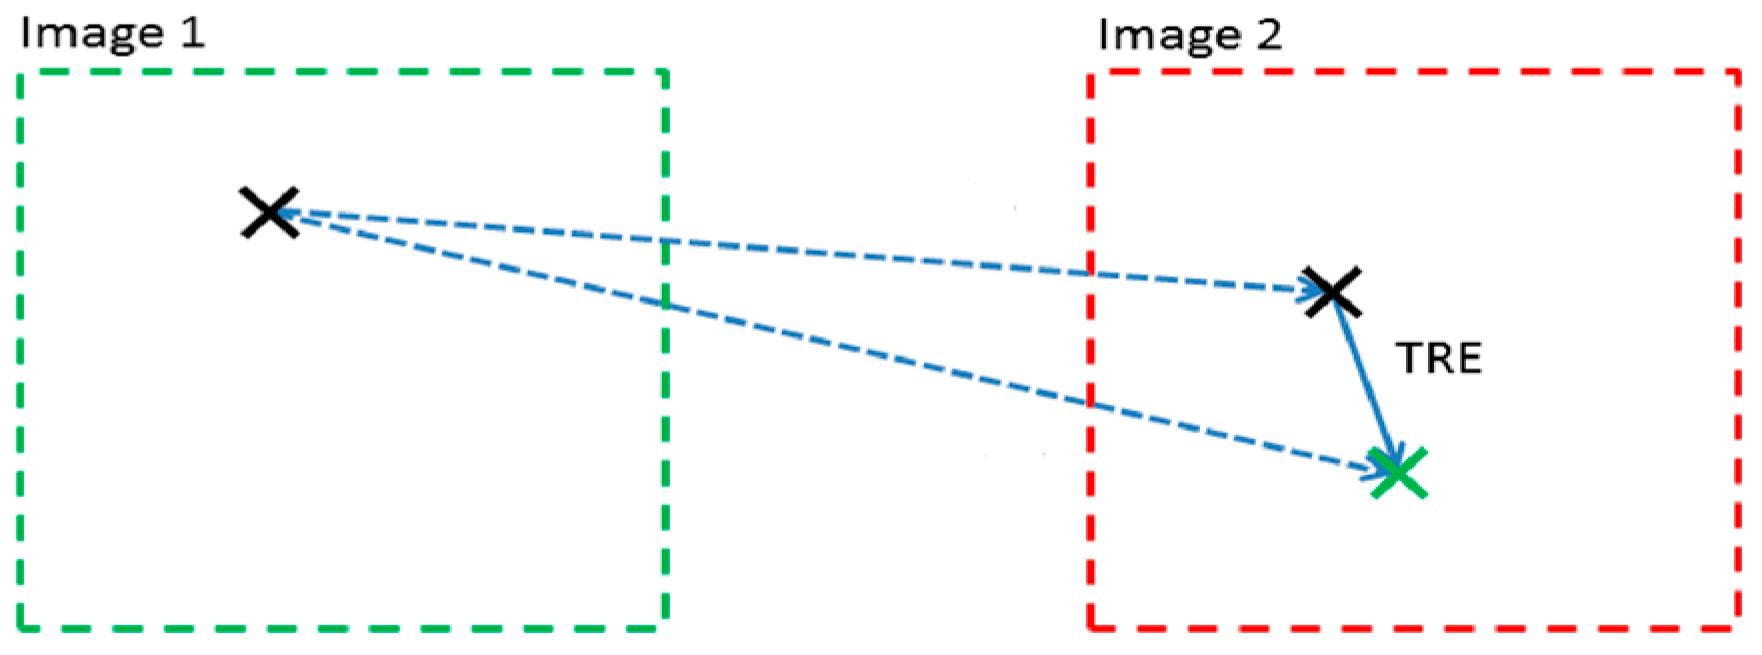
Figure 11.
Target Registration Error. Black ‘X’ is the sphere shown on the TC scan. Green ‘X’ is the real-time position of the navigator pointer located on the surface of the sphere.
Figure 11.
Target Registration Error. Black ‘X’ is the sphere shown on the TC scan. Green ‘X’ is the real-time position of the navigator pointer located on the surface of the sphere.
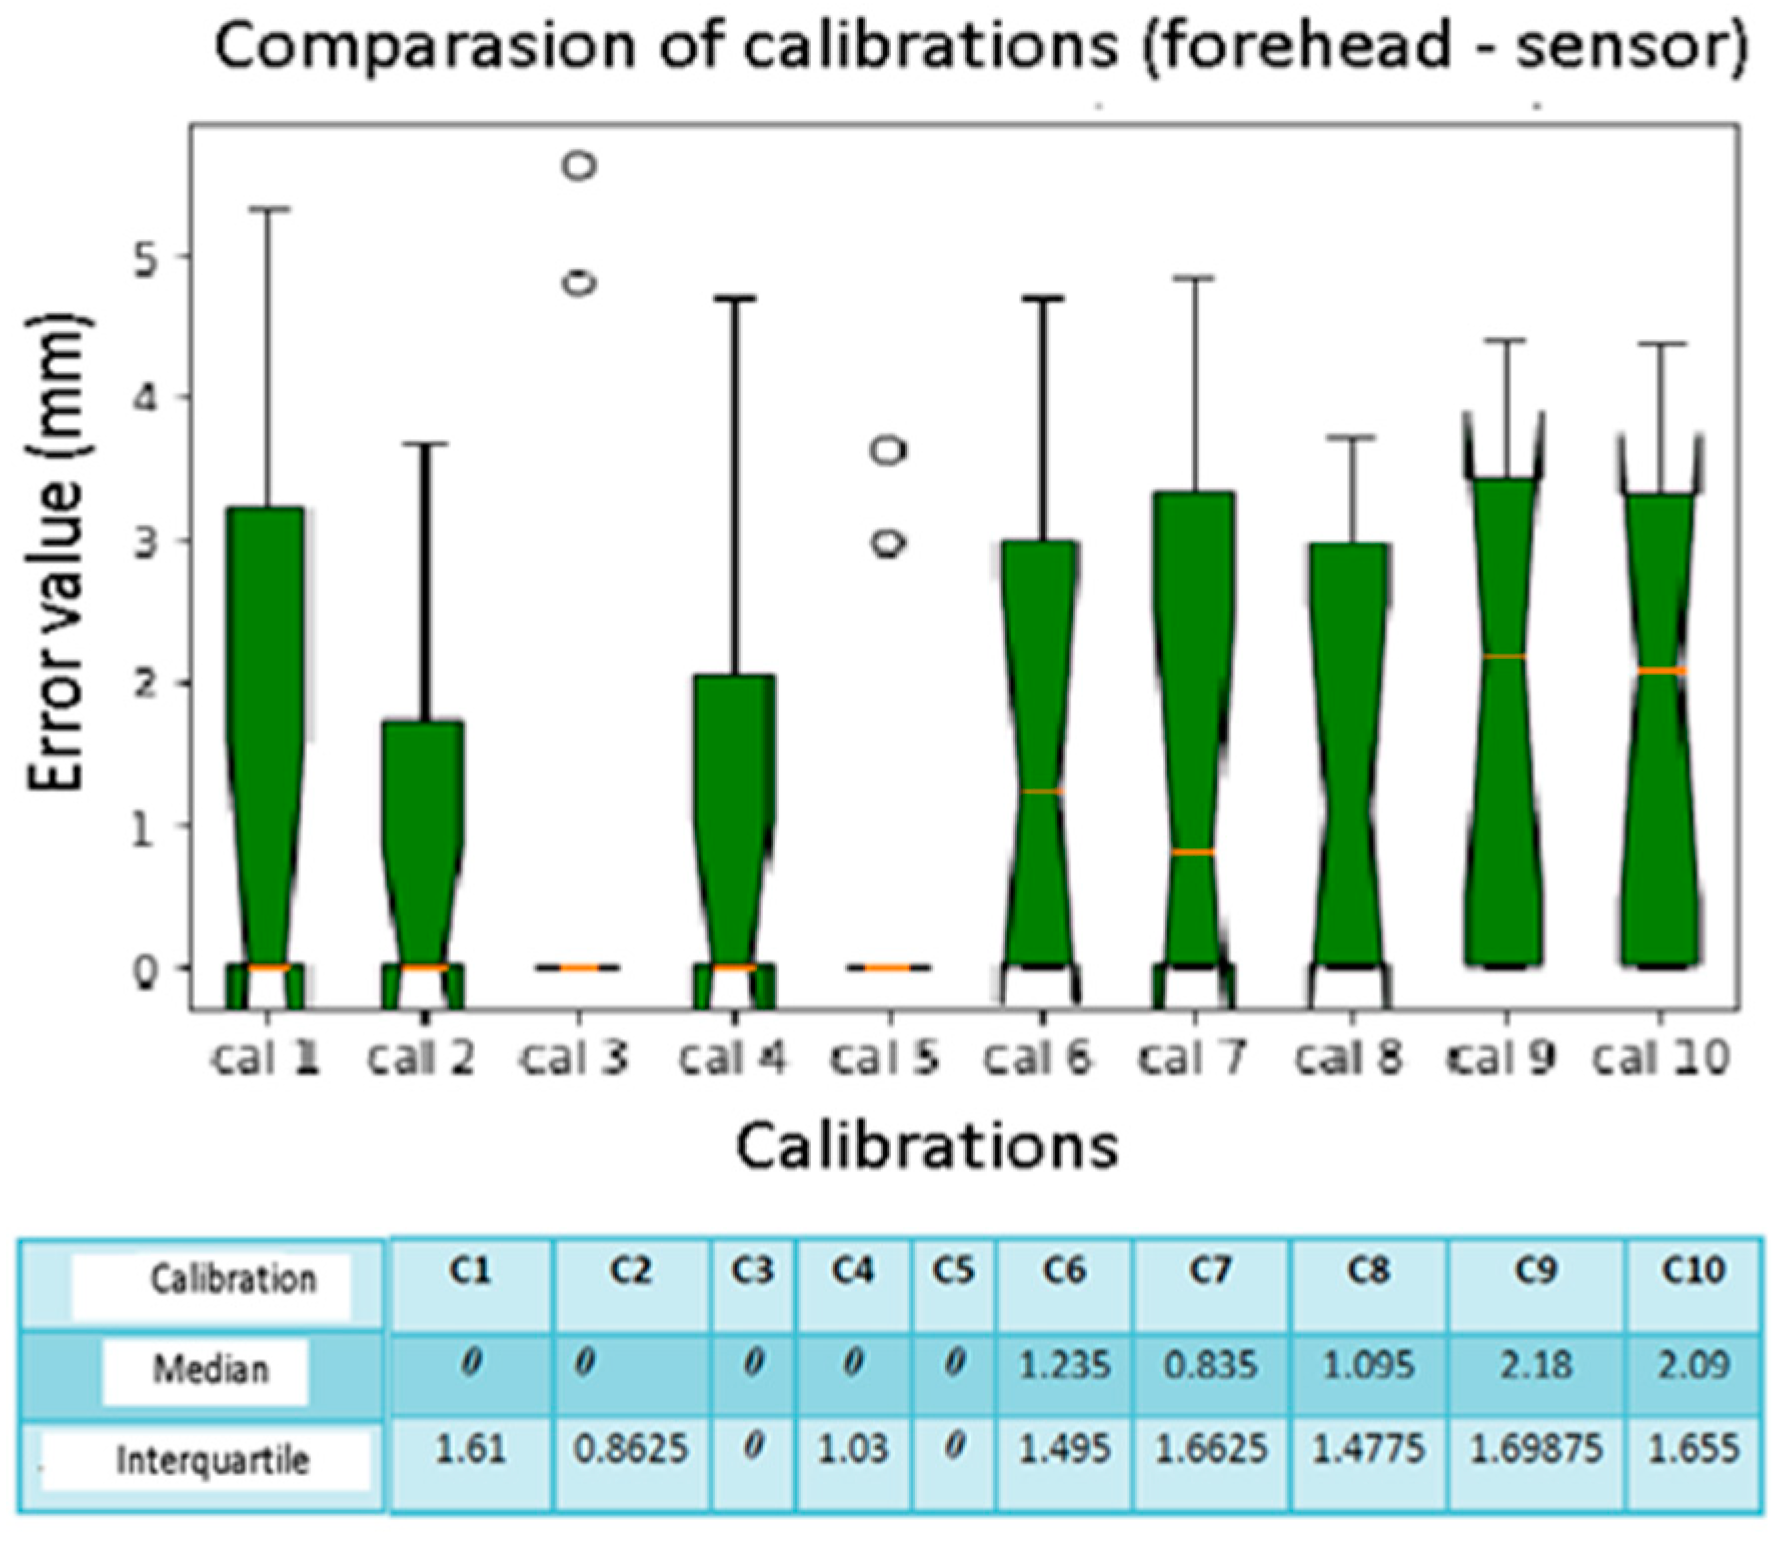
Figure 12.
Box plot sphere location error. The bars indicate the minimum and maximum values of a certain range, without outliers. The orange line indicates the median of the data and gives an idea of the central error trend. Instead, the white bullets indicate the outliers.
Figure 12.
Box plot sphere location error. The bars indicate the minimum and maximum values of a certain range, without outliers. The orange line indicates the median of the data and gives an idea of the central error trend. Instead, the white bullets indicate the outliers.
Figure 13.
Box plot comparison of calibration. The bars indicate the minimum and maximum values of a certain range, without outliers. The orange line indicates the median of the data and gives an idea of the central error trend. Instead, the white bullets indicate the outliers.
Figure 13.
Box plot comparison of calibration. The bars indicate the minimum and maximum values of a certain range, without outliers. The orange line indicates the median of the data and gives an idea of the central error trend. Instead, the white bullets indicate the outliers.
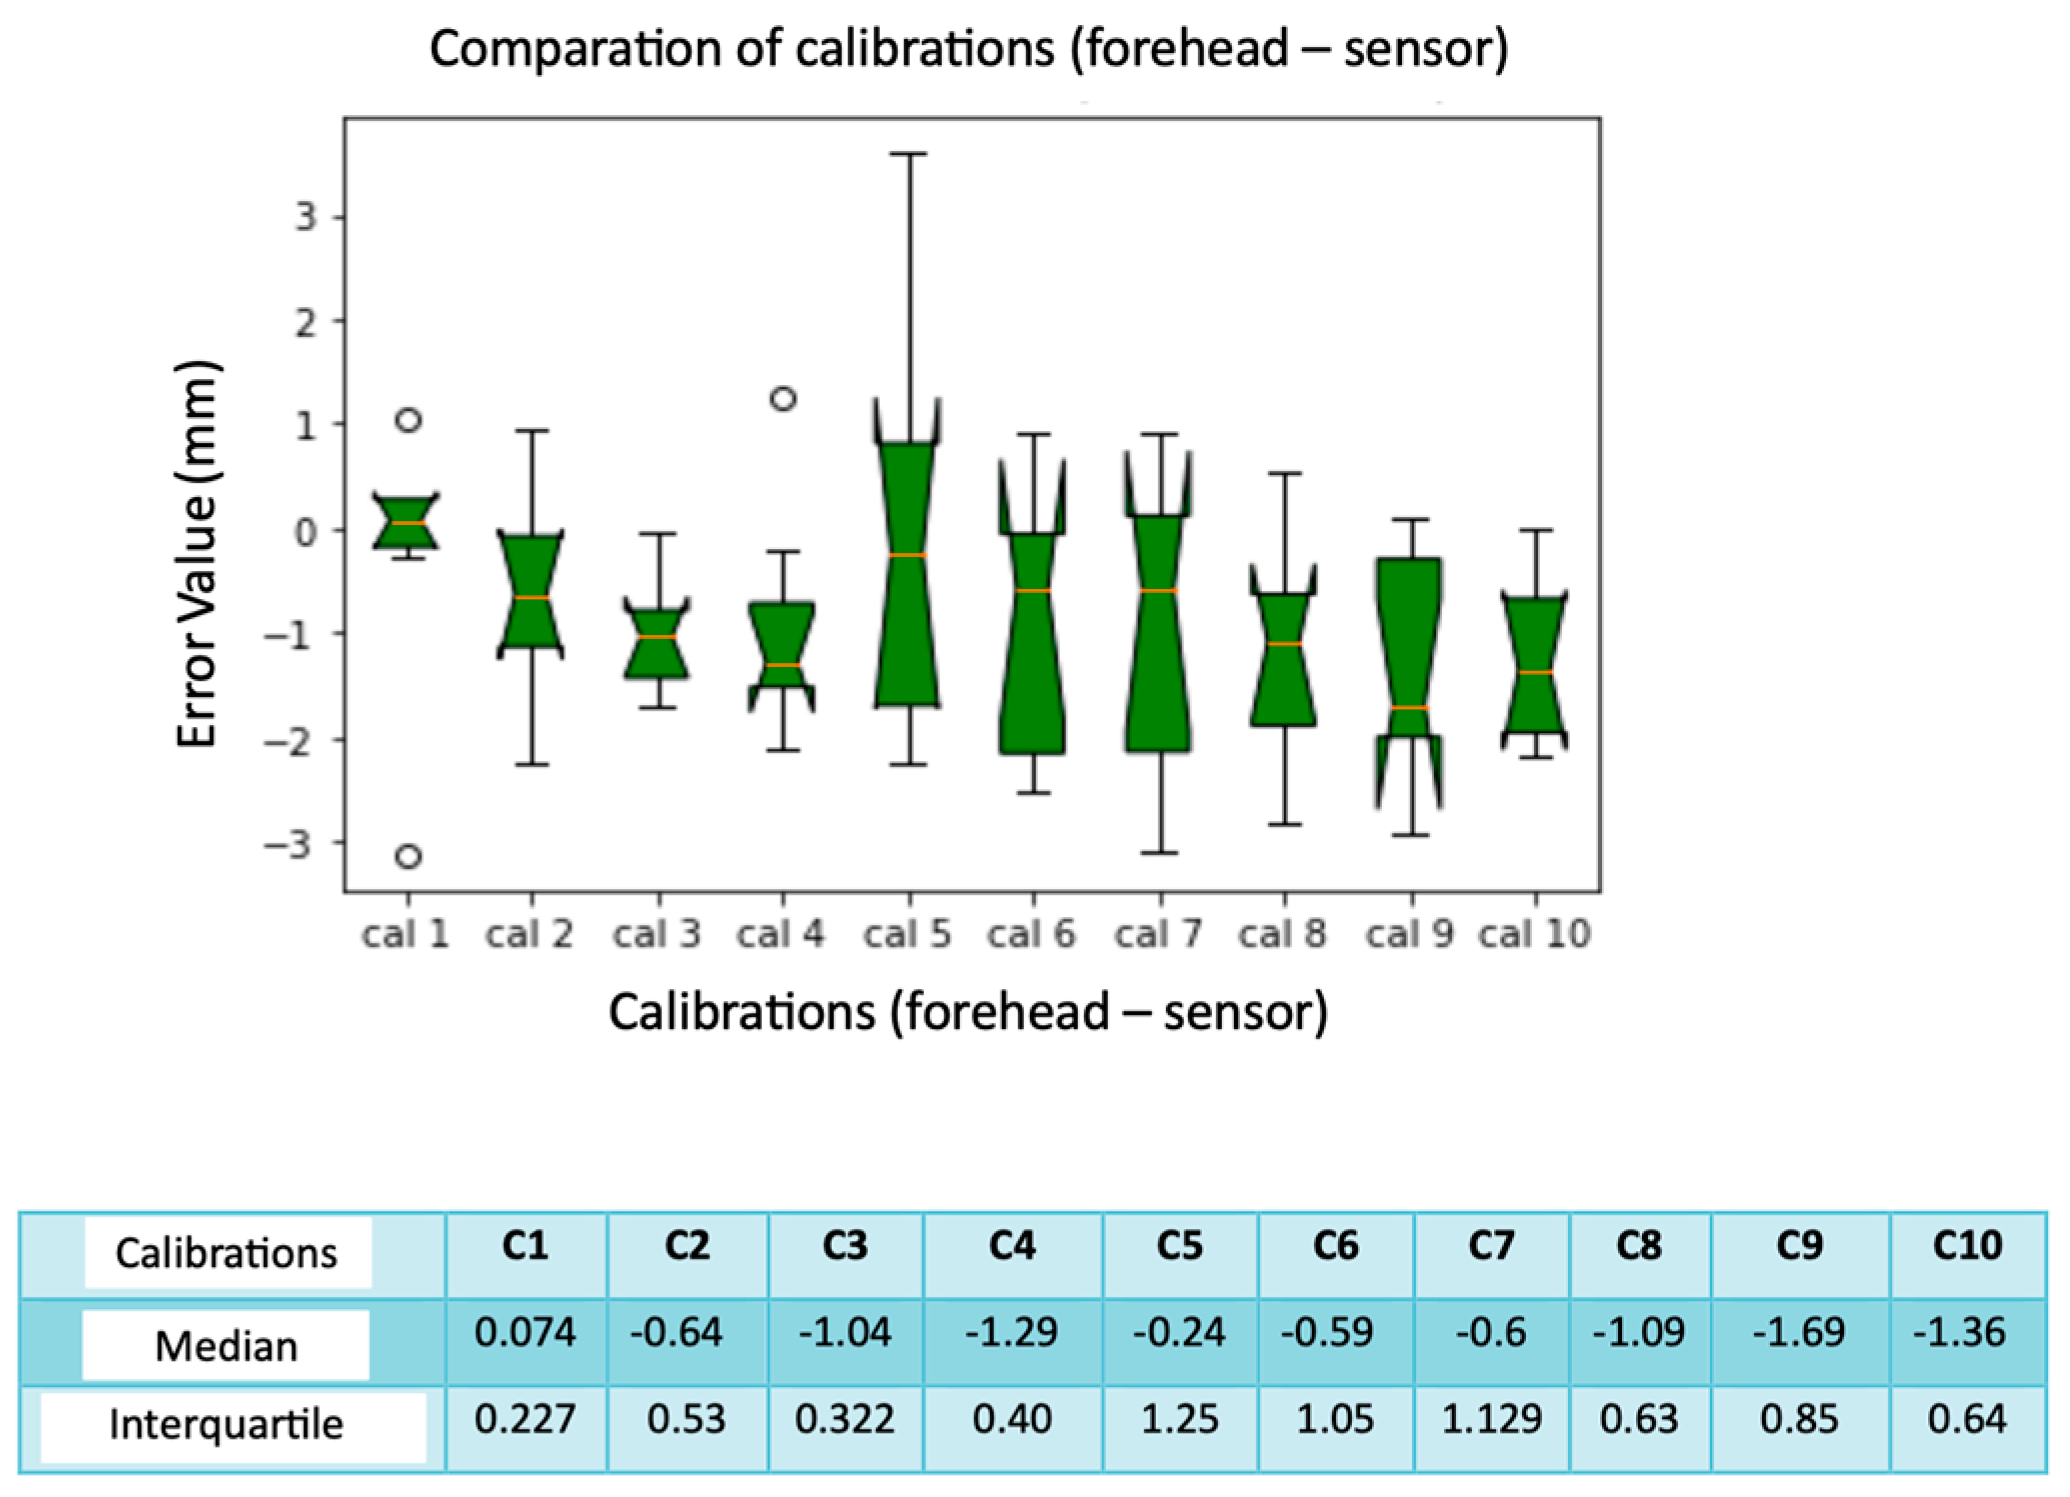
Figure 14.
Box plot sphere location error. The bars indicate the minimum and maximum values of a certain range, without outliers. The orange line indicates the median of the data and gives an idea of the central error trend. Instead, the white bullets indicate the outliers.
Figure 14.
Box plot sphere location error. The bars indicate the minimum and maximum values of a certain range, without outliers. The orange line indicates the median of the data and gives an idea of the central error trend. Instead, the white bullets indicate the outliers.
Figure 15.
Box plot comparison of calibration. The bars indicate the minimum and maximum values of a certain range, without outliers. The orange line indicates the median of the data and gives an idea of the central error trend. Instead, the white bullets indicate the outliers.
Figure 15.
Box plot comparison of calibration. The bars indicate the minimum and maximum values of a certain range, without outliers. The orange line indicates the median of the data and gives an idea of the central error trend. Instead, the white bullets indicate the outliers.
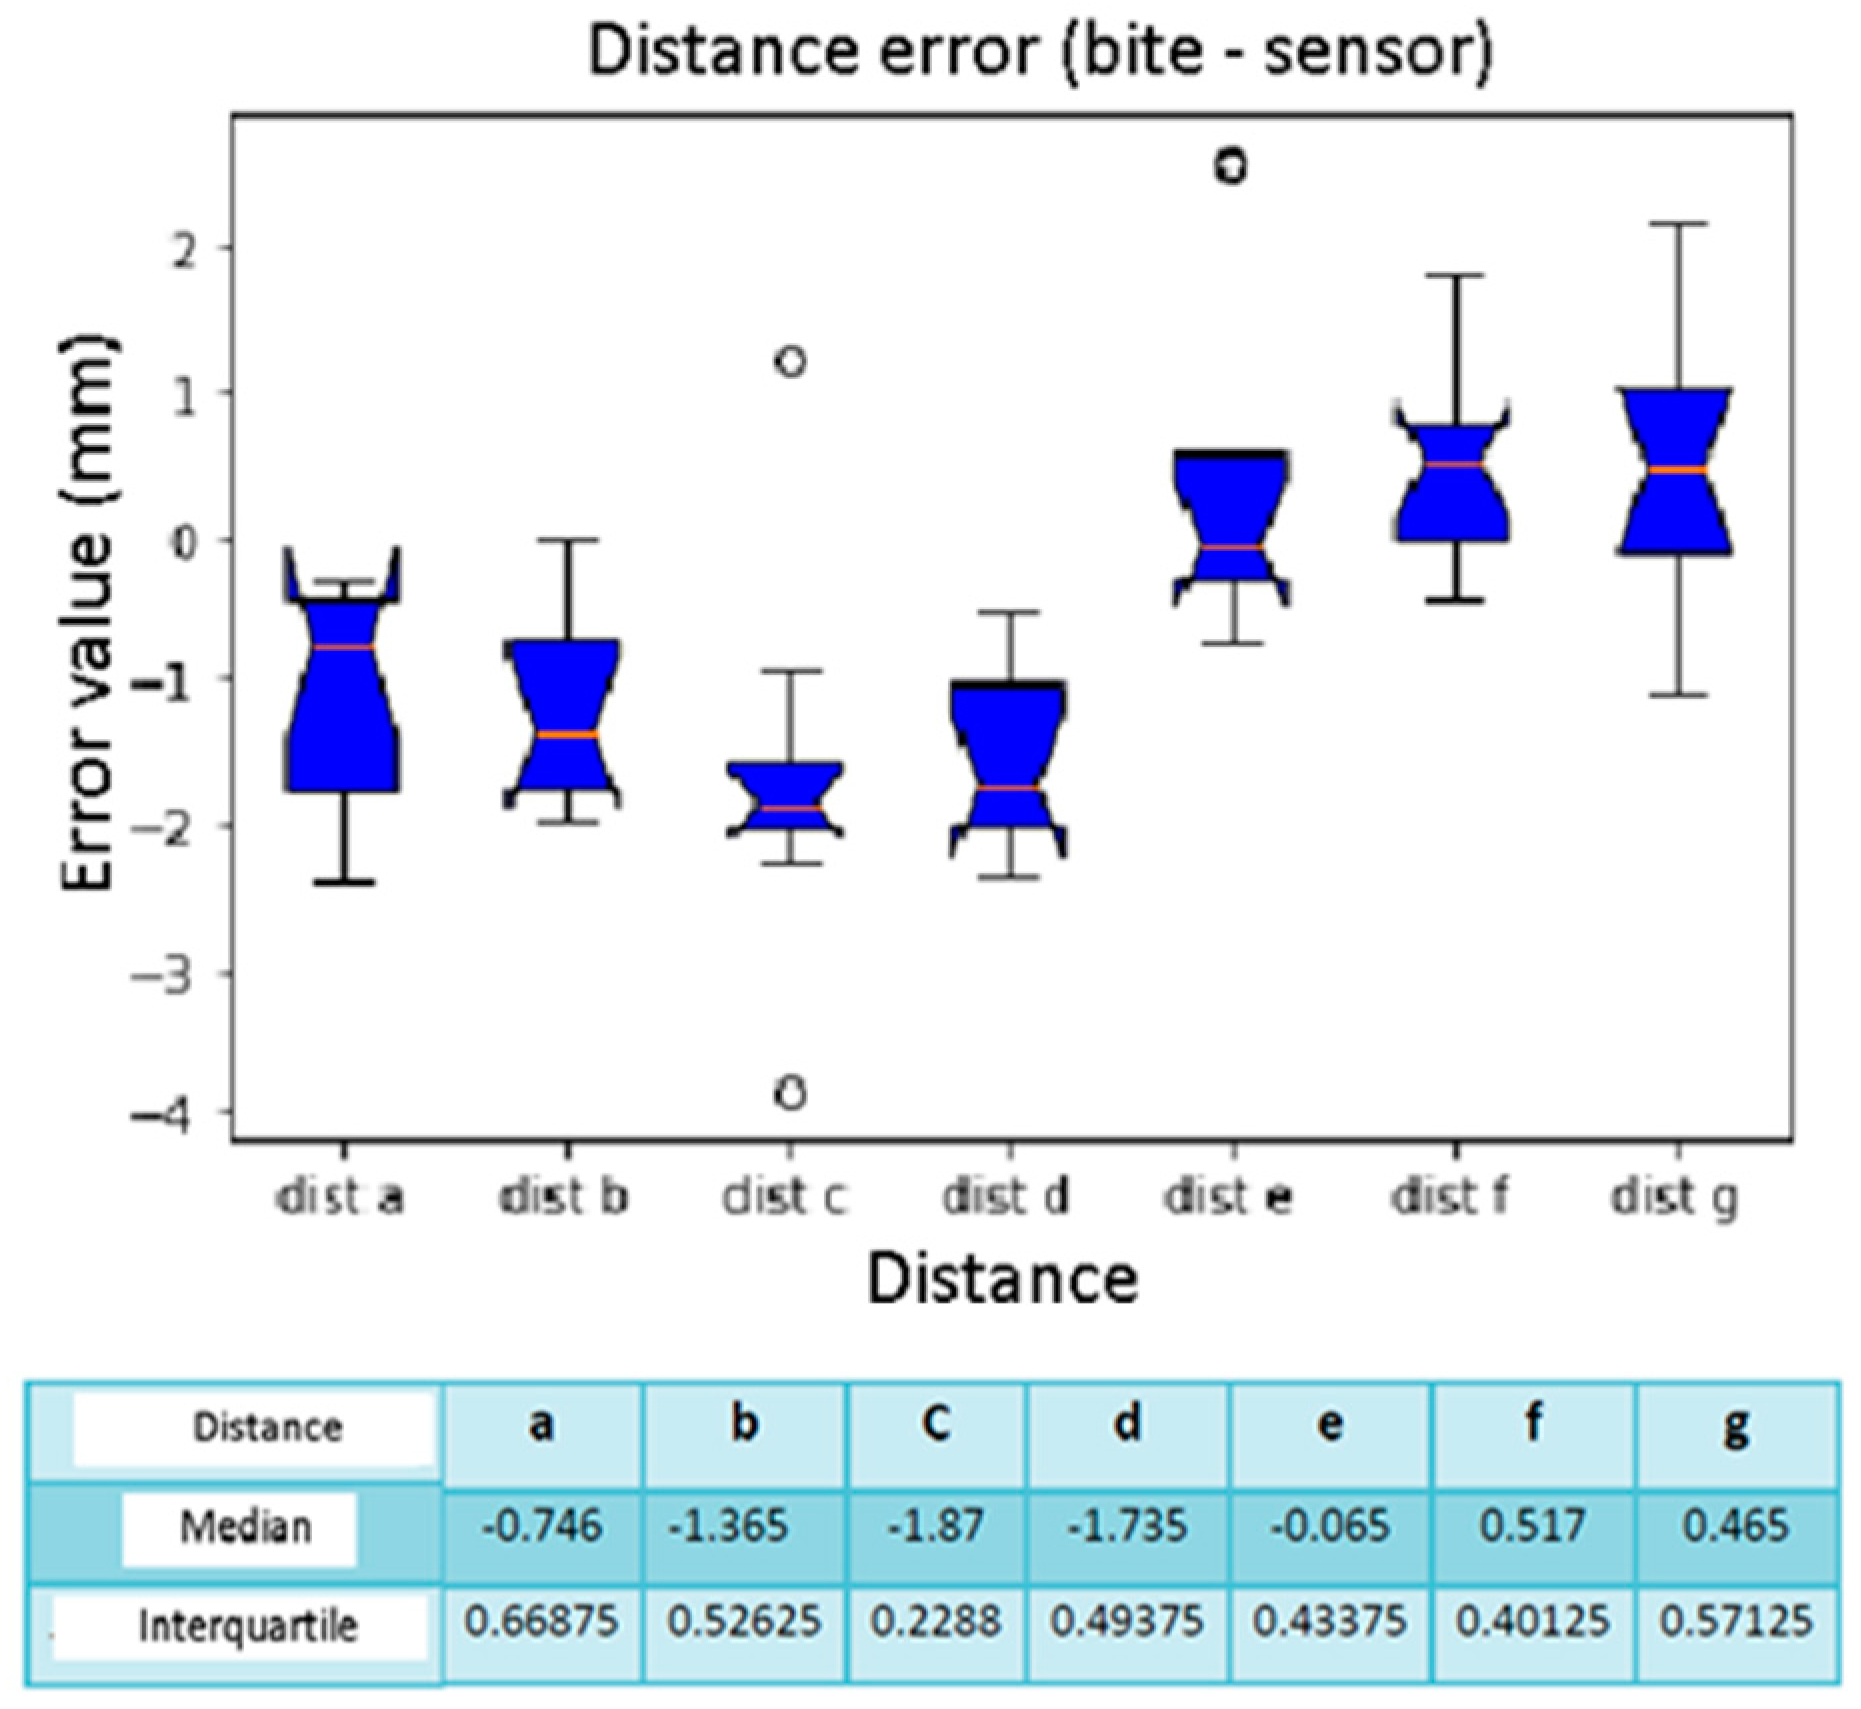
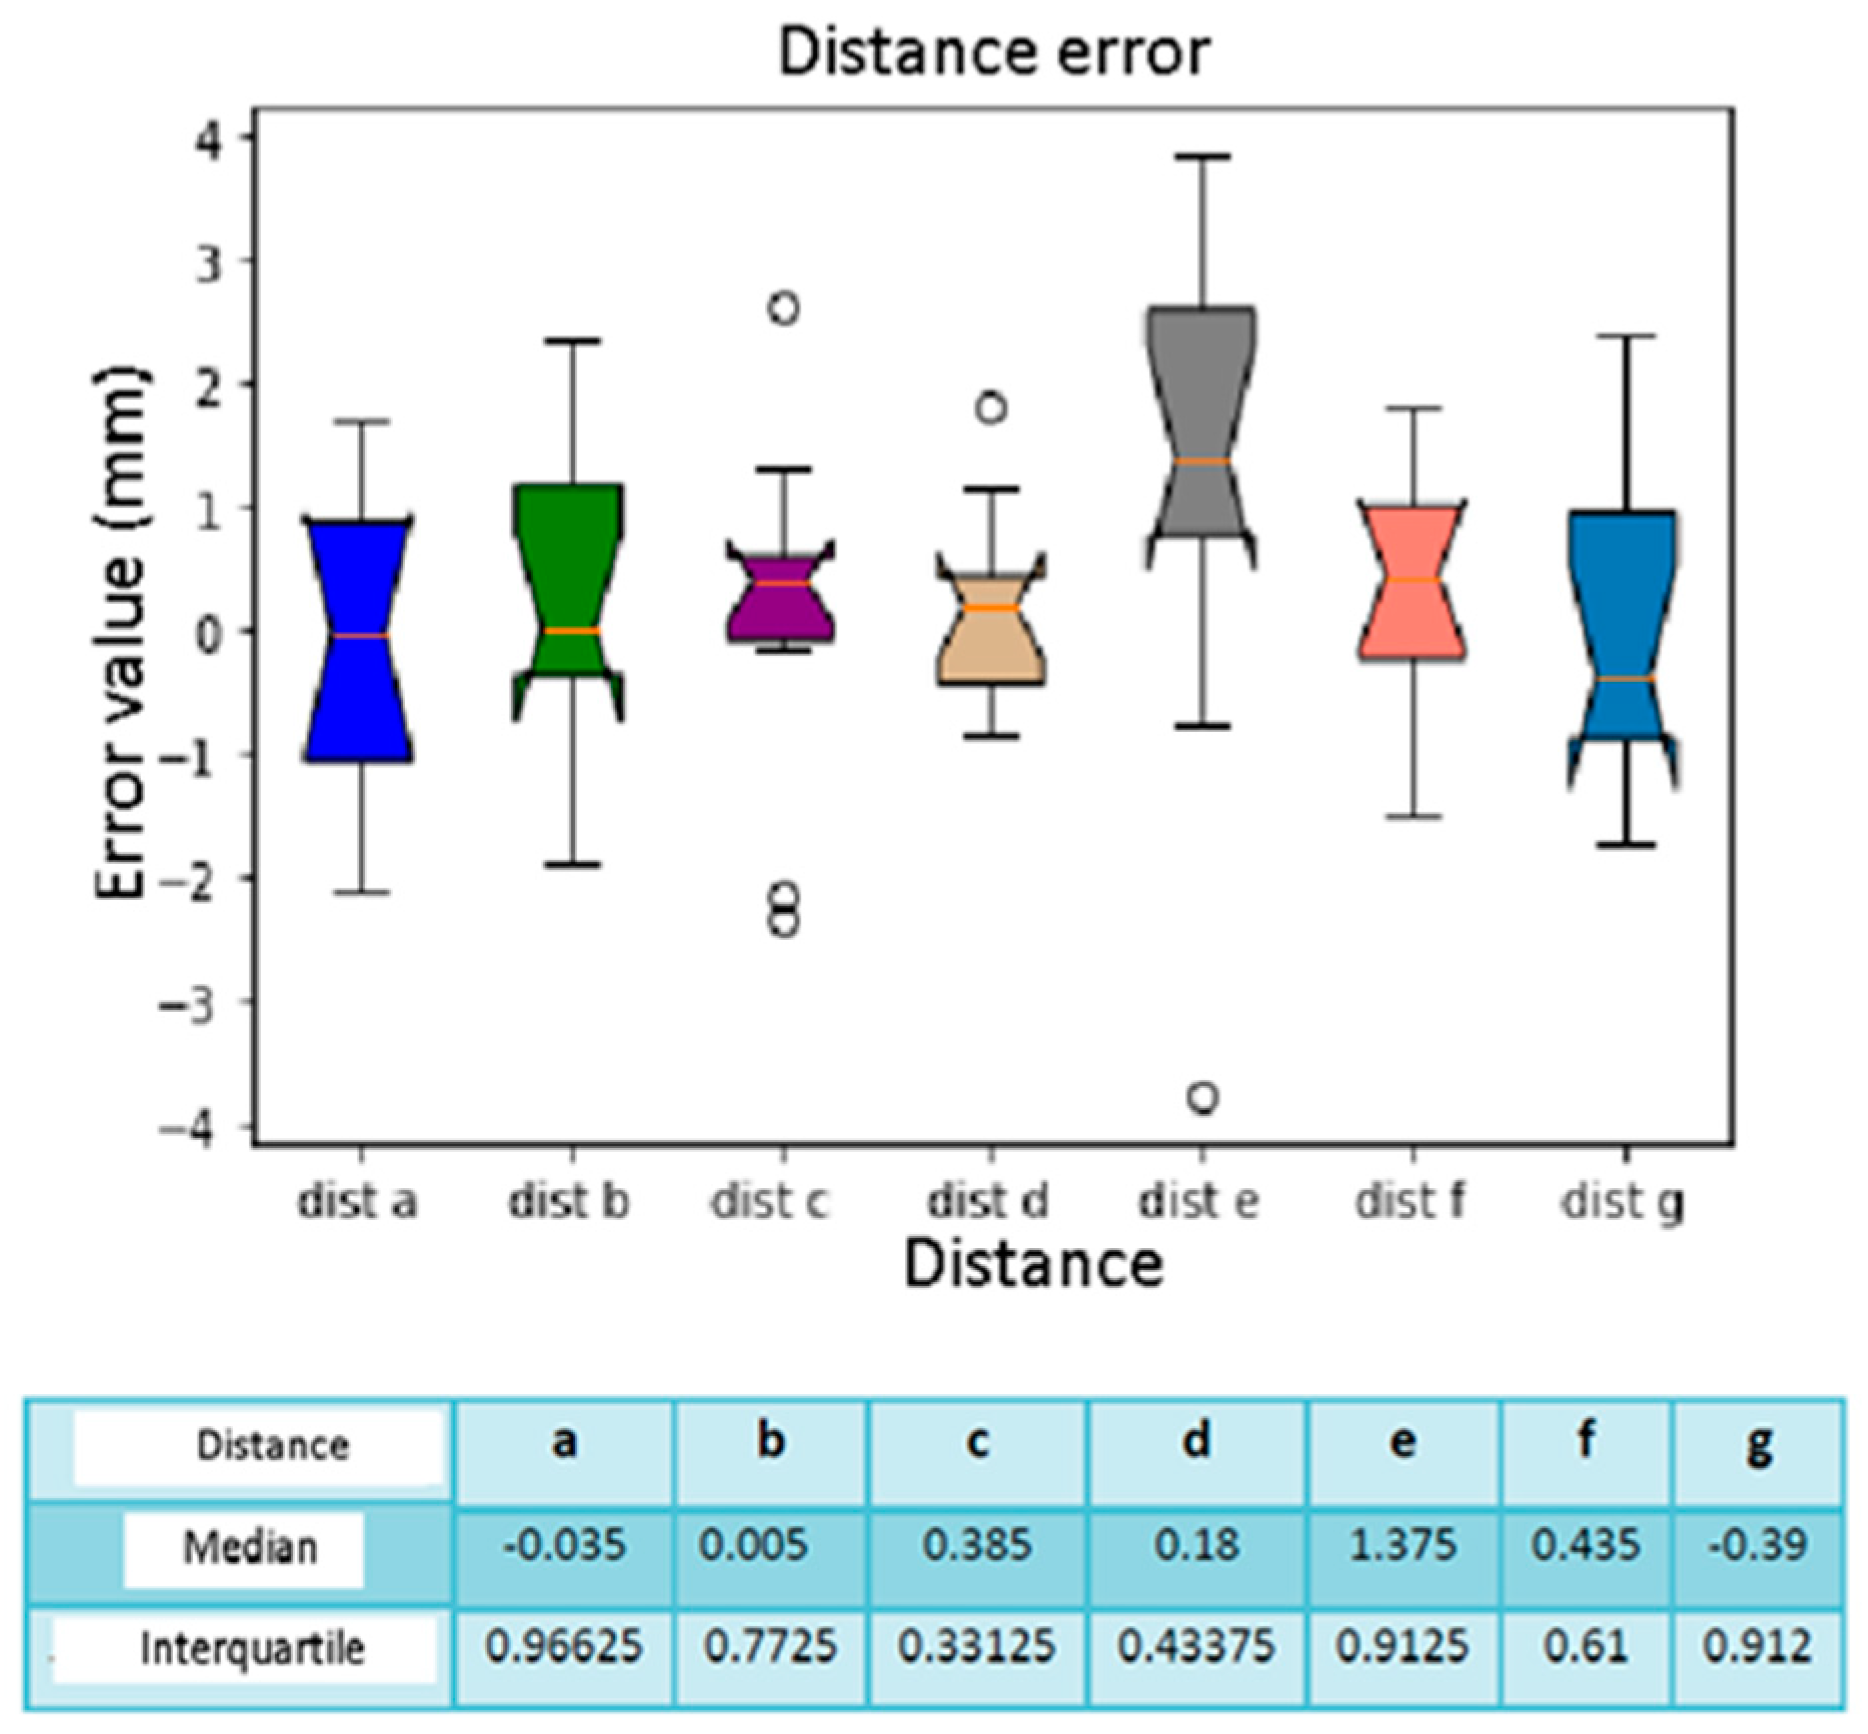
Figure 16.
Box plot distance error. The bars indicate the minimum and maximum values of a certain range, without outliers. The orange line indicates the median of the data and gives an idea of the central error trend. Instead, the white bullets indicate the outliers.
Figure 16.
Box plot distance error. The bars indicate the minimum and maximum values of a certain range, without outliers. The orange line indicates the median of the data and gives an idea of the central error trend. Instead, the white bullets indicate the outliers.
Figure 17.
Box plot comparison of calibration. The bars indicate the minimum and maximum values of a certain range, without outliers. The orange line indicates the median of the data and gives an idea of the central error trend. Instead, the white bullets indicate the outliers.
Figure 17.
Box plot comparison of calibration. The bars indicate the minimum and maximum values of a certain range, without outliers. The orange line indicates the median of the data and gives an idea of the central error trend. Instead, the white bullets indicate the outliers.
Figure 18.
Box plot distance error. The bars indicate the minimum and maximum values of a certain range, without outliers. The orange line indicates the median of the data and gives an idea of the central error trend. Instead, the white bullets indicate the outliers.
Figure 18.
Box plot distance error. The bars indicate the minimum and maximum values of a certain range, without outliers. The orange line indicates the median of the data and gives an idea of the central error trend. Instead, the white bullets indicate the outliers.
Figure 19.
Box plot comparison of calibration. The bars indicate the minimum and maximum values of a certain range, without outliers. The orange line indicates the median of the data and gives an idea of the central error trend. Instead, the white bullets indicate the outliers.
Figure 19.
Box plot comparison of calibration. The bars indicate the minimum and maximum values of a certain range, without outliers. The orange line indicates the median of the data and gives an idea of the central error trend. Instead, the white bullets indicate the outliers.
Figure 20.
Box plot distance error. The bars indicate the minimum and maximum values of a certain range, without outliers. The orange line indicates the median of the data and gives an idea of the central error trend. Instead, the white bullets indicate the outliers.
Figure 20.
Box plot distance error. The bars indicate the minimum and maximum values of a certain range, without outliers. The orange line indicates the median of the data and gives an idea of the central error trend. Instead, the white bullets indicate the outliers.
Figure 21.
Box plot comparison of calibration. The bars indicate the minimum and maximum values of a certain range, without outliers. The orange line indicates the median of the data and gives an idea of the central error trend. Instead, the white bullets indicate the outliers.
Figure 21.
Box plot comparison of calibration. The bars indicate the minimum and maximum values of a certain range, without outliers. The orange line indicates the median of the data and gives an idea of the central error trend. Instead, the white bullets indicate the outliers.
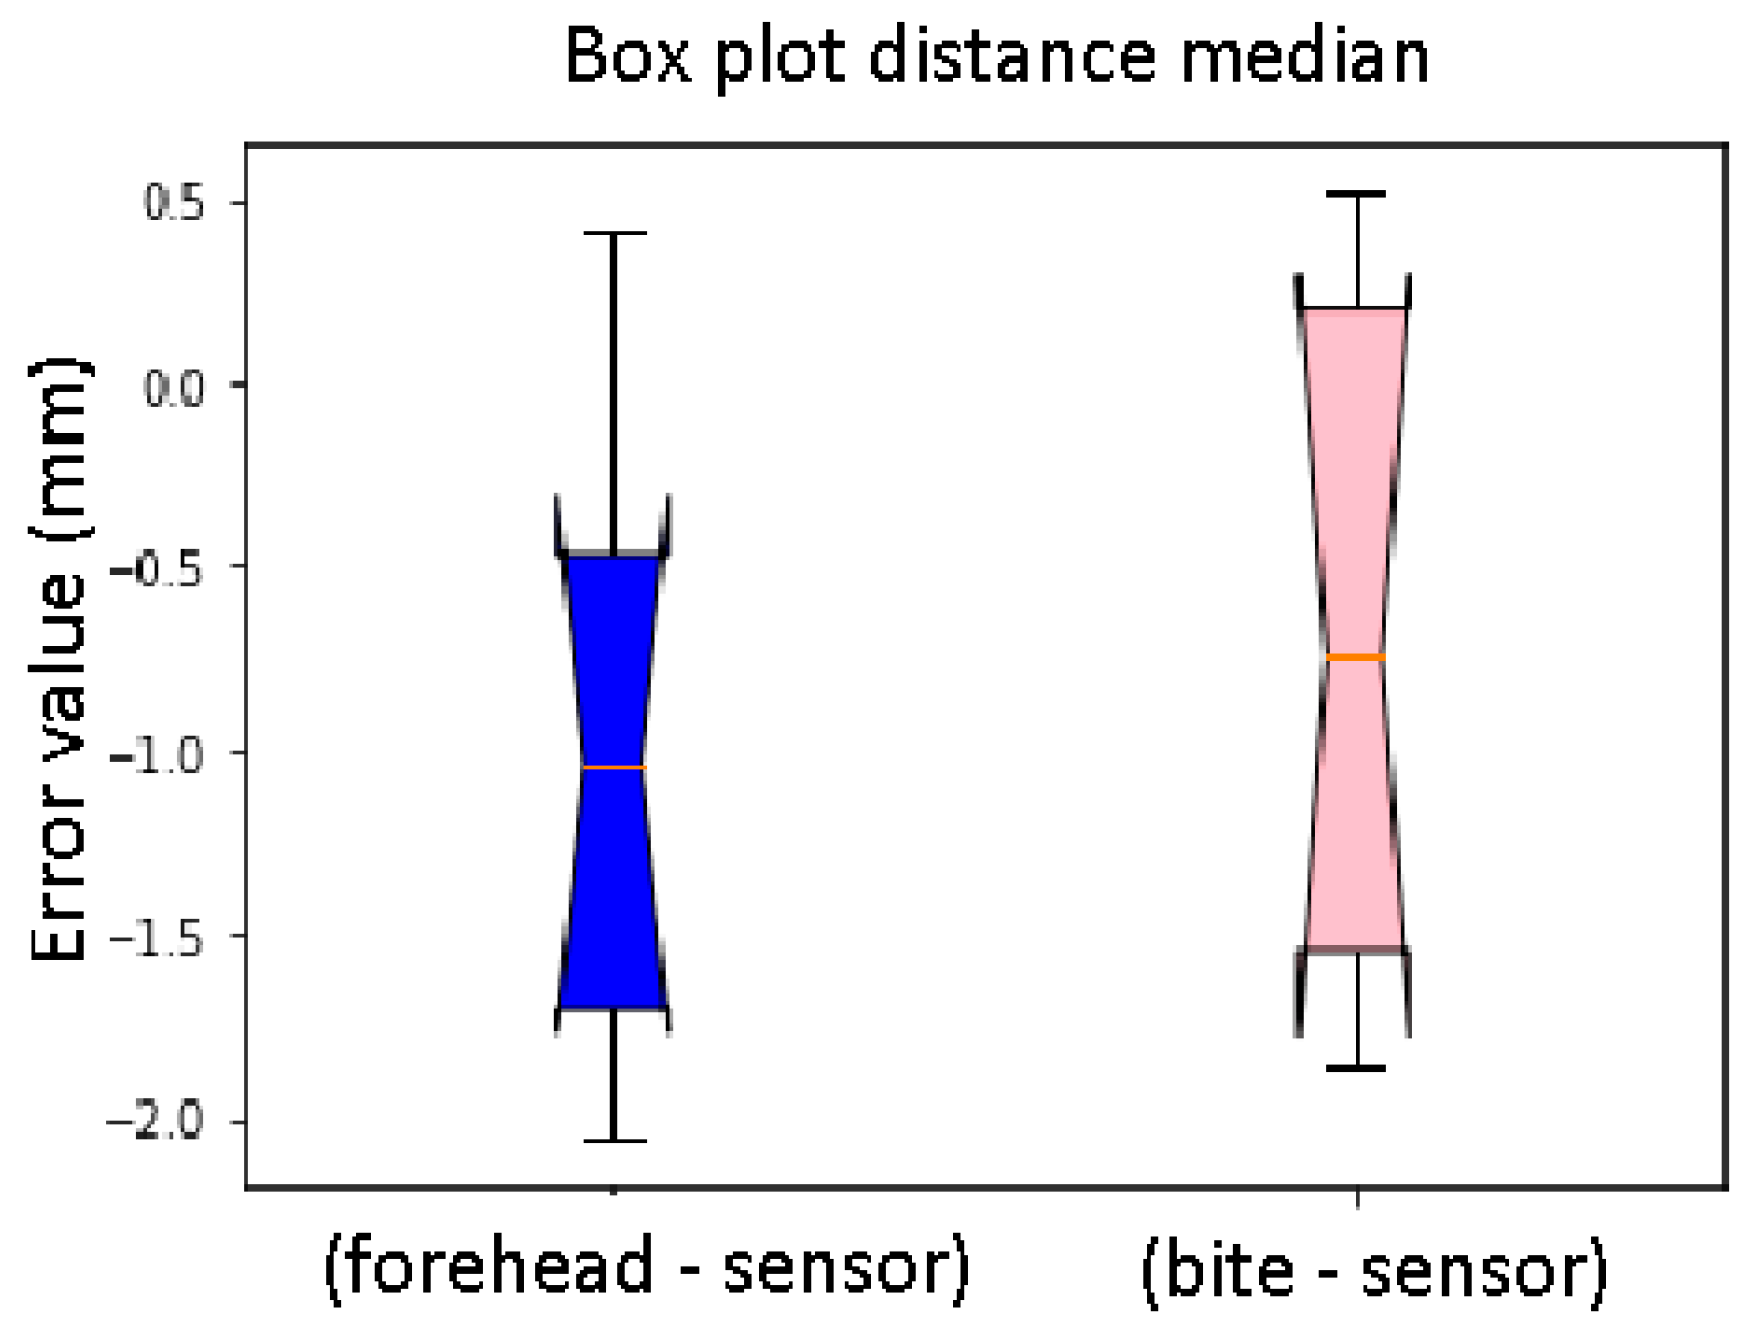
Figure 22.
Box plot distance median. Difference between the sensor on the forehead and the bite support (distance). The bars indicate the minimum and maximum values of a certain range, without outliers. The orange line indicates the median of the data and gives an idea of the central error trend.
Figure 22.
Box plot distance median. Difference between the sensor on the forehead and the bite support (distance). The bars indicate the minimum and maximum values of a certain range, without outliers. The orange line indicates the median of the data and gives an idea of the central error trend.
Figure 23.
Box plot distance sphere median error. Difference between the sensor on the forehead and the bite support (sphere). The bars indicate the minimum and maximum values of a certain range, without outliers. The orange line indicates the median of the data and gives an idea of the central error trend.
Table 1.
Position Error when the sensor is placed on the forehead.
Table 1.
Position Error when the sensor is placed on the forehead.
| Reference Sphere | 1 | 2 | 3 | 4 | 5 | 6 | 7 | 8 | 9 | 10 |
|---|
| Calibration 1 | 0 | 0 | 0 | 3.16 | 5.3 | 0 | 0 | 3.23 | 4.42 | 0 |
| Calibration 2 | 0 | 0 | 0 | 3.1 | 3.67 | 0 | 0 | 0 | 2.3 | 0 |
| Calibration 3 | 0 | 0 | 0 | 5.62 | 4.79 | 0 | 0 | 0 | 0 | 0 |
| Calibration 4 | 0 | 0 | 0 | 4.69 | 2.09 | 1.97 | 0 | 0 | 0 | 3.63 |
| Calibration 5 | 0 | 0 | 0 | 3.63 | 0 | 0 | 0 | 0 | 0 | 2.97 |
| Calibration 6 | 0 | 0 | 0 | 4.7 | 4.14 | 0 | 2.47 | 0 | 3.13 | 2.57 |
| Calibration 7 | 0 | 0 | 0 | 4.84 | 3.55 | 0 | 1.67 | 0 | 2.65 | 3.76 |
| Calibration 8 | 0 | 2.19 | 0 | 2.91 | 3.73 | 0 | 0 | 0 | 3.26 | 2.97 |
| Calibration 9 | 0 | 1.61 | 0 | 3.43 | 4.41 | 0 | 3.3 | 0 | 2.75 | 3.75 |
| Calibration 10 | 0 | 2.51 | 0 | 4.37 | 4.37 | 0 | 1.67 | 0 | 2.56 | 3.56 |
Table 2.
Position Error when the sensor is placed on the bite.
Table 2.
Position Error when the sensor is placed on the bite.
| Reference Sphere | 1 | 2 | 3 | 4 | 5 | 6 | 7 | 8 | 9 | 10 |
|---|
| Calibration 1 | 6.51 | 6.87 | 0 | 0 | 0 | 0 | 2.32 | 0 | 0 | 0 |
| Calibration 2 | 0 | 0 | 0 | 0 | 1.97 | 0 | 0 | 0 | 0 | 0 |
| Calibration 3 | 0 | 0 | 0 | 4.17 | 4.12 | 0 | 2.35 | 0 | 0 | 3.5 |
| Calibration 4 | 0 | 0 | 0 | 4.69 | 0 | 1.97 | 0 | 0 | 0 | 3.63 |
| Calibration 5 | 0 | 0 | 0 | 0 | 0 | 1.99 | 1.88 | 4.21 | 3.95 | 4.51 |
| Calibration 6 | 0 | 0 | 0 | 0 | 3.3 | 0 | 2.65 | 0 | 3.45 | 3.96 |
| Calibration 7 | 0 | 0 | 0 | 0 | 0 | 2.37 | 2.63 | 1.99 | 3.43 | 4.34 |
| Calibration 8 | 0 | 2.72 | 0 | 0 | 2.43 | 0 | 2.01 | 0 | 2.6 | 2.37 |
| Calibration 9 | 0 | 2.29 | 0 | 0 | 2.3 | 3.03 | 2.32 | 4.32 | 4.34 | 3.75 |
| Calibration 10 | 1.56 | 3.2 | 0 | 0 | 2.97 | 3.16 | 2.57 | 4.06 | 4.01 | 5.39 |
Table 3.
Distance measurements when the sensor is placed on the forehead.
Table 3.
Distance measurements when the sensor is placed on the forehead.
| Distance | a | b | c | d | e | f | g |
|---|
| Calibration 1 | 83.19 | 121.89 | 50.53 | 16.06 | 62.5 | 50.51 | 49.96 |
| Calibration 2 | 83.9 | 120.36 | 53.06 | 16.65 | 62.46 | 51.47 | 49.29 |
| Calibration 3 | 84.61 | 119.57 | 52.5 | 17.5 | 63.26 | 52.32 | 50.29 |
| Calibration 4 | 84.82 | 120.25 | 52.9 | 17.27 | 63.46 | 50.29 | 50.44 |
| Calibration 5 | 84.59 | 118.78 | 53.04 | 18.05 | 58.63 | 51.79 | 48.6 |
| Calibration 6 | 83.67 | 121.27 | 52.73 | 18.36 | 61.93 | 52.14 | 49.33 |
| Calibration 7 | 83.69 | 119.36 | 53.07 | 17.99 | 65.33 | 50.65 | 49.58 |
| Calibration 8 | 85.04 | 119.73 | 52.81 | 18.8 | 63.31 | 51.85 | 49.7 |
| Calibration 9 | 83.81 | 120.45 | 53.07 | 17.71 | 65.15 | 51.47 | 50.56 |
| Calibration 10 | 85.26 | 120.68 | 52.16 | 18.17 | 63.26 | 51.55 | 50.56 |
Table 4.
Distance measurements when the sensor is placed on the bite.
Table 4.
Distance measurements when the sensor is placed on the bite.
| Distance | a | b | c | d | e | f | g |
|---|
| Calibration 1 | 85.32 | 119.97 | 52.88 | 16.5 | 61.68 | 50.94 | 50.47 |
| Calibration 2 | 84 | 120.52 | 52.7 | 17.1 | 59.65 | 51.07 | 49.69 |
| Calibration 3 | 83.57 | 118.78 | 54.65 | 18.35 | 62.17 | 51.98 | 48.95 |
| Calibration 4 | 84.59 | 120.25 | 53.01 | 17.27 | 63.16 | 50.29 | 50.11 |
| Calibration 5 | 84.02 | 120.68 | 51.72 | 18.03 | 62.4 | 50.57 | 49.86 |
| Calibration 6 | 84.9 | 118.94 | 52.67 | 17.93 | 62.72 | 51.57 | 49.62 |
| Calibration 7 | 83.66 | 119.31 | 52.66 | 17.6 | 62.94 | 51.59 | 51.3 |
| Calibration 8 | 85.66 | 120.53 | 52.35 | 16.99 | 61.65 | 50.73 | 50.08 |
| Calibration 9 | 85.1 | 120.22 | 52.46 | 16.57 | 62.51 | 51 | 51.31 |
| Calibration 10 | 83.57 | 120.72 | 49.57 | 17.83 | 62.53 | 49.74 | 49.1 |
Table 5.
Distance measurements with 3D Slicer software.
Table 5.
Distance measurements with 3D Slicer software.
| Distance | a | b | c | d | e | f | g |
|---|
| Measure 1 | 82.82 | 118.7 | 51 | 15.9 | 61.8 | 52.4 | 50.06 |
| Measure 2 | 83.7 | 118.8 | 51.4 | 16.3 | 61.4 | 52.5 | 50.02 |
| Measure 3 | 82.9 | 119.2 | 51 | 15.9 | 63 | 51.4 | 51 |
| Measure 4 | 83.3 | 118.4 | 50.5 | 16.3 | 62.3 | 50.06 | 50.05 |
| Measure 5 | 83.6 | 118.7 | 50.09 | 15.5 | 62.6 | 51.4 | 50.7 |
| Average | 83.264 | 118.76 | 50.798 | 15.98 | 62.22 | 51.552 | 50.24 |
Table 6.
Registration error: sensor on the forehead.
Table 6.
Registration error: sensor on the forehead.
| Distance | a | b | c | d | e | f | g |
|---|
| Calibration 1 | 0.074 | −3.13 | 0.268 | −0.08 | −0.28 | 1.042 | 0.28 |
| Calibration 2 | −0.636 | −1.6 | −2.262 | −0.67 | −0.24 | 0.082 | 0.95 |
| Calibration 3 | −1.346 | −0.81 | −1.702 | −1.52 | −1.04 | −0.768 | −0.05 |
| Calibration 4 | −1.556 | −1.49 | −2.102 | −1.29 | −1.24 | 1.262 | −0.2 |
| Calibration 5 | −1.326 | −0.02 | −2.242 | −2.07 | 3.59 | −0.238 | 1.64 |
| Calibration 6 | −0.406 | −2.51 | −1.932 | −2.38 | 0.29 | −0.588 | 0.91 |
| Calibration 7 | −0.426 | −0.6 | −2.272 | −2.01 | −3.11 | 0.902 | 0.66 |
| Calibration 8 | −1.766 | −0.97 | −2.012 | −2.82 | −1.09 | −0.298 | 0.54 |
| Calibration 9 | −0.546 | −1.69 | −2.272 | −1.73 | −2.93 | 0.082 | −0.32 |
| Calibration 10 | −1.996 | −1.92 | −1.362 | −2.19 | −1.04 | 0.002 | −0.32 |
Table 7.
Registration error: sensor on the bite support.
Table 7.
Registration error: sensor on the bite support.
| Distance | a | b | c | d | e | f | g |
|---|
| Calibration 1 | −2.056 | −1.21 | −2.082 | −0.52 | 0.54 | 0.612 | −0.23 |
| Calibration 2 | −0.736 | −1.76 | −1.902 | −1.12 | 2.57 | 0.482 | 0.55 |
| Calibration 3 | −0.306 | −0.02 | −3.852 | −2.37 | 0.05 | −0.428 | 1.29 |
| Calibration 4 | −1.326 | −1.49 | −2.242 | −1.29 | −1.24 | 1.262 | −0.2 |
| Calibration 5 | −0.756 | −1.92 | −0.922 | −2.05 | −0.18 | 0.982 | 0.38 |
| Calibration 6 | −1.636 | −0.18 | −1.872 | −1.95 | −0.5 | −0.018 | 0.62 |
| Calibration 7 | −0.396 | −0.55 | −1.862 | −1.62 | −0.72 | −0.038 | −1.06 |
| Calibration 8 | −2.396 | −1.77 | −1.552 | −1.01 | 0.57 | 0.822 | 0.16 |
| Calibration 9 | −1.836 | −1.46 | −1.662 | −0.59 | −0.29 | 0.552 | −1.07 |
| Calibration 10 | −0.306 | −1.96 | 1.228 | −1.85 | −0.31 | 1.812 | 1.14 |
Table 8.
Distance error between the sensor on the forehead and the bite support.
Table 8.
Distance error between the sensor on the forehead and the bite support.
| Distance | a | b | c | d | e | f | g |
|---|
| Calibration 1 | −2.3 | 1.92 | −2.35 | −0.44 | 0.82 | −0.43 | −0.51 |
| Calibration 2 | −0.1 | −0.16 | 0.36 | −0.45 | 2.81 | 0.4 | −0.4 |
| Calibration 3 | 1.04 | −0.46 | −2.15 | −0.85 | 1.09 | 0.34 | 1.34 |
| Calibration 4 | 0.95 | 1.47 | −0.14 | −0.79 | 3.83 | −1.5 | 2.38 |
| Calibration 5 | 0.57 | −1.9 | 1.32 | 0.02 | −3.77 | 1.22 | −1.26 |
| Calibration 6 | −1.23 | 2.33 | 0.06 | 0.43 | −0.79 | 0.57 | −0.29 |
| Calibration 7 | 0.03 | 0.05 | 0.41 | 0.39 | 2.39 | −0.94 | −1.72 |
| Calibration 8 | −0.62 | −0.8 | 0.46 | 1.81 | 1.66 | 1.12 | −0.38 |
| Calibration 9 | −1.29 | 0.23 | 0.61 | 1.14 | 2.64 | 0.47 | −1.02 |
| Calibration 10 | 1.69 | −0.04 | 2.59 | 0.34 | 0.73 | 1.81 | 1.46 |
