

Supervised Machine Learning Methods for Seasonal Influenza Diagnosis

 ,
,
Abstract
:1. Introduction
2. Materials and Methods
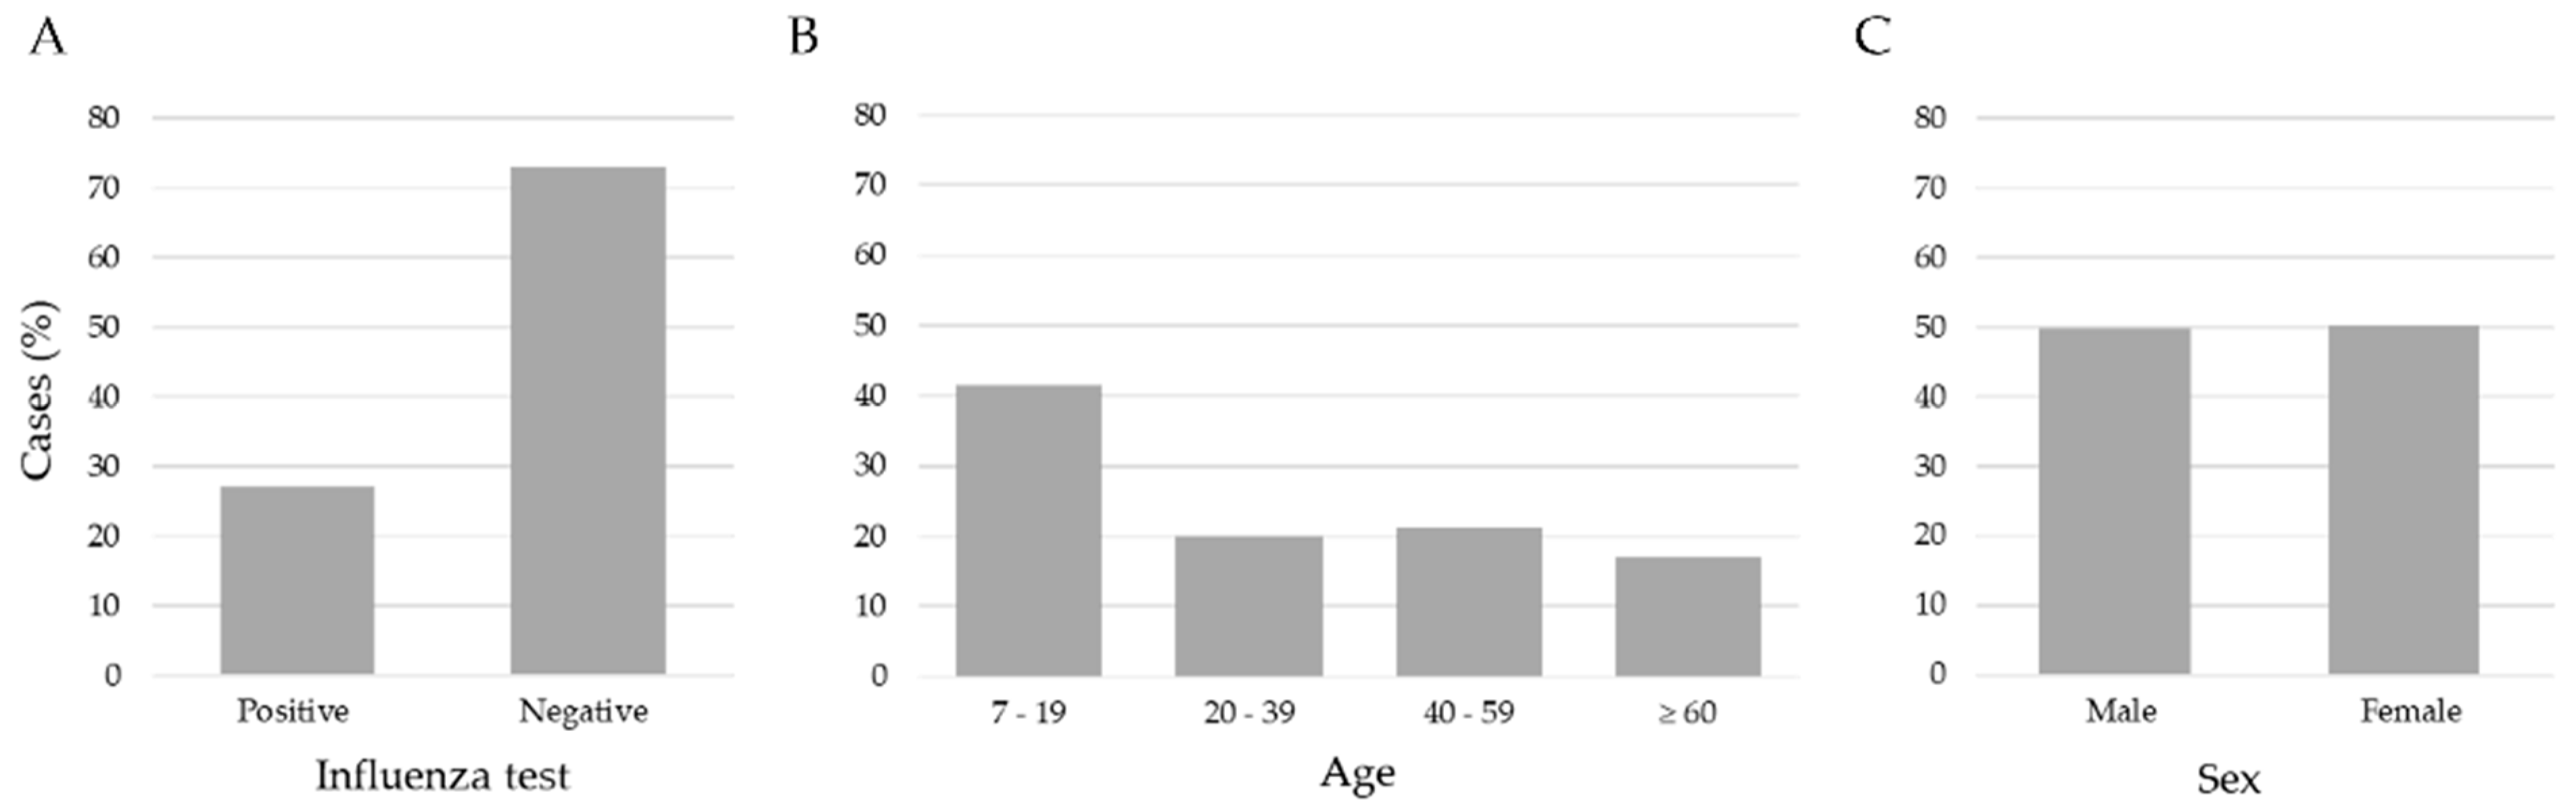
2.1. Data Set
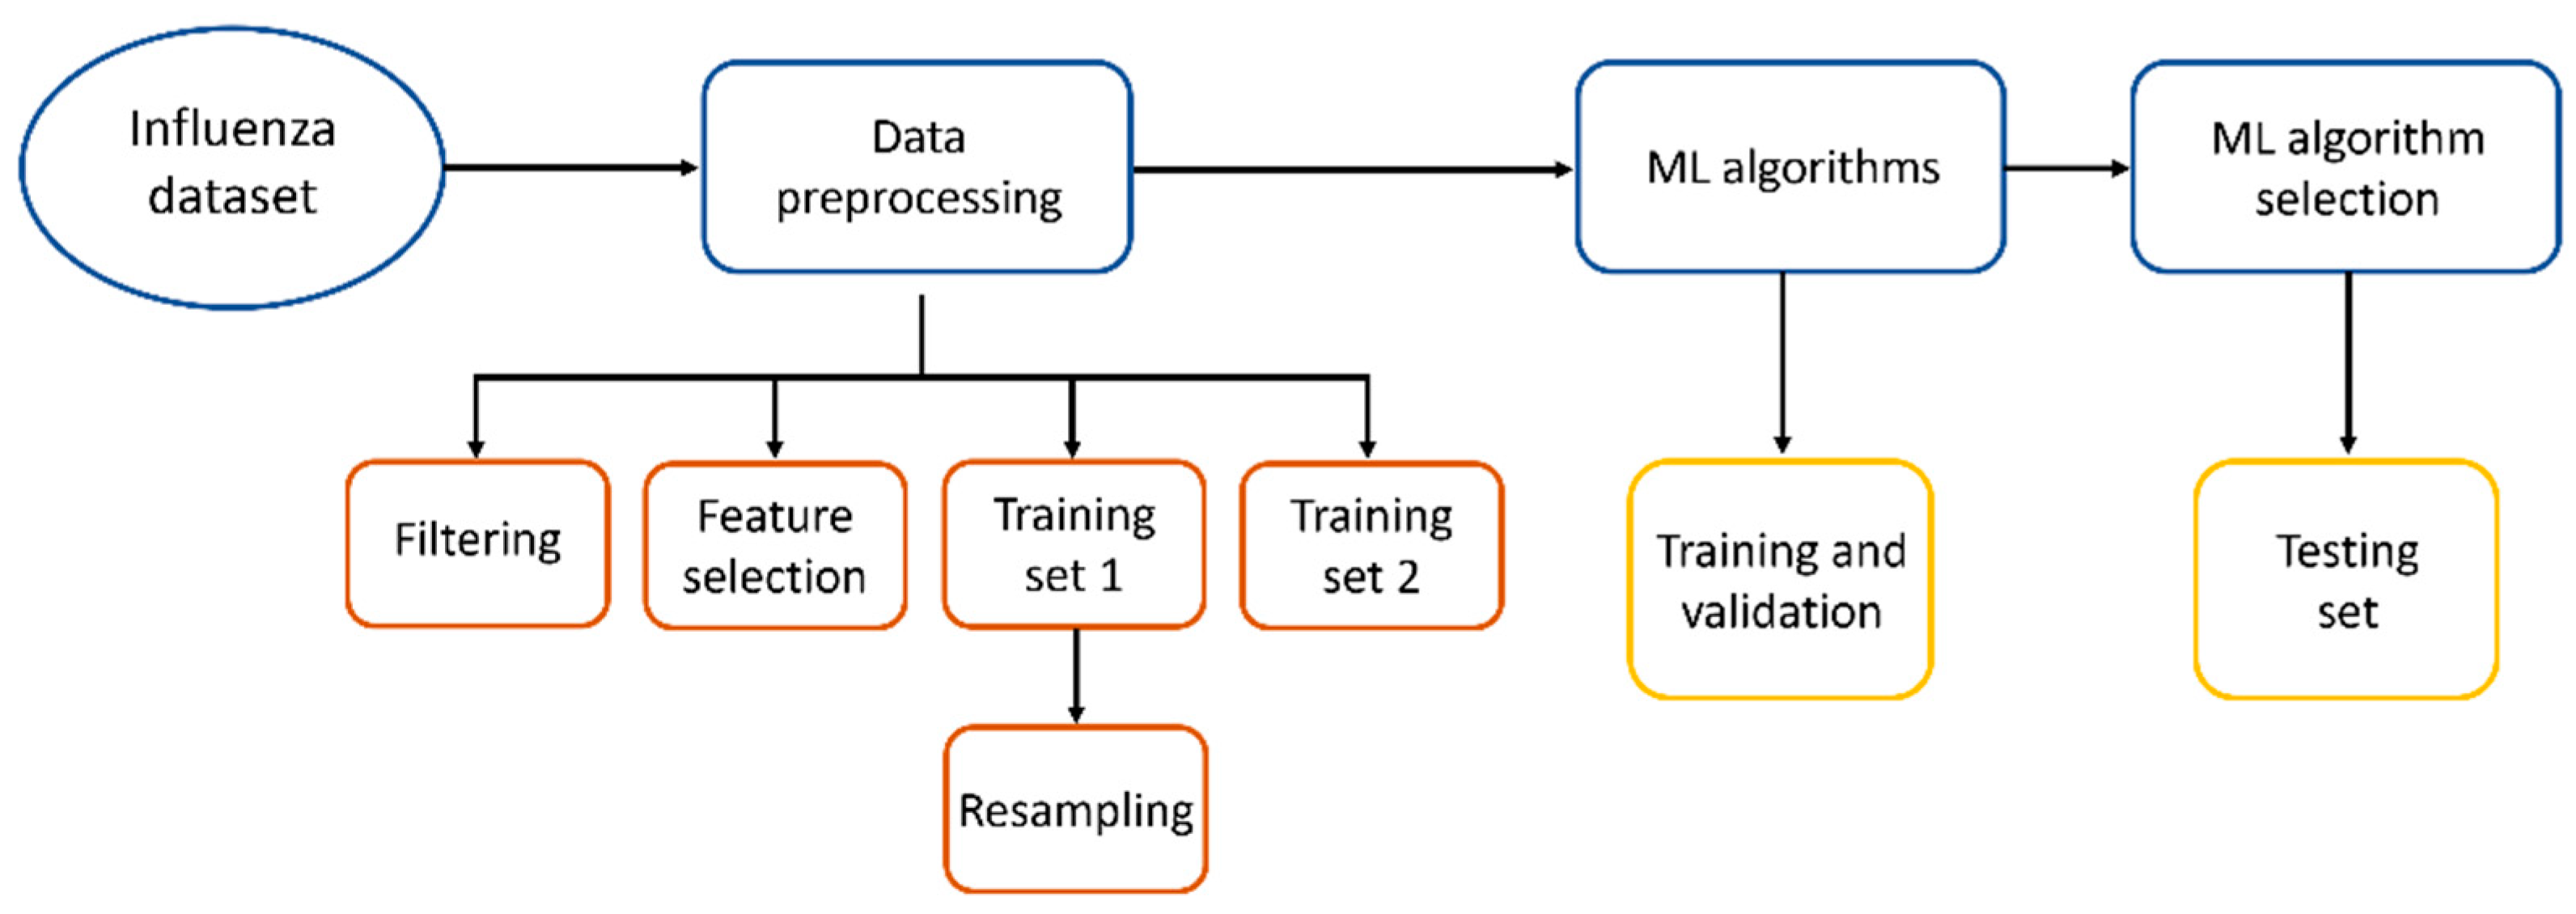
2.2. Data Preprocessing
2.3. Machine Learning Algorithms
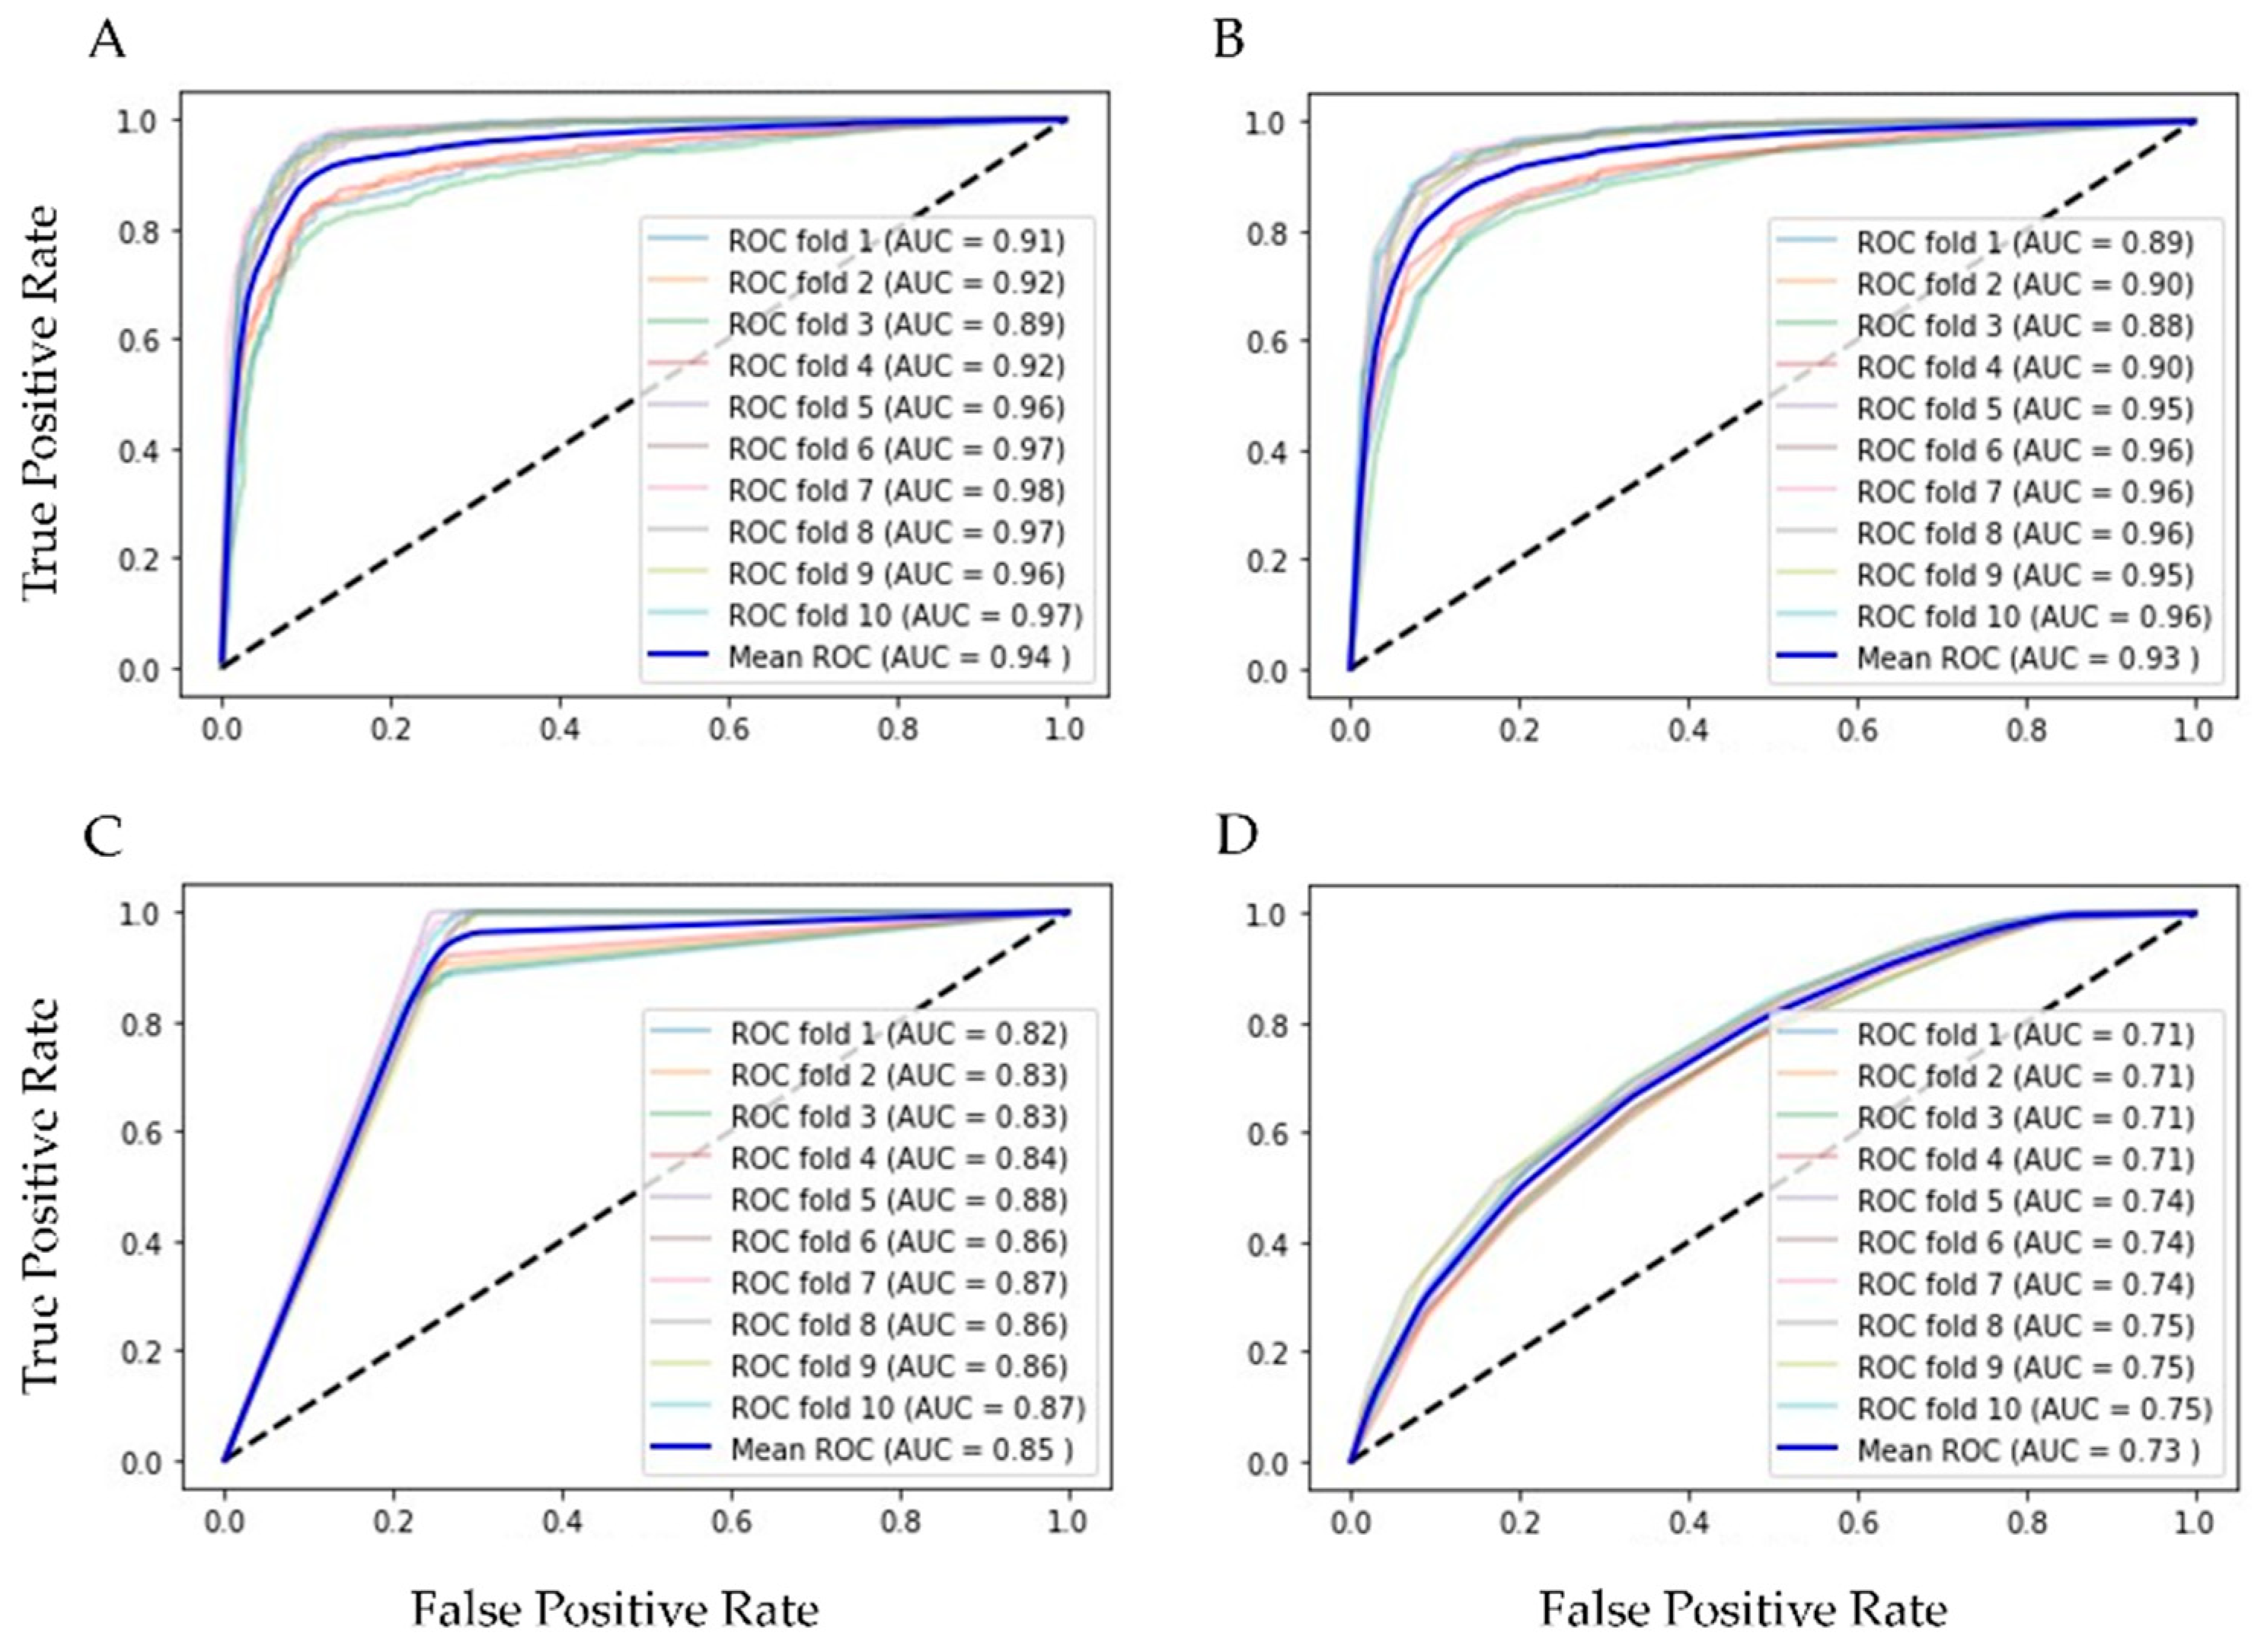
2.4. Validation
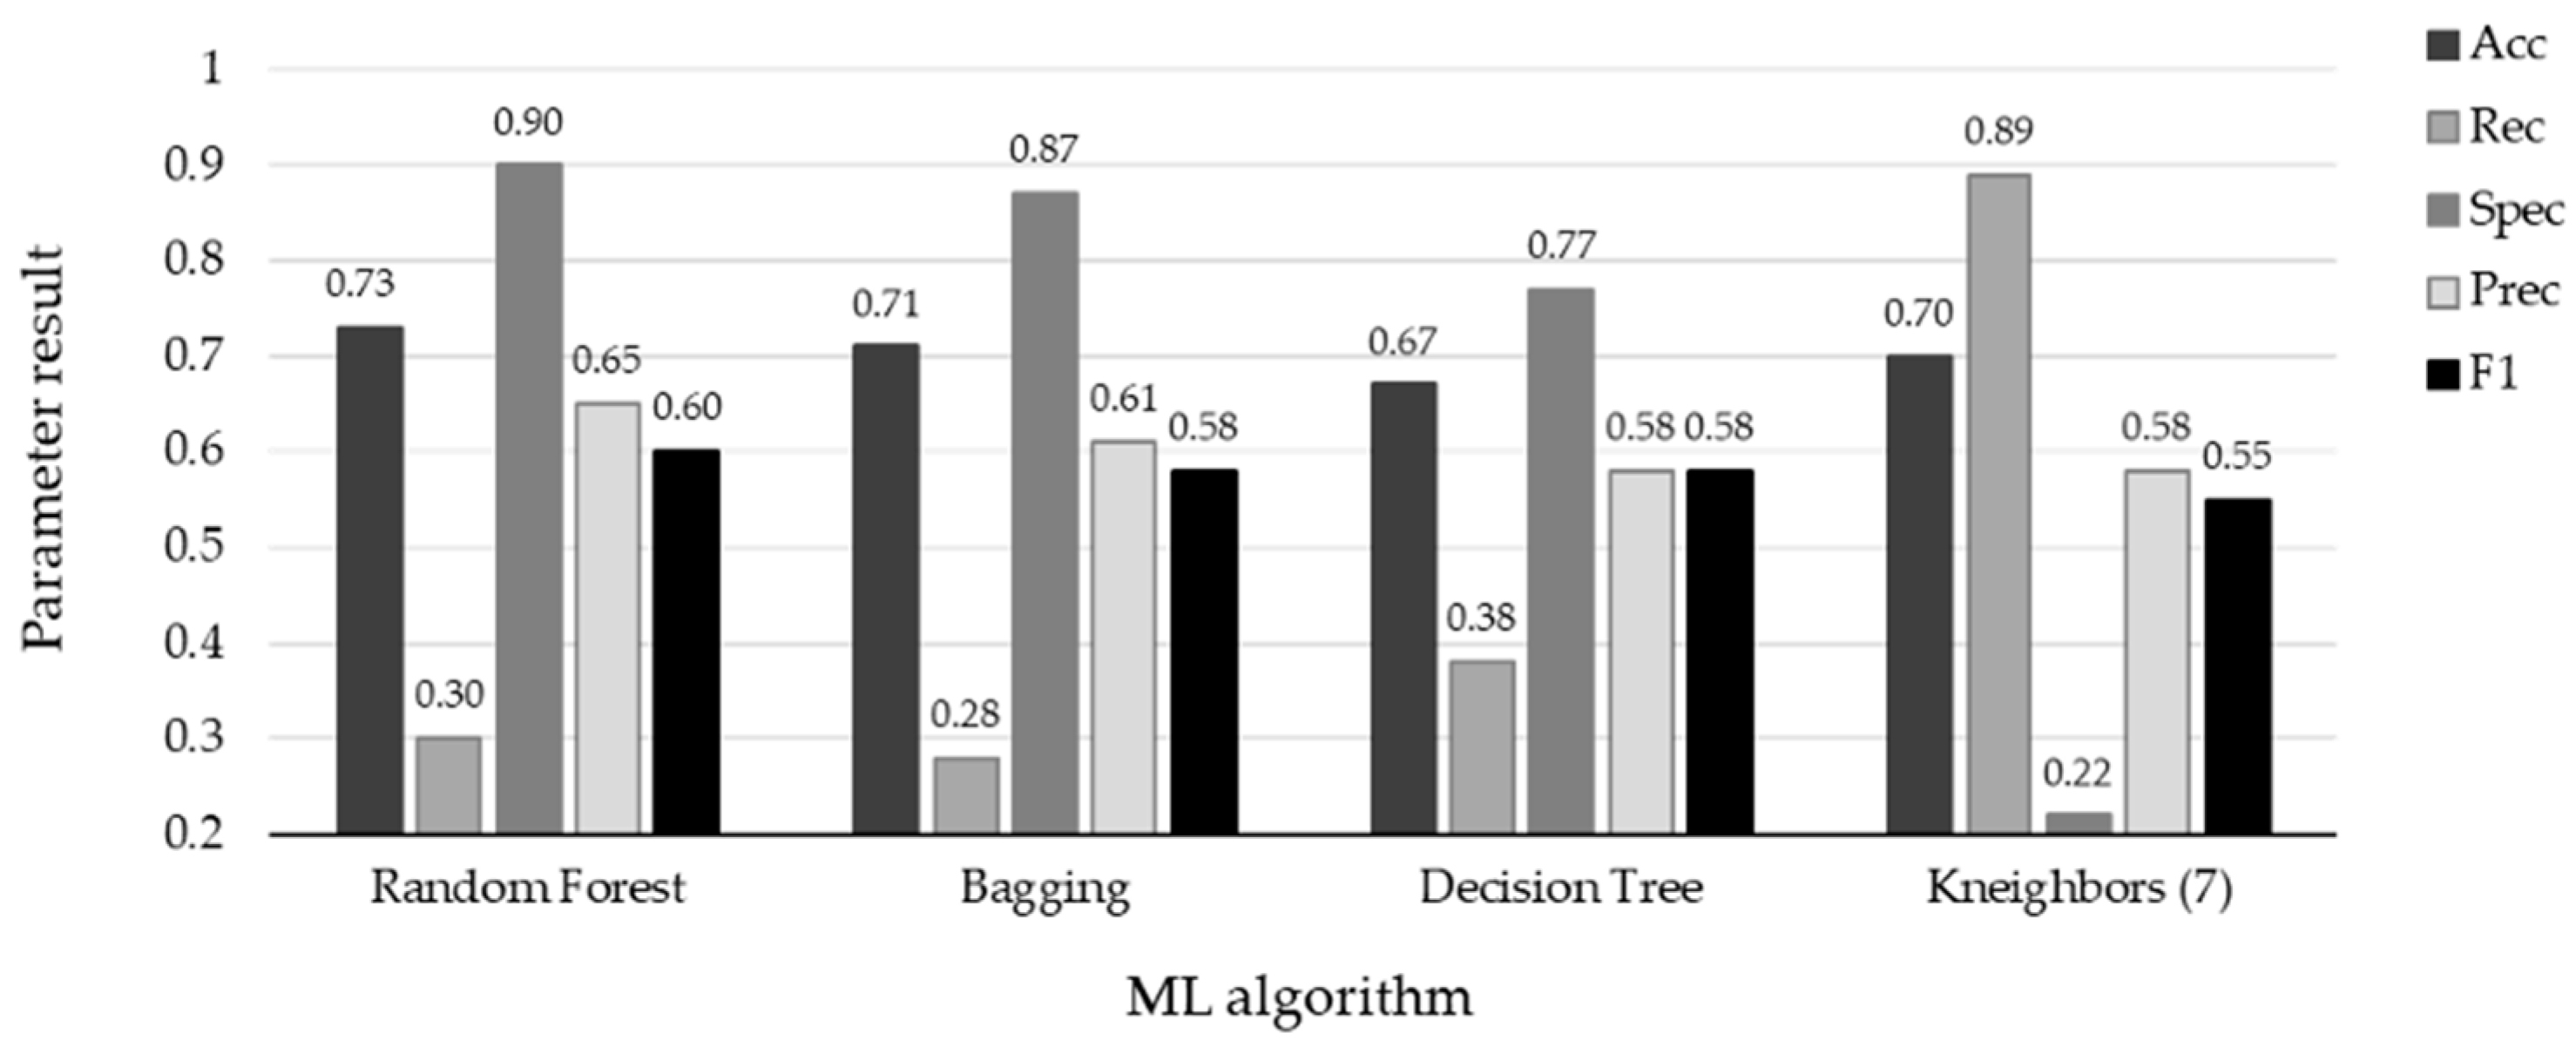
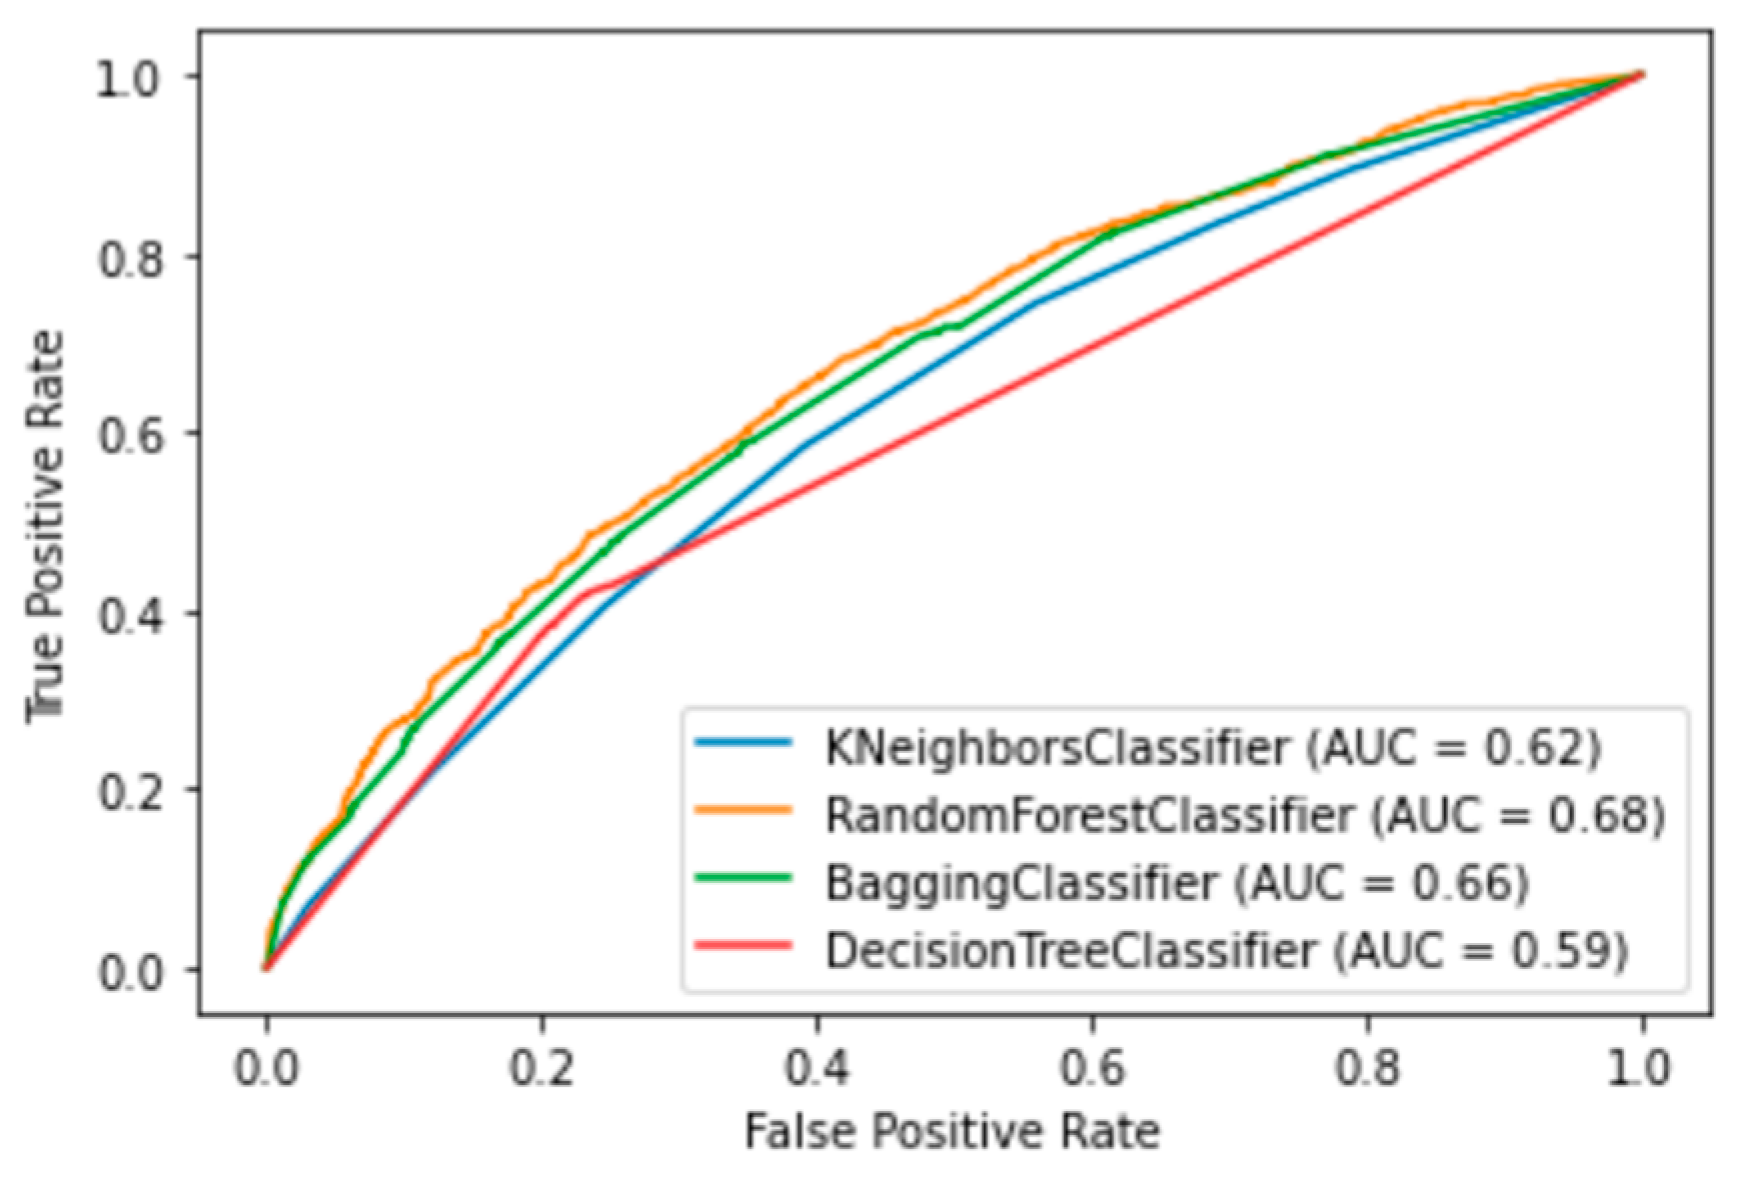
3. Results
4. Discussion
4.1. Limitations of Work
4.2. Future Work
5. Conclusions
Author Contributions
Funding
Institutional Review Board Statement
Informed Consent Statement
Data Availability Statement
Conflicts of Interest
References
- Centro Nacional de Programas de Control y Preventivos de Enfermedades. Manual de Atención a la Salud Ante Emergencias. Available online: https://epidemiologia.salud.gob.mx/gobmx/salud/documentos/manuales/ (accessed on 1 February 2022).
- LaRussa, P. Pandemic novel 2009 H1N1 influenza: What have we learned? Semin. Respir. Crit. Care Med. 2011, 32, 393–399. [Google Scholar] [CrossRef] [PubMed]
- Gordon, A.; Reingold, A. The Burden of Influenza: A Complex Problem. Curr. Epidemiol. Rep. 2018, 5, 1–9. [Google Scholar] [CrossRef] [PubMed]
- Epidemiology General Vigilance of Mexico, Informe Semanal de Vigilancia Epidemilógica. Available online: https://www.gob.mx/cms/uploads/attachment/file/737555/INFLUENZA_OVR_SE26_2022.pdf (accessed on 8 July 2022).
- Krammer, F.; Smith, G.J.D.; Fouchier, R.A.M.; Peiris, M.; Kedzierska, K.; Doherty, P.C.; Palese, P.; Shaw, M.L.; Treanor, J.; Webster, R.G.; et al. Influenza. Nat. Rev. Dis. Primers 2018, 4, 3. [Google Scholar] [CrossRef]
- Chow, E.J.; Doyle, J.D.; Uyeki, T.M. Influenza virus-related critical illness: Prevention, diagnosis, treatment. Crit. Care 2019, 23, 214. [Google Scholar] [CrossRef]
- Ruiz-Matus, C.; Kuri-Morales, P.; Narro-Robles, J. Comportamiento de las temporadas de influenza en México de 2010 a 2016, análisis y prospectiva. Gac. Med. Mex. 2017, 153, 205–213. [Google Scholar]
- Centers for Disease Control and Prevention. Flu Symptoms and Complications. Available online: https://www.cdc.gov/flu/symptoms/symptoms.htm (accessed on 13 July 2022).
- World Health Organization. Influenza (Seasonal). Available online: https://www.who.int/news-room/fact-sheets/detail/influenza-(seasonal) (accessed on 13 July 2022).
- López-Pineda, A.; Ye, Y.; Visweswaran, S.; Cooper, G.F.; Wagner, M.M.; Tsui, F.R. Comparison of machine learning classifiers for influenza detection from emergency department free-text reports. J. Biomed. Inform. 2015, 58, 60–69. [Google Scholar] [CrossRef]
- Bonaccorso, G. Machine Learning Algorithms, 1st. ed.; Pack Publishing: Birmingham, UK, 2017; pp. 8–16. [Google Scholar]
- Pandya, S.; Thakur, A.; Saxena, S.; Jassal, N.; Patel, C.; Modi, K.; Shah, P.; Joshi, R.; Gonge, S.; Kadam, K.; et al. A Study of the Recent Trends of Immunology: Key Challenges, Domains, Applications, Datasets, and Future Directions. Sensors 2021, 21, 7786. [Google Scholar] [CrossRef]
- Vijayan, V.V.; Anjali, C. Prediction and diagnosis of diabetes mellitus—A machine learning approach. In Proceedings of the IEEE Recent Advances in Intelligent Computational Systems (RAICS), Trivandrum, India, 20 April 2021; pp. 122–127. [Google Scholar] [CrossRef]
- Pecht, M.G.; Kang, M. Machine Learning: Diagnostics and Prognostics. In Prognostics and Health Management of Electronics: Fundamentals, Machine Learning, and the Internet of Things; John Wiley and Sons Ltd.: Hoboken, NJ, USA, 2019; pp. 163–191. [Google Scholar] [CrossRef]
- Shigueoka, L.S.; de Vasconcellos, J.P.C.; Schimiti, R.B.; Reis, A.S.C.; de Oliveira, G.O.; Gomi, E.S.; Vianna, J.A.R.; Lisboa, R.D.d.R.; Medeiros, F.A.; Costa, V.P. Automated algorithms combining structure and function outperform general ophthalmologists in diagnosing glaucoma. PLoS ONE 2018, 13, e0207784. [Google Scholar] [CrossRef]
- Ullah, R.; Khan, S.; Ali, H.; Chaudhary, I.I.; Bilal, M.; Ahmad, I. A comparative study of machine learning classifiers for risk prediction of asthma disease. Photodiagn. Photodyn. Ther. 2019, 28, 292–296. [Google Scholar] [CrossRef]
- Akazawa, M.; Hashimoto, K. Artificial Intelligence in Ovarian Cancer Diagnosis. Anticancer Res. 2020, 40, 4795–4800. [Google Scholar] [CrossRef]
- Lu, W.; Tong, Y.; Yu, Y.; Xing, Y.; Chen, C.; Shen, Y. Applications of Artificial Intelligence in Ophthalmology: General Overview. J. Ophthalmol. 2018, 2018, 5278196. [Google Scholar] [CrossRef] [PubMed]
- Silva, F.R.; Vidotti, V.G.; Cremasco, F.; Días, M.; Gomi, E.S.; Costa, V.P. Sensitivity and specificity of machine learning classifiers for glaucoma diagnosis using Spectral Domain OCT and standard automated perimetry. Arq. Bras. Oftalmol. 2013, 76, 170–174. [Google Scholar] [CrossRef] [PubMed]
- Guncar, G.; Kukar, M.; Notar, M.; Brvar, M.; Cernelc, P. An application of machine learning to haematological diagnosis. Sci. Rep. 2018, 8, 411. [Google Scholar] [CrossRef] [PubMed]
- Smith, J.P.; Milligan, K.; McCarthy, K.D.; Mchembere, W.; Okeyo, E.; Musau, S.K.; Okumu, A.; Song, R.; Click, E.S.; Cain, K.P. Machine learning to predict bacteriologic confirmation of Mycobacterium. tuberculosis. in infants and very young children. PLoS Digit. Health 2023, 2, 249. [Google Scholar] [CrossRef]
- Peng, B.; Gong, H.; Tian, H.; Zhuang, Q.; Li, J.; Cheng, K.; Ming, Y. The study of the association between immune monitoring and pneumonia in kidney transplant recipients through machine learning models. J. Transl. Med. 2020, 18, 370. [Google Scholar] [CrossRef]
- Saybani, M.R.; Shamshirband, S.; Hormozi, S.G.; Wah, T.Y.; Aghabozorgi, S.; Pourhoseingholi, M.A.; Olariu, T. Diagnosing tuberculosis with a novel support vector machine-based artificial immune recognition system. Iran. Red Crescent Med. J. 2015, 17, e24557. [Google Scholar] [CrossRef]
- Melendez, J.; Sánchez, C.I.; Philipsen, R.H.H.M.; Maduskar, P.; Dawson, R.; Theron, G.; Dheda, K.; van Ginneken, B. An automated tuberculosis screening strategy combining X-ray-based computer-aided detection and clinical information. Sci. Rep. 2016, 6, 25265. [Google Scholar] [CrossRef]
- Er, O.; Temurtas, F.; Tanrikulu, A.Ç. Tuberculosis disease diagnosis using artificial neural networks. J. Med. Syst. 2010, 34, 299–302. [Google Scholar] [CrossRef]
- e Souza, J.B.D.O.; Sanchez, M.; de Seixas, J.M.; Maidantchik, C.; Galliez, R.; Moreira, A.D.S.R.; da Costa, P.A.; Oliveira, M.M.; Harries, A.D.; Kritski, A.L. Screening for active pulmonary tuberculosis: Development and applicability of artificial neural network models. Tuberculosis 2018, 111, 94–101. [Google Scholar] [CrossRef]
- Revuelta-Zamorano, P.; Sánchez, A.; Rojo-Álvarez, J.L.; Álvarez-Rodríguez, J.; Ramos-López, J.; Soguero-Ruiz, C. Prediction of healthcare associated infections in an intensive care unit using machine learning and big data tools. In Proceedings of the XIV Mediterranean Conference on Medical and Biological Engineering and Computing, Paphos, Cyprus, 31 March–2 April 2016; Springer International Publishing: Cham, Switzerland, 2016; Volume 57, p. 840e5. [Google Scholar] [CrossRef]
- Hernandez, B.; Herrero, P.; Rawson, T.M.; Moore, L.S.P.; Evans, B.; Toumazou, C.; Holmes, A.H.; Georgiou, P. Supervised learning for infection risk inference using pathology data. BMC Med. Inform. Decis. Mak. 2017, 17, 168. [Google Scholar] [CrossRef]
- Van Steenkiste, T.; Ruyssinck, J.; De Baets, L.; Decruyenaere, J.; De Turck, F.; Ongenae, F.; Dhaene, T. Accurate prediction of blood culture outcome in the intensive care unit using long short-term memory neural networks. Artif. Intell. Med. 2018, 97, 38–43. [Google Scholar] [CrossRef] [PubMed]
- Ke, C.; Jin, Y.; Evans, H.; Lober, B.; Qian, X.; Liu, J.; Huang, S. Prognostics of surgical site infections using dynamic health data. J. Biomed. Inform. 2017, 65, 22–33. [Google Scholar] [CrossRef] [PubMed]
- Horng, S.; Sontag, D.A.; Halpern, Y.; Jernite, Y.; Shapiro, N.I.; Nathanson, L.A. Creating an automated trigger for sepsis clinical decision support at emergency department triage using machine learning. PLoS ONE 2017, 12, e0174708. [Google Scholar] [CrossRef]
- Taylor, R.A.; Moore, C.L.; Cheung, K.; Brandt, C. Predicting urinary tract infections in the emergency department with machine learning. PLoS ONE 2018, 13, e0194085. [Google Scholar] [CrossRef]
- Revett, K.; Gorunescu, F.; Ene, M. A machine learning approach to differentiating bacterial from viral meningitis. In Proceedings of the IEEE John Vincent Atanasoff 2006 International Symposium on Modern Computing, Sofia, Bulgaria, 3–6 October 2006; pp. 155–162. [Google Scholar] [CrossRef]
- D’Angelo, G.; Pilla, R.; Tascini, C.; Rampone, S. A proposal for distinguishing between bacterial and viral meningitis using genetic programming and decision trees. Soft Comput. 2019, 23, 11775–11791. [Google Scholar] [CrossRef]
- Shamshirband, S.; Hessam, S.; Javidnia, H.; Amiribesheli, M.; Vahdat, S.; Petković, D.; Gani, A.; Kiah, L.M. Tuberculosis disease diagnosis using artificial immune recognition system. Int. J. Med. Sci. 2014, 11, 508–514. [Google Scholar] [CrossRef]
- Jayatilake, S.M.; Ganegoda, G.U. Involvement of Machine Learning Tools in Healthcare Decision Making. J. Healthc. Eng. 2021, 2021, 6679512. [Google Scholar] [CrossRef]
- Altini, N.; Brunetti, A.; Mazzoleni, S.; Moncelli, F.; Zagaria, I.; Prencipe, B.; Lorusso, E.; Buonamico, E.; Carpagnano, G.E.; Bavaro, D.F.; et al. Predictive Machine Learning Models and Survival Analysis for COVID-19 Prognosis Based on Hematochemical Parameters. Sensors 2021, 21, 8503. [Google Scholar] [CrossRef]
- Borkenhagen, L.K.; Allen, M.W.; Runstadler, J.A. Influenza virus genotype to phenotype predictions through machine learning: A systematic review. Emerg. Microbes Infect. 2021, 10, 1896–1907. [Google Scholar] [CrossRef]
- Cheng, H.-Y.; Wu, Y.-C.; Lin, M.-H.; Liu, Y.-L.; Tsai, Y.-Y.; Wu, J.-H.; Pan, K.-H.; Ke, C.-J.; Chen, C.-M.; Liu, D.-P.; et al. Applying Machine Learning Models with An Ensemble Approach for Accurate Real-Time Influenza Forecasting in Taiwan: Development and Validation Study. J. Med. Internet Res. 2020, 22, e15394. [Google Scholar] [CrossRef]
- Reich, N.G.; McGowan, C.J.; Yamana, T.K.; Tushar, A.; Ray, E.L.; Osthus, D.; Kandula, S.; Brooks, L.C.; Crawford-Crudell, W.; Gibson, G.C.; et al. Accuracy of real-time multi-model ensemble forecasts for seasonal influenza in the U.S. PLoS Comput. Biol. 2019, 15, e1007486. [Google Scholar] [CrossRef] [PubMed]
- Hayati, M.; Biller, P.; Colijn, C. Predicting the short-term success of human influenza virus variants with machine learning. Proc. Biol. Sci. 2020, 287, 20200319. [Google Scholar] [CrossRef] [PubMed]
- Kwon, E.; Cho, M.; Kim, H.; Son, S. A Study on Host Tropism Determinants of Influenza Virus Using Machine Learning. Curr. Bioinform. 2020, 15, 121–134. [Google Scholar] [CrossRef]
- Al Dalbhi, S.; Alshahrani, H.A.; Almadi, A.; Busaleh, H.; Alotaibi, M.; Almutairi, W.; Almukhrq, Z. Prevalence and mortality due to acute kidney injuries in patients with influenza A (H1N1) viral infection: A systemic narrative review. Int. J. Health Sci. 2019, 13, 56–62. [Google Scholar]
- Hogan, C.A.; Rajpurkar, P.; Sowrirajan, H.; Phillips, N.A.; Le, A.T.; Wu, M.; Garamani, N.; Sahoo, M.K.; Wood, M.L.; Huang, C.; et al. Nasopharyngeal metabolomics and machine learning approach for the diagnosis of influenza. EBioMedicine 2021, 71, 103546. [Google Scholar] [CrossRef]
- Fukuta, H.; Goto, T.; Wakami, K.; Kamiya, T.; Ohte, N. The effect of influenza vaccination on mortality and hospitalization in patients with heart failure: A systematic review and meta-analysis. Heart Fail. Rev. 2019, 24, 109–114. [Google Scholar] [CrossRef]
- Tomic, A.; Tomic, I.; Rosenberg-Hasson, Y.; Dekker, C.L.; Maecker, H.T.; Davis, M.M. SIMON, an Automated Machine Learning System, Reveals Immune Signatures of Influenza Vaccine Responses. J. Immunol. 2019, 203, 749–759. [Google Scholar] [CrossRef]
- Wolk, D.M.; Lanyado, A.; Tice, A.M.; Shermohammed, M.; Kinar, Y.; Goren, A.; Chabris, C.F.; Meyer, M.N.; Shoshan, A.; Abedi, V. Prediction of Influenza Complications: Development and Validation of a Machine Learning Prediction Model to Improve and Expand the Identification of Vaccine-Hesitant Patients at Risk of Severe Influenza Complications. J. Clin. Med. 2022, 11, 4342. [Google Scholar] [CrossRef]
- López, V.; Fernández, A.; García, S.; Herrera, F. An insight into classification with imbalanced data: Empirical results and current trends on using data intrinsic characteristics. Inf. Sci. 2013, 250, 113–141. [Google Scholar] [CrossRef]
- Chawla, N.V. Data Mining for Imbalanced Datasets: An Overview. In Data Mining and Knowledge Discovery Handbook; Springer: Boston, MA, USA, 2005. [Google Scholar]
- Kamal, K.H.; Ritesh, K.J.; Kamlesh, L.; Ruchi, D. Machine Learning: Master Supervised and Unsupervised Learning Algorithms with Real Examples; BPB Publications: Noida, India, 2021. [Google Scholar]
- Alpaydin, E. Machine Learning: The New AI; MIT Press Essential Knowledge Series; MIT Press: London, UK, 2016. [Google Scholar]
- Singh, A.; Thakur, N.; Sharma, A. A review of supervised machine learning algorithms. In Proceedings of the 3rd International Conference on Computing for Sustainable Global Development (INDIACom), New Delhi, India, 16–18 March 2016; pp. 1310–1315. [Google Scholar]
- Raschka, S. Python Machine Learning, 2nd ed.; Packt Publishing: Birmingham, UK, 2017. [Google Scholar]
- Müller, A.C.; Guido, S. Introduction to Machine Learning with Python: A Guide for Data Scientists, 1st ed.; O’Reilly Media, Inc.: Sebastopol, CA, USA, 2016. [Google Scholar]
- Mathanker, S.K.; Weckler, P.R.; Bowser, T.J.; Wang, N.; Maness, N.O. AdaBoost classifiers for pecan defect classification. Comput. Electron. Agric. 2011, 77, 60–68. [Google Scholar] [CrossRef]
- Freund, Y.; Schapire, R.E. A decision-theoretic generalization of on-line learning and an application to boosting. J. Comput. Syst. Sci. 1997, 55, 119–139. [Google Scholar] [CrossRef]
- Decision-Trees. Available online: https://www.ibm.com/topics/decision-trees (accessed on 5 October 2022).
- Breiman, L. Random Forests. Mach. Learn. 2001, 5, 5–32. [Google Scholar] [CrossRef]
- Satpathy, R.; Choudhury, T.; Satpathy, S.; Mohanty, S.; Zhang, X. Introduction to supervised learning. In Data Analytics in Bioinformatics: A Machine Learning Perspective, 1st ed.; John Wiley & Sons: Hoboken, NJ, USA, 2021; pp. 18–20. [Google Scholar]
- Breiman, L. Bagging Predictors. Mach. Learn. 1996, 24, 123–140. [Google Scholar] [CrossRef]
- Marsland, S. Boosting. In Machine Learning: An Algorithmic Perspective, 2nd ed.; Taylor and Francis Group: Boca Raton, FL, USA; CRC Press: Oxford, NY, USA, 2015; pp. 268–273. [Google Scholar]
- Natekin, A.; Knoll, A. Gradient boosting machines, a tutorial. Front. Neurorobot. 2013, 7, 21. [Google Scholar] [CrossRef] [PubMed]
- Taunk, K.; Verma, S.; Swetapadma, A. A Brief Review of Nearest Neighbor Algorithm for Learning and Classification. In Proceedings of the International Conference on Intelligent Computing and Control Systems (ICCS), Madurai, India, 15–17 May 2019. [Google Scholar] [CrossRef]
- Bafjaish, S. Comparative Analysis of Naive Bayesian Techniques in Health-Related for Classification Task. J. Soft Comput. Data Min. 2020, 1, 1–10. Available online: https://penerbit.uthm.edu.my/ojs/index.php/jscdm/article/view/7144 (accessed on 24 October 2023).
- Ranjitha, K.V. Classification and optimization scheme for text data using machine learning Naïve Bayes classifier. In Proceedings of the 2018 IEEE World Symposium on Communication Engineering (WSCE), Singapore, 28–30 December 2018; pp. 33–36. [Google Scholar]
- Sulaiman, M.A. Evaluating Data Mining Classification Methods Performance in Internet of Things Applications. J. Soft Comput. Data Min. 2020, 1, 11–25. Available online: https://penerbit.uthm.edu.my/ojs/index.php/jscdm/article/view/7127 (accessed on 13 August 2021).
- Ghosh, S.; Dasgupta, A.; Swetapadma, A. A Study on Support Vector Machine based Linear and Non-Linear Pattern Classification. In Proceedings of the 2019 International Conference on Intelligent Sustainable Systems (ICISS), Palladam, India, 21–22 February 2019; pp. 24–28. [Google Scholar]
- Cortes, C.; Vapnik, V. Support-vector networks. Mach. Learn. 1995, 20, 273–297. [Google Scholar] [CrossRef]
- Alayande, S.; Adekunle, B. An overview and application of discriminant analysis in data analysis. IOSR J. Math. 2015, 11, 12–15. [Google Scholar]
- Varoquaux, G.; Colliot, O. Evaluating machine learning models and their diagnostic value. In Machine Learning for Brain Disorders; Springer: New York, NY, USA, USA, 2022; pp. 1–30. [Google Scholar]
- Chiu, H.-Y.R.; Hwang, C.-K.; Chen, S.-Y.; Shih, F.-Y.; Han, H.-C.; King, C.-C.; Gilbert, J.R.; Fang, C.-C.; Oyang, Y.-J. Machine learning for emerging infectious disease field responses. Sci. Rep. 2022, 12, 328. [Google Scholar] [CrossRef]
- Mondal, M.R.; Bharati, S.; Podder, P. Diagnosis of COVID-19 Using Machine Learning and Deep Learning: A Review. Curr. Med. Imaging 2021, 17, 1403–1418. [Google Scholar] [CrossRef]
- Mayrose, H.; Bairy, G.M.; Sampathila, N.; Belurkar, S.; Saravu, K. Machine Learning-Based Detection of Dengue from Blood Smear Images Utilizing Platelet and Lymphocyte Characteristics. Diagnostics 2023, 13, 220. [Google Scholar] [CrossRef] [PubMed]
- Kamalov, F.; Elnagar, A.; Leung, H. Ensemble Learning with Resampling for Imbalanced Data. In ICIC 2021: Intelligent Computing Theories and Application; Lecture Notes in Computer, Science; Huang, D.S., Jo, K.H., Li, J., Gribova, V., Hussain, A., Eds.; Springer: Cham, Switzerland, 2021; Volume 12837. [Google Scholar] [CrossRef]
- Geetha, R.; Sivasubramanian, S.; Kaliappan, M.; Vimal, S.; Annamalai, S. Cervical Cancer Identification with Synthetic Minority Oversampling Technique and PCA Analysis using Random Forest Classifier. J. Med. Syst. 2019, 43, 286. [Google Scholar] [CrossRef] [PubMed]
- Chow, E.J.; Uyeki, T.M.; Chu, H.Y. The effects of the COVID-19 pandemic on community respiratory virus activity. Nat. Rev. Microbiol. 2023, 21, 195–210. [Google Scholar] [CrossRef]
- Aloui, K.; Hamza, C.; Mefteh, K.; Hanen, S. Epidemiologic changes of Respiratory syncytial virus in the COVID-19 Era. Med. Mal. Infect. Form. 2022, 1, 109. [Google Scholar] [CrossRef]
- Kandeel, A.; Fahim, M.; Deghedy, O.; Roshdy, W.H.; Khalifa, M.K.; El Shesheny, R.; Kandeil, A.; Naguib, A.; Afifi, S.; Mohsen, A.; et al. Resurgence of influenza and respiratory syncytial virus in Egypt following two years of decline during the COVID-19 pandemic: Outpatient clinic survey of infants and children. BMC Public Health 2022, 23, 1067. [Google Scholar] [CrossRef]
- Barraza, M.F.O.; Fasce, R.A.; Nogareda, F.; Marcenac, P.; Mallegas, N.V.; Alister, P.B.; Loayza, S.; Chard, A.N.; Arriola, C.S.; Couto, P.; et al. Influenza Incidence and Vaccine Effectiveness During the Southern Hemisphere Influenza Season—Chile. MMWR Morb. Mortal. Wkly. 2022, 71, 1353–1358. [Google Scholar] [CrossRef]

| Attributes | All Patients n = 15,480 n (%) | Positive n = 4212 n (%) | Negative n = 11,268 n (%) | p-Value |
|---|---|---|---|---|
| Demographic information | ||||
| Sex—Feminine | 7770 (50.2) | 2162 (51.3) | 5608 (49.8) | 0.087 |
| Sex—Masculine | 7710 (49.8) | 2050 (48.7) | 5660 (50.2) | |
| Hospitalized | 10516 (67.9) | 2449 (58.1) | 8067 (71.6) | <0.001 |
| Contact influenza-patients | 2012 (13.0) | 715 (17.0) | 1297 (11.5) | <0.001 |
| Vaccinated for influenza | 2096 (13.5) | 534 (12.7) | 1562 (13.9) | 0.059 |
| Age 7–19 years | 6417 (41.5) | 1511 (35.9) | 4906 (43.5) | <0.001 |
| Age 20–39 years | 3111 (20.1) | 967 (23.0) | 2144 (19.0) | |
| Age 40–59 years | 3283 (21.2) | 1056 (25.0) | 2227 (19.8) | |
| Age ≥ 60 years | 2669 (17.2) | 678 (16.1) | 1991 (17.7) | |
| Symptoms | ||||
| Fever | 13,112 (84.7) | 3853 (84.2) | 9259 (82.2) | <0.001 |
| Cough | 13,953 (90.1) | 3918 (85.7) | 10,035 (89.1) | <0.001 |
| Chest pain | 3750 (24.2) | 1160 (25.4) | 2590 (23.0) | <0.001 |
| Dyspnea | 8642 (55.8) | 2079 (45.5) | 6563 (58.2) | <0.001 |
| Irritability | 4688 (30.3) | 1159 (25.3) | 3529 (31.3) | <0.001 |
| Diarrhea | 1833 (11.8) | 492 (10.8) | 1341 (11.9) | 0.727 |
| Shaking chills | 5738 (37.1) | 2003 (43.8) | 3735 (33.1) | <0.001 |
| Headache | 8692 (56.1) | 2896 (63.3) | 5796 (51.4) | <0.001 |
| Myalgia | 6255 (40.4) | 2279 (49.8) | 3976 (35.3) | <0.001 |
| Arthralgia | 5539 (35.8) | 2014 (44.0) | 3525 (31.3) | <0.001 |
| Malaise | 9826 (63.5) | 2947 (64.4) | 6879 (61.0) | <0.001 |
| Rhinorrhea | 9277 (59.9) | 2817 (61.6) | 6460 (57.3) | <0.001 |
| Polypnea | 4602 (29.7) | 1073 (23.5) | 3529 (31.3) | <0.001 |
| Vomiting | 1958 (12.6) | 606 (13.2) | 1352 (12.0) | <0.001 |
| Abdominal pain | 2114 (13.7) | 683 (14.9) | 1431 (12.7) | <0.001 |
| Sore throat | 5321 (34.4) | 1850 (40.4) | 3471 (30.8) | <0.001 |
| Conjunctivitis | 3074 (19.9) | 1104 (24.1) | 1970 (17.5) | <0.001 |
| Cyanosis | 1703 (11.0) | 395 (8.6) | 1308 (11.6) | <0.001 |
| Algorithm | AUC | Acc | Rec | Prec | Spec | F1 |
|---|---|---|---|---|---|---|
| Random Forest | 0.94 | 0.86 | 0.91 | 0.82 | 0.88 | 0.86 |
| Bagging | 0.93 | 0.85 | 0.90 | 0.82 | 0.87 | 0.85 |
| Decision Tree | 0.85 | 0.70 | 0.71 | 0.73 | 0.73 | 0.72 |
| Kneighbors (7) | 0.73 | 0.63 | 0.67 | 0.63 | 0.60 | 0.63 |
| Gradient Boosting | 0.69 | 0.62 | 0.69 | 0.61 | 0.56 | 0.62 |
| SVM rbf | 0.67 | 0.62 | 0.65 | 0.61 | 0.59 | 0.62 |
| Quadratic Discriminant | 0.66 | 0.62 | 0.70 | 0.60 | 0.54 | 0.62 |
| Ada Boost | 0.66 | 0.62 | 0.62 | 0.61 | 0.61 | 0.62 |
| Linear Discriminant * | 0.65 | 0.61 | 0.62 | 0.61 | 0.61 | 0.61 |
| Linear SVM * | 0.65 | 0.61 | 0.62 | 0.61 | 0.61 | 0.61 |
| Logistic Regression | 0.65 | 0.61 | 0.62 | 0.61 | 0.61 | 0.61 |
| BernoulliNB | 0.65 | 0.61 | 0.59 | 0.61 | 0.62 | 0.61 |
Disclaimer/Publisher’s Note: The statements, opinions and data contained in all publications are solely those of the individual author(s) and contributor(s) and not of MDPI and/or the editor(s). MDPI and/or the editor(s) disclaim responsibility for any injury to people or property resulting from any ideas, methods, instructions or products referred to in the content. |
© 2023 by the authors. Licensee MDPI, Basel, Switzerland. This article is an open access article distributed under the terms and conditions of the Creative Commons Attribution (CC BY) license (https://creativecommons.org/licenses/by/4.0/).
Share and Cite
Marquez, E.; Barrón-Palma, E.V.; Rodríguez, K.; Savage, J.; Sanchez-Sandoval, A.L. Supervised Machine Learning Methods for Seasonal Influenza Diagnosis. Diagnostics 2023, 13, 3352. https://doi.org/10.3390/diagnostics13213352
Marquez E, Barrón-Palma EV, Rodríguez K, Savage J, Sanchez-Sandoval AL. Supervised Machine Learning Methods for Seasonal Influenza Diagnosis. Diagnostics. 2023; 13(21):3352. https://doi.org/10.3390/diagnostics13213352
Chicago/Turabian StyleMarquez, Edna, Eira Valeria Barrón-Palma, Katya Rodríguez, Jesus Savage, and Ana Laura Sanchez-Sandoval. 2023. "Supervised Machine Learning Methods for Seasonal Influenza Diagnosis" Diagnostics 13, no. 21: 3352. https://doi.org/10.3390/diagnostics13213352
APA StyleMarquez, E., Barrón-Palma, E. V., Rodríguez, K., Savage, J., & Sanchez-Sandoval, A. L. (2023). Supervised Machine Learning Methods for Seasonal Influenza Diagnosis. Diagnostics, 13(21), 3352. https://doi.org/10.3390/diagnostics13213352