

Optimal Abdominal CT Image Quality in Non-Lean Patients: Customization of CM Injection Protocols and Low-Energy Acquisitions

 ,
, 
Abstract
1. Introduction
2. Materials and Methods
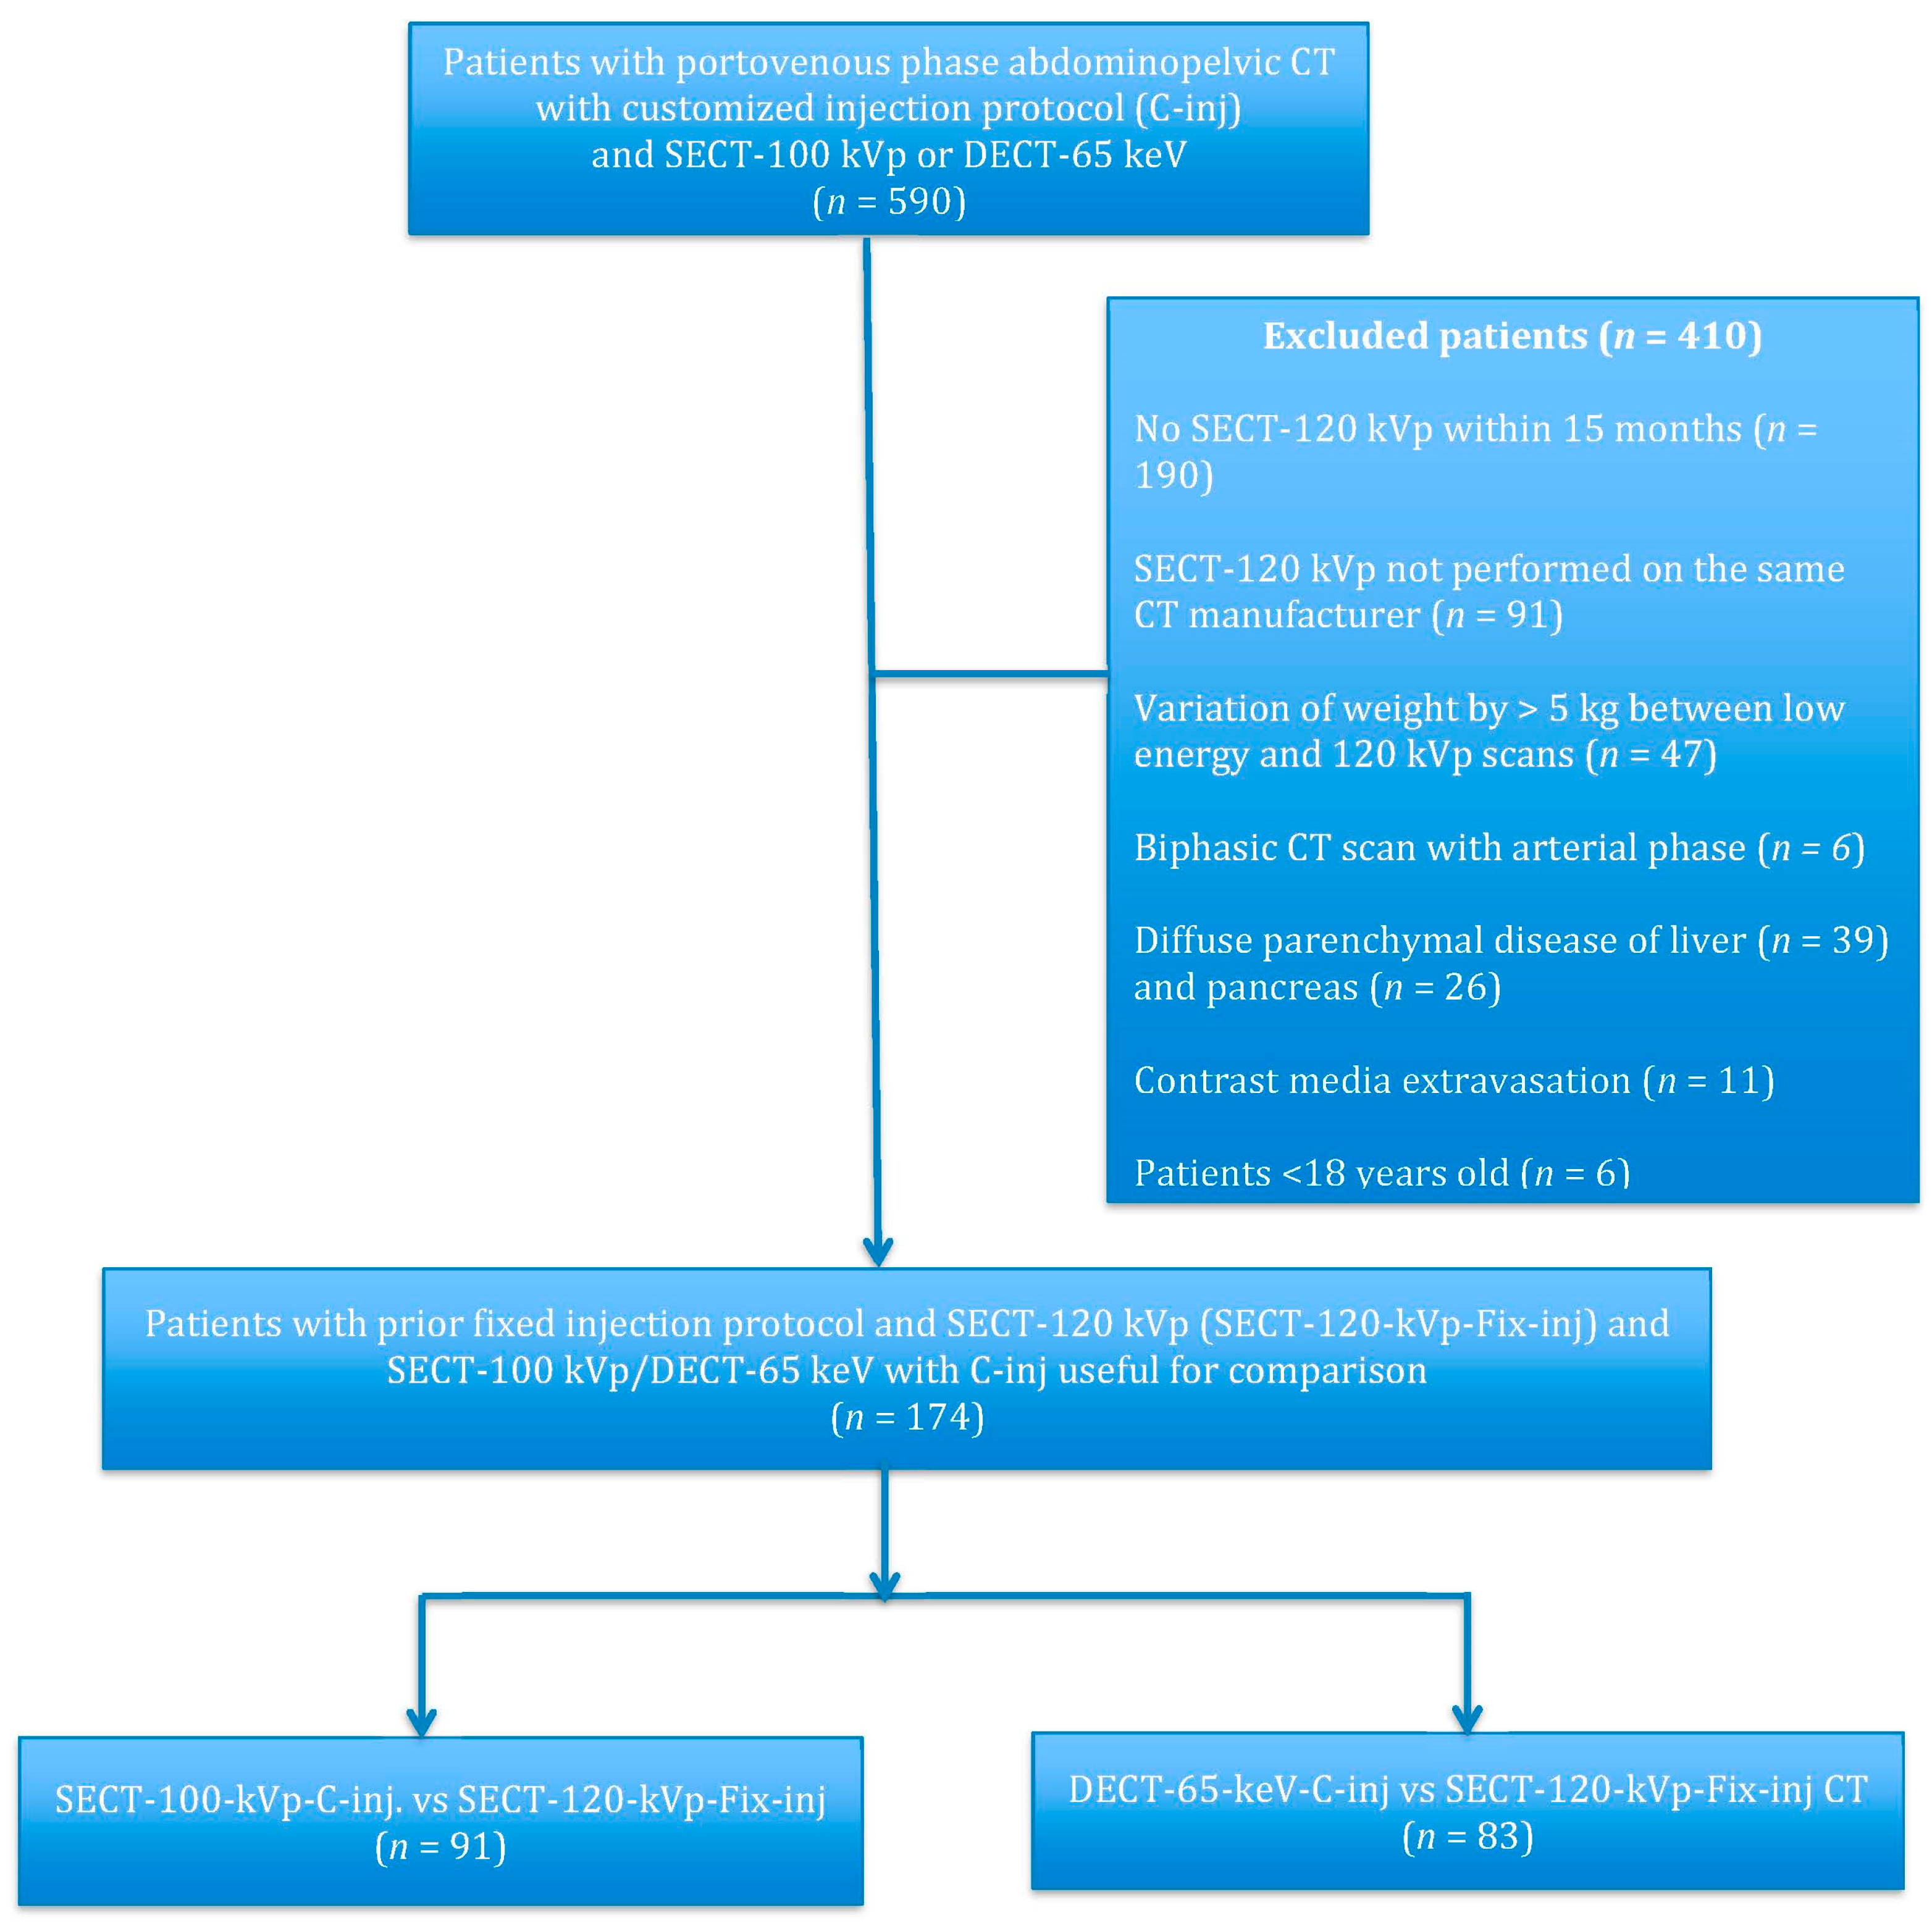
2.1. Overview
2.2. Patients
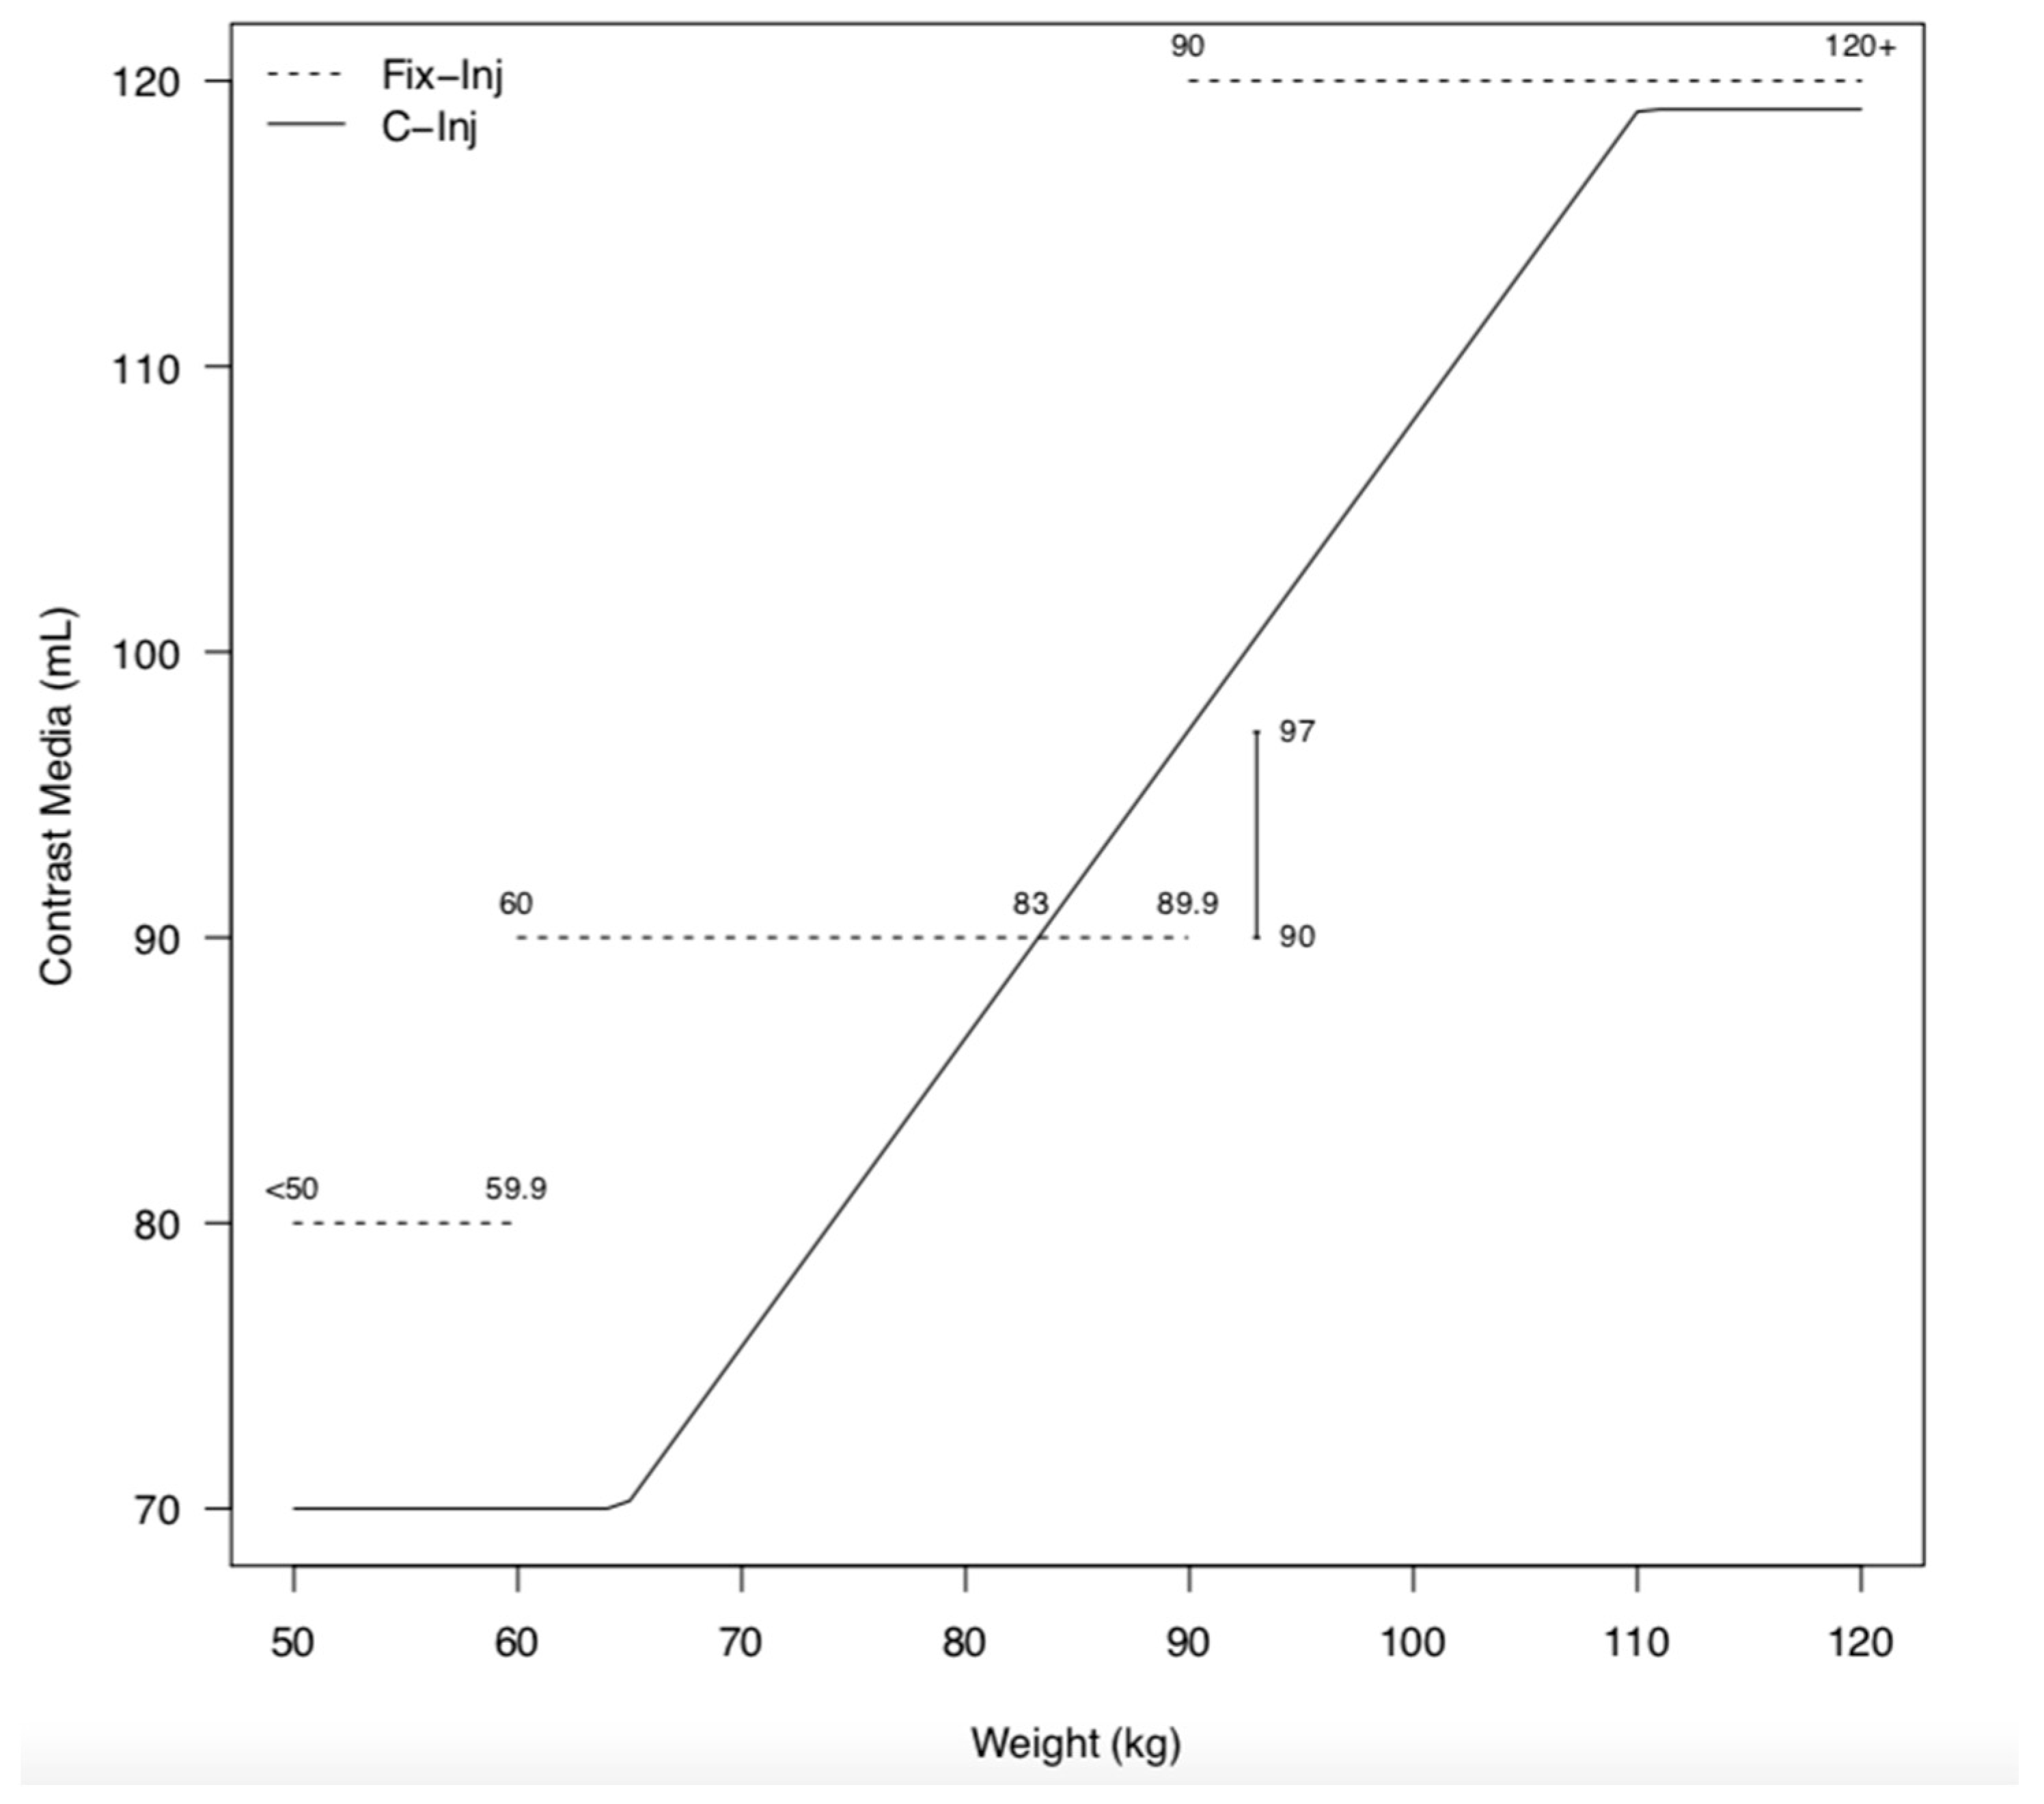
2.3. Contrast Media Protocol
2.4. CT Protocols
2.5. Image Analysis
2.6. Radiation Dose Evaluation
2.7. Statistical Analysis
3. Results
3.1. Patient Population
3.2. Contrast Media Injections
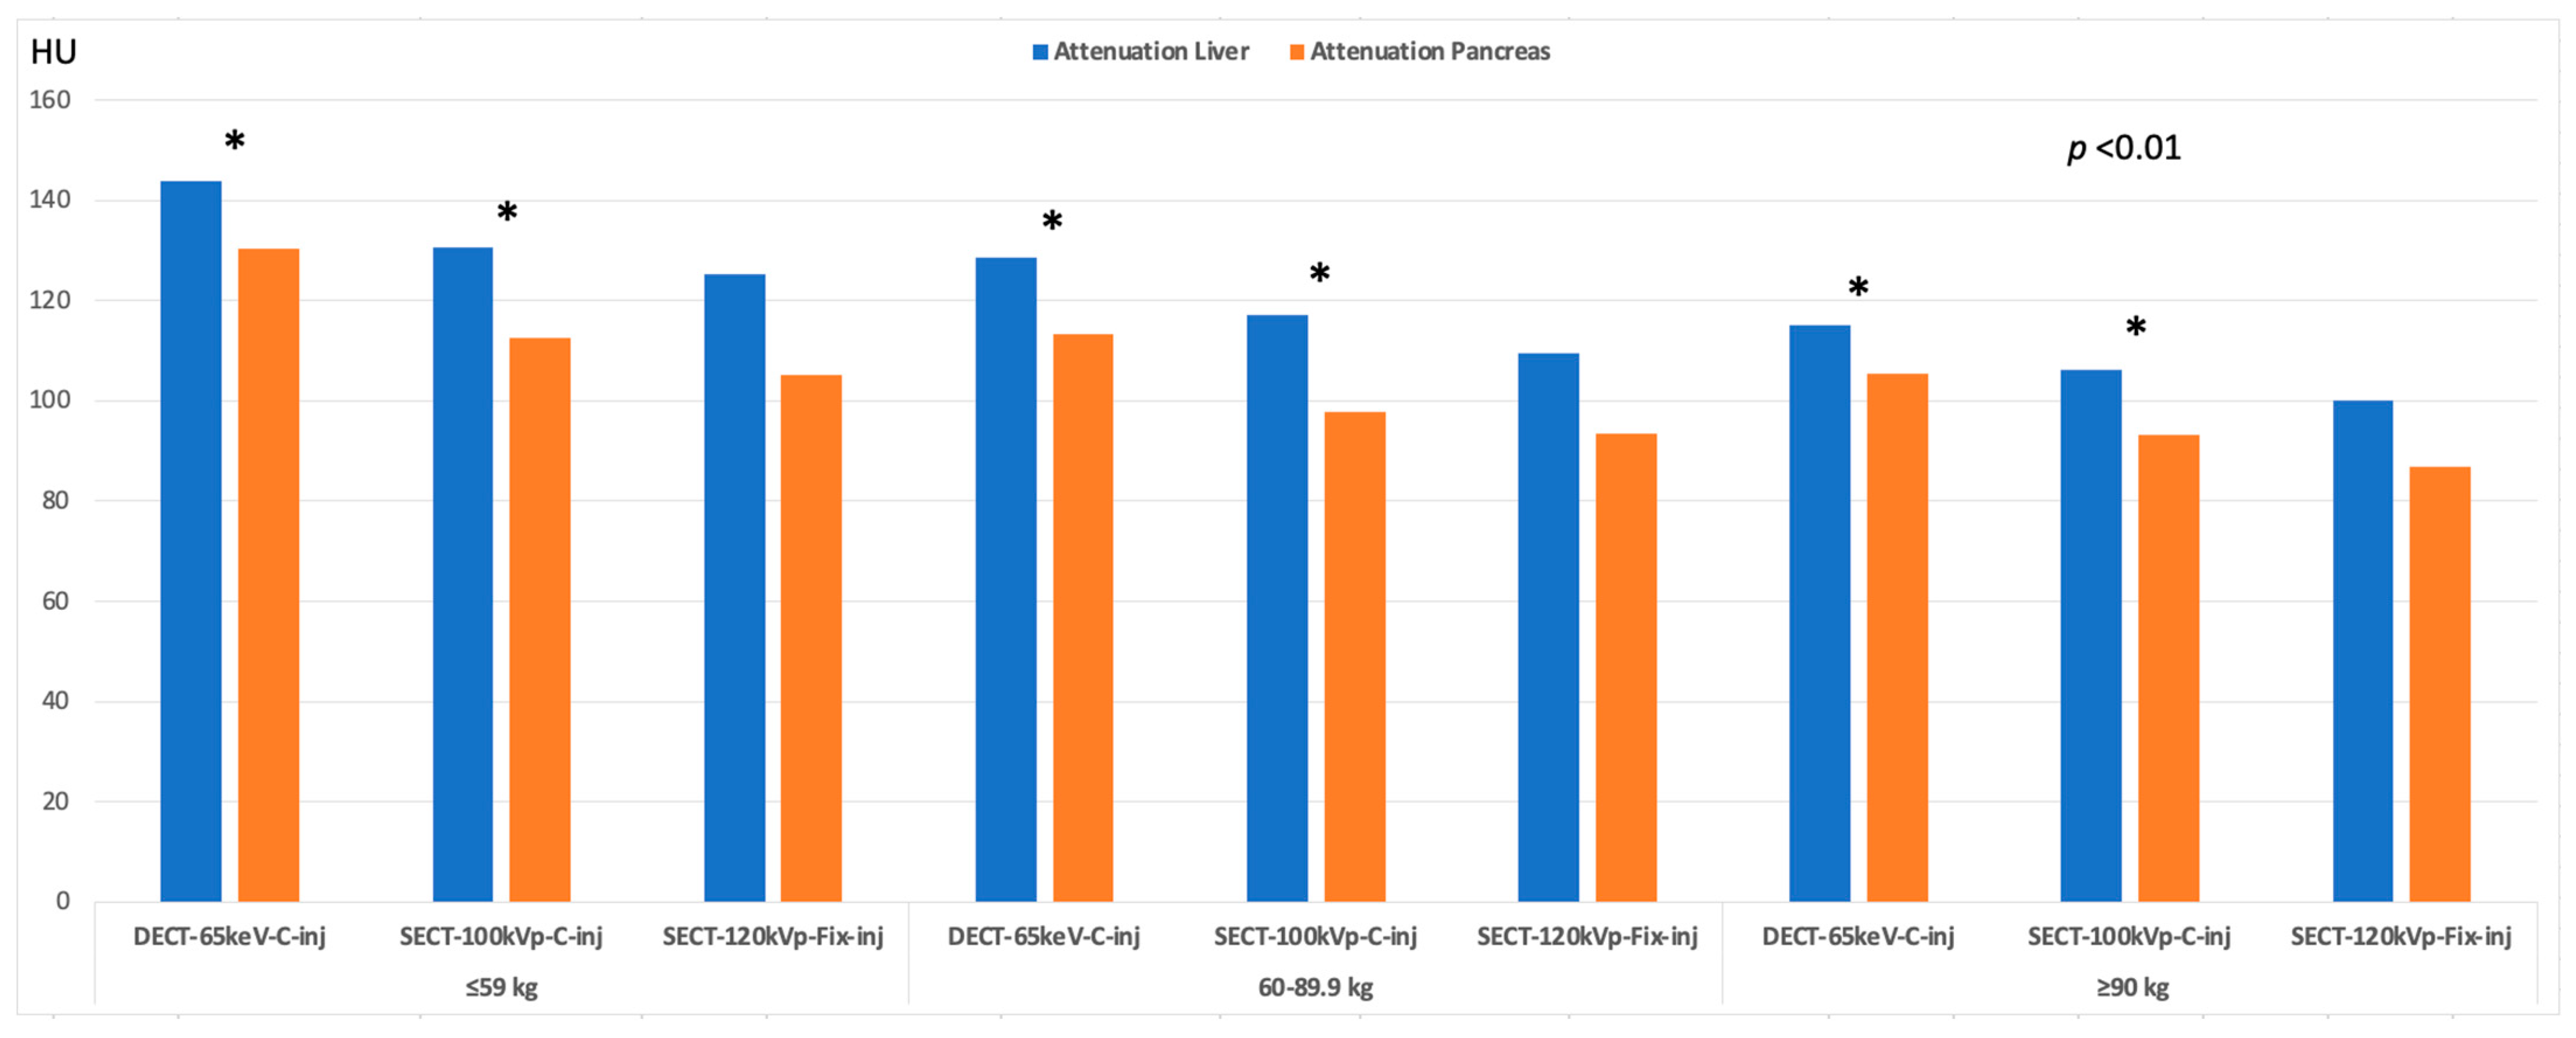
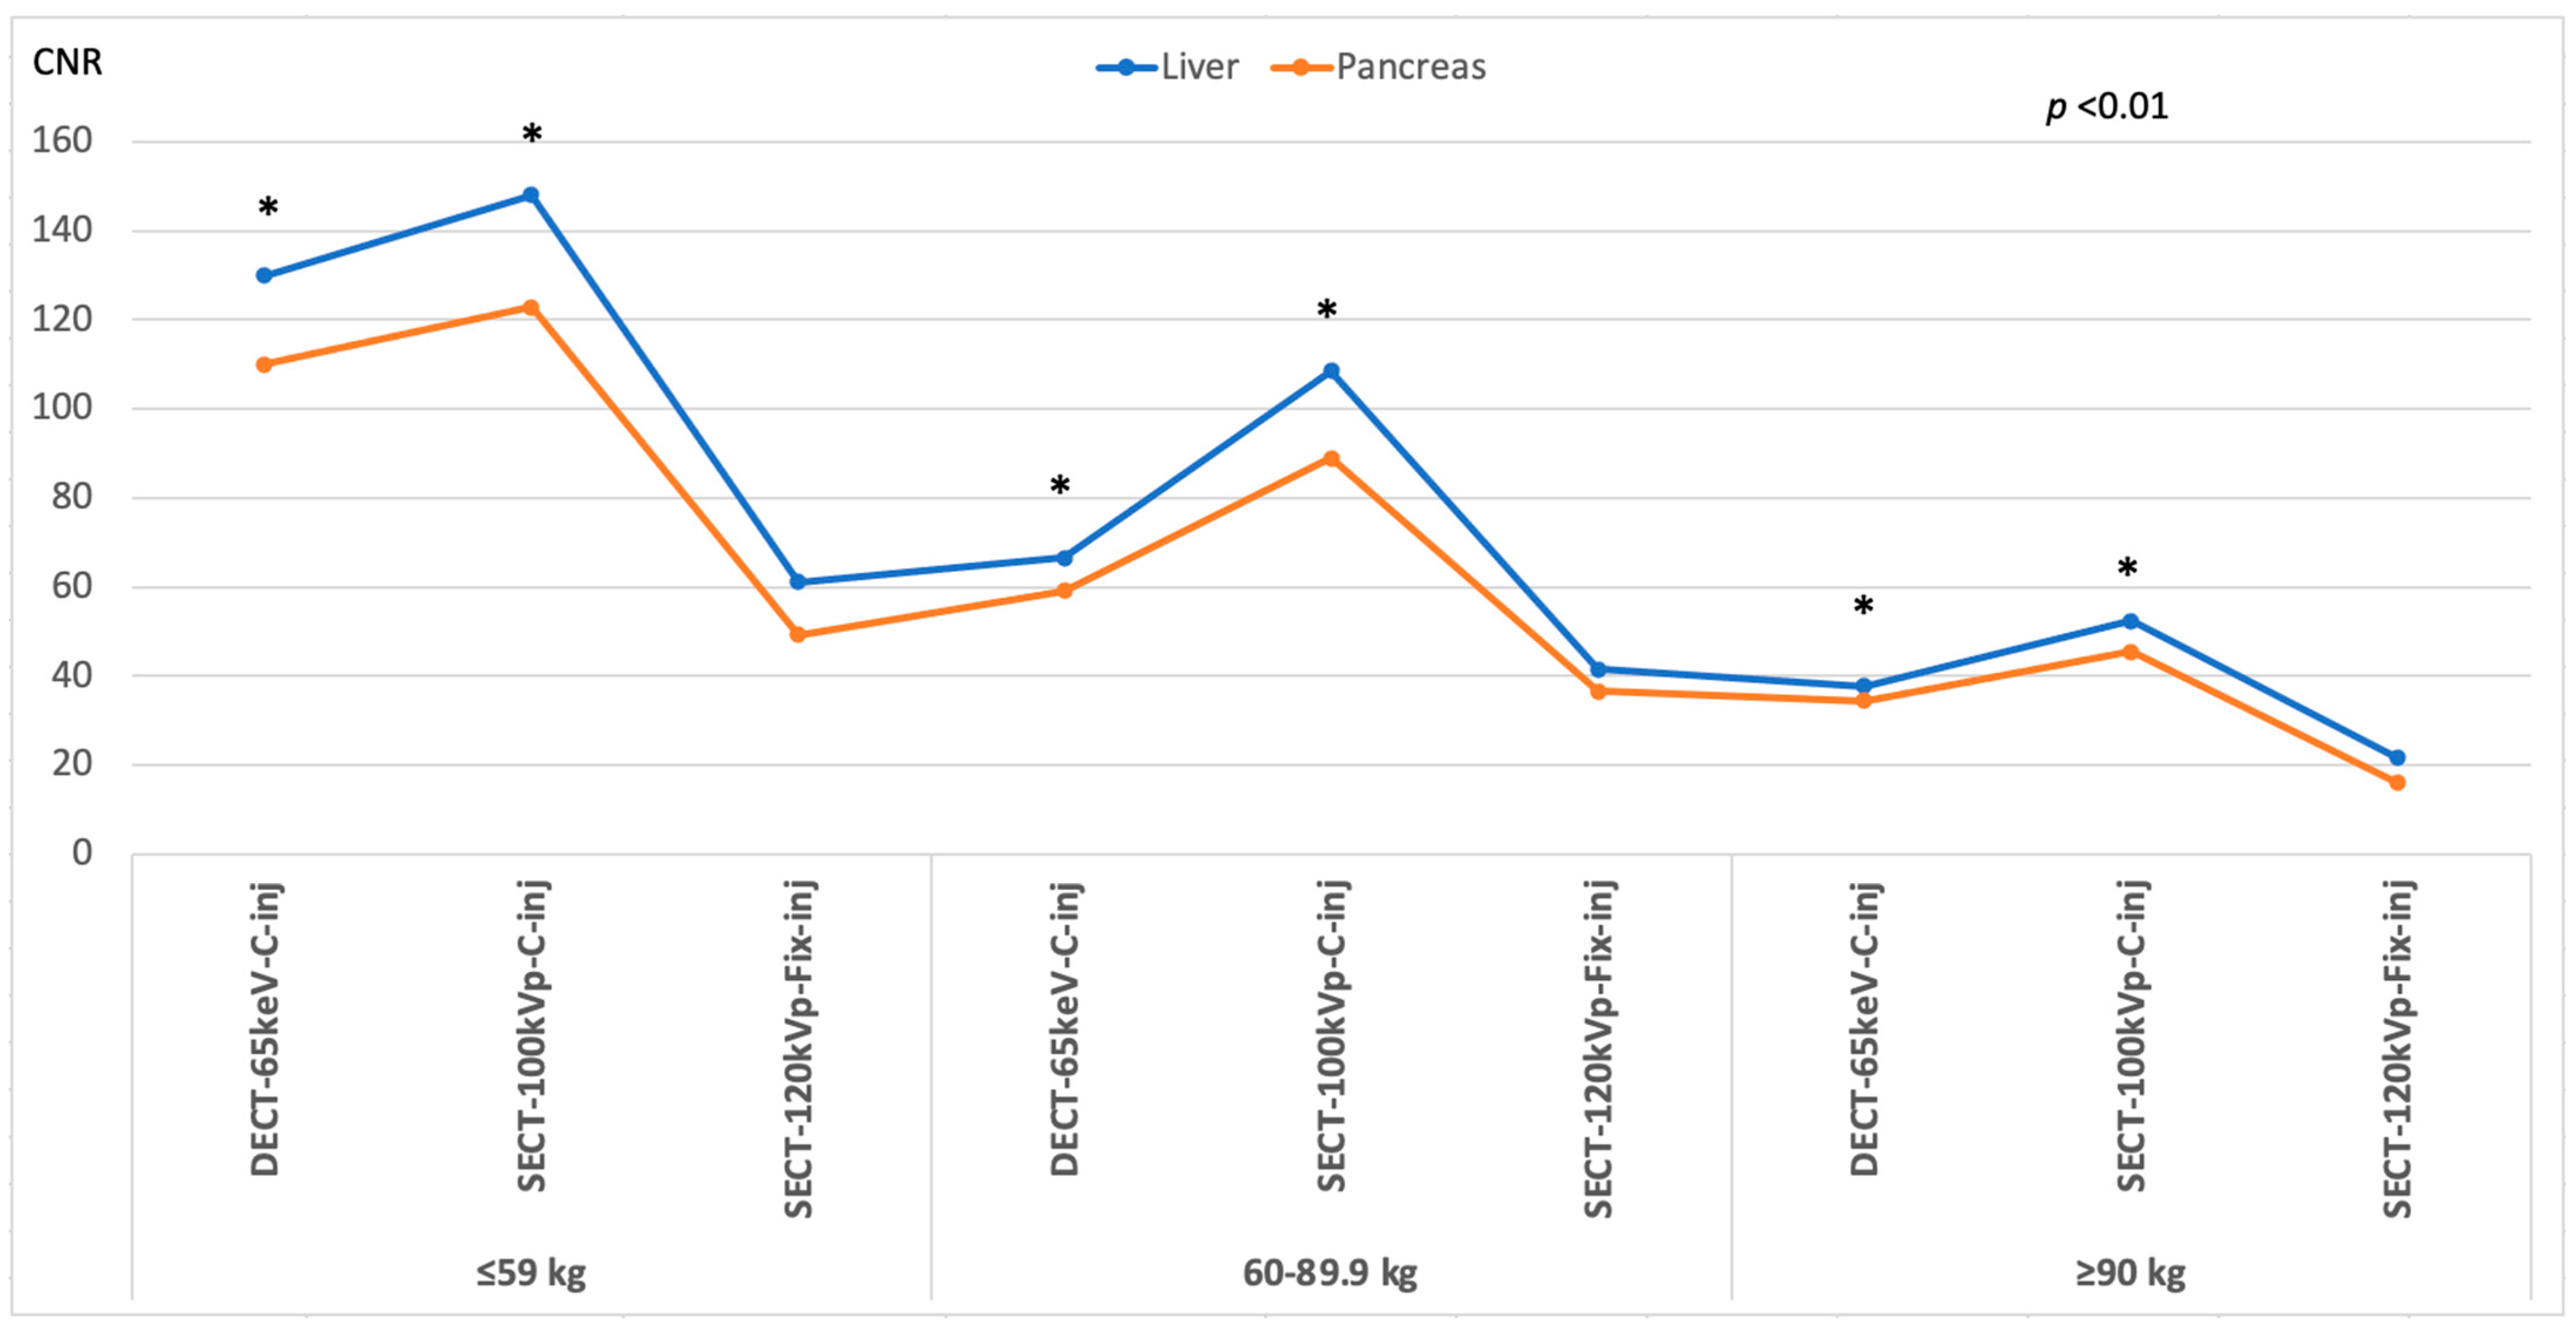
3.3. Image Quality
3.4. Radiation Dose
4. Discussion
5. Conclusions
Author Contributions
Funding
Institutional Review Board Statement
Informed Consent Statement
Data Availability Statement
Conflicts of Interest
References
- OECD.Stat. Health Expenditure and Financing. 2023. Available online: https://stats.oecd.org/Index.aspx?DataSetCode=SHA (accessed on 23 February 2023).
- Bae, K.T. Intravenous Contrast Medium Administration and Scan Timing at CT: Considerations and Approaches. Radiology 2010, 256, 32–61. [Google Scholar] [CrossRef]
- Heiken, J.P.; Brink, J.A.; McClennan, B.L.; Sagel, S.S.; Crowe, T.M.; Gaines, M.V. Dynamic incremental CT: Effect of volume and concentration of contrast material and patient weight on hepatic enhancement. Radiology 1995, 195, 353–357. [Google Scholar] [CrossRef]
- Bae, K.T.; Seeck, B.A.; Hildebolt, C.F.; Tao, C.; Zhu, F.; Kanematsu, M.; Woodard, P.K. Contrast Enhancement in Cardiovascular MDCT: Effect of Body Weight, Height, Body Surface Area, Body Mass Index, and Obesity. Am. J. Roentgenol. 2008, 190, 777–784. [Google Scholar] [CrossRef]
- Bae, K.T. Principles of Contrast Medium Delivery and Scan Timing in MDCT. In MDCT: A Practical Approach; Springer: Milan, Italy, 2006; pp. 10–24. [Google Scholar]
- Boland, G.W.L. Enhancing CT Productivity: Strategies for Increasing Capacity. Am. J. Roentgenol. 2008, 191, 3–10. [Google Scholar] [CrossRef]
- Saini, S. Multi-detector row CT: Principles and practice for abdominal applications. Radiology 2004, 233, 323–327. [Google Scholar] [CrossRef]
- Ho, L.M.; Nelson, R.C.; DeLong, D.M. Determining Contrast Medium Dose and Rate on Basis of Lean Body Weight: Does This Strategy Improve Patient-to-Patient Uniformity of Hepatic Enhancement during Multi–Detector Row CT? Radiology 2007, 243, 431–437. [Google Scholar] [CrossRef]
- George, A.J.; Manghat, N.E.; Hamilton, M.C.K. Comparison between a fixed-dose contrast protocol and a weight-based contrast dosing protocol in abdominal CT. Clin. Radiol. 2016, 71, 1314.e1–1314.e9. [Google Scholar] [CrossRef] [PubMed]
- Gleeson, T.G.; Bulugahapitiya, S. Contrast-Induced Nephropathy. Am. J. Roentgenol. 2004, 183, 1673–1689. [Google Scholar] [CrossRef] [PubMed]
- Seyal, A.R.; Arslanoglu, A.; Abboud, S.F.; Sahin, A.; Horowitz, J.M.; Yaghmai, V. CT of the Abdomen with Reduced Tube Voltage in Adults: A Practical Approach. Radiographics 2015, 35, 1922–1939. [Google Scholar] [CrossRef] [PubMed]
- Pinho, D.F.; Kulkarni, N.M.; Krishnaraj, A.; Kalva, S.P.; Sahani, D.V. Initial experience with single-source dual-energy CT abdominal angiography and comparison with single-energy CT angiography: Image quality, enhancement, diagnosis and radiation dose. Eur. Radiol. 2013, 23, 351–359. [Google Scholar] [CrossRef]
- Nakaura, T.; Nakamura, S.; Maruyama, N.; Funama, Y.; Awai, K.; Harada, K.; Uemura, S.; Yamashita, Y. Low Contrast Agent and Radiation Dose Protocol for Hepatic Dynamic CT of Thin Adults at 256–Detector Row CT: Effect of Low Tube Voltage and Hybrid Iterative Reconstruction Algorithm on Image Quality. Radiology 2012, 264, 445–454. [Google Scholar] [CrossRef]
- Marin, D.; Boll, D.T.; Mileto, A.; Nelson, R.C. State of the art: Dual-energy CT of the abdomen. Radiology 2014, 271, 327–342. [Google Scholar] [CrossRef] [PubMed]
- Feng, S.-T.; Zhu, H.; Peng, Z.; Huang, L.; Dong, Z.; Xu, L.; Huang, K.; Yang, X.; Lin, Z.; Li, Z.-P. An Individually Optimized Protocol of Contrast Medium Injection in Enhanced CT Scan for Liver Imaging. Contrast Media Mol. Imaging 2017. [Google Scholar] [CrossRef] [PubMed]
- Jensen, C.T.; Blair, K.J.; Wagner-Bartak, N.A.; Vu, L.N.; Carter, B.W.; Sun, J.; Bathala, T.K.; Gupta, S. Comparison of Abdominal Computed Tomographic Enhancement and Organ Lesion Depiction Between Weight-Based Scanner Software Contrast Dosing and a Fixed-Dose Protocol in a Tertiary Care Oncologic Center. J. Comput. Assist. Tomogr. 2019, 43, 155–162. [Google Scholar] [CrossRef]
- Martens, B.; Hendriks, B.M.F.; Eijsvoogel, N.G.; Wildberger, J.E.; Mihl, C. Individually Body Weight-Adapted Contrast Media Application in Computed Tomography Imaging of the Liver at 90 kVp. Investig. Radiol. 2019, 54, 177–182. [Google Scholar] [CrossRef]
- Wichmann, J.L.; Hardie, A.D.; Schoepf, U.J.; Felmly, L.M.; Perry, J.D.; Varga-Szemes, A.; Mangold, S.; Caruso, D.; Canstein, C.; Vogl, T.J.; et al. Single- and dual-energy CT of the abdomen: Comparison of radiation dose and image quality of 2nd and 3rd generation dual-source CT. Eur. Radiol. 2017, 27, 642–650. [Google Scholar] [CrossRef]
- Christner, J.A.; Kofler, J.M.; McCollough, C.H. Estimating Effective Dose for CT Using Dose–Length Product Compared with Using Organ Doses: Consequences of Adopting International Commission on Radiological Protection Publication 103 or Dual-Energy Scanning. Am. J. Roentgenol. 2010, 194, 881–889. [Google Scholar] [CrossRef] [PubMed]
- Yamashita, Y.; Komohara, Y.; Takahashi, M.; Uchida, M.; Hayabuchi, N.; Shimizu, T.; Narabayashi, I. Abdominal Helical CT: Evaluation of Optimal Doses of Intravenous Contrast Material—A Prospective Randomized Study. Radiology 2000, 216, 718–723. [Google Scholar] [CrossRef]
- Schoellnast, H.; Tillich, M.; Deutschmann, H.A.; Stessel, U.; Deutschmann, M.J.; Schaffler, G.J.; Schoellnast, R.; Uggowitzer, M.M. Improvement of parenchymal and vascular enhancement using saline flush and power injection for multiple-detector-row abdominal CT. Eur. Radiol. 2004, 14, 659–664. [Google Scholar] [CrossRef]
- Clark, Z.E.; Bolus, D.N.; Little, M.D.; Morgan, D.E. Abdominal rapid-kVp-switching dual-energy MDCT with reduced IV contrast compared to conventional MDCT with standard weight-based IV contrast: An intra-patient comparison. Abdom. Imaging 2015, 40, 852–858. [Google Scholar] [CrossRef]
- Leng, S.; Yu, L.; Fletcher, J.G.; McCollough, C.H. Maximizing Iodine Contrast-to-Noise Ratios in Abdominal CT Imaging through Use of Energy Domain Noise Reduction and Virtual Monoenergetic Dual-Energy CT. Radiology 2015, 276, 562–570. [Google Scholar] [CrossRef] [PubMed]
- Arana, E.; Martí-Bonmatí, L.; Tobarra, E.; Sierra, C. Cost reduction in abdominal CT by weight-adjusted dose. European J. Radiol. 2009, 70, 507–511. [Google Scholar] [CrossRef] [PubMed]
- Perrin, E.; Jackson, M.; Grant, R.; Lloyd, C.; Chinaka, F.; Goh, V. Weight-adapted iodinated contrast media administration in abdomino-pelvic CT: Can image quality be maintained? Radiography 2018, 24, 22–27. [Google Scholar] [CrossRef]
- Yanaga, Y.; Awai, K.; Nakayama, Y.; Nakaura, T.; Tamura, Y.; Hatemura, M.; Yamashita, Y. Pancreas: Patient Body Weight–tailored Contrast Material Injection Protocol versus Fixed Dose Protocol at Dynamic CT. Radiology 2007, 245, 475–482. [Google Scholar] [CrossRef]
- Agrawal, M.D.; Pinho, D.F.; Kulkarni, N.M.; Hahn, P.F.; Guimaraes, A.R.; Sahani, D.V. Oncologic applications of dual-energy CT in the abdomen. Radiographics 2014, 34, 589–612. [Google Scholar] [CrossRef] [PubMed]
- Takahashi, H.; Okada, M.; Hyodo, T.; Hidaka, S.; Kagawa, Y.; Matsuki, M.; Tsurusaki, M.; Murakami, T. Can low-dose CT with iterative reconstruction reduce both the radiation dose and the amount of iodine contrast medium in a dynamic CT study of the liver? Eur. J. Radiol. 2014, 83, 684–691. [Google Scholar] [CrossRef]
- Seifarth, H.; Puesken, M.; Kalafut, J.F.; Wienbeck, S.; Wessling, J.; Maintz, D.; Heindel, W.; Juergens, K.-W. Introduction of an individually optimized protocol for the injection of contrast medium for coronary CT angiography. Eur. Radiol. 2009, 19, 2373–2382. [Google Scholar] [CrossRef]
- Mihl, C.; Kok, M.; Altintas, S.; Kietselaer, B.L.; Turek, J.; Wildberger, J.E.; Das, M. Evaluation of individually body weight adapted contrast media injection in coronary CT-angiography. Eur. J. Radiol. 2016, 85, 830–836. [Google Scholar] [CrossRef]


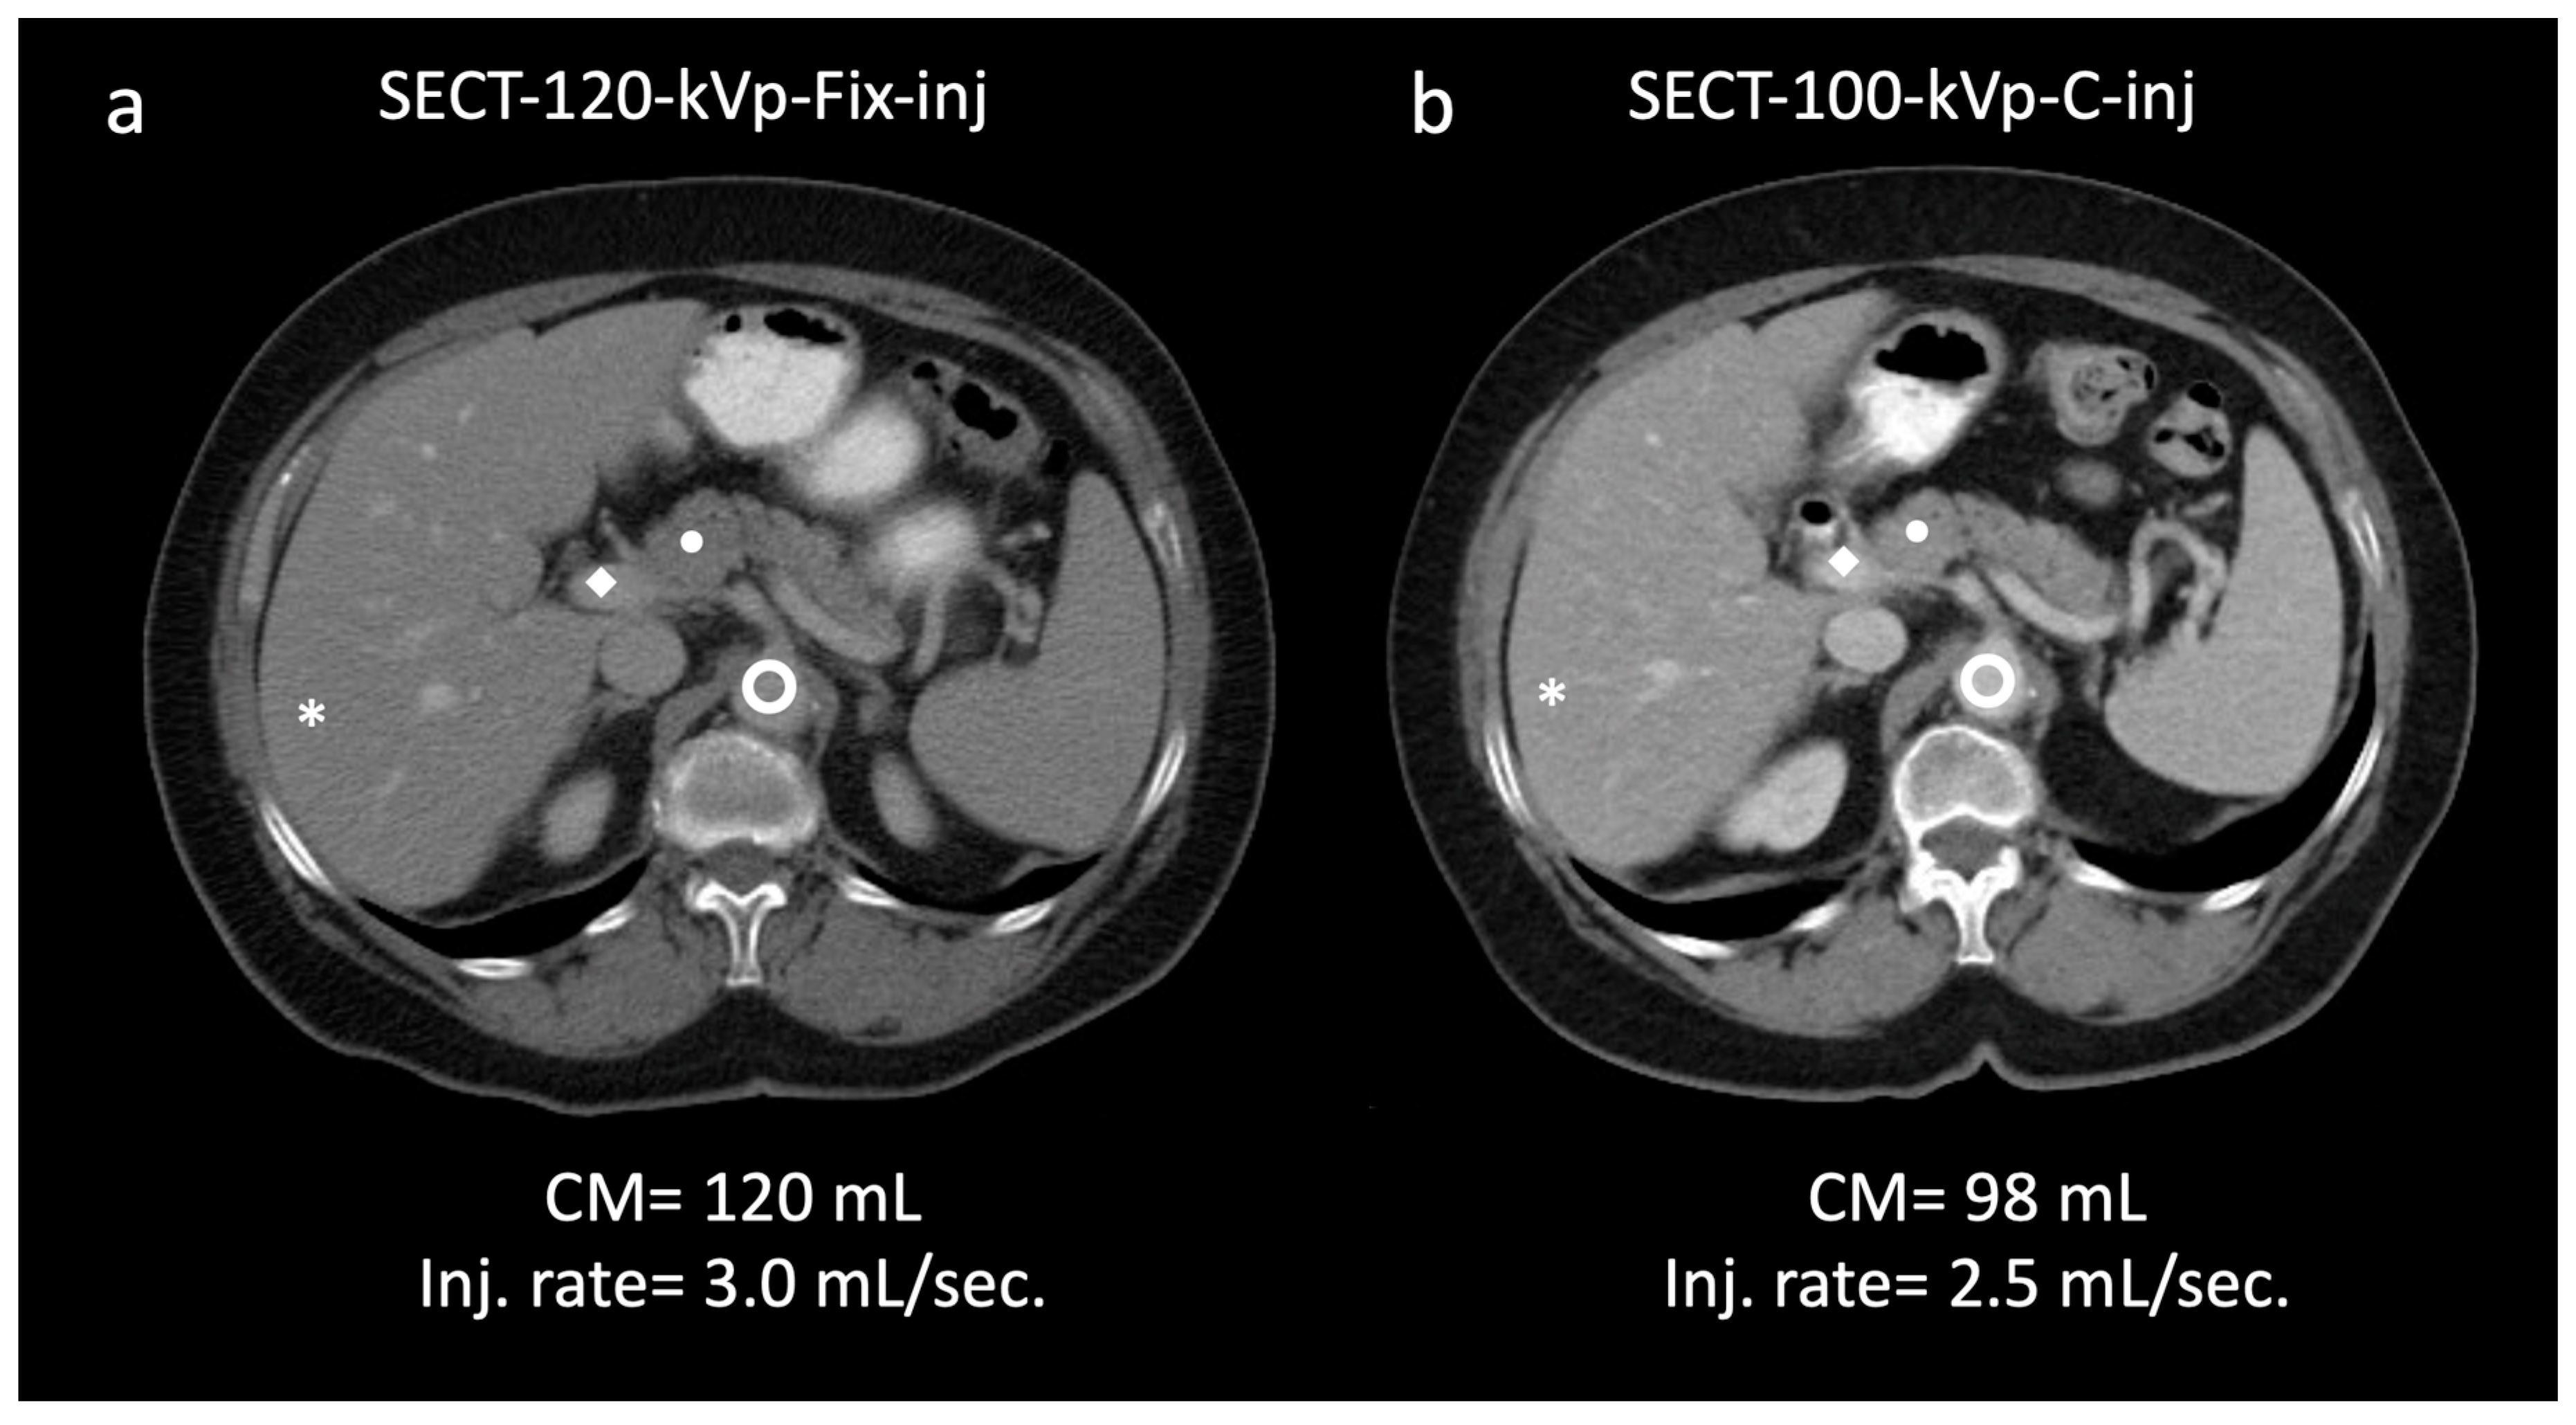
 aorta; 145.9/22.8; ◆ portal vein; 157.9/24.7 (a). In the same patient, a 100 kVp SECT with customized injection resulted in administration of reduced volume of contrast media and injection rate (98 mL; −15%; 2.5 mL/s; −16.6%, respectively) and yielded significantly higher attenuation/CNR values: * liver; 106.2/26.7 (+8.8/36.2%); ● pancreas; 93.1/22.2 (+11.0/32.9%); aorta, 167.0/30.6 (+14.4/34.2%); ◆ portal vein, 188.8/32.5 (+19.5/31.5%) (b). Subjectively, both readers rated the two scans as 5. Note—Fix-inj, fixed injection; C-inj, customized injection. SECT-100 kVp-C-inj: single-energy CT at 100 kVp with customized injections; SECT-120 kVp-Fix-inj: single-energy CT at 120 kVp with fixed injections.
aorta; 145.9/22.8; ◆ portal vein; 157.9/24.7 (a). In the same patient, a 100 kVp SECT with customized injection resulted in administration of reduced volume of contrast media and injection rate (98 mL; −15%; 2.5 mL/s; −16.6%, respectively) and yielded significantly higher attenuation/CNR values: * liver; 106.2/26.7 (+8.8/36.2%); ● pancreas; 93.1/22.2 (+11.0/32.9%); aorta, 167.0/30.6 (+14.4/34.2%); ◆ portal vein, 188.8/32.5 (+19.5/31.5%) (b). Subjectively, both readers rated the two scans as 5. Note—Fix-inj, fixed injection; C-inj, customized injection. SECT-100 kVp-C-inj: single-energy CT at 100 kVp with customized injections; SECT-120 kVp-Fix-inj: single-energy CT at 120 kVp with fixed injections.
aorta; 145.9/22.8; ◆ portal vein; 157.9/24.7 (a). In the same patient, a 100 kVp SECT with customized injection resulted in administration of reduced volume of contrast media and injection rate (98 mL; −15%; 2.5 mL/s; −16.6%, respectively) and yielded significantly higher attenuation/CNR values: * liver; 106.2/26.7 (+8.8/36.2%); ● pancreas; 93.1/22.2 (+11.0/32.9%); aorta, 167.0/30.6 (+14.4/34.2%); ◆ portal vein, 188.8/32.5 (+19.5/31.5%) (b). Subjectively, both readers rated the two scans as 5. Note—Fix-inj, fixed injection; C-inj, customized injection. SECT-100 kVp-C-inj: single-energy CT at 100 kVp with customized injections; SECT-120 kVp-Fix-inj: single-energy CT at 120 kVp with fixed injections. aorta, 149.9/23.5; ◆ portal vein, 162.0/25.6 (a). In the same patient, a 65 keV virtual monochromatic image reconstructed from dual-energy CT (DECT) acquisition with customized injection (b) resulted in administration of a reduced volume of contrast media and injection rate (74 mL; −17.7%; 2.2 mL/s; −15.3%, respectively) and yielded significantly higher values of attenuation/CNR: * liver, 128.7/30.7 (+12/36.4%); ● pancreas, 113.3/24.6 (+18.7/25.5%); aorta, 186.6/32.7 (+24.4/39.1%); ◆ portal vein, 210.5/32.57 (+29.9/37.1%) (b). Subjectively, both readers rated the two scans as 5. DECT-65 keV-C-inj: dual-energy CT at 65 keV with customized injections; SECT-120 kVp-Fix-inj: single-energy CT at 120 kVp with fixed injections.
aorta, 149.9/23.5; ◆ portal vein, 162.0/25.6 (a). In the same patient, a 65 keV virtual monochromatic image reconstructed from dual-energy CT (DECT) acquisition with customized injection (b) resulted in administration of a reduced volume of contrast media and injection rate (74 mL; −17.7%; 2.2 mL/s; −15.3%, respectively) and yielded significantly higher values of attenuation/CNR: * liver, 128.7/30.7 (+12/36.4%); ● pancreas, 113.3/24.6 (+18.7/25.5%); aorta, 186.6/32.7 (+24.4/39.1%); ◆ portal vein, 210.5/32.57 (+29.9/37.1%) (b). Subjectively, both readers rated the two scans as 5. DECT-65 keV-C-inj: dual-energy CT at 65 keV with customized injections; SECT-120 kVp-Fix-inj: single-energy CT at 120 kVp with fixed injections.
aorta, 149.9/23.5; ◆ portal vein, 162.0/25.6 (a). In the same patient, a 65 keV virtual monochromatic image reconstructed from dual-energy CT (DECT) acquisition with customized injection (b) resulted in administration of a reduced volume of contrast media and injection rate (74 mL; −17.7%; 2.2 mL/s; −15.3%, respectively) and yielded significantly higher values of attenuation/CNR: * liver, 128.7/30.7 (+12/36.4%); ● pancreas, 113.3/24.6 (+18.7/25.5%); aorta, 186.6/32.7 (+24.4/39.1%); ◆ portal vein, 210.5/32.57 (+29.9/37.1%) (b). Subjectively, both readers rated the two scans as 5. DECT-65 keV-C-inj: dual-energy CT at 65 keV with customized injections; SECT-120 kVp-Fix-inj: single-energy CT at 120 kVp with fixed injections.

| ≤59.9 kg | 60–89.9 kg | ≥90 kg | ||||
|---|---|---|---|---|---|---|
| SECT-100 kVp | DECT (65 keV) | SECT-100 kVp | DECT (65 keV) | SECT-100 kVp | DECT (65 keV) | |
| N | 22 | 22 | 41 | 40 | 28 | 21 |
| Male/Female | 2/20 | 2/20 | 21/20 | 17/23 | 22/6 | 15/6 |
| Age, years | 65.6 ± 14.9 | 62.6 ± 13.3 | 61.4 ± 15.7 | 58.1 ± 12.5 | 55.2 ± 14.1 | 60.2 ± 6.9 |
| (22–91) | (37–83) | (24–92) | (27–76) | (25–80) | (45–71) | |
| Body mass index (BMI), kg/m2 | 21.1 ± 2.2 | 21.8 ± 3.3 | 26.7 ± 2.2 | 26.4 ± 3.3 | 33.2 ± 5.4 | 31.7 ± 4.1 |
| (17.1–26.3) | (16.1–32.5) | (21.8–34.1) | (20.0–37.7) | (27.1–53.3) | (27–43.4) | |
| Weight, kg | 53.9 ± 3.9 | 53.0 ± 5.4 | 74.1 ± 6.2 | 73.6 ± 8.6 | 104.4 ± 11.2 | 99.5 ± 8.3 |
| (44–59) | (39.5–59) | (60.7–86.1) | (60.3–88.9) | (91–130.6) | (90–114.3) | |
| CT-1 * | CT-2 ** | CT-1/CT-2 | |
|---|---|---|---|
| Acquisition mode | SECT | DECT | SECT |
| Tube voltage, kVp (reference) Automatic tube voltage selection (min/max kVp) | 100 Present (80/120) | 80/140 Not applicable | 120 Present (80/120) |
| Automatic tube current modulation | Enabled For patients ≤ 68.9 kg 200/370 mAs For patients ≥ 69 kg 350/630 mAs | Enabled For patients ≤ 68.9 kg 200/250 mAs For patients ≥ 69 kg 270/330 mAs | |
| Rotation time | 0.5 | ||
| Collimation | 64 × 0.6 | ||
| Pitch | 0.9 | ||
| Iterative reconstruction | ASIR-V 40% | ASIR-V 40% | ASIR-V 40% |
| Kernel | Abdomen, standard | ||
| Virtual monochromatic level | Not Applicable | 65 keV | Not Applicable |
| Slice thickness | 5 mm | ||
| Slice Increment | 5 mm | ||
| Weight | ≤59.9 kg | 60–89.9 kg | ≥90 kg | ||||||
|---|---|---|---|---|---|---|---|---|---|
| SECT-100 kVp-C-inj vs. SECT-120 kVp-Fix-inj | |||||||||
| Injection Protocol | C-inj | Fix-inj | p | C-inj | Fix-inj | p | C-inj | Fix-inj | p |
| n | 22 | 41 | 28 | ||||||
| Inj. Rate | 1.88 ± 0.10 | 2.26 ± 0.41 | 0.001 | 2.31 ± 0.56 | 2.60 ± 0.47 | 0.001 | 2.82 ± 0.43 | 3.00 ± 0.50 | 0.037 |
| (mL/s) | |||||||||
| CM volume | 70.46 ± 1.71 | 80.06 ± 0.12 | <0.001 | 81.92 ± 7.12 | 90.00 ± 0.16 | <0.001 | 109.13 ± 6.21 | 120.04 ± 0.10 | <0.001 |
| (mL) | |||||||||
| DECT(65keV)-C-inj vs. SECT-120kVp-Fix-inj | |||||||||
| n | 22 | 40 | 21 | ||||||
| Inj. Rate (mL/s) | 2.15 ± 0.67 | 2.48 ± 0.65 | 0.001 | 2.33 ± 0.65 | 2.74 ± 0.59 | <0.001 | 2.88 ± 0.53 | 3.07 ± 0.53 | 0.034 |
| CM volume | 70.66 ± 1.20 | 80.01 ± 0.05 | <0.001 | 80.64 ± 8.26 | 89.97 ± 0.16 | <0.001 | 107.28 ± 9.06 | 120.00 ± 0.00 | <0.001 |
| ≤59.9 kg | 60–89.9 kg | ≥90 kg | |||||||
|---|---|---|---|---|---|---|---|---|---|
| C-inj | Fix-inj | p-Value | C-inj | Fix-inj | p-Value | C-inj | Fix-inj | p-Value | |
| SECT-100kVp-C-inj vs. SECT-120kVp-Fix-inj | |||||||||
| Noise | |||||||||
| Liver | 10.93 | 16.52 | <0.001 | 11.47 | 13.81 | <0.001 | 13.24 | 16.21 | 0.013 |
| ±1.86 | ±4.20 | ±2.11 | ±3.06 | ±3.32 | ±4.46 | ||||
| Pancreas | 13.99 | 18.58 | <0.001 | 14.15 | 17.78 | <0.001 | 16.89 | 18.29 | 0.025 |
| ±3.11 | ±3.67 | ±3.03 | ±3.37 | ±3.27 | 4.52 | ||||
| Signal-to-noise ratio | |||||||||
| Liver | 12.42 | 7.96 | <0.001 | 10.57 | 7.88 | <0.001 | 8.51 | 6.41 | <0.001 |
| ±3.26 | ±1.65 | ±2.85 | ±2.17 | ±2.54 | ±2.06 | ||||
| Pancreas | 8.40 | 5.75 | <0.001 | 7.19 | 5.36 | <0.001 | 6.13 | 4.80 | <0.001 |
| ±2.13 | ±1.55 | ±1.93 | ±1.45 | ±1.66 | ±1.30 | ||||
| Contrast-to-noise ratio | |||||||||
| Liver | 32.61 | 21.64 | <0.001 | 29.89 | 22.79 | <0.001 | 26.76 | 19.65 | 0.001 |
| ±7.03 | ±4.32 | ±6.89 | ±5.07 | ±6.01 | ±6.63 | ||||
| Pancreas | 25.83 | 18.04 | <0.001 | 24.20 | 18.43 | <0.001 | 22.22 | 16.75 | <0.001 |
| ±4.47 | ±3.97 | ±5.59 | ±3.74 | ±4.76 | ±5.48 | ||||
| DECT(65-keV)-C-inj vs. SECT-120kVp-Fix-inj | |||||||||
| Noise | |||||||||
| Liver | 10.61 | 14.07 | <0.001 | 12.12 | 15.06 | <0.001 | 12.81 | 14.91 | 0.035 |
| ±2.07 | ±2.93 | ±2.67 | ±2.84 | ±1.92 | ±4.11 | ||||
| Pancreas | 13.95 | 16.99 | 0.010 | 15.27 | 16.55 | 0.008 | 16.10 | 19.39 | 0.006 |
| ±2.67 | ±4.67 | ±2.78 | ±2.89 | ±2.38 | ±4.71 | ||||
| Signal-to-noise ratio | |||||||||
| Liver | 14.12 | 9.17 | <0.001 | 11.26 | 7.90 | <0.001 | 9.21 | 7.41 | 0.004 |
| ±3.64 | ±2.04 | ±3.48 | ±1.80 | ±2.11 | ±2.18 | ||||
| Pancreas | 9.70 | 6.77 | <0.001 | 7.69 | 6.05 | <0.001 | 6.63 | 4.91 | <0.001 |
| ±2.29 | ±1.99 | ±2.05 | ±2.22 | ±1.16 | ±1.31 | ||||
| Contrast-to-noise ratio | |||||||||
| Liver | 33.57 | 25.28 | <0.001 | 30.74 | 22.57 | <0.001 | 22.63 | 17.63 | 0.001 |
| ±6.30 | ±4.86 | ±7.63 | ±3.91 | ±4.73 | ±3.85 | ||||
| Pancreas | 27.11 | 20.96 | <0.001 | 22.08 | 16.47 | <0.001 | 21.70 | 16.67 | 0.001 |
| ±4.30 | ±4.72 | ±5.72 | ±3.67 | ±4.67 | ±4.14 | ||||
| ≤59.9 kg | 60–89 kg | ≥90 kg | Overall p-Value | p-Value ≤59.9 kg vs. 60–89 kg | p-Value ≤59.9 kg vs. 90 kg | p-Value 60–89 kg vs. ≥ 90 kg | |
|---|---|---|---|---|---|---|---|
| SECT-100kVp-C-inj | |||||||
| Attenuation | |||||||
| Liver | 130.60 | 117.13 | 106.24 | <0.001 | 0.032 | <0.001 | NS |
| ±13.89 | ±22.55 | ±20.53 | |||||
| Pancreas | 112.49 | 97.73 | 93.131 | <0.001 | 0.002 | <0.001 | NS |
| ±15.53 | ±18.50 | ±14.63 | |||||
| Noise | |||||||
| Liver | 10.93 | 11.47 | 13.24 | <0.01 | NS | 0.004 | 0.009 |
| ±1.86 | ±2.11 | ±3.32 | |||||
| Pancreas | 13.99 | 14.15 | 16.89 | 0.04 | NS | NS | NS |
| ±3.11 | ±3.03 | ±3.27 | |||||
| Signal-to-noise ratio | |||||||
| Liver | 12.42 | 10.57 | 8.51 | <0.001 | 0.037 | <0.001 | 0.008 |
| ±3.26 | ±2.85 | ±2.54 | |||||
| Pancreas | 8.40 | 7.19 | 6.13 | <0.001 | 0.042 | <0.001 | NS |
| ±2.13 | ±1.93 | ±1.66 | |||||
| Contrast-to-noise ratio | |||||||
| Liver | 32.61 | 29.89 | 26.76 | NS | NS | NS | NS |
| ±7.03 | ±6.89 | ±6.01 | |||||
| Pancreas | 25.83 | 24.20 | 22.22 | NS | NS | NS | NS |
| ±4.47 | ±5.59 | ±4.76 | |||||
| DECT(65-keV)-C-inj | |||||||
| Attenuation | |||||||
| Liver | 143.77 | 128.71 | 115.04 | <0.001 | <0.001 | <0.001 | 0.002 |
| ±17.24 | ±12.17 | ±15.76 | |||||
| Pancreas | 130.46 | 113.33 | 105.48 | <0.001 | <0.001 | <0.001 | NS |
| ±16.73 | ±16.91 | ±18.49 | |||||
| Noise | |||||||
| Liver | 10.61 | 12.12 | 12.81 | <0.010 | 0.046 | 0.008 | NS |
| ±2.07 | ±2.67 | ±1.92 | |||||
| Pancreas | 13.95 | 15.27 | 16.10 | 0.031 | NS | 0.025 | NS |
| ±2.67 | ±2.78 | ±2.38 | |||||
| Signal-to-noise ratio | |||||||
| Liver | 14.12 | 11.26 | 9.21 | <0.001 | 0.003 | <0.001 | NS |
| ±3.64 | ±3.48 | ±2.11 | |||||
| Pancreas | 9.70 | 7.69 | 6.63 | <0.001 | <0.001 | <0.001 | NS |
| ±2.29 | ±2.05 | ±1.16 | |||||
| Contrast-to-noise ratio | |||||||
| Liver | 33.57 | 30.74 | 22.63 | <0.001 | <0.001 | <0.001 | NS |
| ±6.30 | ±7.63 | ±4.73 | |||||
| Pancreas | 27.11 | 22.08 | 21.70 | <0.001 | 0.001 | 0.002 | NS |
| ±4.30 | ±5.72 | ±4.67 | |||||
| SECT-120kVp-Fix-inj | |||||||
| Attenuation | |||||||
| Liver | 115.27 | 101.51 | 93.41 | <0.001 | <0.001 | <0.001 | 0.012 |
| ±18.66 | ±19.04 | ±18.86 | |||||
| Pancreas | 105.25 | 93.53 | 86.75 | <0.001 | <0.001 | <0.001 | 0.040 |
| ±16.23 | ±15.23 | ±15.77 | |||||
| Noise | |||||||
| Liver | 16.54 | 15.80 | 17.21 | NS | NS | NS | NS |
| ±4.18 | ±3.40 | ±4.70 | |||||
| Pancreas | 17.78 | 17.20 | 18.75 | NS | NS | NS | NS |
| ±4.23 | ±3.20 | ±4.58 | |||||
| Signal-to-noise ratio | |||||||
| Liver | 7.41 | 6.79 | 5.84 | <0.001 | NS | <0.001 | 0.010 |
| ±2.20 | ±2.22 | ±2.01 | |||||
| Pancreas | 6.26 | 5.69 | 4.85 | <0.001 | 0.046 | <0.001 | 0.013 |
| ±1.84 | ±1.87 | ±1.28 | |||||
| Contrast-to-noise ratio | |||||||
| Liver | 19.93 | 17.11 | 16.23 | <0.001 | <0.001 | <0.001 | NS |
| ±5.97 | ±4.45 | ±5.24 | |||||
| Pancreas | 18.40 | 16.45 | 15.94 | 0.033 | 0.076 | 0.037 | NS |
| ±5.33 | ±4.23 | ±5.24 | |||||
| SECT-100 kVp | DECT-65 keV | |
|---|---|---|
| R1 vs. R2 | 100 (95.3–100.0) | 98.8 (92.5–99.9) |
| Customized injections | n = 174/174 | n = 172/174 |
| R1 customized vs. fixed injections | 100 (95.3–100.0) | 98.8 (92.5–99.9) |
| n = 174/174 | n = 172/174 | |
| R2 customized vs. fixed injections | 100 (95.3–100.0) | 98.8 (92.5–99.9) |
| n = 174/174 | n = 172/174 |
| Radiation Dose | |||||||||
|---|---|---|---|---|---|---|---|---|---|
| ≤59.9 kg | 60–89.9 kg | ≥90 kg | |||||||
| SECT-100-kVp-C-inj | SECT-120-kVp-Fix-inj | p-Value | SECT-100-kVp-C-inj | SECT-120-kVp-Fix-inj | p-Value | SECT-100-kVp-C-inj | SECT-120-kVp-Fix-inj | p-Value | |
| Number of patients | 22 | 41 | 28 | ||||||
| CTDIvol, mGy | 5.10 ±0.91 | 7.61 ±2.37 | <0.001 | 6.61 ±1.84 | 10.93 ±2.63 | <0.001 | 10.47 ±2.72 | 15.83 ±4.26 | <0.001 |
| DLP, mGy*cm | 245.29 ±41.63 | 368.77 ±115.44 | 325.58 ±84.64 | 531.77 ±126.94 | 573.78 ±159.81 | 830.66 ±253.92 | |||
| ED, mSv | 4.16 ±0.70 | 6.26 ±1.96 | 5.53 ±1.43 | 9.04 ±2.15 | 9.75 ±2.71 | 14.13 ±4.31 | |||
| DECT-C-inj | SECT-120-kVp-Fix-inj | DECT-C-inj | SECT-120-kVp-Fix-inj | DECT-C-inj | SECT-120-kVp-Fix-inj | ||||
| Number of patients | 22 | 40 | 21 | ||||||
| CTDIvol, mGy | 8.29 ±2.41 | 7.47 ±2.40 | 0.182 | 10.69 ±3.58 | 11.32 ±2.40 | 0.179 | 17.19 ±3.44 | 17.05 ±1.77 | 0.877 |
| DLP, mGy*cm | 392.72 ±117.20 | 335.52 ±104.97 | 0.078 | 552.14 ±192.13 | 562.07 ±121.12 | 0.715 | 877.20 ±207.30 | 842.24 ±163.88 | 0.623 |
| ED, mSv | 6.67 ±1.99 | 5.70 ±1.78 | 9.40 ±3.22 | 9.60 ±2.05 | 14.91 ±3.52 | 14.31 ±2.78 | |||
Disclaimer/Publisher’s Note: The statements, opinions and data contained in all publications are solely those of the individual author(s) and contributor(s) and not of MDPI and/or the editor(s). MDPI and/or the editor(s) disclaim responsibility for any injury to people or property resulting from any ideas, methods, instructions or products referred to in the content. |
© 2023 by the authors. Licensee MDPI, Basel, Switzerland. This article is an open access article distributed under the terms and conditions of the Creative Commons Attribution (CC BY) license (https://creativecommons.org/licenses/by/4.0/).
Share and Cite
Macri, F.; Khasanova, E.; Niu, B.T.; Parakh, A.; Patino, M.; Kambadakone, A.; Sahani, D.V. Optimal Abdominal CT Image Quality in Non-Lean Patients: Customization of CM Injection Protocols and Low-Energy Acquisitions. Diagnostics 2023, 13, 2279. https://doi.org/10.3390/diagnostics13132279
Macri F, Khasanova E, Niu BT, Parakh A, Patino M, Kambadakone A, Sahani DV. Optimal Abdominal CT Image Quality in Non-Lean Patients: Customization of CM Injection Protocols and Low-Energy Acquisitions. Diagnostics. 2023; 13(13):2279. https://doi.org/10.3390/diagnostics13132279
Chicago/Turabian StyleMacri, Francesco, Elina Khasanova, Bonnie T. Niu, Anushri Parakh, Manuel Patino, Avinash Kambadakone, and Dushyant V. Sahani. 2023. "Optimal Abdominal CT Image Quality in Non-Lean Patients: Customization of CM Injection Protocols and Low-Energy Acquisitions" Diagnostics 13, no. 13: 2279. https://doi.org/10.3390/diagnostics13132279
APA StyleMacri, F., Khasanova, E., Niu, B. T., Parakh, A., Patino, M., Kambadakone, A., & Sahani, D. V. (2023). Optimal Abdominal CT Image Quality in Non-Lean Patients: Customization of CM Injection Protocols and Low-Energy Acquisitions. Diagnostics, 13(13), 2279. https://doi.org/10.3390/diagnostics13132279