Abstract
Background: Pulmonary hypertension (PH) is known to alter the biventricular shape and temporal phases of the cardiac cycle. The presence of interventricular septal (IVS) displacement has been associated with the severity of PH. There has been limited cardiac magnetic resonance (CMR) data regarding the temporal parameters of the cardiac cycle in PH. This study aimed to quantify the temporal changes in the cardiac cycle derived from CMR in PH patients with and without IVS displacement and sought to understand the mechanism of cardiac dysfunction in the cardiac cycle. Methods: Patients with PH who had CMR and right heart catheterization (RHC) examinations were included retrospectively. Patients were divided into an IVS non-displacement (IVSND) group and an IVS displacement (IVSD) group according to IVS morphology, as observed on short-axis cine CMR images. Additionally, age-matched healthy volunteers were included as the health control (HC). Temporal parameters, IVS displacement, ventricular volume and functional parameters were obtained by CMR, and pulmonary hemodynamics were obtained by RHC. The risk stratification of the PH patients was also graded according to the guidelines. Results: A total of 70 subjects were included, consisting of 33 IVSD patients, 15 IVSND patients, and 22 HC patients. In the IVSND group, only the right ventricle ejection fraction (RVEF) was decreased in the ventricular function, and no temporal change in the cardiac cycle was found. A prolonged isovolumetric relaxation time (IRT) and shortened filling time (FT) in both ventricles, along with biventricular dysfunction, were detected in the IVSD group (p < 0.001). The IRT of the right ventricle (IRTRV) and FT of the right ventricle (FTRV) in the PH patients were associated with pulmonary vascular resistance, right cardiac index, and IVS curvature, and the IRTRV was also associated with the RVEF in a multivariate regression analysis. A total of 90% of the PH patients in the IVSD group were stratified into intermediate- and high-risk categories, and they showed a prolonged IRTRV and a shortened FTRV. The IRTRV was also the predictor of the major cardiovascular events. Conclusions: The temporal changes in the cardiac cycle were related to IVS displacement and mainly impacted the diastolic period of the two ventricles in the PH patients. The IRT and FT changes may provide useful pathophysiological information on the progression of PH.
1. Introduction
The right ventricle (RV) and left ventricle (LV) work within a distensible pericardium and are connected to each other through the interventricular septum (IVS), which shares myocardial fibers with both ventricles and accommodates the interactions between the two ventricles [1]. Therefore, the overloading of the RV pressure and volume affects not only the RV morphology and function, but also the LV morphology and function, in both the systolic and diastolic phases [2].
Increased pulmonary arterial pressure (PAP) can lead to prolonged and inhomogeneous RV contraction and has been associated with negative ventricular–ventricular interactions in pulmonary hypertension (PH) [3,4]. There is also evidence that the mechanism of RV-induced LV discoordination involves a combination of delayed early systolic electromechanical activation, late-systolic IVS shift, and prolonged post-systolic IVS thickening [5]. IVS displacement is defined as a flattening or bowing toward the LV [6], and it is observed in patients with PH. The presence of IVS displacement has been associated with the severity of PH [7] and may impair the LV filling dynamics [8]. IVS displacement is considered to be a consequence of the prolonged contraction of the RV free wall relative to that of the IVS and the LV free wall, causing interventricular relaxation dyssynchrony [9]. Therefore, IVS displacement causes the ventricular interdependency to become visible in PH. The simulations using the computational model have shown that the altered duration of the RV free wall contraction and profound IVS dyskinesia are associated with interventricular mechanical discoordination and decreased early LV filling in PH [10]. Nevertheless, the computational simulations of PH cannot explain the cases of all PH patients, especially in regard to the severe symptomatic PH patients.
Cardiac magnetic resonance (CMR) imaging is a non-invasive, robust diagnostic follow-up tool used for PH patients [11]. Cine CMR imaging is the reference standard for the evaluation of the morphology, volume, and function of both the LV and RV [12], and its value in the evaluation of patients with PH is increasingly recognized [12]. Cine CMR is able to describe the morphological changes in IVS to give a detailed assessment of the severity of PH [13]. It can display the opening and closure of the aortic valves, pulmonary arterial valves, mitral valves, and tricuspid valves distinctly [14], so that the temporal parameters of the cardiac cycle can be derived accurately. However, limited CMR data are available regarding the changes in the cardiac cycle in PH patients.
The goal of this study was to quantify the temporal changes in the cardiac cycle in PH patients with different IVS shapes and their relationship with the cardiac function using CMR, and to understand the mechanism of cardiac dysfunction in the cardiac cycle.
2. Materials and Methods
2.1. Study Design and Patient Enrollment
Data were obtained from the records of adult patients who were diagnosed with or suspected of having PH from May 2012 to August 2018, who had been examined by CMR. The eligible patients retrospectively included in this study were those who were diagnosed with PH by right heart catheterization (RHC), as defined by the European Society of Cardiology [15], but who had not received any treatment. The interval between the CMR and the RHC examinations was less than a week. All the patients were in sinus rhythm. All patients whose etiology was not precapillary PH were excluded because of their different hemodynamic conditions. Precapillary PH was defined as a mean pulmonary arterial pressure (mPAP) of ≥25 mmHg with a pulmonary artery wedge pressure (PAWP) of ≤15 mmHg and pulmonary vascular resistance (PVR) of >3 Wood units, measured by RHC [15]. Patients who were aged below 18 years or those whose CMR image qualities did not meet the post-processing requirements were excluded. All the PH patients were divided into two groups according to IVS morphology, observed on short-axis cine CMR images. The PH patients with IVS flattening or even bowing toward the LV were classified as the IVS displacement (IVSD) group, while the PH patients without IVS displacement were classified as the IVS non-displacement (IVSND) group. Additionally, 22 age-matched healthy volunteers with no evidence of any heart diseases also underwent CMR examination and were included as the health control (HC) group (Figure 1). The study was approved by the hospital research ethics committee and conducted in compliance with all the clinical practice requirements as prescribed by the committee. The requirement of informed consent was waived.
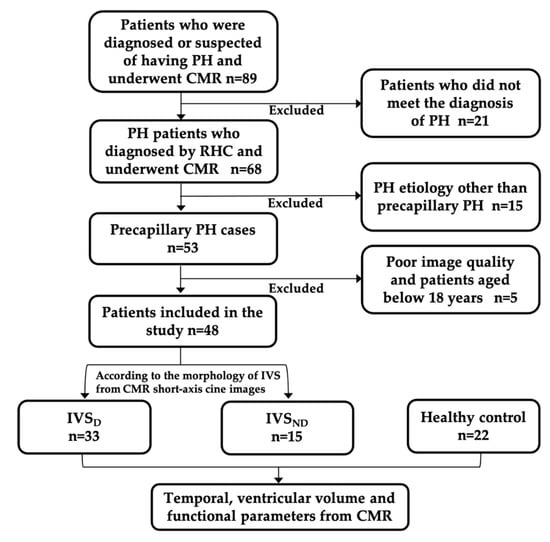
Figure 1.
Patient flowchart. PH, pulmonary hypertension; CMR, cardiac magnetic resonance; RHC, right heart catheterization; IVSND, pulmonary hypertension patients without interventricular septum displacement; IVSD, pulmonary hypertension patients with interventricular septum displacement.
2.2. CMR Examination
CMR was performed on a 3.0 T MR scanner (GE Healthcare, Discovery MR 750, Milwaukee, WI, USA) with an 8-channel cardiac coil, using a vector-cardiographic method for electrocardiogram gating. The short-axis cine CMR images (slice thickness = 8 mm), 4-chamber cine images (slice thickness = 6 mm), and LV and RV outflow tracts (slice thickness = 6 mm) were acquired using fast imaging employing steady-state acquisition (FIESTA) during breath-holds. The acquisition parameters were as follows: 20 frames per cardiac cycle, repetition time 3.40 to 3.60 ms, echo time 1.50 to 1.60 ms, flip angle = 45°, bandwidth = 125 KHz/pixel, field of view = 35 cm × 35 cm, matrix = 224 × 224, and NEX = 1.
2.3. CMR Image Analysis
The CMR image analysis was performed with Report Card 3.7 on GE Advantage Workstation 4.6. The analysis of the IVS morphology was performed using the short-axis cine CMR images, as previously described in the literature [12,13,14], including the interventricular septal curvature (CIVS) and curvature ratio (CR). The RV and LV function analysis was also performed using the short-axis cine CMR images. The RV and LV endocardial and epicardial borders were automatically traced with manual adjustments to obtain the end-diastolic volume (EDV), end-systolic volume (ESV), stroke volume (SV) and ejection fraction (EF). The papillary muscles and trabeculae were included in the ventricular cavity volume. The myocardial mass (MM) was calculated by multiplying the volume of the ventricular myocardium in the end-diastolic phase with its density (1.05 g/cm3). The ventricular mass index (VMI) was calculated by dividing the RVMM by the LVMM. All the cardiac functional parameters were divided by the specific body surface area (BSA) for normalization and recorded as the end-diastolic volume index (EDVI), end-systolic volume index (ESVI), stroke volume index (SVI) and myocardial mass index (MMI), respectively.
The opening and closure of the aortic valves, pulmonary valves, mitral valves and tricuspid valves were reviewed using the cine CMR images. The aortic valves and pulmonary valves were reviewed using the outflow tract cine images of the LV and RV, respectively. The mitral valves and tricuspid valves were observed using the 4-chamber cine view. The opening time and closure time of the valves were normalized and recorded as the percentage of the R-R interval. The cardiac cycle was composed of an isovolumetric relaxation phase, a filling phase, an isovolumetric contraction phase and an ejection phase. The durations of the four phases were calculated as follows (isovolumetric relaxation time, IRT; filling time, FT; isovolumetric contraction time, ICT; ejection time, ET; tricuspid valve, T; pulmonary artery valve, P; mitral valve, M; aortic valve, A; open, o; closure, c):
IRTRV = TO − PC
FTRV = TC − TO
ICTRV = PO − TC
ETRV = PC − PO
IRTLV = MO − AC
FTLV = MC − MO
ICTLV = AO − MC
ETLV = AC − AO
To assess the inter-observer and intra-observer reproducibility of the temporal parameters of the cardiac cycle, 18 (26%) PH patients were selected randomly and re-examined independently by the two readers (FY, 6 years CMR experience and DW, 3 years CMR experience). For the intra-observer reproducibility, one observer (FY) repeated the measurements four weeks later. The intra-class correlation coefficient was used to assess the reproducibility.
2.4. Risk Stratification, Follow-Up, and Study Endpoint
In line with the risk assessment instrument from the abbreviated version of the 2015 European Society of Cardiology (ESC)/European Respiratory Society (ERS) risk stratification strategy [15], all the PH patients were graded according to the World Health Organization functional classification (WHO FC), including 6 min walking distance (6 MWD), brain natriuretic peptide (BNP), N-terminal prohormone of the brain natriuretic peptide (NT-proBNP), mean right atrial pressure (mRAP), cardiac index (CI) and mixed venous oxygen saturation (SvO2). For each patient, the sum of all grades was divided by the number of available variables and rounded to the next integer to define the risk group. The cut-off values proposed in the guidelines were graded from 1–3 (1: low risk, 2: intermediate risk, 3: high risk). The overall treatment goal for patients with PH is to achieve a low-risk status; thus, the PH patients were divided into the low-risk group and the intermediate- and high-risk groups.
All the PH patients were followed up with a census date of 12 January 2021. The designed primary endpoint was defined as major cardiovascular events (MACE), which included hospitalization for heart failure, lung transplantation, malignant ventricular arrhythmia and death.
2.5. Statistical Analyses
SPSS 23.0 was used for all the statistical analyses. All the continuous variables were presented as medians and interquartile ranges (IQR) when the variables were not normally distributed. The Kruskal–Wallis one-way ANOVA test, with Bonferroni correction post hoc analysis, was used to compare the continuous variables among the three groups of HC, IVSND and IVSD. The categorical variables were presented as frequencies (%) and compared using Fisher’s exact test. The correlation between the parameters was calculated with Spearman’s correlation coefficient. Multivariable stepwise regression analysis was used to explore the factors associated with RVEF. Each variable with a significant association (p < 0.05) in the univariate analysis was introduced into the regression model. The differences in the ventricular function and the temporal parameters between the low-risk group and the intermediate- and high-risk groups were tested by the Mann–Whitney U test. The univariable and multivariable Cox regression models included demographic factors, clinical factors, laboratory tests, and RHC and CMR variables (variables whose p-value was <0.15 in the univariable Cox regression analysis were included in the multivariable Cox regression analysis). All the analyses were two-sided, and p-values of <0.05 were considered to be statistically significant.
3. Results
3.1. Patient Characteristics
The clinical characteristics of the subjects are presented in Table 1. A total of 48 consecutive precapillary PH patients confirmed by RHC were enrolled, including 29 patients with PAH, 18 patients with chronic thromboembolic pulmonary hypertension (CTEPH), and one patient who had PH with unclear and/or multifactorial mechanisms. There were no significant differences in age, sex or BSA among the IVSND group, the IVSD group and the HC group. The IVSD group had significantly decreased 6MWD and increased NT-proBNP and WHO FC levels. The HR was significantly faster in the IVSD group than in the IVSND group (p < 0.05) and in the HC group (p < 0.001). No significant differences between the IVSND group and the IVSD group in the proportion of PH subsets (p > 0.05) were observed. The mPAP, PVR, CI and mRAP were higher in the IVSD group than in the IVSND group (p < 0.05).

Table 1.
Demographic, clinical and RHC characteristics in the health control and PH patients.
3.2. IVS Morphology and Cardiac Functional Parameters
The IVSD group had significantly decreased CIVS and CR when compared with the IVSND group and the HC group (Table 2).
Table 2.
CMR-derived morphologic and functional parameter characteristics in the health control and PH patients.
Figure 2 shows the trend of the percentage changes in the RV (a) and LV (b) function from the HC to the IVSD group. The detailed differences in the above functional parameters among the groups are shown in the Figure S1. For the RV parameters (Figure 2a), the IVSD patients had increased RVEDVI and RVESVI, and decreased RVEF when compared with the IVSND group and the HC (p < 0.01). The RVEF was the only decreased parameter in the IVSND group compared with the HC (p < 0.05). While there was no significant difference in the RVSVI among the three groups (p > 0.05), among the LV parameters (Figure 2b), the LVEDVI, LVESVI, and LVSVI were decreased in the IVSD patients (p < 0.001). There was no significant difference in the LVEF among the three groups (p > 0.05) (Table 2). The RVMMI and VMI of the IVSD group were increased (p < 0.01), but the LVMMI showed no difference.
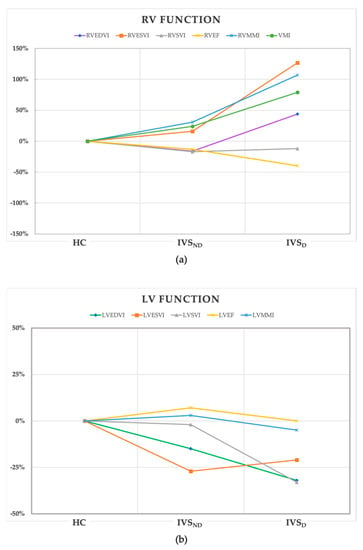
Figure 2.
The trend of the percentage changes in the RV (a) and LV (b) function from the HC to IVSD group. All of the values of the coordinate points were calculated from the percentage change of the median of the parameters in the IVSND and IVSD groups using the HC as the baseline. HC, health control; IVSND, pulmonary hypertension patients without interventricular septum displacement; IVSD, pulmonary hypertension patients with interventricular septum displacement; RV, right ventricle; LV, left ventricle; EDVI, end-diastolic volume index; ESVI, end-systolic volume index; SVI, stroke volume index; EF, ejection fraction; MMI, myocardial mass index; VMI, ventricular mass index.
3.3. Temporal Parameters in the Cardiac Cycle
Table 3 and Figure 3 present the characteristics of the temporal parameters in the cardiac cycle. All the temporal parameters showed no difference between the IVSND and HC groups.
Table 3.
CMR-derived temporal parameters of the three groups.
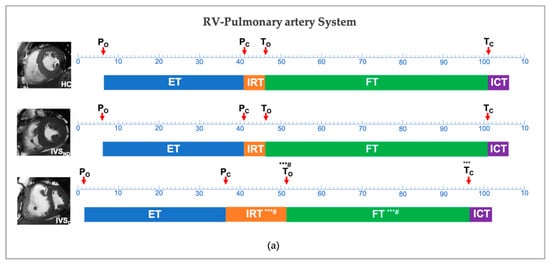
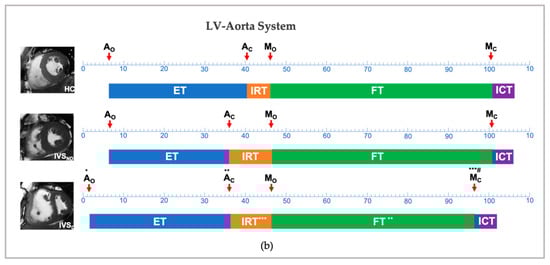
Figure 3.
Temporal changes between the HC, IVSND and IVSD in the right ventricle-pulmonary artery system (a) and left ventricle-aorta system (b). * p < 0.05, ** p < 0.01, *** p < 0.001: versus HC; # p < 0.05: versus IVSND; P, pulmonary artery valve; A, aortic valve; M, mitral valve; T, tricuspid valve; ICT, isovolumetric contraction time; IRT, isovolumetric relaxation time; ET, ejection time; FT, filling time; HC, health control; IVSND, pulmonary hypertension patients without interventricular septum displacement; IVSD, pulmonary hypertension patients with interventricular septum displacement.
Compared with the HC group, the IVSD showed no difference in the PO, PC, ETRV and ICTRV in terms of the RV-pulmonary artery system, while this group showed a delayed TO, an advanced TC, a longer IRTRV and a shorter FTRV (p < 0.001). With regards to the LV-aorta system, although both the AO and the AC were advanced, the ETLV and the ICTLV showed no differences in the IVSD group. The IVSD group showed no differences in the MO, while showing an advanced MC, a longer IRTLV and a shorter FTLV (p < 0.001).
Comparing the two groups of IVSD and IVSND, a longer IRTRV and shorter FTRV were detected along with a delayed TO in the IVSD group (p < 0.05) (Table 3). However, in the temporal parameters of the LV, no differences were detected, except an advanced MC (p < 0.05).
The intra- and inter-observer reproducibility results using intra-class correlation coefficients are shown in the Supplementary Materials, Table S1. The inter-observer and intra-observer variability results for all the temporal parameters were very low.
3.4. Correlation of the Temporal Parameters with the RHC and CMR Data
The IRTRV was significantly correlated with the PVR, CI and CIVS (r = 0.38, r = −0.34, r = −0.49, p < 0.05). The FTRV was significantly correlated with the mPAP, PVR, CI and CIVS (r = −0.46, r = −0.52, r = 0.47, r = 0.55, p < 0.01). There were significant correlations between some ventricular functional parameters and mPAP, PVR, CI and CIVS, respectively (p < 0.05) (Table 4).
Table 4.
Spearman correlations r between the CMR data and RHC data.
The multivariate linear regression included age, sex, 6MWD, NT-proBNP, and RHC and CMR variables and showed that the IRTRV, LVEF and PVR were significantly associated with the RVEF (Table 5).
Table 5.
Multiple linear regression analysis for RVEF.
3.5. Differences in the CMR and RHC Characteristics Based on Risk Stratification
Table 1 shows that 40% of the IVSND group and 90% of the IVSD group were in the intermediate- and high-risk categories. Patients in the intermediate- and high-risk groups had a significantly increased RVEDVI, RVESVI and RVMASSI VMI, and a lower RVEF, LVEDVI, LVSVI and CR compared to the low-risk group (p < 0.05) (Table 6). Patients in the intermediate- and high-risk groups displayed a delayed TO, a longer IRTRV and a shortened FTRV (p < 0.01).
Table 6.
Comparison of the CMR-derived indices and RHC characteristics of the PH patients based on risk stratification.
3.6. Survival Analysis
Twelve patients (25%) with PH died during the median follow-up period of 62 months (interquartile range: 38–67 months). The univariate Cox proportional hazards regression analysis of all the PH patients showed that age, WHO FC, 6MWD, IRTRV, CR and mPAP were associated with the MACE. The multivariable analysis showed that the IRTRV and mPAP were the significant predictors of the MACE (Table 7).
Table 7.
Univariable and multivariable Cox proportional hazard analysis for the MACE.
4. Discussion
This cardiac MR study has provided detailed information about the temporal variations in the cardiac cycle in the progression of PH patients. The main variations were in the diastolic period, and the PH patients with IVS displacement had a longer IRT and shorter FT for both the RV and LV, and a prolonged IRT and shortened FT of the RV were associated with the RV afterload. Additionally, the IRTRV may have the potential to predict the prognosis for PH patients. However, the PH patients without IVS displacement showed no temporal variations in the cardiac cycle.
Increased PVR and elevated PAP are the main factors responsible for PH, leading to vascular remodeling and cardiac remodeling [16]. During the compensation stage, the PH patients showed a mildly decreased RV contractile function and sustained LV function. The filling pressure and interventricular pressure gradients were still normal [10,17]. Previous studies showed that RV contractile dysfunction was significantly associated with the severity of PH and the curvature of the IVS showed a strong correlation with the sPAP [6,18]. The current findings showed that the only impaired cardiac functional parameter was the RVEF in the PH patients without IVS displacement.
Although increased mPAP and PVR reflect the severity of PH, increased mPAP and PVR do not reflect an adverse ventricular–ventricular interaction, interventricular pressure gradient and interventricular septal motion directly [10]. The increased afterload and impaired ventricular interaction deteriorate both ventricles to the decompensation state. The RV is remodeled both concentrically and eccentrically with the RV dilatation and myocardial hypertrophy [19]. The IVS becomes flattened, and even bows to the LV. As the results of this study showed, the CIVS and CR were both reduced in the IVSD patients. The RVEDVI, RVESVI and RVMMI were significantly increased and the RVEF was further decreased in the IVSD patients compared with those of the IVSND patients and HC patients. The LVEDVI, LVESVI and LVSVI were decreased with the IVS displacement and LV compression.
Furthermore, RV pressure loading influences not only the IVS morphology but also the temporal phases of the cardiac cycle [2]. In general, the opening and closure of the atrioventricular valves are mainly dependent on the different pressure gradients between the atrium and ventricle. When the intraventricular pressure drops below the intra-atrial pressure, the atrioventricular valve opens, while the atrioventricular valve closes when the intraventricular pressure rises above the intra-atrial pressure [14].
With respect to the pulmonary artery-RV system, our study identified delayed To, advanced Tc, prolonged IRTRV and shortened FTRV in the IVSD patients. In PH patients with IVS displacement, the increased RV pressure and inefficient RV diastolic function could result in a prolonged IRTRV, which could in turn decrease the intraventricular pressure. Moreover, increased RV pressure would promote the closure of the tricuspid valve and shorten the FTRV accordingly. An increased afterload would reduce the myocyte velocity and prolong the myocyte shortening. Thus, RV actin-myosin cross-bridge cycling may result in a stiffer myocardium near the end of the ventricular ejection, prolonging the IRT and hampering the early relaxation [20]. The IRTRV was prolonged in PH patients when compared with the controls, resulting in a noticeable delay in atrioventricular opening [21]. The shortened FTRV then impedes its filling, which has an essential impact on the RV systolic function [2].
With respect to the LV-aorta system, the IVSD patients displayed advanced Mc, prolonged IRTLV and shortened FTLV. This was linked to IVS displacement. The increased RV pressure causing the RV dilatation and IVS flattening or even bowing to the LV would result in a smaller LV cavity, which leads to the LV underfilling and reduction in the LVSV. RV dilatation and IVS displacement had a further deleterious effect on ventricular interactions [4]. Under these circumstances, a prolonged IRT and shortened FT of the LV and RV could cause ventricular underfilling and decrease the systolic function of both ventricles [10,19,21,22,23].
Our findings also showed that IRTRV, FTRV and some of the cardiac functional parameters (such as RVEDVI, RVESVI, RVEF and VMI) were associated with PVR, CI and CIVS. Additionally, the IRTRV, LVEF and PVR were associated with the RVEF in the multivariate regression analysis. All these findings indicate that the IVS displacement and increased RV afterload were not the only factors related to ventricular dysfunction. The temporal variations of both the IRTRV and FTRV in the cardiac cycle may also be associated with an IVS morphological abnormality and impaired ventricular function, especially in the case of the IRTRV.
Guidelines on the diagnosis and treatment of PH, published by the European Society of Cardiology and European Respiratory Society, state that the overall treatment goal for patients with PH is to achieve a low-risk status, which is usually associated with good exercise capacity, good quality of life, good RV function and a low-mortality risk [15]. The main indicators for the risk stratification in PH are WHO FC, 6MWD, NT-proBNP/BNP and CI [11], and the corresponding results of this study were consistent with the guidelines. Most of the PH patients with IVS displacement were stratified into the intermediate- and high-risk categories, reaching as high as 90% in this study, and they showed delayed To, prolonged IRTRV and shortened FTRV. These findings indicate that the temporal variations of the IRTRV and FTRV in cardiac cycle could also inform the risk stratification of PH patients. Moreover, the multivariable Cox proportional hazards regression analysis showed that the IRTRV was the significant predictor of the MACE. This indicates that the IRTRV might serve as a potential prognostic factor for PH patients.
By applying the current methods in the clinics, we can not only evaluate the function and morphology of the ventricles, but also provide extra temporal information for PH patients, without introducing additional CMR sequences and scanning times. This pathophysiological information may give the doctors a profound understanding of both the progression of PH and the interaction between the ventricles, offering help in the guidance of the treatment strategy for individuals with PH. IVS displacement, prolonged IRTRV, and shortened FTRV indicate RV failure in patients with precapillary-PH, and, more seriously, predict clinical worsening [24]. On the contrary, the reversible displacement of IVS is useful in predicting the alleviation of PH [25]. The temporal parameters of the diastole may have prognostic value and may act as indicators of effective treatment. Cardiac resynchronization therapy is a potential strategy for patients with severe symptomatic PH [26]. The findings regarding the changes in the temporal parameters might provide additional implications for intervention. Large and long-term prospective studies on IVS displacement and the associated temporal changes are needed to confirm this.
This study has several limitations. Firstly, this is a single-center study with a small sample size. The current results and discoveries should be further validated using a large PH population. Next, although the four phases in the cardiac cycle were clearly set out in this study, the pilot temporal parameter method, which used CMR cine data with images including 20 frames from multiple cardiac cycles, might have caused sampling errors or inaccuracies. All the patients were in sinus rhythm, and this could minimize the sampling errors. Finally, the heterogeneous etiology causing precapillary-PH might have led to other uncontrolled factors in the analysis. Further exploration is needed.
With the progression of PH, the diastolic period variations in the RV and LV were related to IVS displacement and ventricular dysfunction. The temporal variations in the cardiac cycle may also be possible parameters, which can explain the severity of the disease and provide useful information about the pathophysiological mechanism of the ventricular dysfunction and indicate the prognosis for PH patients.
Supplementary Materials
The following supporting information can be downloaded at: https://www.mdpi.com/article/10.3390/diagnostics12081970/s1, Figure S1: The differences in RV and LV function among the HC, IVSND, and IVSD groups; Table S1: Reproducibility using intra-class correlation coefficients of temporal parameters.
Author Contributions
Conceptualization, D.L. and F.Y.; methodology, F.Y. and W.R.; software, Y.Y.; validation, Y.-L.D., D.W. and Y.Y.; formal analysis, F.Y.; resources, Z.-W.Y. and T.-L.Y.; writing—original draft preparation, F.Y.; writing—review & editing, D.L. and Z.Z.; visualization, F.Y.; project administration, D.L. and Z.Z. All authors have read and agreed to the published version of the manuscript.
Funding
This work was supported by the National Natural Science Foundation of China (82071907), the China International Medical Foundation Sky Imaging Research Fund (Z-2014-07-2003-05), the Natural Science Foundation of Tianjin (18JCYBJC25100), the Health Science and Technology Project of Tianjin (MS20022), the Wu Jieping Medical Foundation Special Fund for Clinical Research (320.6750.2022-3-5), the Tianjin Key Medical Discipline (Specialty) Construction Project (TJYXZDXK-001A), and the Suzhou “Science and Education Revitalize Health” Youth Science and Technology Project (KJXW2021042).
Institutional Review Board Statement
The study was conducted according to the guidelines of the Declaration of Helsinki and approved by the ethics committee of Tianjin Medical University General Hospital (IRB2022-KY-182, February 2022).
Informed Consent Statement
Patient consent was waived due to the fact that our study was retrospective and approved by the ethics committee.
Data Availability Statement
Data available on request.
Acknowledgments
The authors wish to thank Jean Glover for the help on the English grammar and expression.
Conflicts of Interest
The authors declare no conflict of interest.
References
- Buckberg, G.D.; Hoffman, J.I.E.; Cecil Coghlan, H.; Nanda, N.C. Ventricular structure-function relations in health and disease: Part I. The normal heart. Eur. J. Cardio-Thoracic Surg. 2015, 47, 587–601. [Google Scholar] [CrossRef] [PubMed]
- Naeije, R.; Badagliacca, R. The overloaded right heart and ventricular interdependence. Cardiovasc. Res. 2017, 113, 1474–1485. [Google Scholar] [CrossRef] [PubMed]
- Gillebert, T.C.; Sys, S.U.; Brutsaert, D.L. Influence of loading patterns on peak length-tension relation and on relaxation in cardiac muscle. J. Am. Coll. Cardiol. 1989, 13, 483–490. [Google Scholar] [CrossRef]
- Marcus, J.T.; Gan, C.T.J.; Zwanenburg, J.J.M.; Boonstra, A.; Allaart, C.P.; Götte, M.J.W.; Vonk-Noordegraaf, A. Interventricular Mechanical Asynchrony in Pulmonary Arterial Hypertension. Left-to-Right Delay in Peak Shortening Is Related to Right Ventricular Overload and Left Ventricular Underfilling. J. Am. Coll. Cardiol. 2008, 51, 750–757. [Google Scholar] [CrossRef]
- Frank, B.S.; Schäfer, M.; Douwes, J.M.; Ivy, D.D.; Abman, S.H.; Davidson, J.A.; Burzlaff, S.; Mitchell, M.B.; Morgan, G.J.; Browne, L.P.; et al. Novel measures of left ventricular electromechanical discoordination predict clinical outcomes in children with pulmonary arterial hypertension. Am. J. Physiol. Heart Circ. Physiol. 2020, 318, H401–H412. [Google Scholar] [CrossRef]
- Alunni, J.P.; Degano, B.; Arnaud, C.; Tétu, L.; Blot-Soulétie, N.; Didier, A.; Otal, P.; Rousseau, H.; Chabbert, V. Cardiac MRI in pulmonary artery hypertension: Correlations between morphological and functional parameters and invasive measurements. Eur. Radiol. 2010, 20, 1149–1159. [Google Scholar] [CrossRef]
- López-Candales, A. Determinants of an abnormal septal curvature in chronic pulmonary hypertension. Echocardiography 2015, 32, 49–55. [Google Scholar] [CrossRef]
- Gurudevan, S.V.; Malouf, P.J.; Auger, W.R.; Waltman, T.J.; Madani, M.; Raisinghani, A.B.; DeMaria, A.N.; Blanchard, D.G. Abnormal Left Ventricular Diastolic Filling in Chronic Thromboembolic Pulmonary Hypertension. True Diastolic Dysfunction or Left Ventricular Underfilling? J. Am. Coll. Cardiol. 2007, 49, 1334–1339. [Google Scholar] [CrossRef][Green Version]
- Haddad, F.; Guihaire, J.; Skhiri, M.; Denault, A.Y.; Mercier, O.; Al-Halabi, S.; Vrtovec, B.; Fadel, E.; Zamanian, R.T.; Schnittger, I. Septal curvature is marker of hemodynamic, anatomical, and electromechanical ventricular interdependence in patients with pulmonary arterial hypertension. Echocardiography 2014, 31, 699–707. [Google Scholar] [CrossRef]
- Palau-Caballero, G.; Walmsley, J.; Van Empel, V.; Lumens, J.; Delhaas, T. Why septal motion is a marker of right ventricular failure in pulmonary arterial hypertension: Mechanistic analysis using a computer model. Am. J. Physiol.-Hear. Circ. Physiol. 2017, 312, H691–H700. [Google Scholar] [CrossRef]
- Leuchte, H.H.; ten Freyhaus, H.; Gall, H.; Halank, M.; Hoeper, M.M.; Kaemmerer, H.; Kähler, C.; Riemekasten, G.; Ulrich, S.; Schwaiblmair, M.; et al. Risk stratification strategy and assessment of disease progression in patients with pulmonary arterial hypertension: Updated Recommendations from the Cologne Consensus Conference 2018. Int. J. Cardiol. 2018, 272, 20–29. [Google Scholar] [CrossRef] [PubMed]
- Ibanez, B.; Aletras, A.H.; Arai, A.E.; Arheden, H.; Bax, J.; Berry, C.; Bucciarelli-Ducci, C.; Croisille, P.; Dall’Armellina, E.; Dharmakumar, R.; et al. Cardiac MRI Endpoints in Myocardial Infarction Experimental and Clinical Trials: JACC Scientific Expert Panel. J. Am. Coll. Cardiol. 2019, 74, 238–256. [Google Scholar] [CrossRef] [PubMed]
- Dellegrottaglie, S.; Sanz, J.; Poon, M.; Viles-Gonzalez, J.F.; Sulica, R.; Goyenechea, M.; Macaluso, F.; Fuster, V.; Rajagopalan, S. Pulmonary hypertension: Accuracy of detection with left ventricular septal-to-free wall curvature ratio measured at cardiac MR. Radiology 2007, 243, 63–69. [Google Scholar] [CrossRef]
- Sheth, P.J.; Danton, G.H.; Siegel, Y.; Kardon, R.E.; Infante, J.C.; Ghersin, E.; Fishman, J.E. Cardiac physiology for radiologists: Review of relevant physiology for interpretation of cardiac MR imaging and CT. Radiographics 2015, 35, 1335–1351. [Google Scholar] [CrossRef]
- Galiè, N.; Humbert, M.; Vachiery, J.L.; Gibbs, S.; Lang, I.; Torbicki, A.; Simonneau, G.; Peacock, A.; Vonk Noordegraaf, A.; Beghetti, M.; et al. 2015 ESC/ERS Guidelines for the diagnosis and treatment of pulmonary hypertension. Eur. Heart J. 2016, 37, 67–119. [Google Scholar] [CrossRef] [PubMed]
- Broncano, J.; Bhalla, S.; Gutierrez, F.R.; Vargas, D.; Williamson, E.E.; Makan, M.; Luna, A. Cardiac MRI in pulmonary hyper-tension: From magnet to bedside. Radiographics 2020, 40, 982–1002. [Google Scholar] [CrossRef]
- Vonk Noordegraaf, A.; Chin, K.M.; Haddad, F.; Hassoun, P.M.; Hemnes, A.R.; Hopkins, S.R.; Kawut, S.M.; Langleben, D.; Lumens, J.; Naeije, R. Pathophysiology of the right ventricle and of the pulmonary circulation in pulmonary hypertension: An update. Eur. Respir. J. 2019, 53, 1801900. [Google Scholar] [CrossRef]
- Roeleveld, R.J.; Marcus, T.J.; Faes, T.J.C.; Gan, T.J.; Boonstra, A.; Postmus, P.E.; Vonk-Noordegraaf, A. Interventricular septal configuration at MR imaging and pulmonary arterial pressure in pulmonary hypertension. Radiology 2005, 234, 710–717. [Google Scholar] [CrossRef] [PubMed]
- Sanz, J.; Sánchez-Quintana, D.; Bossone, E.; Bogaard, H.J.; Naeije, R. Anatomy, Function, and Dysfunction of the Right Ventricle: JACC State-of-the-Art Review. J. Am. Coll. Cardiol. 2019, 73, 1463–1482. [Google Scholar] [CrossRef]
- Chen, H.; Man, R.Y.K.; Leung, S.W.S. Ppar-α agonists acutely inhibit Ca2+-independent PLA2 to reduce H2O2- induced contractions in aortae of spontaneously hypertensive rats. Am. J. Physiol.-Hear. Circ. Physiol. 2018, 314, H681–H691. [Google Scholar] [CrossRef]
- Driessen, M.M.P.; Hui, W.; Bijnens, B.H.; Dragulescu, A.; Mertens, L.; Meijboom, F.J.; Friedberg, M.K. Adverse ventricular–ventricular interactions in right ventricular pressure load: Insights from pediatric pulmonary hypertension versus pulmonary stenosis. Physiol. Rep. 2016, 4, e12833. [Google Scholar] [CrossRef] [PubMed]
- López-Candales, A.; Shaver, J.; Edelman, K.; Candales, M.D. Temporal differences in ejection between right and left ventricles in chronic pulmonary hypertension: A pulsed doppler study. Int. J. Cardiovasc. Imaging 2012, 28, 1943–1950. [Google Scholar] [CrossRef]
- Koestenberger, M.; Sallmon, H.; Avian, A.; Cantinotti, M.; Gamillscheg, A.; Kurath-Koller, S.; Schweintzger, S.; Hansmann, G. Ventricular–ventricular interaction variables correlate with surrogate variables of clinical outcome in children with pulmonary hypertension. Pulm. Circ. 2019, 9, 1–9. [Google Scholar] [CrossRef] [PubMed]
- Critser, P.J.; Higano, N.S.; Lang, S.M.; Kingma, P.S.; Fleck, R.J.; Hirsch, R.; Taylor, M.D.; Woods, J.C. Cardiovascular magnetic resonance imaging derived septal curvature in neonates with bronchopulmonary dysplasia associated pulmonary hypertension. J. Cardiovasc. Magn. Reson. 2020, 22, 50. [Google Scholar] [CrossRef]
- Nishina, Y.; Inami, T.; Kataoka, M.; Kariyasu, T.; Shimura, N.; Ishiguro, H.; Yokoyama, K.; Yoshino, H.; Satoh, T. Evaluation of Right Ventricular Function on Cardiac Magnetic Resonance Imaging and Correlation with Hemodynamics in Patients with Chronic Thromboembolic Pulmonary Hypertension. Circ. Rep. 2020, 2, 174–181. [Google Scholar] [CrossRef]
- Westerhof, B.E.; Saouti, N.; Van Der Laarse, W.J.; Westerhof, N.; Vonk Noordegraaf, A. Treatment strategies for the right heart in pulmonary hypertension. Cardiovasc. Res. 2017, 113, 1465–1473. [Google Scholar] [CrossRef] [PubMed]
Publisher’s Note: MDPI stays neutral with regard to jurisdictional claims in published maps and institutional affiliations. |
© 2022 by the authors. Licensee MDPI, Basel, Switzerland. This article is an open access article distributed under the terms and conditions of the Creative Commons Attribution (CC BY) license (https://creativecommons.org/licenses/by/4.0/).