Article

The Role of Lung Ultrasound in SARS-CoV-19 Pneumonia Management

by
Marina Lugarà
1,*,
Stefania Tamburrini
2,
Maria Gabriella Coppola
1,
Gabriella Oliva
1,
Valeria Fiorini
2,
Marco Catalano
2,
Roberto Carbone
2,
Pietro Paolo Saturnino
2,
Nicola Rosano
2,
Antonella Pesce
2,
Raffaele Galiero
3,
Roberta Ferrara
3,
Michele Iannuzzi
4,
D’Agostino Vincenzo
5,
Alberto Negro
5,
Francesco Somma
5,
Fabrizio Fasano
5,
Alessandro Perrella
6,
Giuseppe Vitiello
7,
Ferdinando Carlo Sasso
3,
Gino Soldati
8 and
Luca Rinaldi
3
add Show full author list remove Hide full author list
1
U.O.C. Internal Medicine, ASL Center Naples 1, P.O. Ospedale del Mare, 80147 Naples, Italy
2
U.O.C. Radiology, ASL Center Naples 1, P.O. Ospedale del Mare, 80147 Naples, Italy
3
Department of Advanced Medical and Surgical Sciences, University of Campania Luigi Vanvitelli, 80121 Naples, Italy
4
Department of Anesthesia and Intensive care Medicine, ASL Center Naples 1, P.O. Ospedale del Mare, 80147 Naples, Italy
5
U.O.C. Neurodiology, ASL Center Naples 1, P.O. Ospedale del Mare, 80147 Naples, Italy
6
Infectious Diseases at Health Direction, AORN A. Cardarelli, 80131 Naples, Italy
7
Healt Direction, ASL Center Naples 1, P.O. Ospedale del Mare, 80147 Naples, Italy
8
Diagnostic and Interventional Ultrasound Unit, Valle del Serchio General Hospital, Castelnuovo Garfagnana, 55032 Lucca, Italy
*
Author to whom correspondence should be addressed.
Diagnostics 2022, 12(8), 1856; https://doi.org/10.3390/diagnostics12081856
Submission received: 3 July 2022 / Revised: 24 July 2022 / Accepted: 27 July 2022 / Published: 31 July 2022
(This article belongs to the Special Issue Lung Ultrasound: A Leading Diagnostic Tool)

Abstract

:
Purpose: We aimed to assess the role of lung ultrasound (LUS) in the diagnosis and prognosis of SARS-CoV-2 pneumonia, by comparing it with High Resolution Computed Tomography (HRCT). Patients and methods: All consecutive patients with laboratory-confirmed SARS-CoV-2 infection and hospitalized in COVID Centers were enrolled. LUS and HRCT were carried out on all patients by expert operators within 48–72 h of admission. A four-level scoring system computed in 12 regions of the chest was used to categorize the ultrasound imaging, from 0 (absence of visible alterations with ultrasound) to 3 (large consolidation and cobbled pleural line). Likewise, a semi-quantitative scoring system was used for HRCT to estimate pulmonary involvement, from 0 (no involvement) to 5 (>75% involvement for each lobe). The total CT score was the sum of the individual lobar scores and ranged from 0 to 25. LUS scans were evaluated according to a dedicated scoring system. CT scans were assessed for typical findings of COVID-19 pneumonia (bilateral, multi-lobar lung infiltration, posterior peripheral ground glass opacities). Oxygen requirement and mortality were also recorded. Results: Ninety-nine patients were included in the study (male 68.7%, median age 71). 40.4% of patients required a Venturi mask and 25.3% required non-invasive ventilation (C-PAP/Bi-level). The overall mortality rate was 21.2% (median hospitalization 30 days). The median ultrasound thoracic score was 28 (IQR 20–36). For the CT evaluation, the mean score was 12.63 (SD 5.72), with most of the patients having LUS scores of 2 (59.6%). The bivariate correlation analysis displayed statistically significant and high positive correlations between both the CT and composite LUS scores and ventilation, lactates, COVID-19 phenotype, tachycardia, dyspnea, and mortality. Moreover, the most relevant and clinically important inverse proportionality in terms of P/F, i.e., a decrease in P/F levels, was indicative of higher LUS/CT scores. Inverse proportionality P/F levels and LUS and TC scores were evaluated by univariate analysis, with a P/F–TC score correlation coefficient of −0.762, p < 0.001, and a P/F–LUS score correlation coefficient of −0.689, p < 0.001. Conclusions: LUS and HRCT show a synergistic role in the diagnosis and disease severity evaluation of COVID-19.

1. Introduction

COVID-19 is an infectious disease with a wide range of clinical symptoms, ranging from asymptomatic to mildly symptomatic and severe forms, pointing to a major role of the host response to SARS-CoV-2 (severe acute respiratory syndrome coronavirus 2) [1]. The clinical spectrum of SARS-CoV-2 infection is broad, ranging from asymptomatic infection to flu-like illness, to severe and diffuse viral pneumonia with a life-threating course, related to cytopathic and immune-mediated injury in the pulmonary parenchymal. Patients may show symptoms that include fever, high temperature, cough, myalgia, sputum production, headache, hemoptysis, diarrhea, dyspnea, and, in some cases, acute respiratory distress syndrome (ARDS), acute cardiac injury, or secondary infection. Most of infections are not severe, 81% are mild, 14% of the cases are severe (with dyspnea, hypoxia, or >50% lung involvement on diagnostic imaging), and 5% develop a critical disease with respiratory failure, shock, or multiorgan dysfunction [2]. The risk of death from COVID-19 strongly depends on the patient’s age and previous health status. Older patients are much more prone to critical and fatal disease outcomes, especially with comorbidities, including cardiovascular diseases, hypertension, chronic kidney disease, diabetes, and pulmonary disease [3]. Thrombotic microangiopathy and complement activation, pulmonary embolism, and elevated D-dimer levels have also been reported with high frequency in patients with COVID-19 [4,5,6,7]. Numerous previous studies, including the paper by Giannini and al. [8,9], have already discussed the significance of the D-dimer level as an independent predictor of mortality in severe cases of ARDS during SARS-CoV-2. COVID-19 laboratory diagnosis is based on real-time polymerase chain reaction (RT-PCR) assay obtained by oro-nasopharyngeal swab sample, bronchoalveolar lavage, or tracheal aspirate, while imaging plays a major role in the early diagnosis of the pleuropulmonary complications [8,9,10]. The pathophysiology of severe COVID-19 infection is marked by elevated numbers of neutrophils in the nasopharyngeal epithelium, in the distal parts of the lungs, and in blood. The experience gained during the Italian epidemic pointed to patients’ age as one of the most important risk factors for COVID-19 mortality [11]. However, a recent study demonstrated that patients who died of COVID-19 appear to have lost considerable lifetime, independent of their age. Imaging findings significantly support clinical judgement to ensure effective and timely management and prognosis; indeed, the identification of disease severity allows appropriate selection for early involvement of intensive care [10,11,12]. Contrary to X-ray, chest computed tomography (CT) plays a pivotal role in the diagnosis and monitoring of interstitial pneumonia [13,14]. Typical CT patterns of COVID-related pneumonia include multifocal bilateral peripheral ground glass opacities associated with subsegmental patchy consolidations, commonly subpleural and predominantly involving lower lung lobes and posterior segments [15,16]. Likewise, lung ultrasound (LUS) shows certain advantages for detecting and monitoring COVID-19 “pneumonia” [17]. This diagnostic technique is safe, repeatable, and can be used with low cost at the bedside in absence of radiation exposure [16,17,18]. Moreover, it is useful for rapid assessment of the severity of SARS-CoV-2 pneumonia/ARDS (acute respiratory distress syndrome) in diagnosis and follow-up settings, and for monitoring lungs during recruitment maneuvers and in prone positions [19,20]. The use of LUS for patients with suspected COVID-19 may reduce the risk associated with transporting unstable patients to CT rooms, which is especially important for preventing nosocomial outbreaks due to high contagiousness of virus [21,22].
Thoracic ultrasound has been employed for the diagnosis of many thoracic diseases and is an accepted detection tool for pleural effusions, atelectasis, pneumothorax, and pneumonia. However, the use of ultrasound for the evaluation of parenchymal lung disease, when the organ is still aerated, is a relatively new application. The diagnosis of a normal lung and the differentiation between a normally aerated lung and a lung with interstitial pathology are based on the interpretation of ultrasound artifacts universally known as A- and B-Lines. Even though the practical role of lung ultrasound artifacts is accepted by many clinicians, their physical basis and the correlations between these signs and the causal pathology is not understood in detail [23]. The utility of a lung ultrasound (LUS) in the diagnosis of interstitial lung disease (ILD in very early SSc has also been described including, more recently, its potential for the detection of SSc-ILD in asymptomatic preclinical stages. Recent research has focused on the predictive value of LUS [24,25], which is promising for the application of LUS as a screening method for SSc-ILD in clinical practice. Although these are strong arguments in favor of the application of LUS in SSc, to date there is no unanimous consensus on the role LUS plays in the diagnosis and/or prognosis of SSc-ILD [26].
The use of LUS for patients with suspected COVID-19 may reduce the risk associated with transporting unstable patients to CT rooms, which is especially important for preventing nosocomial outbreaks, due to the high contagiousness of the virus. The purpose of our study was to determine the role of LUS in the diagnosis and prognosis of SARS-CoV-2 pneumonia, considering high-resolution computed tomography (HRTC) as the gold standard.

2. Materials and Method

2.1. Patients

From March 2020 to October 2020, all patients who had been diagnosed with COVID-19 infection by RT-PCR on nasopharyngeal swab samples and throat swabs, and subsequently hospitalized at our COVID Centre, were enrolled in the study. Patients underwent LUS and CT within 48–72 h of admission to our emergency department. Anamnestic, epidemiological, and demographic data were collected either from the patients themselves or from their families, and were recorded. All the results, clinical and laboratory data, and pulmonary CT and LUS were analyzed retrospectively and aggregated anonymously. Comorbidities and related therapies, including obesity, chronic kidney disease, hypertension, type 2 diabetes mellitus, atrial fibrillation, coronary artery disease, dementia, chronic obstructive pulmonary disease (COPD), chronic hepatitis, history of cancer in the last 5 years, and smoking were also recorded.
Clinical phenotypes were classified into four groups as follows:
1. pauci-symptomatic subjects (fever, no hypoxemia);
2. mildly symptomatic patients (fever, mild hypoxemia with pO2 40–60 mmhg, need of oxygen therapy with nasal cannula and vent-mask);
3. moderately symptomatic patients (fever, moderate to severe respiratory failure with pO2 < 40 mmhg, need of CPAP/NIV);
4. patients with severe disease (severe respiratory failure with pO2 < 40 mmhg, ARDS, with or without invasive ventilation).

2.2. Statement of Ethics

The study protocol was approved by the Institutional Ethics Committee of Ancona (ID 0179104/I, 28 July 2021). The study was conducted in accordance with the principles of the Declaration of Helsinki. Due to the retrospective design of the study and anonymous collection of data, informed consent signature was waived, in compliance with Italian law.

2.3. Laboratory Data

Venous blood samples were collected from all patients to assess complete blood counts, with differentiation, fibrinogen, D-dimer, NT pro-bnp, troponin, and biochemistry tests (creatinine, LDH, C-reactive protein, ferritin, procalcitonin, glycemia, lymphocytes, PT, PTT, INR).
All patients underwent blood gas analysis on admission, by radial artery cannulation or puncture. The oxygenation status was assessed by O2 partial pressure value (pO2), CO2 partial pressure value (pCO2) and hemoglobin oxygen saturation (SO2). We used the P/F ratio to compare different values of arterial pO2 in patients receiving different fractions of inspired oxygen (FiO2) by non-invasive ventilation. PaO2/FiO2 (P/F) ratio was used to classify the severity of ARDS, according to the Berlin definition, even though most of the evidence derived from intensive care settings.
According to the 2012 Berlin definition by the ARDS Definition Taskforce, a ratio of the partial pressure of arterial oxygen (PaO2) to the fraction of inspired oxygen (FiO2) (P/F ratio) of ≤100, 101–200 or 201–300 mmHg is deemed as severe, moderate, or mild, respectively.
Lactate levels were also recorded to evaluate any possible degree of tissue perfusion.

2.4. Oxygen Requirement
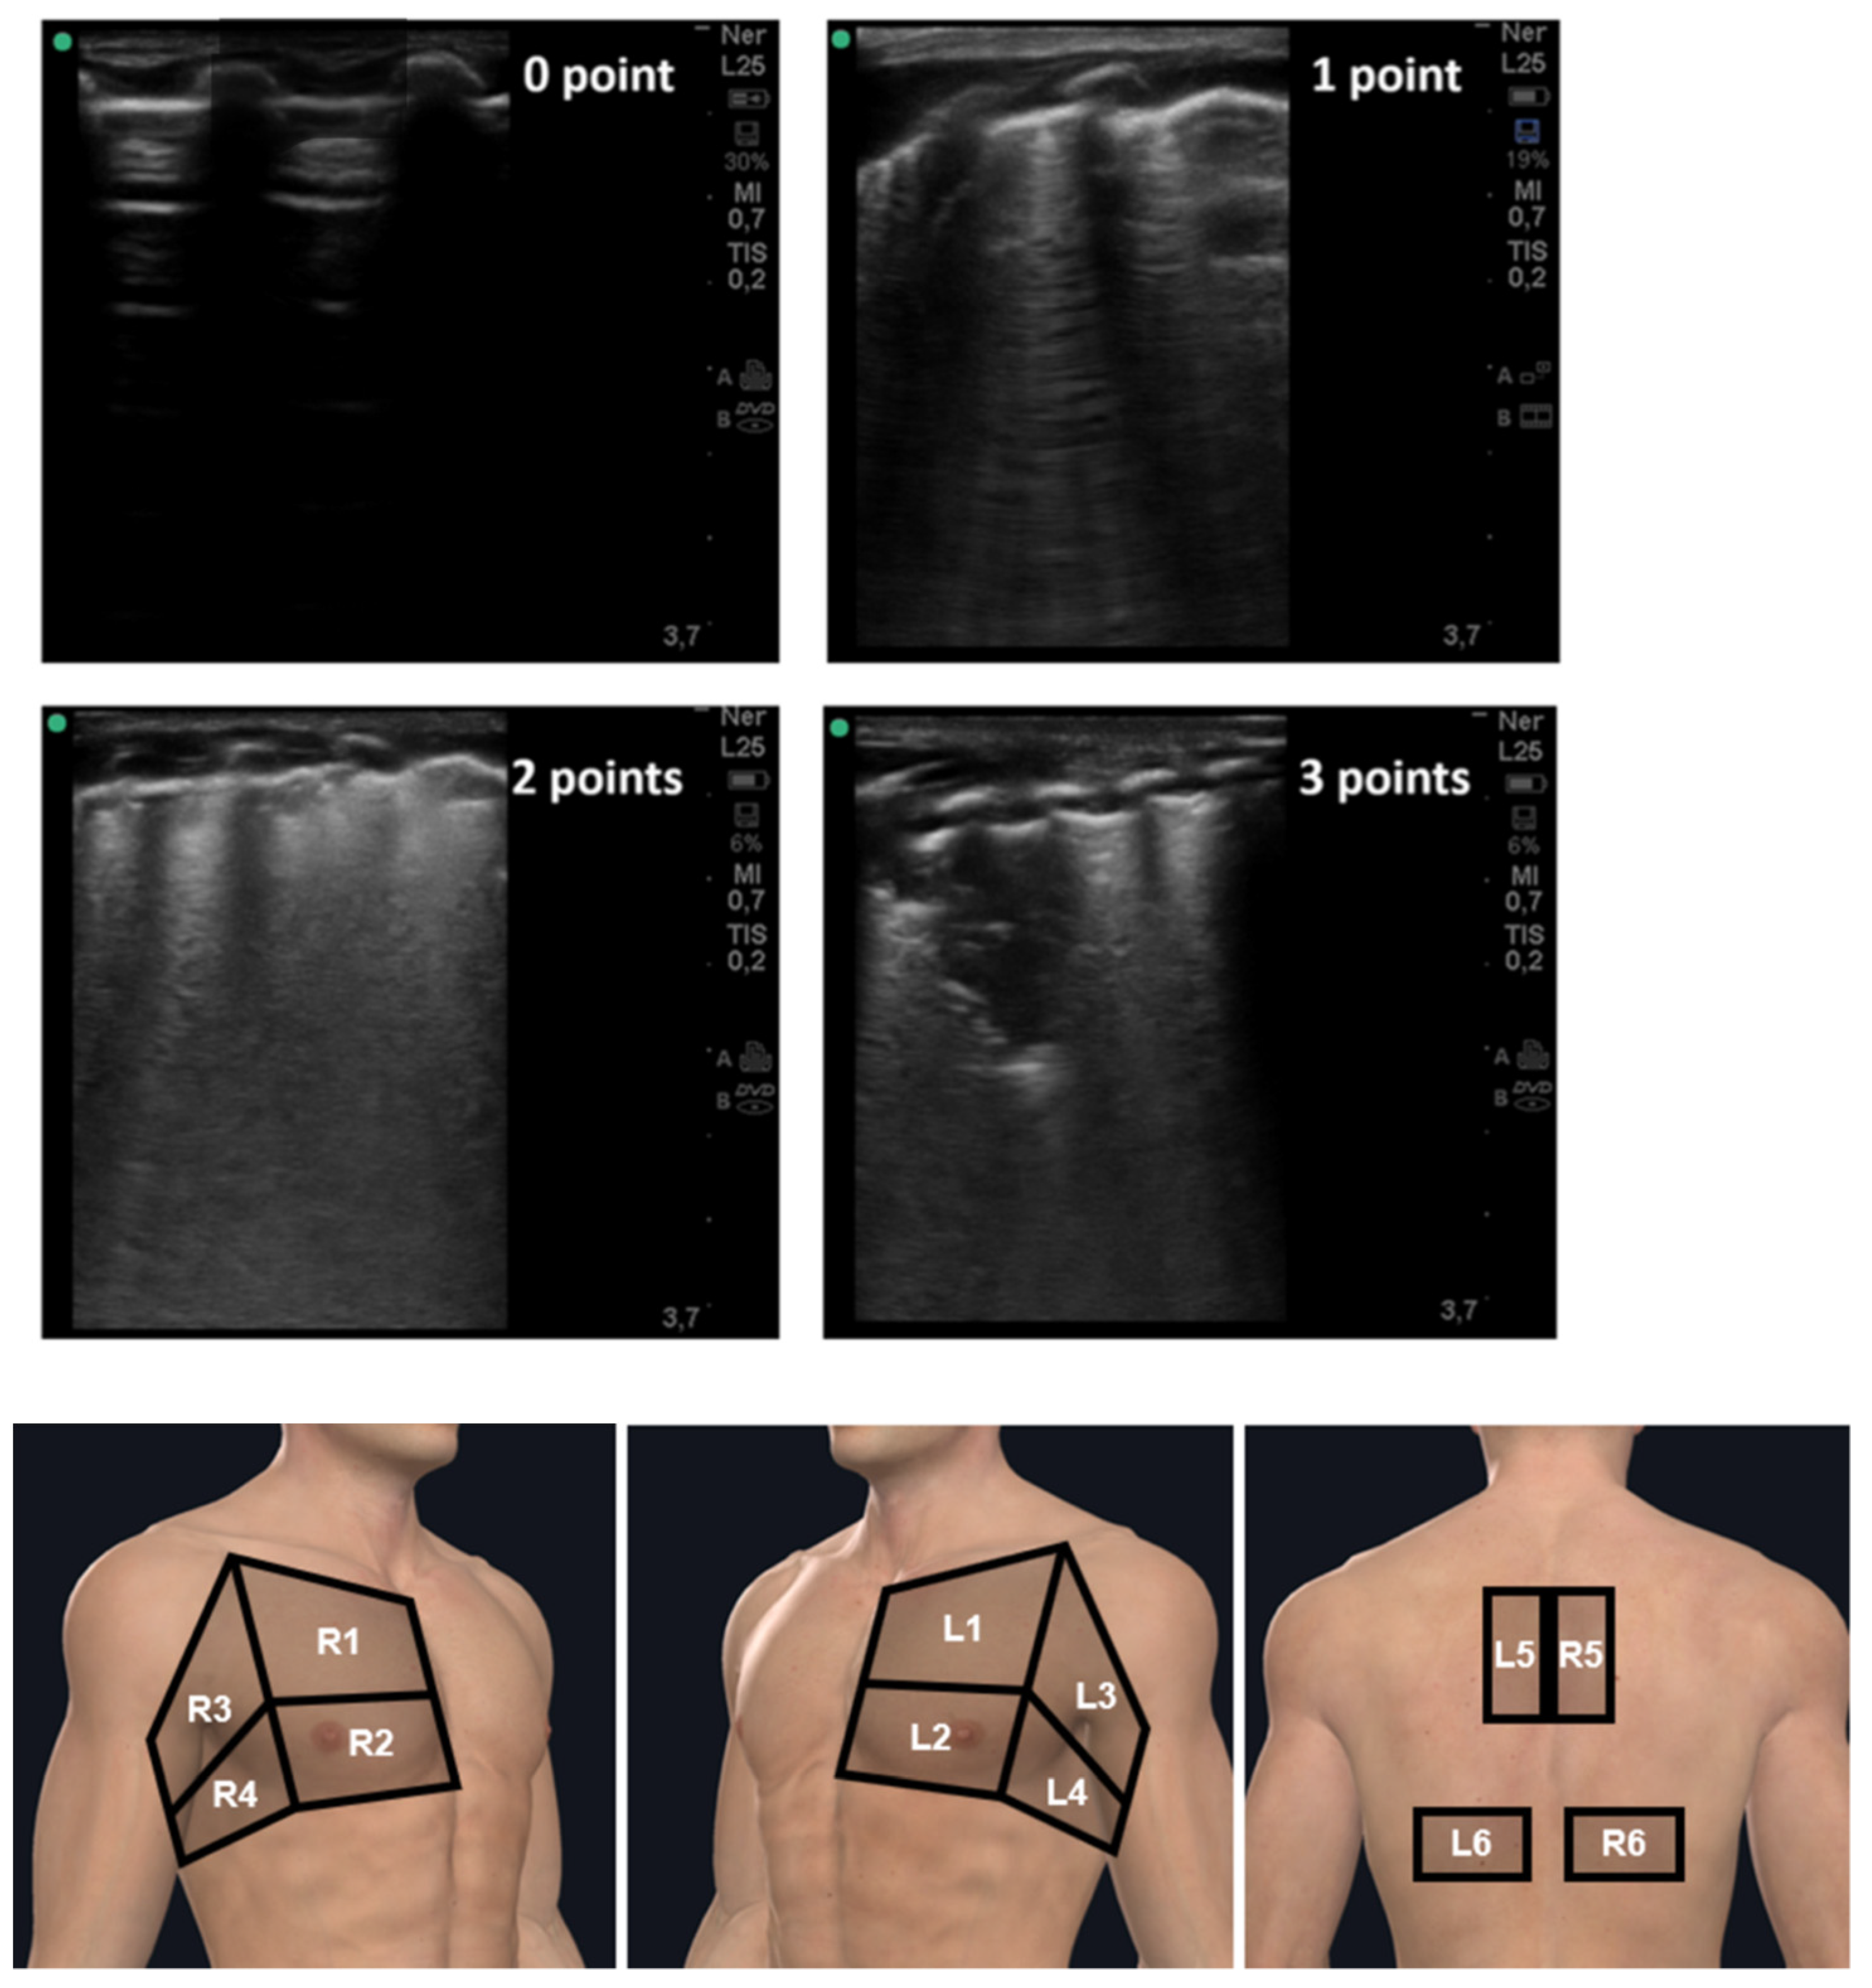
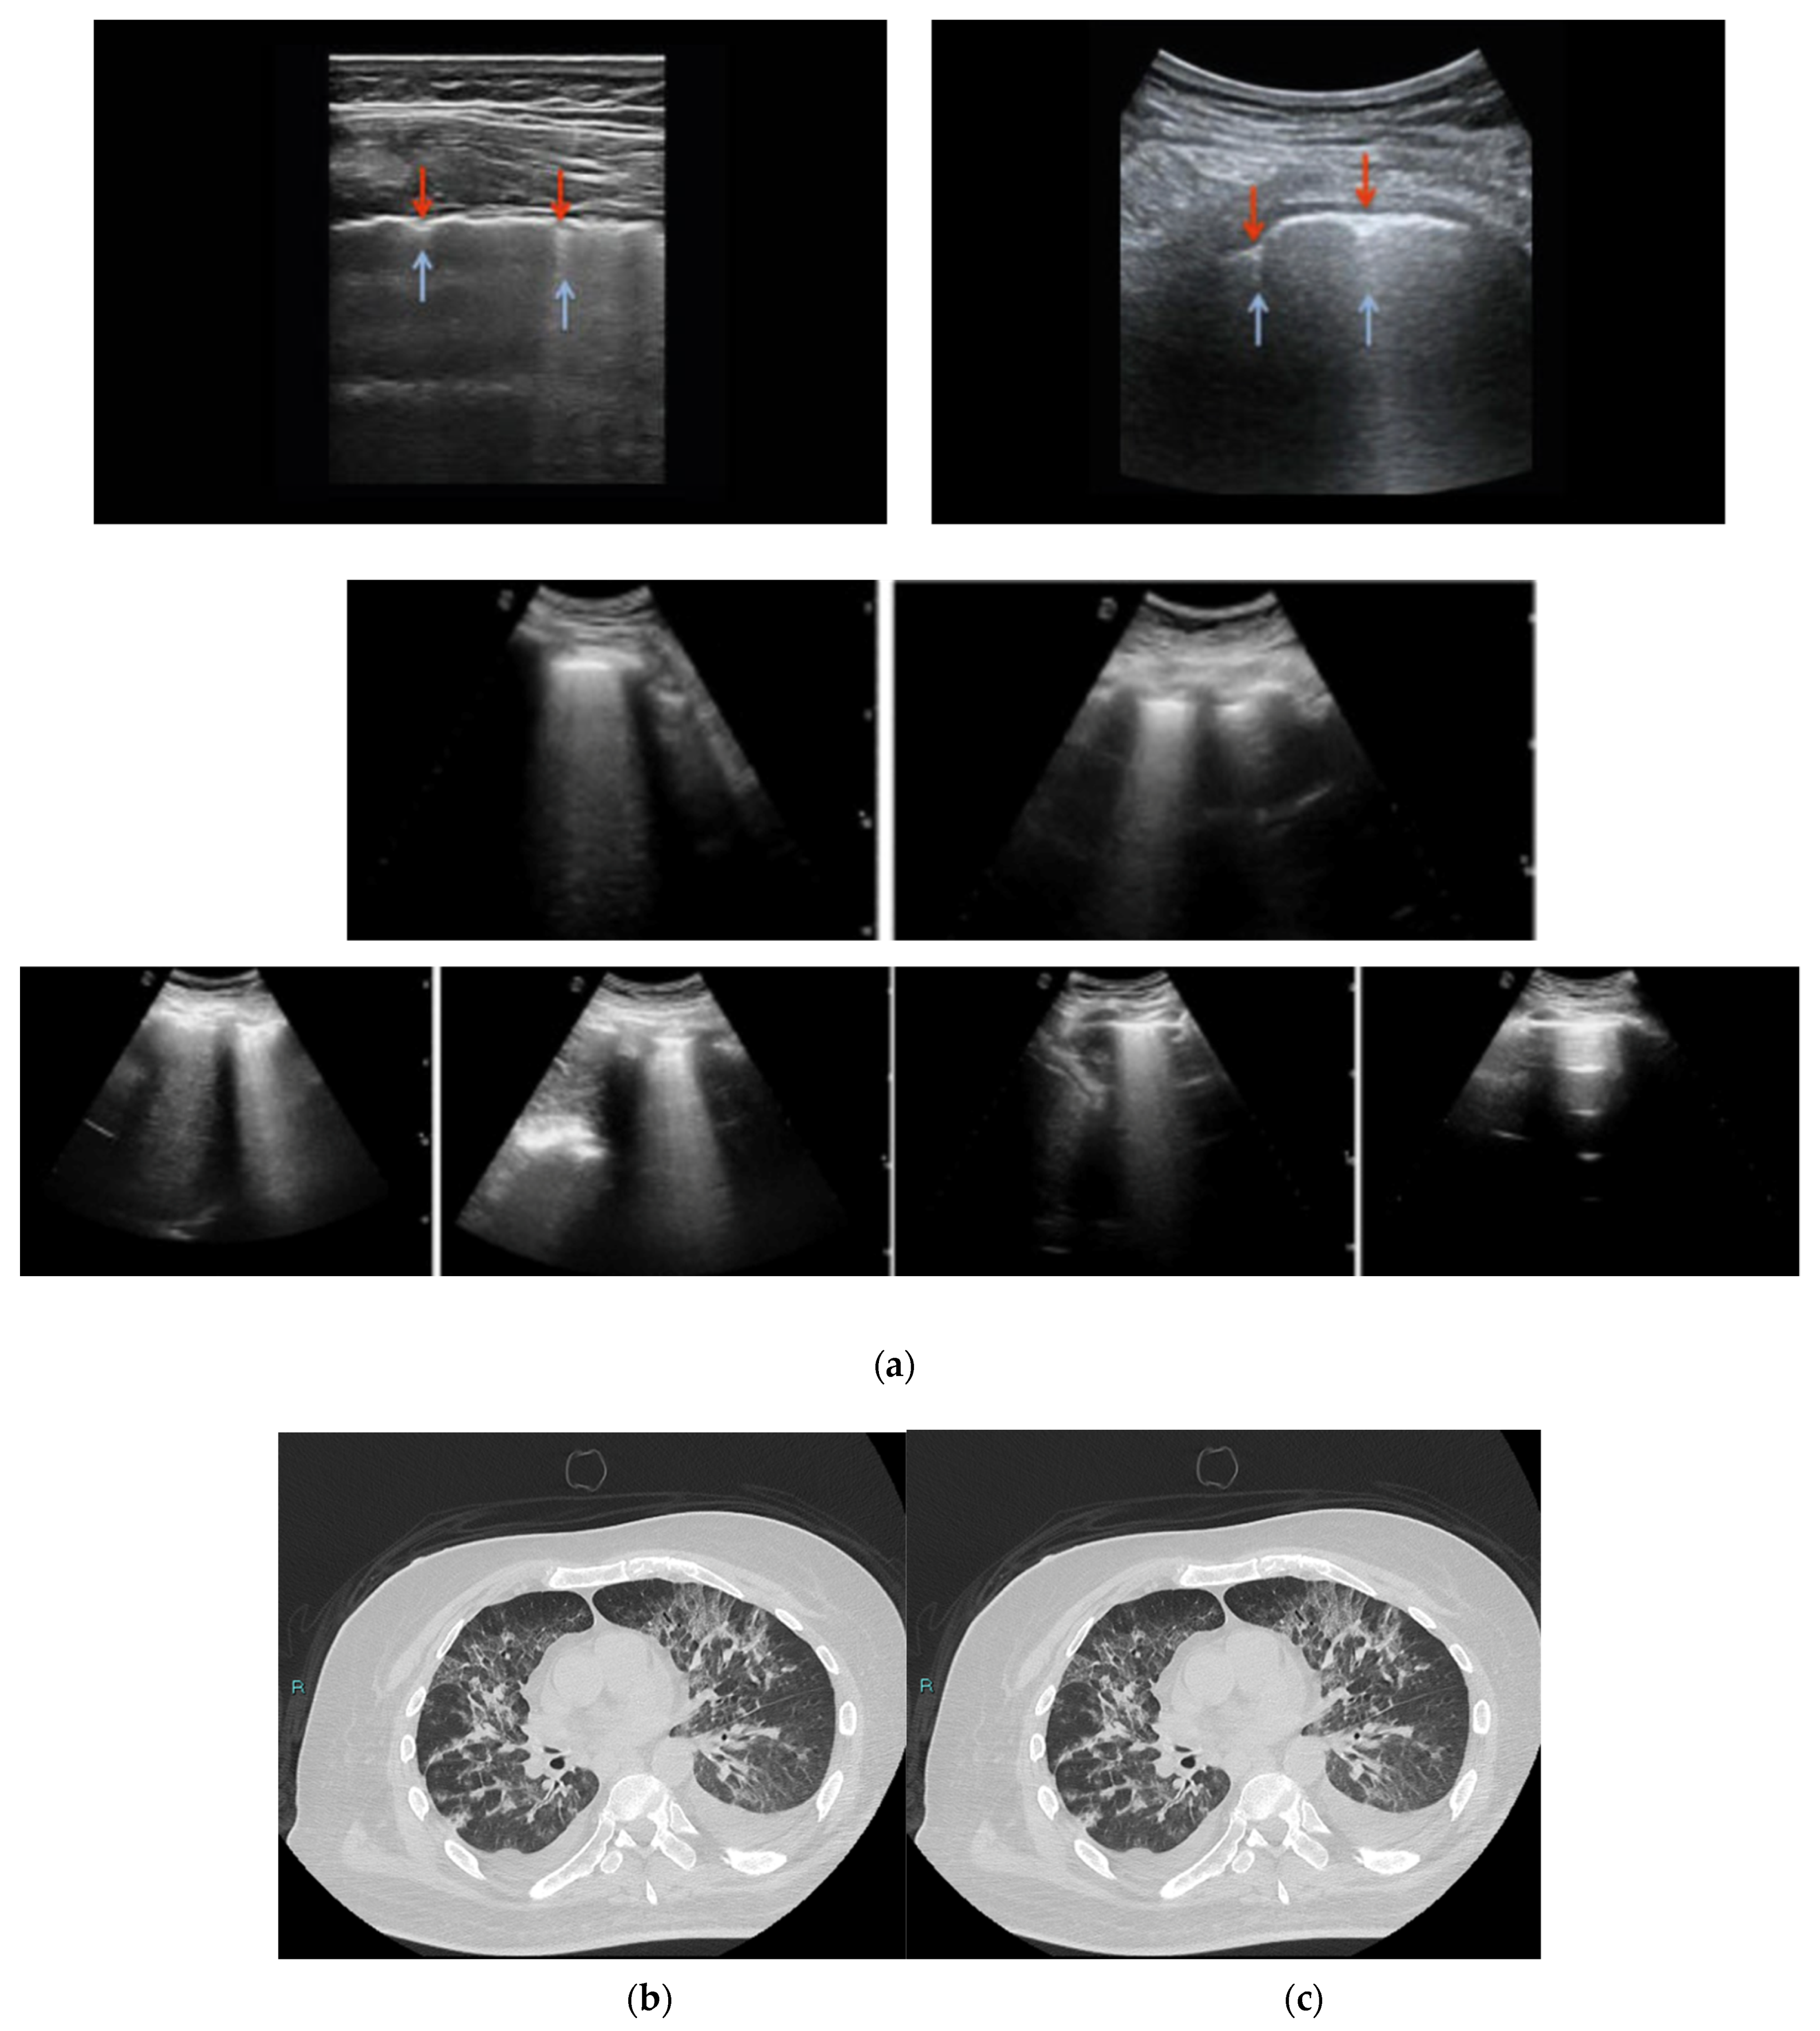
Ventilatory support was categorized into three groups: nasal cannula, Venturi mask and, non-invasive ventilation (CPAP and b-pap). Patients admitted to intensive care required tracheal intubation.

2.5. LUS Protocol

Lung ultrasound examinations were performed at the bedside by trained sonographers (three internists and two radiologists) using portable ultrasound machines (Alpinion E cube i7 and Mindray DP10), equipped with a convex probe (3.5 MHz) and a linear probe (7.5–10 MHz). No harmonic filter was used. The linear and convex probes were each used in every patient. A reduced mechanical index was used as often as possible to obtain interpretable images. The depth was set to provide a clear view of the pleural line and 3–4 cm of the field below it. The gain was set in the intermediate position. The focus was placed at the level of the pleural line.
All the devices, the US scanner, probes, and cables, were wrapped in single-use plastic covers to reduce the risk of contamination and to facilitate the sterilization procedures.

Lung Ultrasound Scoring System

The thorax was explored in twelve areas, six on each hemithorax, by intercostal scans (Figure 1). In critically ill patients who could not maintain the sitting position, paravertebral scans were acquired and moved as posteriorly as possible and towards the lowest and apical points, by placing the patient in an oblique position. Each area was assessed with the probe perpendicular to the chest wall, searching for the following signs: pleural line (a horizontal hyperechoic line between the ribs), A-lines (horizontal replica artifacts repeated at a constant distance equal to the distance between the pleural line and probe surface), vertical artifacts (vertical hyperechoic artefacts spreading from the pleural line towards the bottom of the screen), white lung (focal or multifocal artifacts characterized by an undifferentiated echogenic background, with the absence of A-lines and without evidence of vertical artifacts), and consolidation (presence of a tissue-like pattern) [23,24,25].
A standardized and COVID-19-dedicated four-level scoring system was used to categorize the ultrasound examination, according to published papers [26,27]:
Score 0: The pleural line is regular. Horizontal reverberant artifacts (A-Lines) and mirror effects are present. Absence of visible alterations with ultrasound.
Score 1: The pleural line has slight alterations with sporadic vertical bright artifacts. These are often grouped and separated by the absence of visible alterations of the lung.
Score 2: The pleural line is broken at many points. Vertical artifacts are more numerous. Small subpleural consolidations may be present, often showing a cuneiform shape.
Score 3: The pleural line is irregular and cobbled. The subpleural lung is denser and more disordered. White lung with or without larger consolidations may be present. Small and large consolidations are evident in the scanned parts of the lung.
For each patient, the total score was computed by adding the scores for each area explored. The total scores ranged from 0 (best) to 36 (worst).
Severity of US pulmonary involvement was classified as mild (1–5), moderate (>5–15), or severe (>15).
The presence of pleural effusion and lung sliding was recorded. Ultrasound images and videos were stored and numbered from the right posterior basal regions.

2.6. High Resolution CT (HRCT)

All patients had an initial chest HRCT scan within 48 h of hospitalization, using a multidetector 64-channel CT machine (Toshiba Aquilion PRIME). The detailed parameters for CT acquisition were as follows: tube voltage, 120 kVp; tube current, standard (reference mAs, 60–120); slice thickness, 1.0 mm; reconstructed interval, 1.0 mm. Patients were placed in a supine position. To minimize motion artifacts, patients were instructed on breath-holding and images were acquired during a single breath-hold. The scanning range was from the apex to the lung base. All the images were stored in a picture archive and communication system. Image analysis was performed using the institutional digital database system.
Two radiologists with more than 10 years’ experience evaluated the images in consensus, to determine the disease pattern, distribution, stage, and severity score for each patient. When discordant, the final decision was reached collegially. No negative control cases were examined.
The scans were first assessed, whether negative or positive, for typical findings of COVID-19 pneumonia (bilateral, multi-lobar lung infiltration, posterior peripheral ground glass opacities) as defined by the RSNA consensus statement and peer-reviewed literature on viral pneumonia. Recorded findings included ground glass opacity (GGO), crazy-paving pattern, and consolidation [16]. Atypical COVID-19 CT patterns were recorded.
CT findings were described as follows: (1) ground-glass opacities; (2) Consolidation; (3) ground-glass opacity with consolidation (assessing their respective predominance); (4) crazy-paving patterns; (5) no abnormalities.
Ground-glass opacification was defined as hazy increased lung attenuation with preservation of bronchial and vascular margins, and consolidation was defined as opacification with obscuration of vessel margins and airway walls. Crazy paving represented GGO opacity with superimposed inter- and intralobular septal thickening [10,11]. Consolidation consisted of parenchyma deprived of air.
For each pulmonary lobe (five lobes), the volumetric parenchymal involvement was estimated with a score system as follows: 0 = no involvement; 1 = <5% involvement; 2 = 5–25% involvement; 3 = 26–49% involvement; 4 = 50–74% involvement; 5 = >75%.
The total CT score was the sum of the individual lobar scores, and ranged from 0 (no involvement) to 25 (maximum involvement) [11,15,16,17,18,19,20,21,22,23,24,25,26,27,28]. A correlation between the total LUS score and a Pan score of 0 to 24 was shown to be significant in a previous work [29,30,31].
In addition, CT scans were evaluated according to their distribution, side, and lobe involvement predominance. Finally, the presence of underlying non-related lung disease such as emphysema or fibrosis was recorded.

2.7. End Points of the Study

The primary endpoint was to compare the lung ultrasound severity score and chest CT severity in COVID-19 clinical management. Furthermore, we wanted to explore the correlation between the imaging severity score and COVID-19 phenotypes, clinical and laboratory parameters, and oxygen requirements, thus establishing a prognostic role for lung ultrasound in COVID-19 patients.

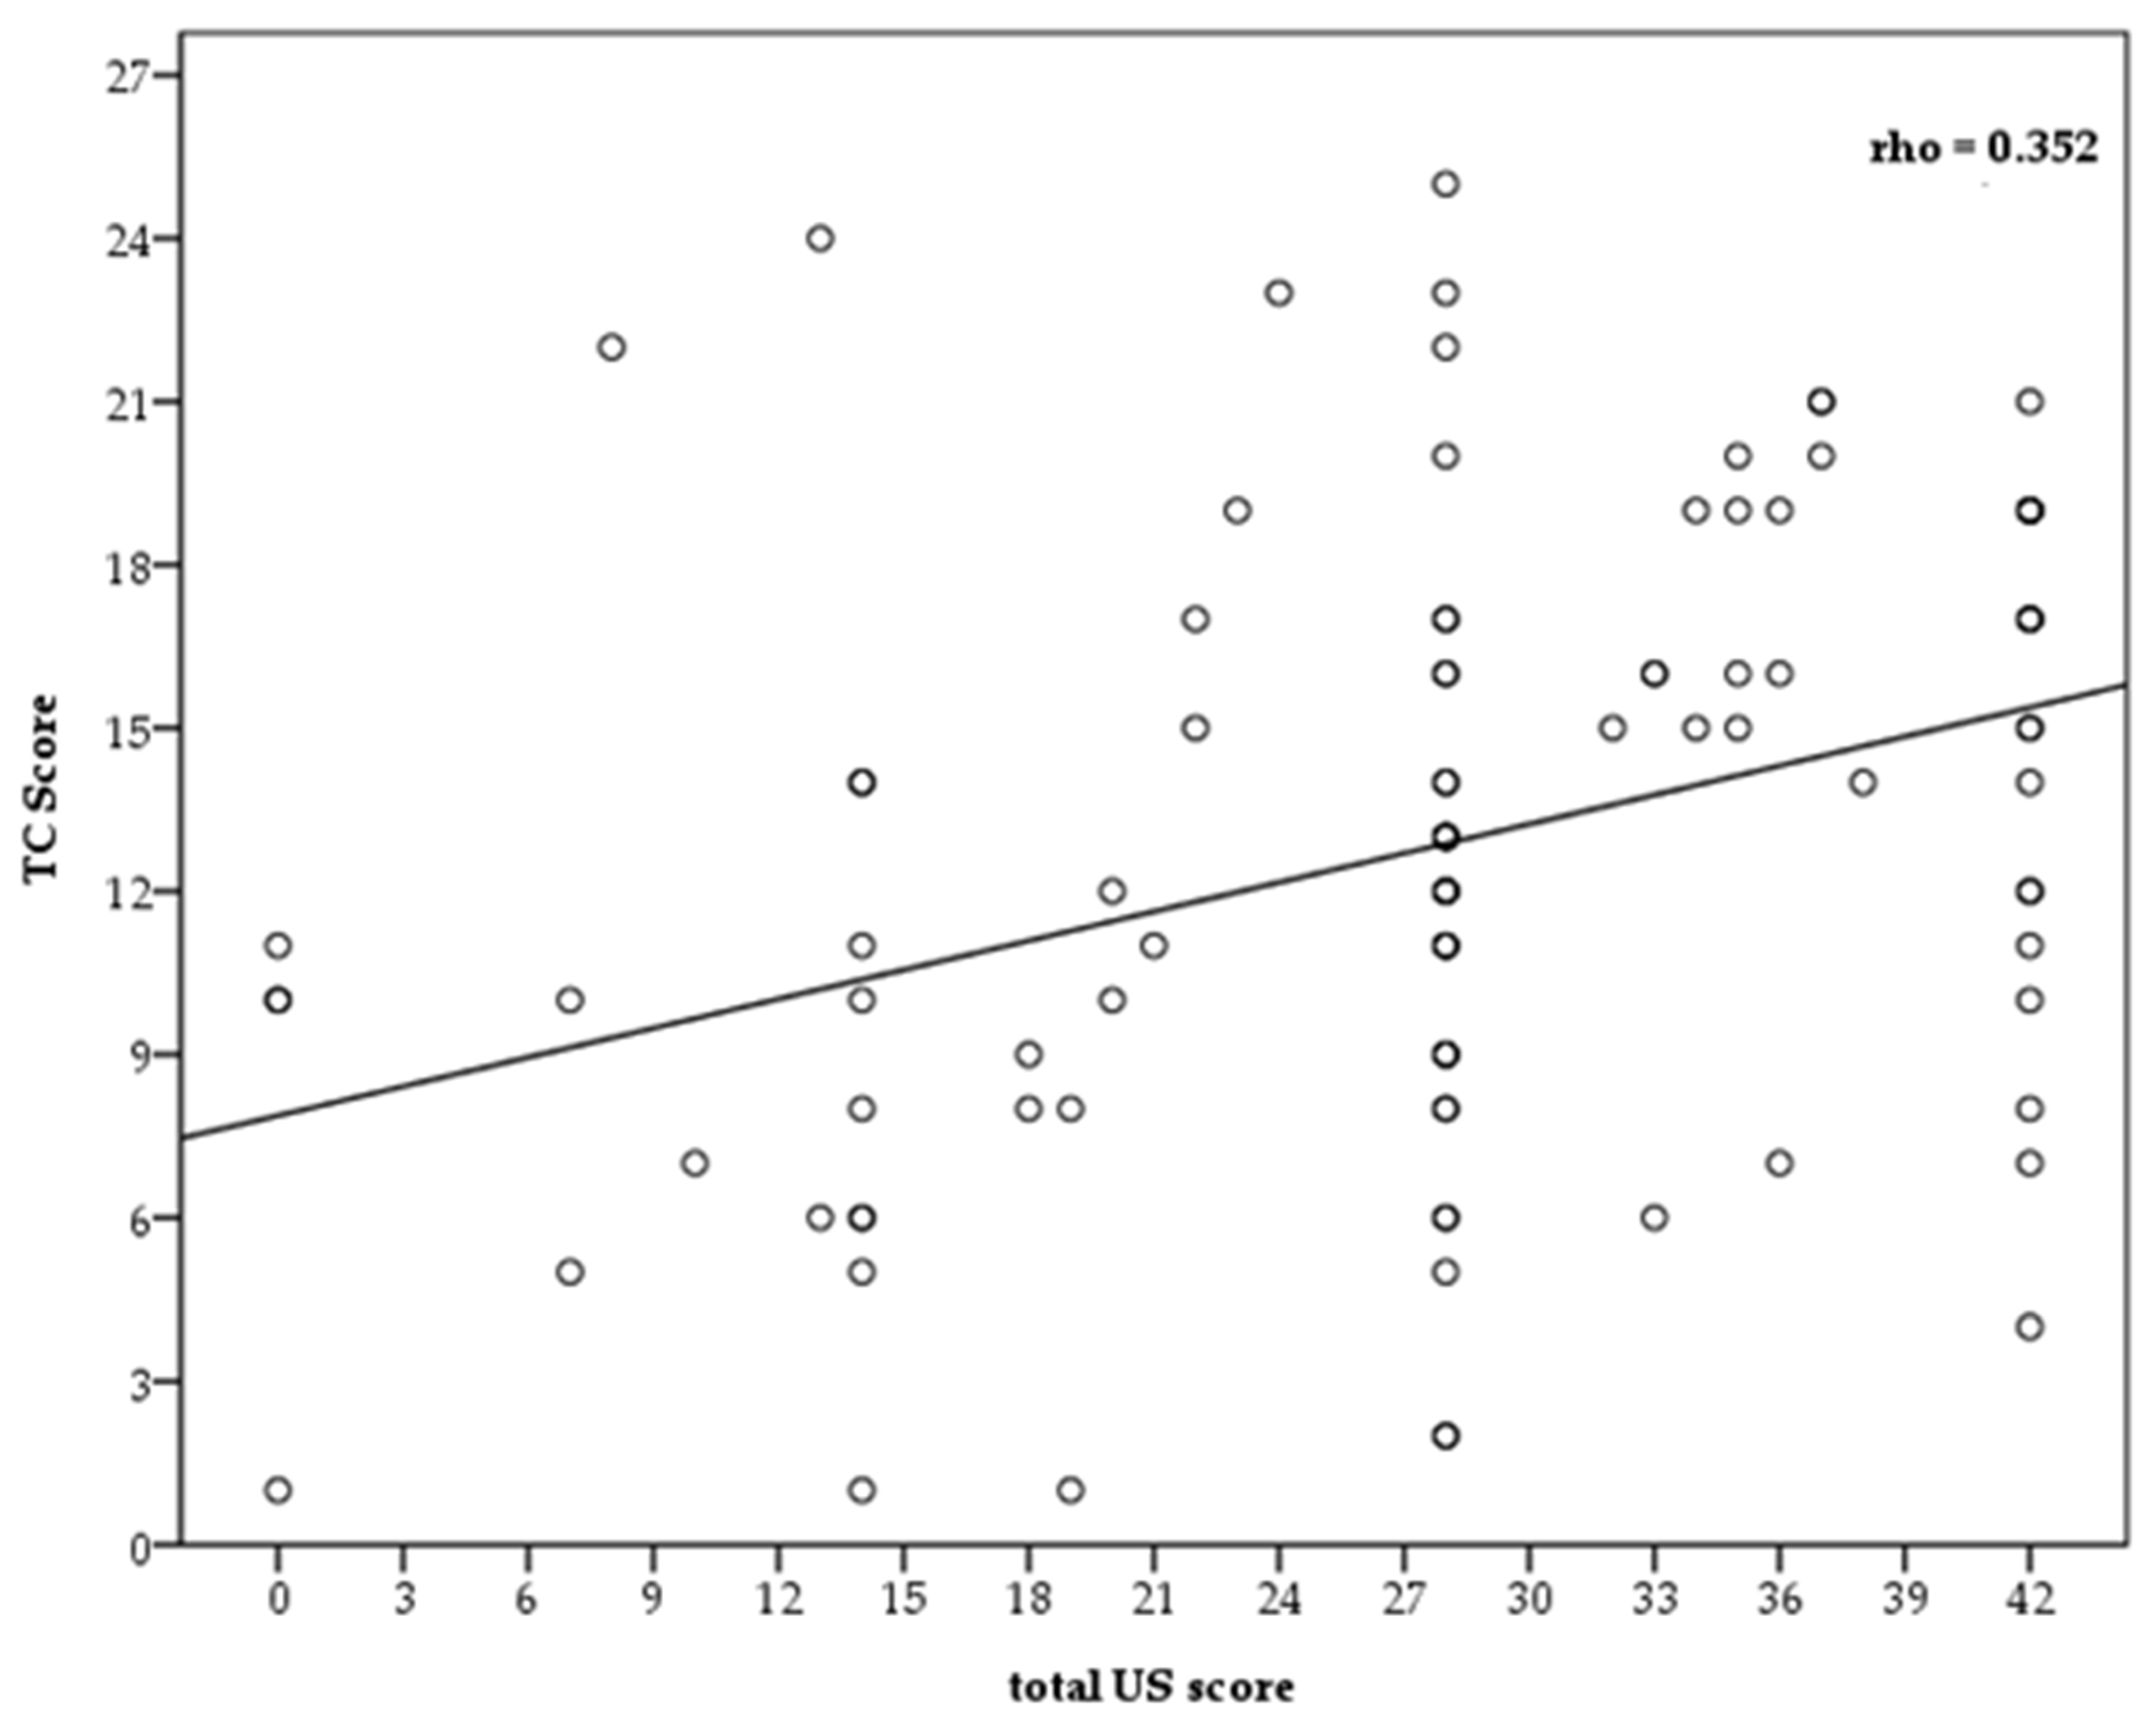
2.8. Statistical Analysis

Categorical data were expressed as numbers and percentages, and continuous variables either as mean and standard deviation (SD) or median and interquartile range (IQR), according to their distribution, and were tested by the Shapiro–Wilk test.
The sample size was 79 patients for a confidence level of 95%.
The ultrasound thoracic score and the CT score were tested for correlation by a linear regression analysis, and a dispersion graph was reported to describe the degree of correlation. The respective correlations of the CT and ultrasound thoracic (US) scores with several outcomes were assessed, as well as the respiratory and laboratory parameters, by calculating the Spearman correlation coefficient. The ROC curve analysis was used to evaluate mortality as a function of the LUS score, and to identify an optimal cut-off value. A p-value < 0.05 was considered as statistically significant. All the analyses were performed by STATA software (StataCorp. College Station, TX: StataCorp LLC), version 15.5.

3. Results

Ninety-nine patients were included in the study, with a median age of 71 years (IQR 58–78 years); within the study group the incidence of SARS-CoV-2 was higher in males 68.7% than in females 31.3% (Table 1). All patients underwent a CT scan and a US scan.
Table 1 synthetizes the anthropometric, demographic, clinical, and biochemical characteristics of the study cohort.
The main symptoms on admission were fever and cough, detected in 90.9% of patients, and dyspnea in 89.9%, whilst asthenia was present in 76.8% of patients and pharyngeal hyperemia in 63.6%.
Table 2 illustrates the pre-existing diseases of the patients and their therapies, while Table 3 shows the patients’ phenotypes and their clinical evolution during their hospital stay. Among pre-existing diseases, the most prevalent was hypertension (85.9%), while chronic obstructive pulmonary disease (COPD) was present in more than half of the patients (56.6%). Hyper-inflammation syndrome, due to the excessive production of proinflammatory cytokines and the dysfunction of the immune response, was found in 84.8% of patients.
The clinical phenotype 3 was the most prevalent, which was characterized by fever, and moderate to severe respiratory failure, with pO2 < 40 mmhg and need of Nnon -invasive ventilation (CPAP/NIV).
Oxygen support was needed for 66% (65%) of patients, specifically nasal cannulas (CN) 7%, venturi mask (VM) 24%, high flows (HFNC) 10%, and non-invasive ventilation—biPap 15% and CPAP 10%.
The LUS and CT scores were analyzed for correlation with the mortality outcomes, coagulation, and respiratory parameters using the Spearman correlation coefficient. As reported in Table 3 and Table 4, the results were for both scores similar. Table 3 shows negative correlation of P/F and LUS score (r = −0.689), and pO2–LUS score (r = −0.486), and positive correlation of ventilation–LUS score (r = 0.562), and lactates–LUS score (r = 0.479). Table 4 shows negative correlation of P/F with TC score (r = −0.689) and pO2 (r = −0.470) and positive correlation with type of ventilation (0.530).
The LUS signs of COVID-19 in every patient were B-lines. The frequencies of irregular or blurred pleural lines were 45% and 15%, respectively. Sub-centimetric lung consolidation was seen in 18 patients (18%).
The median ultrasound thoracic score was 28 (IQR 20–36) and the most frequent scores per single scan were 2 and 3 (47.6% and 32.2%, respectively) (Table 1).
The mean CT score was 12.63 (SD 5.72), with most of the patients showing a score 2 pattern (59.6%).
Patients with clinical phenotypes 3 or 4 (71% of the patients enrolled) presented higher rates of bilateral involvement, with more involved zones, B-lines, pleural line abnormalities, and consolidation.
The relationship between the LUS scores and the CT scores was assessed by a linear regression analysis and dispersion graph (Figure 2), showing a positive linear relationship between the two evaluation scoring systems, which despite not being high (rho = 0.352), did however reach statistical significance (p = 0.008) (Figure 3).
Using the Spearman correlation coefficient, use LUS and CT scores were analyzed for correlation with the mortality outcome, coagulation, and respiratory parameters. As reported in Table 3 and Table 4, the results were almost similar for both scoring systems. Table 3 showed negative correlation for P/F and LUS score (r = −0.689), and pO2–LUS score (r = −0.486), positive correlation for ventilation–LUS Score (r = 0.562), and lactates–LUS Score (r = 0.479). Table 4 showed negative correlation for P/F and TC score (r = −0.689), and pO2 (r = −0.470), and positive correlation by type of ventilation (0.530).
The bivariate correlation analysis displayed statistically significant and high positive correlations for the CT scores as well as the LUS scores with the following parameters: ventilation, lactates, COVID-19 phenotype, tachycardia, dyspnea, and mortality.
The LUS scores showed a significant association with in-hospital mortality (OR 0.7, 0.95% CI 0.59–0.82) Table 5; p < 0.001), with the risk of invasive respiratory support increasing with a greater LUS score measured on patient arrival.
These positive correlations demonstrate that a higher composite LUS or CT score corresponded to a higher mortality rate and a more severe COVID-19 phenotype. Furthermore, there was a direct proportionality between increased CT and LUS scores on one hand and elevated lactate levels and a need for ventilation on the other. Remarkably lower correlations, though still statistically significant, were found for age and d-dimer.

4. Discussion

Lung CT is currently the standard for comparison of other imaging methods for anatomical definition down to the level of the secondary lung lobule.
The most important radiology societies [11,12,13,14,15,16] recommend the use of CT in the presence of moderate and severe features of COVID-19 when RT-PCR results are negative or not available, when there is high pre-test probability, and in the management of patients with worsening or severe respiratory symptoms.
The possibility of using ultrasound to evaluate pulmonary changes in COVID-19 has been proposed since the beginning of the pandemic [26]. Two factors indicated this possibility; first, the prevailing sub-cortical distribution of the injuries, necessary for their US visibility, shown by the Computed Tomography (CT); and second, the histopathology of COVID-19 pulmonary involvement, which generates different degrees of physical density (de-aeration) within the lung, ranging from diffuse patchy alveolar damage to consolidations. Subpleural hyper densities are detectable by ultrasound [30,31], and COVID-19 histopathology (expressed by hyperdensities) represents a measure of the injury of the respiratory tissue which, in the most severe cases, can lead to respiratory failure.
The most frequently observed anatomical feature of COVID-19 is diffuse alveolar damage (DAD), characterized by high levels of proinflammatory cytokines. Later, a proliferative phase develops, involving fibroblasts, myofibroblast, lymphocytes, and extracellular matrix, with intra-alveolar fibrin accumulation. Finally, large vessel thrombosis and microthrombi containing fibrin and platelets may be detected in arteries smaller than 1 mm. In short, ultrasound consolidation corresponds to a lung region deprived of air, therefore without gas exchange. Alternatively, consolidations can represent ischemic regions. This overlap of viral, inflammatory, immune, and vascular events is clinically expressed by disease phenotypes with different prognostic weight [32].
This non-homogeneity was highlighted by Gattinoni et al. [33]. They noted that COVID-19 subjects with respiratory failure showed different clinical patterns of “pneumonia” with different pathophysiology. The transition between different pulmonary COVID-19 phenotypes probably depends on the interaction of many factors, also affecting the ventilation modes and contributing to respiratory injury.
If ultrasound allows bedside assessment of the subpleural lung in terms of density, i.e., absolute or relative reduction of the air spaces and interstitial ratio, or de-aeration, it is reasonable to expect correlations between ultrasound signs and the clinical picture in patients with COVID-19 lung involvement [34].
Although LUS is not currently included in the main international guidelines for COVID-19 patient management, some authors have proposed semi-quantitative LUS scores, which can be used to quantify lung aeration [35]. This approach has recently been used in patients with COVID-19 pneumonia. [36,37].
In the light of recent evidence regarding the genesis of pulmonary signs in ultrasound [35], and their possible relationship with the superficial histopathology of the lung in terms of density and de-structuring, it can be theorized that ultrasound can help define a stratification of tissue damage in COVID-19 patients.
The four-level ultrasound score used in this paper is based on the concept of disease severity, with consideration given to extension of findings on the lung and the nature of tissue densities [38].
Despite the profound difference between CT (tomographic) and ultrasound (exploring only superficial densities), LUS and CT scores showed a weak (but statistically significant) positive linear relationship. This agrees with other observations [39,40,41]. A plausible explanation can be found in the prevalent peripheral, subpleural expression of COVID-19 pulmonary injuries [11,15], which can minimize the differences between the two methods (axial and superficial estimates).
Results of this study and other observations agree with this hypothesis. In practical terms, LUS can be considered an equally accurate alternative to CT in cases of COVID-19, particularly in situations where CT is not easily accessible or when molecular tests are not available [42,43].
In our study, a significant positive correlation was demonstrated between LUS score and CT score, and certain strategic parameters (COVID-19 phenotype, need for non-invasive ventilation, hematic lactate level, and mortality) (Table 3 and Table 4). As expected, P/F, pH, and pO2, displayed significant negative correlations. However, the most relevant and clinically important inverse proportionality was found in relation to P/F, i.e., higher LUS/CT scores were indicative of a decrease in P/F ratio.
This study reinforces the results presented by Perrone et al [37], which demonstrated a significant correlation between an equivalent US scoring system (of 12 fields), and established end points of clinical worsening, including high-flow oxygen support, ICU admission, and death. This is important, because their methodology of ultrasound exploration of the chest and the score used in their study (specifically proposed for COVID-19 patients) were the same as those we used.
Many other studies showed that the extent of lung abnormalities evaluated by the LUS score is a predictor of a worse outcome, ETI, or death [44,45]. However, the scoring systems used, and, above all, the number of regions explored are often not comparable to each other. For example, it has been assumed that a very marked reduction in the number of regions explored may decrease the accuracy of LUS, as demonstrated by Falster et al. [46] using the Mongodi score with analysis of only eight thoracic areas.
From a practical point of view, our results justify the attribution of an LUS score to every COVID-19 patient, from the early stages of management and during monitoring in the various settings. LUS may have a potential role in Emergency department for triaging symptomatic patients, managing ventilation, weaning ICU patients, and monitoring COVID-19 pneumonia and its evolution toward ARDS in critically ill patients. Moreover, it may be considered a first-line alternative to chest X-ray and CT scan in critically ill patients.
Even though asymptomatic carriers may comprise 17.9–33.3% of patients with COVID-19 [47,48], and can contribute to the spread of the infection, the role of screening these asymptomatic carriers is not known. Ultrasonography could help identify infected people with signs and symptoms at the onset [49]. Compared to its sensitivity, the specificity of US to pathological artifacts of the lung in COVID-19 and other diseases is generally considered low.
US signs of COVID-19 are present in various degrees in other pathologies (diffuse pneumonia, pulmonary edema, interstitial lung diseases). The diagnostic accuracy of pulmonary ultrasound in COVID-19 is based on the diffuse and bilateral aspect of lung involvement, on the prevalence of artefactual components, and on a typically patchy distribution. Of course, the pretest probability of having contracted the infection assumes significance [34]. At present, to our knowledge, very few lung diseases with a large epidemic diffusion show these aspects.
In this study, we found that the most common CT findings were GGO, consolidation, and crazy-paving patterns, including “spider web sign” (defined as a triangular or angular GGO in the subpleural lung with the internal interlobular septa thickened like a net). A differential diagnosis between COVID 19 and systemic sclerosis (SSc) with interstitial lung is made possible by employing CT images; the presence of consolidations and fibrosis inside GGO in the lower lobes are independent CT diagnostic features for COVID-19 [50]. As expected, the most common ultrasound signs were vertical artifacts and white lung. A quantitative LUS score for lung aeration assessment has been proposed, based on the identification of four patterns in number and type of visualized artifacts: normal aeration, moderate, severe, and complete loss of aeration [51]. Baldi et al. [52] reported a relationship between the number of B-lines and lung density in mechanically ventilated patients. In patients with VAP, changes in LUS score before and after antibiotics predicted improvement in lung aeration. These findings are consistent with the fact that CT scan computes lung density, which is also the main determinant of appearance, number, and coalescence of LUS artifacts.
In agreement with recent evidence that connects the vertical artifacts to acoustic traps that can capture acoustic energy and restore it over time, and white lung with a relatively random scattered distribution, a relationship between CT and US features can be speculated [53]; for example, between septal enlargement and vertical artifacts, or between ground glass opacity in CT and white lung. Equally probable is a deteriorating progression, in terms of ventilation, from less dense vertical artifacts to white lung and consolidations.
Consolidations were significantly more frequent in severe and critical patients. In consolidations, the alveoli are filled by inflammatory exudation, and/or collapsed. If the role of consolidations in causing a shunt effect is recognized, it can be speculated that consolidations are aggravating factors and indicators of cytokine storm, vascular damage, ARDS, or bacterial superinfection.
As regards the laboratory indicator, we found a difference between the ordinary and severe and critical phenotypes. The decrease of lymphocytes in the severe and critical patients indicated that many immune cells had been consumed, and the immune function was inhibited. Damage to lymphocytes may be critical in-patient exacerbation, and the decreased lymphocytes could be used as an important index in the evaluation of disease severity. The increased values of neutrophil ratio, C-reactive protein, and procalcitonin in severe and critical patients may have been related to cytokine storm induced by virus invasion, and to comorbidity with other kinds of infections, which has been supported by recent studies [29]. The timely prevention of infection may help reduce complications and mortality.
The strength of this study concerns the robustness of the data obtained from a large, real-life, general adult population, where COVID-19-positive individuals with pneumonia were included. Moreover, all patients were evaluated by the same CT and US methodology, including the score used.
However, the study has some limitations. Ultrasound scans were performed by different operators and the inter-operator agreement was not assessed, due to the technical difficulties imposed by the emergency clinical context.
Moreover, in our study there was no control group, as its purpose was not to validate the test nor to provide a differential diagnosis with other diseases based on ultrasound imaging, but to evaluate how useful ultrasound can be in the management of a COVID setting.
It is also important to consider that our results were linked to the prevalence of the disease, which was particularly high during the first wave of the pandemic. With a lower prevalence, the significance of our analysis should be revisited.

5. Conclusions

LUS score was independently able to predict a higher risk of adverse events in patients with COVID-19. Indeed, patients with higher LUS scores were more likely to have higher levels of cardiac injury, coagulopathy, and inflammatory biomarkers, more non-invasive ventilation with c-pap or b-level, higher incidence of respiratory failure, ARDS, and sepsis, and higher mortality. The US does not replace the CT examination gold standard for interstitial pneumonia, and US has poor capacity for risk stratification compared to CT. More interesting is the role of US for monitoring patients at the bedside every day during hospitalization, for clinical and instrumental correlation, for follow-up, and for reducing the risk of radiation. Likewise, chest CT has played a crucial role in characterizing pulmonary lesions during the COVID-19 pandemic. It can accurately evaluate the type and extent of lung lesions and could be used to evaluate the severity of the disease. LUS allows only a superficial mapping of the lung, and the LUS score in theory is not perfectly comparable to the CT score (a volumetric estimate of injury). It is conceivable that a certain congruence of results is linked to the superficial expression of lesions, and that therefore in COVID-19 relative symmetry between volume and surface of the pulmonary lesions is maintained. In conclusion, LUS and chest CT have been shown to play a synergistic role in the diagnosis and severity evaluation of COVID-19.

Author Contributions

M.L., S.T. and L.R.: study design, data analysis, data interpretation, and writing and reviewing the paper. G.O., M.G.C. and V.F.: data collection, data interpretation, and reviewing the paper. M.C., R.C., P.P.S., N.R. and A.P. (Antonella Pesce): data collection, and reviewing the final version of the paper. G.S., F.C.S., R.G., R.F., M.I., A.P. (Alessandro Perrella), G.V., D.V., F.F., F.S. and A.N., reviewing the paper. All authors have read and agreed to the published version of the manuscript.

Funding

This research received no external funding.

Institutional Review Board Statement

The study protocol was approved by the Institutional Ethics Committee of Ancona (ID 0179104/I, 28 July 2021).

Informed Consent Statement

Informed consent was obtained from all subjects involved in the study.

Data Availability Statement

The raw data supporting this study will be made available by the authors if requested.

Acknowledgments

We are grateful to the patients who participated in the study.

Conflicts of Interest

The authors declare that the research was conducted in the absence of any commercial or financial relationships that could be construed as a potential conflict of interest.

References

  1. WHO. Coronavirus (COVID-19) Dashboard. Available online: https://covid19.who.int/ (accessed on 16 February 2022).
  2. Valdenassi, L.; Franzini, M.; Ricevuti, G.; Rinaldi, L.; Galoforo, A.C.; Tirelli, U. Letter to the Editor: Potential mechanisms by which the oxygen-ozone (O2–O3) therapy could contribute to the treatment against the coronavirus COVID-19. Eur. Rev. Med. Pharmacol. Sci. 2020, 24, 4059–4061. [Google Scholar] [CrossRef] [PubMed]
  3. Zhou, F.; Yu, T.; Du, R.; Fan, G.; Liu, Y.; Liu, Z.; Xiang, J.; Wang, Y.; Song, B.; Gu, X.; et al. Clinical Course and Risk Factors for Mortality of Adult Inpatients with COVID-19 in Wuhan, China: A Retrospective Cohort Study. Lancet 2020, 395, 1054–1062. [Google Scholar] [CrossRef]
  4. Kudlinski, B.; Zgoła, D.; Stolińska, M.; Murkos, M.; Kania, J.; Nowak, P.; Noga, A.; Wojciech, M.; Zaborniak, G.; Zembron-Lacny, A. Systemic Inflammatory Predictors of In-Hospital Mortality in COVID-19 Patients: A Retrospective Study. Diagnostics 2022, 12, 859. [Google Scholar] [CrossRef] [PubMed]
  5. Léonard-Lorant, I.; Delabranche, X.; Séverac, F.; Helms, J.; Pauzet, C.; Collange, O.; Ohana, M. Acute Pulmonary Embolism in Patients with COVID-19 at CT Angiography and Relationship to d-Dimer Levels. Radiology 2020, 296, E189–E191. [Google Scholar] [CrossRef] [Green Version]
  6. Poyiadji, N.; Cormier, P.; Patel, P.Y.; Hadied, M.O.; Bhargava, P.; Khanna, K.; Nadig, J.; Keimig, T.; Spizarny, D.; Reeser, N.; et al. Acute Pulmonary Embolism and COVID-19. Radiology 2020, 297, E335–E338. [Google Scholar] [CrossRef] [PubMed]
  7. Grillet, F.; Behr, J.; Calame, P.; Aubry, S.; Delabrousse, E. Acute Pulmonary Embolism Associated with COVID-19 Pneumonia Detected with Pulmonary CT Angiography. Radiology 2020, 296, E186–E188. [Google Scholar] [CrossRef] [Green Version]
  8. Kermali, M.; Khalsa, R.K.; Pillai, K.; Ismail, Z.; Harky, A. The Role of Biomarkers in Diagnosis of COVID-19—A Systematic Review. Life Sci. 2020, 254, 117788. [Google Scholar] [CrossRef]
  9. Rodrigues, T.S.; de Sá, K.S.; Ishimoto, A.Y.; Becerra, A.; Oliveira, S.; Almeida, L.; Gonçalves, A.V.; Perucello, D.B.; Andrade, W.A.; Castro, R.; et al. Inflammasomes are activated in response to SARS-CoV-2 infection and are associated with COVID-19 severity in patients. Exp. Med. 2021, 218, e20201707. [Google Scholar] [CrossRef]
  10. Bernheim, A.; Mei, X.; Huang, M.; Yang, Y.; Fayad, Z.A.; Zhang, N.; Diao, K.; Lin, B.; Zhu, X.; Li, K.; et al. Chest CT Findings in Coronavirus Disease-19 (COVID-19): Relationship to Duration of Infection. Radiology 2020, 295, 200463. [Google Scholar] [CrossRef] [PubMed] [Green Version]
  11. Fumagalii, C.; Rozzini, R.; Vannini, M.; Coccia, F.; Cesaroni, G.; Mazzeo, F.; Cola, M.; Bartoloni, A.; Fontanari, P.; Lavorini, F.; et al. Clinical risk score to predict in-hospital mortality in COVID-19 patients: A retrospective cohort study. BMJ Open 2020, 10, e040629. [Google Scholar] [CrossRef]
  12. Leonardi, A.; Scipione, R.; Alfieri, G.; Petrillo, R.; Dolciami, M.; Ciccarelli, F.; Perotti, S.; Cartocci, G.; Scala, A.; Imperiale, C.; et al. Role of computed tomography in predicting critical disease in patients with COVID-19 pneumonia: A retrospective study using a semiautomatic quantitative method. Eur. J. Radiol. 2020, 130, 109202. [Google Scholar] [CrossRef] [PubMed]
  13. Liu, H.; Luo, S.; Zhang, Y.; Jiang, Y.; Jiang, Y.; Wang, Y.; Li, H.; Huang, C.; Zhang, S.; Li, X.; et al. Chest CT Features of 182 Patients with Mild Coronavirus Disease 2019 (COVID-19) Pneumonia: A Longitudinal, Retrospective and Descriptive Study. Infect. Dis. Ther. 2020, 9, 1029–1041. [Google Scholar] [CrossRef] [PubMed]
  14. Zhan, J.; Li, H.; Yu, H.; Liu, X.; Zeng, X.; Peng, D.; Zhang, W. 2019 novel coronavirus (COVID-19) pneumonia: CT manifestations and pattern of evolution in 110 patients in Jiangxi, China. Eur. Radiol. 2021, 31, 1059–1068. [Google Scholar] [CrossRef] [PubMed]
  15. Chung, M.; Bernheim, A.; Mei, X.; Zhang, N.; Huang, M.; Zeng, X.; Cui, J.; Xu, W.; Yang, Y.; Fayad, Z.; et al. CT Imaging Features of 2019 Novel Coronavirus (2019-nCoV). Radiology 2020, 295, 202–207. [Google Scholar] [CrossRef] [PubMed] [Green Version]
  16. Soldati, G.; Smargiassi, A.; Inchingolo, R.; Buonsenso, D.; Perrone, T.; Briganti, D.F.; Perlini, S.; Torri, E.; Mariani, A.; Mossolani, E.E.; et al. Proposal for International Standardization of the Use of Lung Ultrasound for Patients with COVID-19: A Simple, Quantitative, Reproducible Method. J. Ultrasound Med. 2020, 39, 1413–1419. [Google Scholar] [CrossRef] [Green Version]
  17. Mayo, P.H.; Copetti, R.; Feller-Kopman, D.; Mathis, G.; Maury, E.; Mongodi, S.; Mojoli, F.; Volpicelli, G.; Zanobetti, M. Thoracic ultrasonography: A narrative review. Intensive Care Med. 2019, 45, 1200–1211. [Google Scholar] [CrossRef]
  18. Rinaldi, L.; Milione, S.; Fascione, M.C.; Pafundi, P.C.; Altruda, C.; Di Caterino, M.; Monaco, L.; Reginelli, A.; Perrotta, F.; Porta, G.; et al. Relevance of lung ultrasound in the diagnostic algorithm of respiratory diseases in a real-life setting: A multicentre prospective study. Respirology 2020, 25, 535–542. [Google Scholar] [CrossRef]
  19. Jalil, B.A.; Khan, A.; Kugasia, I.R.; Ijaz, M. Lung ultrasound in early SARS-CoV-2 pneumonia and the LUS-CoV criteria. In Baylor University Medical Center Proceedings; Taylor & Francis: Oxfordshire, UK, 2020; Volume 34, pp. 1–4. [Google Scholar] [CrossRef]
  20. Lugara, M.; Oliva, G.; Pafundi, P.C.; Tamburrini, S.; Nevola, R.; Gjeloshi, K.; Rinaldi, L. Clinical application of lung ultrasound score on COVID-19 setting: A regional experience in Southern Italy. Eur. Rev. Med. Pharmacol. Sci. 2021, 25, 3623–3631. [Google Scholar] [CrossRef] [PubMed]
  21. Pivetta, E.; Goffi, A.; Tizzani, M.; Locatelli, S.M.; Porrino, G.; Losano, I.; Leone, D.; Calzolari, G.; Vesan., M.; Steri, F.; et al. Lung Ultrasonography for the Diagnosis of SARS-CoV-2 Pneumonia in the Emergency Department. Ann. Emerg. Med. 2021, 77, 385–394. [Google Scholar] [CrossRef]
  22. Buonsenso, D.; Piano, A.; Raffaelli, F.; Bonadia, N.; de Gaetano Donati, K.; Franceschi, F. Point-of-Care Lung Ultrasound findings in novel coronavirus disease-19 pnemoniae: A case report and potential applications during COVID-19 outbreak. Eur. Rev. Med. Pharmacol. Sci. 2020, 24, 2776–2780. [Google Scholar] [CrossRef] [PubMed]
  23. Soldati, G.; Demi, M.; Smargiassi, A.; Inchingolo, R.; Demi, L. The role of ultrasound lung artifacts in the diagnosis of respiratory diseases. Expert. Rev. Respir. Med. 2019, 13, 163–172. [Google Scholar] [CrossRef] [PubMed]
  24. Delle Sedie, A.; Carli, L.; Cioffi, E.; Bombardieri, S.; Riente, L. The promising role of lung ultrasound in systemic sclerosis. Clin. Rheumatol. 2012, 31, 1537–1541. [Google Scholar] [CrossRef] [PubMed]
  25. Gutierrez, M.; Salaffi, F.; Carotti, M.; Tardella, M.; Pineda, C.; Bertolazzi, C.; Bichisecchi, E.; Filippucci, E.; Grassi, W. Utility of a simplified ultrasound assessment to assess interstitial pulmonary fibrosis in connective tissue disorders--preliminary results. Arthritis Res. Ther. 2011, 13, R134. [Google Scholar] [CrossRef] [PubMed] [Green Version]
  26. Ruaro, B.; Baratella, E.; Confalonieri, P.; Confalonieri, M.; Vassallo, F.G.; Wade, B.; Geri, P.; Pozzan, R.; Caforio, G.; Marrocchio, C.; et al. High-Resolution Computed Tomography and Lung Ultrasound in Patients with Systemic Sclerosis: Which One to Choose? Diagnostics 2021, 11, 2293. [Google Scholar] [CrossRef]
  27. Lokuge, A.; Alexander, J.; Land, B.; McAllister, A. Lung ultrasound in a respiratory pandemic. Emerg. Med. Australas. 2020, 32, 883–889. [Google Scholar] [CrossRef]
  28. Burkert, J.; Jarman, R.; Deol, P. Evolution of Lung Abnormalities on Lung Ultrasound in Recovery from COVID-19 Disease—A Prospective, Longitudinal Observational Cohort Study. J. Ultrasound. Med. 2022. [Google Scholar] [CrossRef]
  29. Soldati, G.; Smargiassi, A.; Inchingolo, R.; Buonsenso, D.; Perrone, T.; Briganti, D.F.; Perlini, S.; Torri, E.; Mariani, A.; Mossolani, E.E.; et al. Is There a Role for Lung Ultrasound During the COVID-19 Pandemic? J. Ultrasound. Med. 2020, 39, 1459–1462. [Google Scholar] [CrossRef] [Green Version]
  30. Soldati, G.; Smargiassi, A.; Inchingolo, R.; Sher, S.; Nenna, R.; Valente, S.; Inchingolo, C.D.; Corbo, G.M. Lung Ultrasonography may Provide an Indirect Estimation of Lung Porosity and Airspace Geometry. Respiration 2014, 88, 458–468. [Google Scholar] [CrossRef]
  31. Soldati, G.; Smargiassi, A.; Demi, L.; Inchingolo, R. Artifactual lung ultrasonography: It is a matter of traps, order, and disorder. Appl. Sci. 2020, 10, 1570. [Google Scholar] [CrossRef] [Green Version]
  32. Shafqat, A.; Shafqat, S.; Salameh, S.A.; Kashir, J.; Alkattan, K.; Yaqinuddin, A. Mechanistic insights into the immune pathophysiology of COVID-19; an in-depth review. Front. Immunol. 2022, 13, 835104. [Google Scholar] [CrossRef]
  33. Gattinoni, L.; Gattarello, S.; Steinberg, I.; Busana, M.; Palermo, P.; Lazzari, S.; Romitti, F.; Quintel, M.; Meissner, K.; Marini, J.J.; et al. COVID-19 pneumonia: Pathophysiology and management. Eur. Respir. Rev. 2021, 30, 210138. [Google Scholar] [CrossRef] [PubMed]
  34. Soldati, G.; Demi, M. What Is COVID 19 Teaching Us about Pulmonary Ultrasound? Diagnostics 2022, 12, 838. [Google Scholar] [CrossRef] [PubMed]
  35. Mongodi, S.; De Luca, D.; Colombo, A.; Stella, A.; Santangelo, E.; Corradi, F.; Gargani, L.; Rovida, S.; Volpicelli, G. Quantitative Lung Ultrasound: Technical aspects and clinical applications. Anesthesiology 2021, 134, 949–965. [Google Scholar] [CrossRef] [PubMed]
  36. Nguyen, M.; Gaujard, G.; Guinot, P.G.; Bouhemad, B.; L.U. S. Study Group. Using the lung ultrasound score to monitor disease progression for COVID-19-associated ARDS. Intensive Care Med. 2021, 47, 1329–1331. [Google Scholar] [CrossRef] [PubMed]
  37. Perrone, T.; Soldati, G.; Padovini, L.; Fiengo, A.; Lettieri, G.; Sabatini, U.; Gori, G.; Lepore, F.; Garolfi, M.; Palumbo, I.; et al. A New Lung Ultrasound Protocol Able to Predict Worsening in Patients Affected by Severe Acute Respiratory Syndrome Coronavirus 2 Pneumonia. J. Ultrasound Med. 2020; in press. [Google Scholar] [CrossRef] [PubMed]
  38. Demi, M.; Prediletto, R.; Soldati, G.; Demi, L. Physical Mechanisms Providing Clinical Information from Ultrasound Lung Images: Hypotheses and Early Confirmations. IEEE Trans. Ultrason. Ferroelectr. Freq. Control 2020, 67, 612–623. [Google Scholar] [CrossRef]
  39. Kumar, A.; Weng, I.; Graglia, S.; Lew, T.; Gandhi, K.; Lalani, F.; Chia, D.; Duanmu, Y.; Jensen, T.; Lobo, V.; et al. Point-of-Care Ultrasound predicts clinical outcomes in patients with COVID-19. J. Ultrasound Med. 2022, 67, 1367–1375. [Google Scholar] [CrossRef]
  40. Stecher, S.S.; Anton, S.; Fraccaroli, A.; Götschke, G. Lung ultrasound predicts clinical course but not outcome in COVID-19 ICU patients: A retrospective single-center analysis. BMC Anesthesiol. 2021, 21, 178. [Google Scholar] [CrossRef]
  41. Hoffmann, T.; Bulla, P.; Jödicke, L.; Klein, C.; Bott, S.M.; Keller, R.; Malek, N.; Fröhlich, E.; Göpel, S.; Blumenstock, G.; et al. Can follow up lung ultrasound in Coronavirus Disease-19 patients indicate clinical outcome? PLoS ONE 2021, 16, e0256359. [Google Scholar] [CrossRef]
  42. Wang, M.; Luo, X.; Wang, L.; Estill, J.; Lv, M.; Zhu, Y.; Wang, Q.; Xiao, X.; Song, Y.; Lee, M.S.; et al. A comparison of lung Ultrasound and Computed Tomography in the diagnosis of patients with COVID-19: A systematic Review and Meta-Analysis. Diagnostics 2021, 11, 1351. [Google Scholar] [CrossRef]
  43. Buda, N.; Cylwik, J.; Mróz, K.; Rudzińska, R.; Dubik, P.; Malczewska, A.; Oraczewska, A.; Skoczyński, S.; Suska, A.; Górecki, T.; et al. Lung Ultrasound examination in patients with SARS-CoV-2 Infection: Multicenter study. J. Clin. Med. 2021, 10, 3255. [Google Scholar] [CrossRef] [PubMed]
  44. Lichter, Y.; Topilsky, Y.; Taieb, P.; Banai, A.; Hochstadt, A.; Merdler, I.; Oz, A.G.; Vine, J.; Goren, O.; Cohen, B.; et al. Lung ultrasound predicts clinical course and outcomes in COVID-19 patients. Intensive Care Med. 2020, 46, 1873–1883. [Google Scholar] [CrossRef] [PubMed]
  45. Zhao, L.; Yu, K.; Zhao, Q.; Tian, R.; Xie, H.; Xie, L.; Deng, P.; Xie, G.; Bao, A.; Du, J. Lung Ultrasound Score in Evaluating the Severity of Coronavirus Disease 2019 (COVID-19) Pneumonia. Ultrasound Med. Biol. 2020, 46, 2938–2944. [Google Scholar] [CrossRef] [PubMed]
  46. Falster, C.; Jacobsen, N.; Wulff Madsen, L.; Dahlerup Rasmussen, L.; Davidsen, J.R.; Christie Knudtzen, F.; Nielsen, S.L.; Johansen, I.S.; Laursen, C.B. Lung ultrasound may be a valuable aid in decision making for patients admitted with COVID-19 disease. Eur. Clin. Respir. J. 2021, 8, 1909521. [Google Scholar] [CrossRef]
  47. Nishiura, H.; Kobayash, T.; Miyama, T.; Suzuki, A.; Jung, S.M.; Hayashi, K.; Kinoshita, R.; Yang, Y.; Yuan, B.; Akhmetzhanov, A.R.; et al. Estimation of the asymptomatic ratio of novel coronavirus infections (COVID-19). Int. J. Infect. Dis. 2020, 94, 154–155. [Google Scholar] [CrossRef]
  48. Mizumoto, K.; Kagaya, K.; Zarebski, A.; Chowell, G. Estimating the asymptomatic proportion of coronavirus disease 2019 (COVID-19) cases on board the Diamond Princess cruise ship, Yokohama, Japan, 2020. Eurosurveillance 2020, 25, 2000180. [Google Scholar] [CrossRef] [Green Version]
  49. Puylaert, C.A.J.; Scheijmans, J.C.G.; Borgstein, A.B.J.; Andeweg, C.S.; Bartels-Rutten, A.; Beets, G.L.; van Berge Henegouwen, M.I.; Braak, S.J.; Couvreur, R.; Daams, F.; et al. Yield of Screening for COVID-19 in Asymptomatic patients before Elective or Emergency Surgery Using Chest CT and RT-PCR (SCOUT). Ann. Surg. 2020, 272, 919–924. [Google Scholar] [CrossRef]
  50. Pelosi, P.; Tonelli, R.; Torregiani, C.; Baratella, E.; Confalonieri, M.; Battaglini, D.; Marchioni, A.; Confalonieri, P.; Clini, E.; Salton, F.; et al. Different Methods to Improve the Monitoring of Noninvasive Respiratory Support of Patients with Severe Pneumonia/ARDS Due to COVID-19: An Update. J. Clin. Med. 2022, 11, 1704. [Google Scholar] [CrossRef] [PubMed]
  51. Bouhemad, B.; Liu, Z.H.; Arbelot, C.; Zhang, M.; Ferarri, F.; Le-Guen, M.; Girard, M.; Lu, Q.; Rouby, J.-J. Ultrasound assessment of anti- biotic-induced pulmonary reaeration in ventilator-associated pneumo-nia. Crit. Care Med. 2010, 38, 84–92. [Google Scholar]
  52. Baldi, G.; Gargani, L.; Abramo, A.; D’Errico, L.; Caramella, D.; Picano, E.; Giunta, F.; Forfori, F. Lung water assessment by lung ultrasonography in intensive care: A pilot study. Intensive Care Med. 2013, 39, 74–84. [Google Scholar] [CrossRef]
  53. Demi, M.; Buda, N.; Soldati, G. Vertical Artifacts in Lung Ultrasonography: Some Common Clinician Questions and the Related Engineer Answers. Diagnostics 2022, 12, 215. [Google Scholar] [CrossRef] [PubMed]
Figure 1. 12-zone method; anterior, lateral, and posterior chest. In each zone a score was assigned; 0 = no B-lines; 1 = multiple spaced or isolated B-lines; 2 = diffused coalescent B-lines; 3 = lung consolidation.
Diagnostics 12 01856 g001
Figure 2. Linear regression analysis and dispersion graph.
Diagnostics 12 01856 g002
Figure 3. CT and LUS imaging scans of different scores. In these figures the pleural line (indicated by red arrows) is indented, and vertical areas of white (blue arrows) are visible below the indent, which reflect local alterations in the acoustical properties of the lung caused by replacement of air with water, blood, or collapsed tissue. A typical case of a COVID-19 pneumonia patient. (a) B-lines at the right and left of the lower lateral lung reflecting pneumonia (score 2); (b) B-lines at the right and left of the lower lateral lung reflecting pneumonia (score 3); (c) chest CT showing multiple infiltrations.
Diagnostics 12 01856 g003
Table 1. Anthropometric, demographic, clinical, and biochemical characteristics of the study cohort (n = 99).
ParametersValues
Age (years), median [IQR]71 [58–78]
Sex, n (%)
M
F
 
68 (68.7)
31 (31.3)
Signs and Symptoms
Presence of fever, n (%)90 (90.9)
Presence of cough, n (%)90 (90.9)
Pharyngeal hyperemia, n (%)63 (63.6)
Asthenia, n (%)76 (76.8)
Vomiting, n (%)5 (5.1)
Diarrhea, n (%)11 (11.1)
Dyspnea, n (%)89 (89.9)
Tachycardia, n (%)67 (67.7)
Phenotype, n (%)
type 1
type 2
type 3
type 4
 
7 (7.1)
21 (21.2)
60 (60.6)
11 (11.1)
Pre-existing ComorbiditiesValues
Hypertension, n (%)85 (85.9)
Diabetes, n (%)34 (34.3)
Atrial fibrillation, n (%)13 (13.1)
Ischemic heart disease, n (%)33 (33.3)
Ictus, n (%)14 (14.1)
Dementia, n (%)31 (31.3)
Chronic obstructive pulmonary disease (COPD), n (%)56 (56.6)
Active cancer in the last five years, n (%)14 (14.1)
Hyperinflammatory syndrome %84 (84.8)
Smoke, n (%)66 (66.7)
Obesity, n (%)
No
Grade I
Grade II
Grade III
 
58 (59.6)
30 (30.3)
8 (8.1)
2 (2)
Chronic liver disease, n (%)7 (7.1)
Chronic kidney disease, n (%)31 (31.3)
Mortality, n (%)21 (21.2)
Days of hospitalization, median [IQR]30 [20–40]
Ventilation, median [IQR]0.50 [0.28–0.60]
Oxygen interface, n (%)
None
Nasal cannula
Venturi Mask
CPAP/Bi-level
Orotracheal Intubation
14 (14.1)
18 (18.2)
40 (40.4)
25 (25.3)
2 (2)
Therapy
Anticoagulants, n (%)72 (72.7)
Antiplatelets, n (%)35 (35.4)
ACE Inhibitors, n (%)32 (32.3)
Ultrasound thoracic, median [IQR]28 [20–36]
Ultrasound score, n (%)
Score 02 (2)
Score 118 (18.2)
Score 247 (47.6)
Score 332 (32.2)
CT score, mean (SD)12.63 (5.72)
CT score, n (%)
Score 1
Score 2
Score 3
20 (20.2)
59 (59.6)
20 (20.2)
Abbreviations: IQR: interquartile range; SD: standard deviation; M: male; F: female; BMI: body mass index. The biochemical parameters and the blood-gas analysis results are shown in Table 2. In general, patients were characterized by hyper-inflammation syndrome, lymphopenia, high levels of C-reactive protein, neutrophils, and ferritin, and abnormal coagulation parameters (fibrinogen, d-dimer).
Table 2. Laboratory characteristics of the study population (n = 99).
LaboratoryValues
Hb (mg/dL), mean (SD)12.2 (2.2)
White blood cells (×103), mean (SD)9.73 (4.38)
Lymphocytes (a.v.), median [IQR]0.8 [0.6–1.3]
Neutrophils (a.v.), mean (SD)7.56 (3.15)
Platelets, mean (SD)282,098 (141,397)
Azotemia (mg/dL), mean (SD)54.7 (34.85)
Creatinine (mg/dL), median [IQR]0.9 [0.8–1.2]
Sodium (mmol/L), mean (SD)138.8 (4.2)
Potassium (mmol/L), mean (SD)4.8 (3.9)
AST (U/L), mean (SD)42.6 (124.6)
ALT (U/L), mean (SD)48.8 (136.8)
Glycemia (mg/dL), median [IQR]110 [88.3–175]
CRP (mg/dL), median [IQR]5 [2.6–12]
INR, median [IQR]1.12 [1.10–1.20]
aPTT (s), mean (SD)31 (6.8)
Fibrinogen (mg/dL), mean (SD)483.3 (141.4)
Nt-pro-bnp (pg/mL), median [IQR]1578 [600–3500]
D-Dimer (pg/mL), median [IQR]2300 [782.5–4210]
LDH (mU/mL), mean (SD)361.5 (138.4)
Troponin (ng/mL), median [IQR]0.032 [0.014–0.090]
Procalcitonin (ng/mL), median [IQR]0.2 [0.03–0.90]
Ferritin (ng/mL), median [IQR]450 [280–700]
Blood Gas Analysis
pH, median [IQR]7.45 [7.40–7.47]
pO2 (mmHg), median [IQR]68 [58.3–84.8]
pCO2 (mmHg), median [IQR]35 [33–42]
HCO3- (mmol/L), median [IQR]25 [23–26]
spO2 (%), median [IQR]93.1 [90–96]
Lactates (mmol/L), median [IQR]2.25 (1.02)
P/F, median [IQR]231 [136.3–295.3]
FiO2 admission, median [IQR]0.30 [0.21–0.50]
Abbreviations: IQR: interquartile range; SD: standard deviation; Hb: hemoglobin; PLT: platelets; AST: aspartate aminotransferase; ALT: alanine aminotransferase; CRP: C-reactive protein; LDH: lactate dehydrogenase; CPK: creatine phosphokinase. Reference ranges: [Hb] F = 12–16/M = 12–18 g/dL; WBCs: 4500–11,000, Neutrophils: 1500–7000; Lymphocytes: 1500–7000; PLT: 150,000–450,000; Azotemia: 15–50 mg/dL; Serum Creatinine: 0.51–0.95 mg/dL; Sodium: 135–145 mmol/L; Potassium: 3.5–5 mEq/L; AST (F = 8–43 U/L; M = 8–48 U/L); ALT (F = 7–45 U/L, M = 7–55 U/L); Glycemia: 60–110 mg/dL; CRP: 5–10 mg/dL; INR: 0.9–1.3; aPTT: 28–40 s; Fibrinogen: 200–400 mg/dL; NT-proBNP: ≤900 pg/mL; D-Dimer: <500 pg/mL; LDH: 80–300 mU/mL; Troponin: <0.1; procalcitonin: 0–1; ferritin: M: 20–200 ng/mL, F: 20–120 ng/mL; Iron: M: 31–144 μg/dL, F: 25–156 μg/dL; CPK: 60–190 U/L. Blood gas ranges: pH: 7.35–7.45; pO2: 80–100 mmHg; pCO2: 35–45 mmHg; HCO3−: 22–26 mmol/L; spO2: 95–100%; Lactates: <2 mmol/L.
Table 3. Univariate analysis of relationships between ultrasound thoracic score and other parameters in patients infected by COVID-19.
ParametersCorrelation Coefficientp
Age (years)0.2890.034
Dyspnoea0.3190.051
Tachycardia0.4570.002
COVID-19 phenotype0.589<0.001
Dementia0.1970.256
Platelets−0.1180.286
Prothrombin time0.0570.917
NT-proBNP0.1740.419
D-dimer0.2180.047
pH−0.4690.008
pO2−0.4860.003
spO2−0.2260.467
P/F−0.689<0.001
Death of patients0.4920.008
Ventilation0.562<0.001
Lactates0.4790.001
Table 4. Univariate analysis of the relationships between CT score and other parameters in patients infected by COVID-19.
ParametersCorrelation Coefficientp
Age (years)0.3690.029
Dyspnoea0.488<0.001
Tachycardia0.3210.007
COVID-19 phenotype0.639<0.001
Dementia0.1240.298
Platelets−0.1890.321
Prothrombin time0.0250.874
NT-proBNP0.0980.513
D-dimer0.2890.041
pH−0.3960.019
pO2−0.470<0.001
spO2−0.1990.148
P/F−0.762<0.001
Death of patients0.4660.001
Ventilation0.503<0.001
Lactates0.4420.001
Table 5. ROC-AUC value of the LUS score compared to the different factor.
AUC of LUS ScoreAUC (95% CI)
Dyspnea0.77 (0.61–0.92)
Tachycardia0.79 (0.68–0.879
Dementia0.57 (0.45–0.69)
Mortality0.70 (0.59–0.82)
Publisher’s Note: MDPI stays neutral with regard to jurisdictional claims in published maps and institutional affiliations.

