
Commercially Available Heart Rate Monitor Repurposed for Automatic Arrhythmia Detection with Snapshot Electrocardiographic Capability: A Pilot Validation

 ,
,  and
and 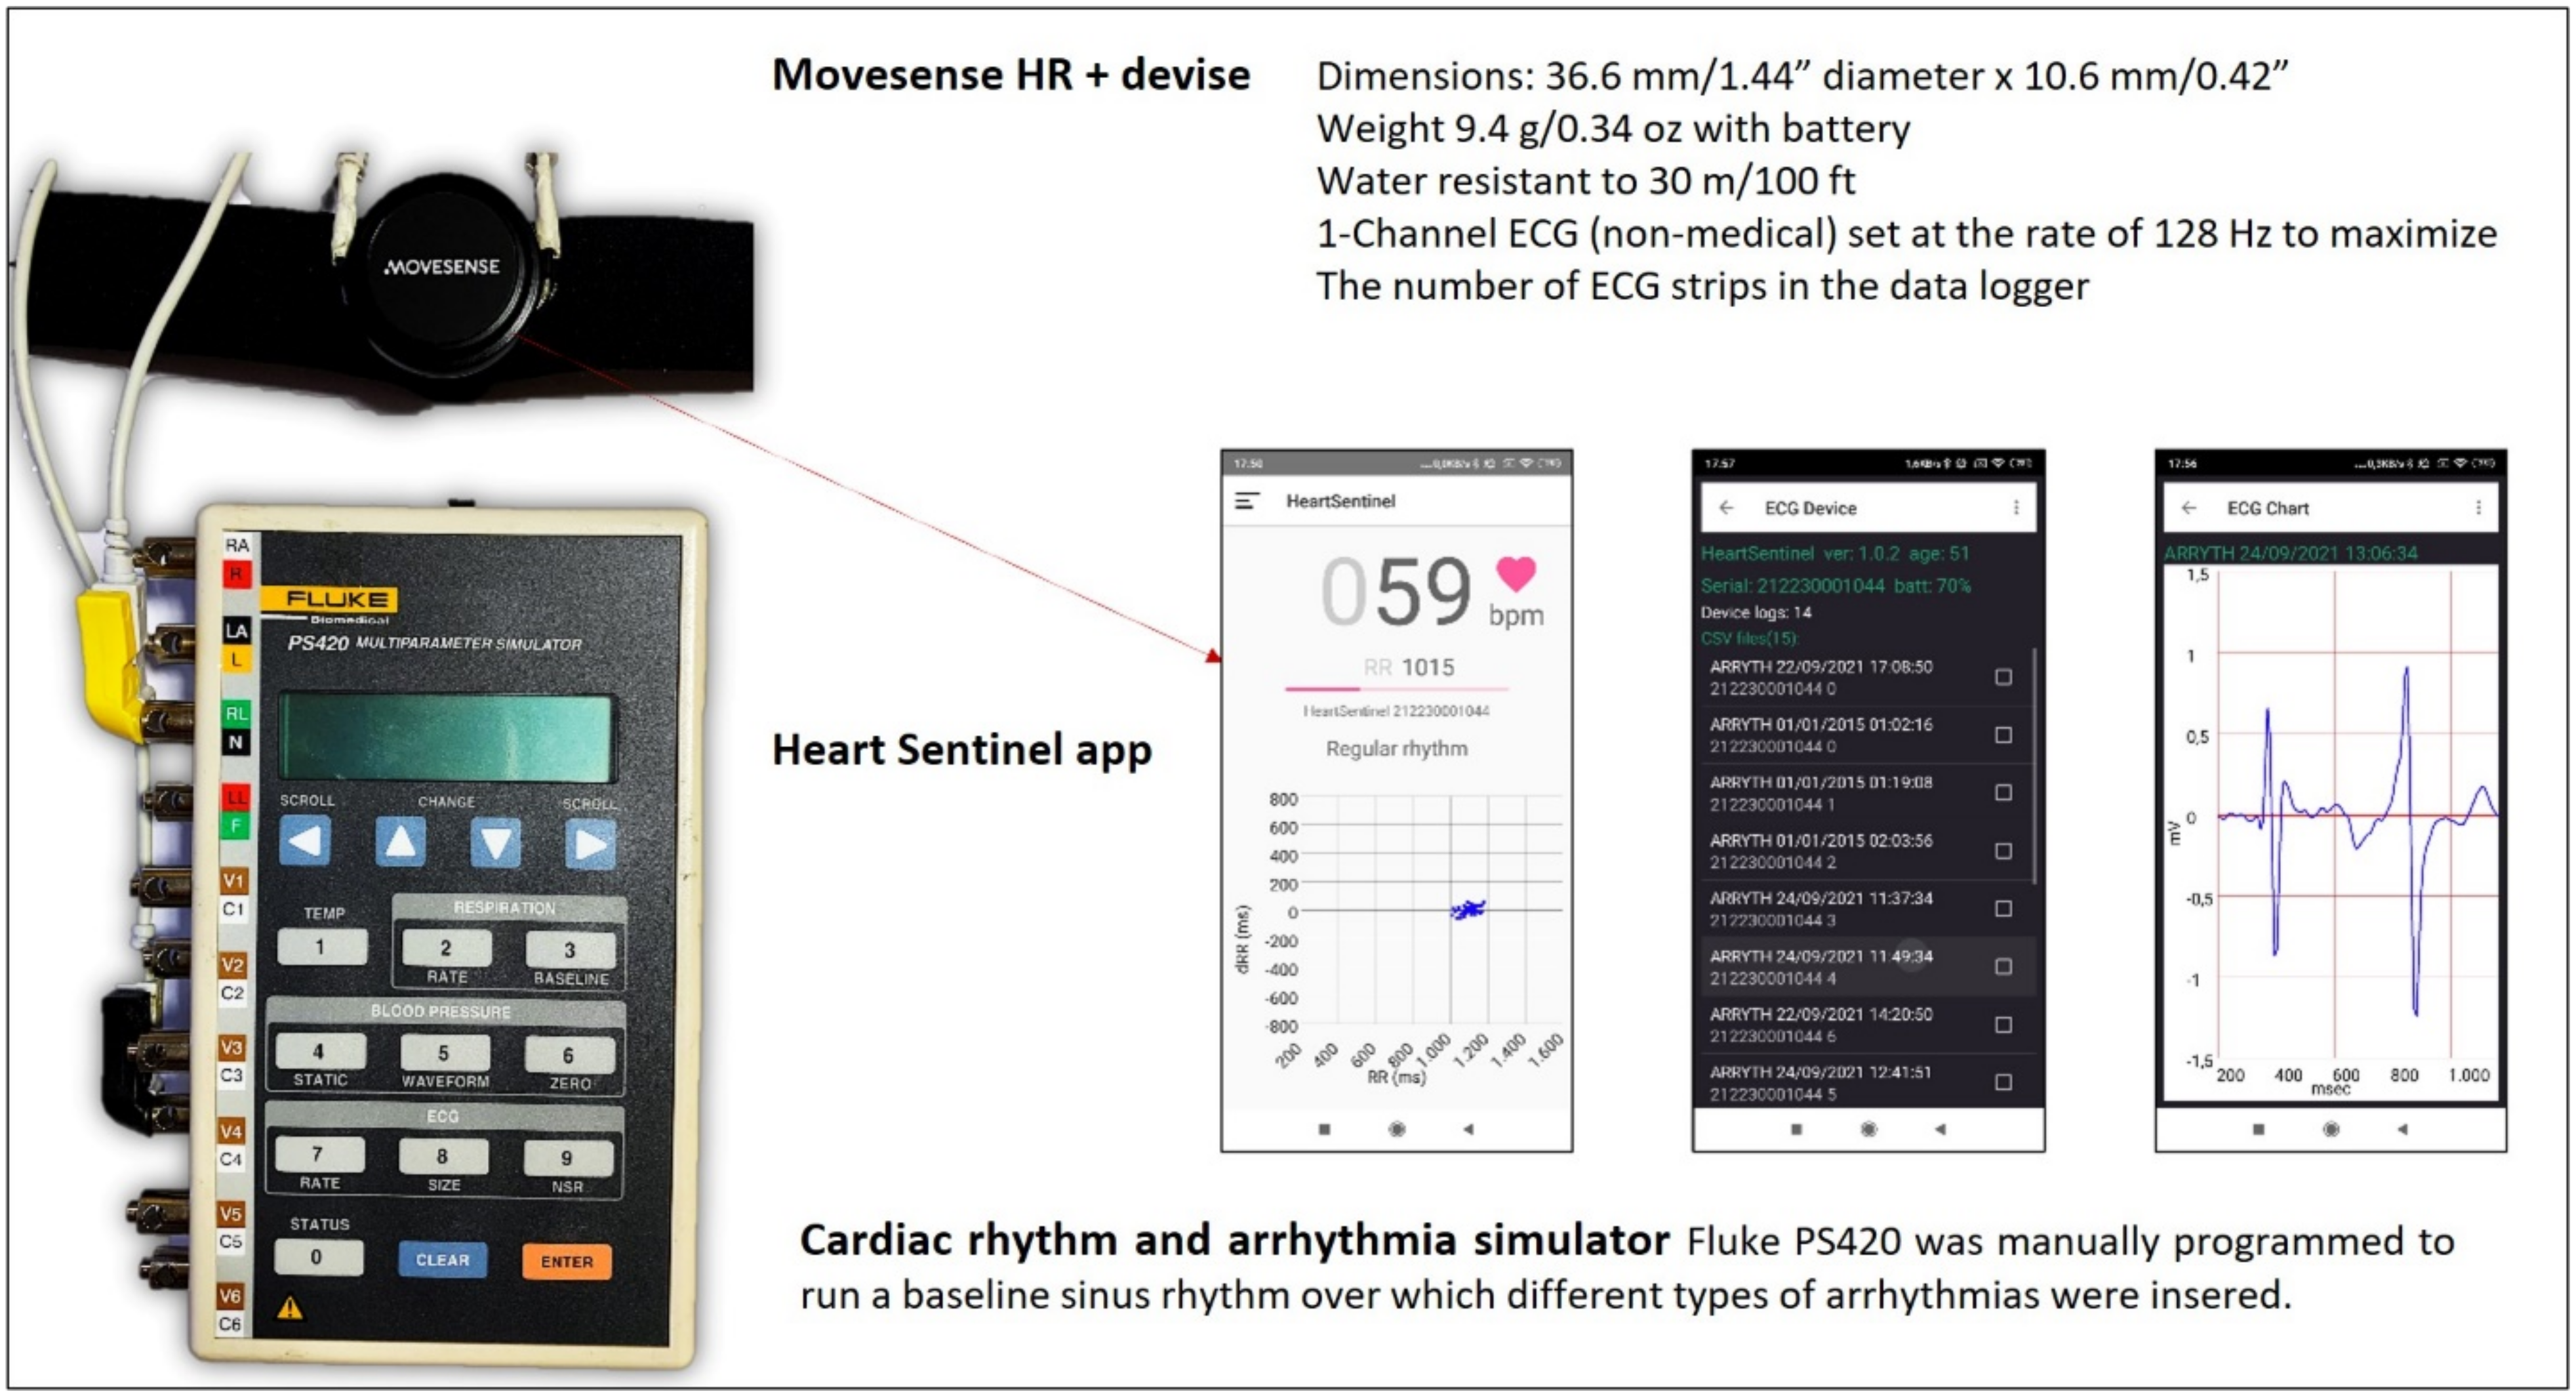
Abstract
:1. Introduction
2. Materials and Methods
2.1. The Custom Programmed Sensor
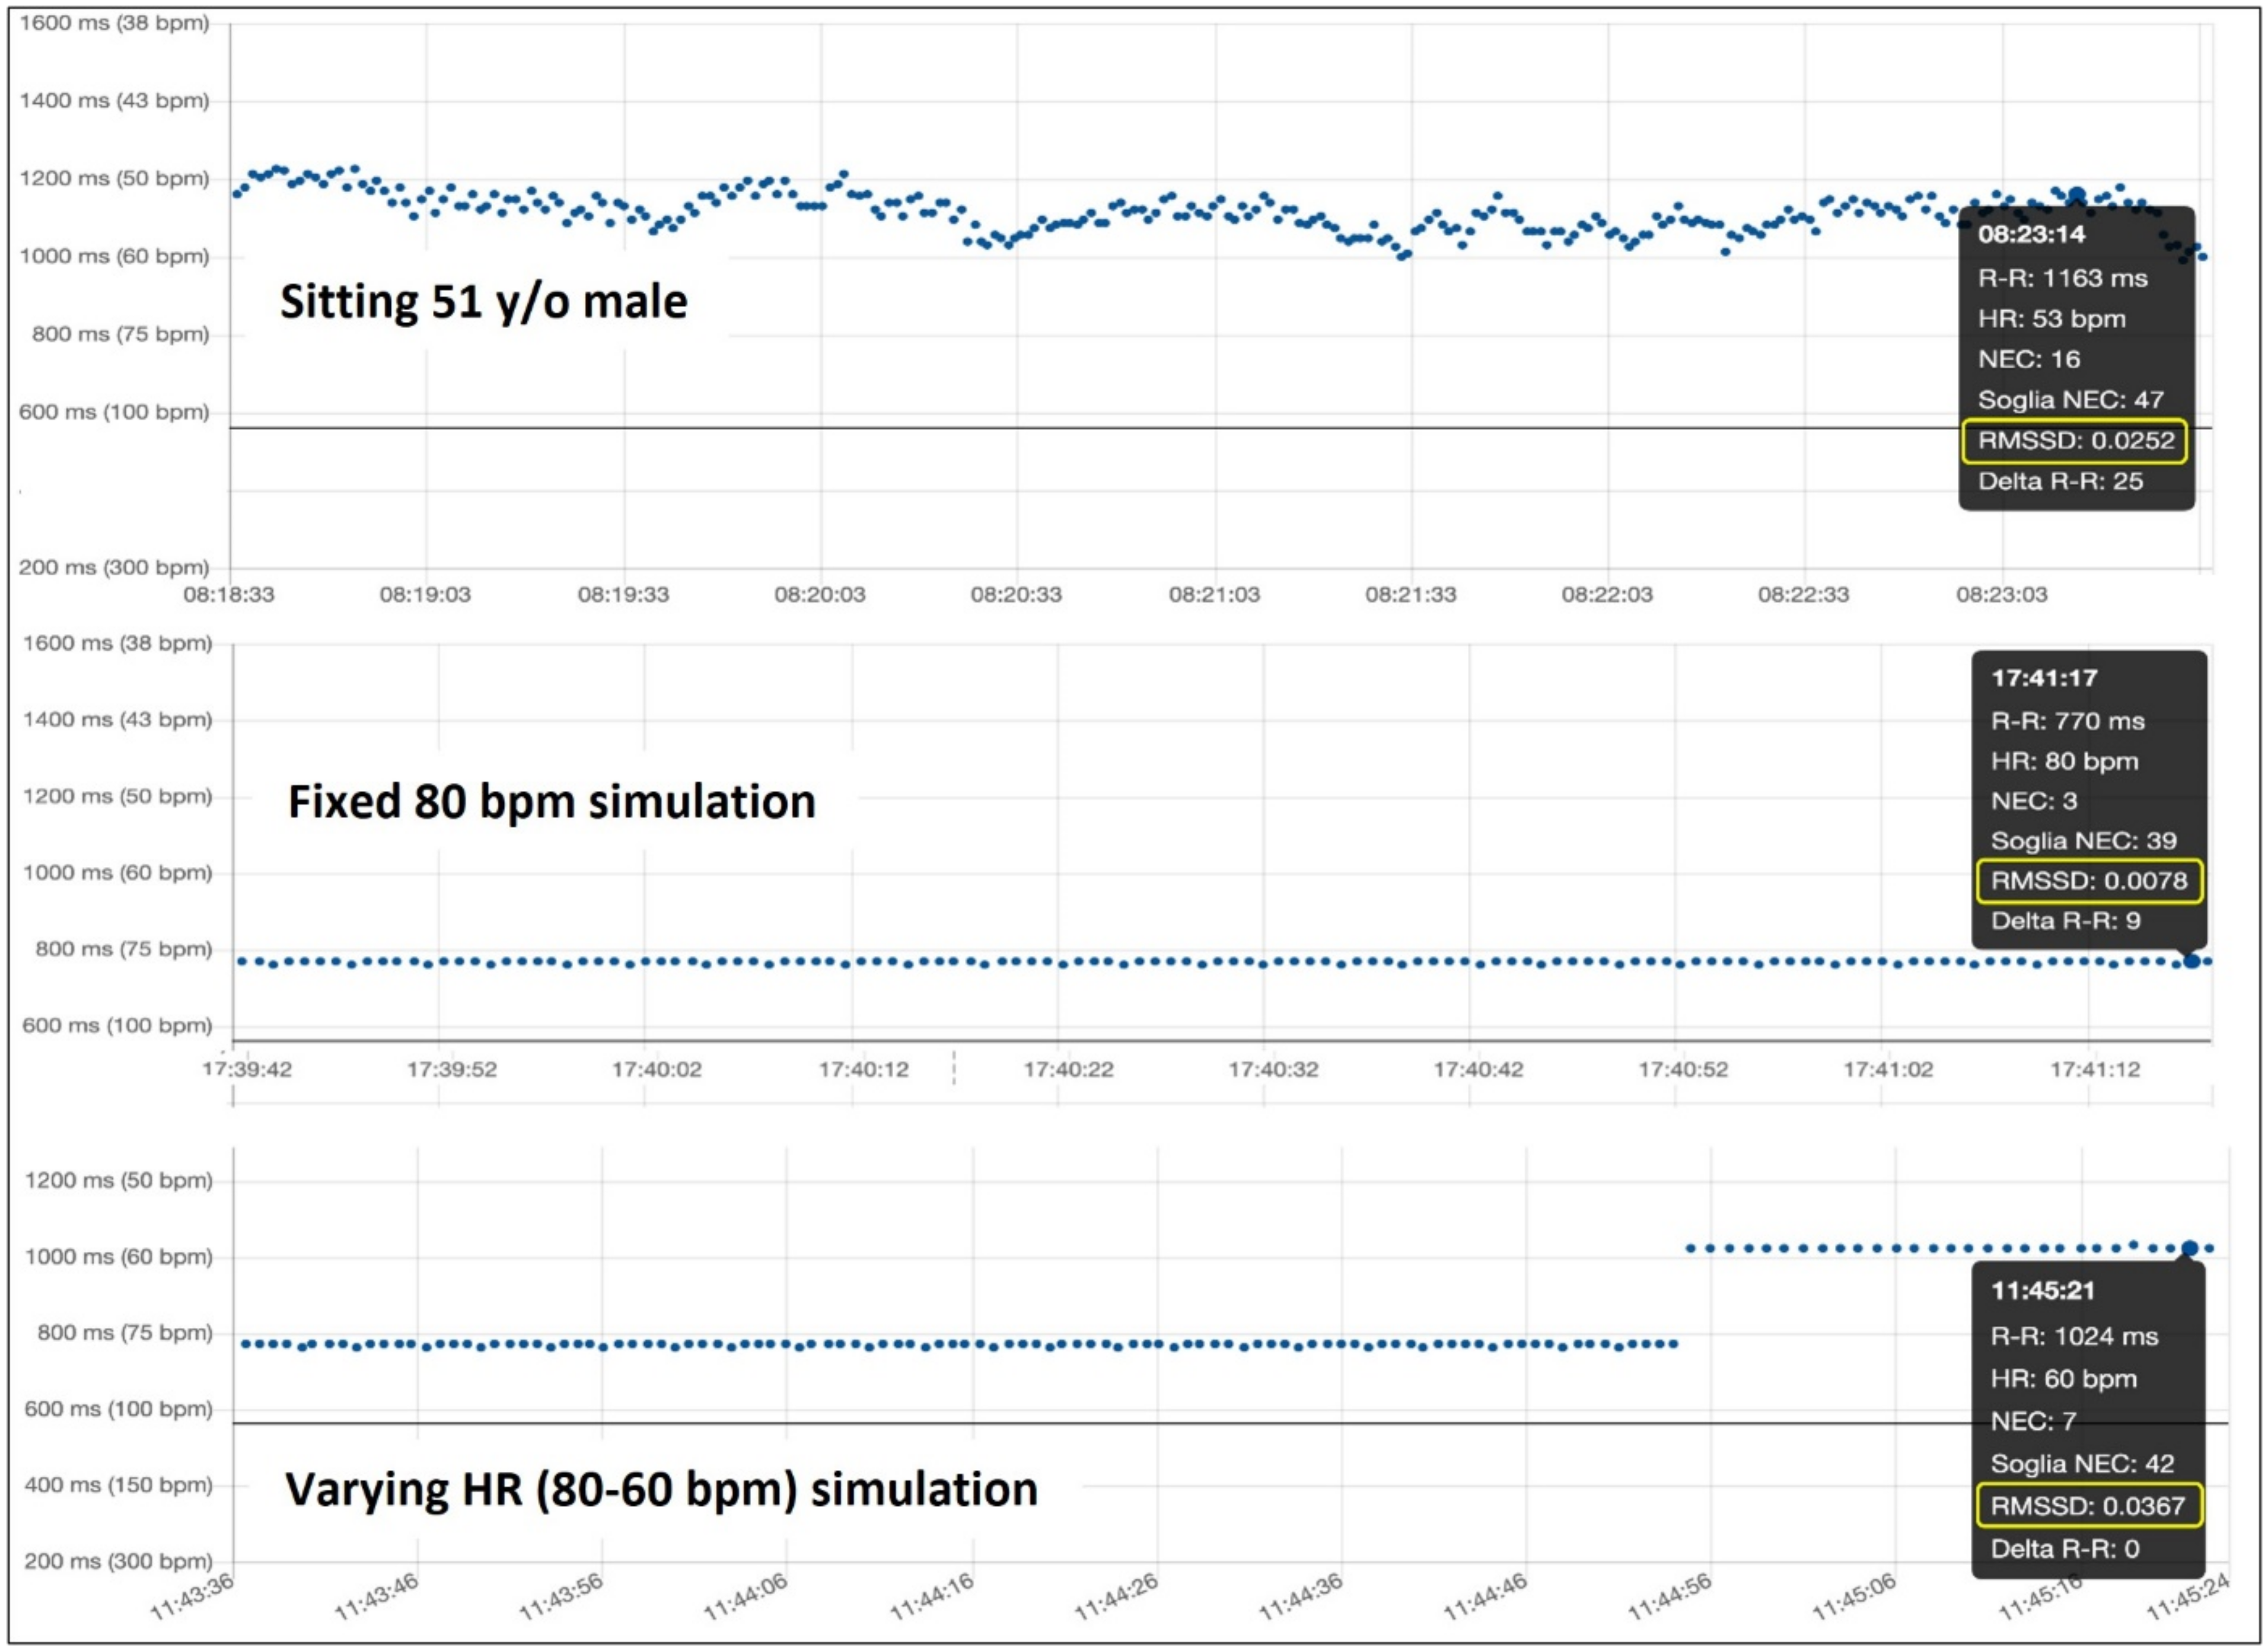
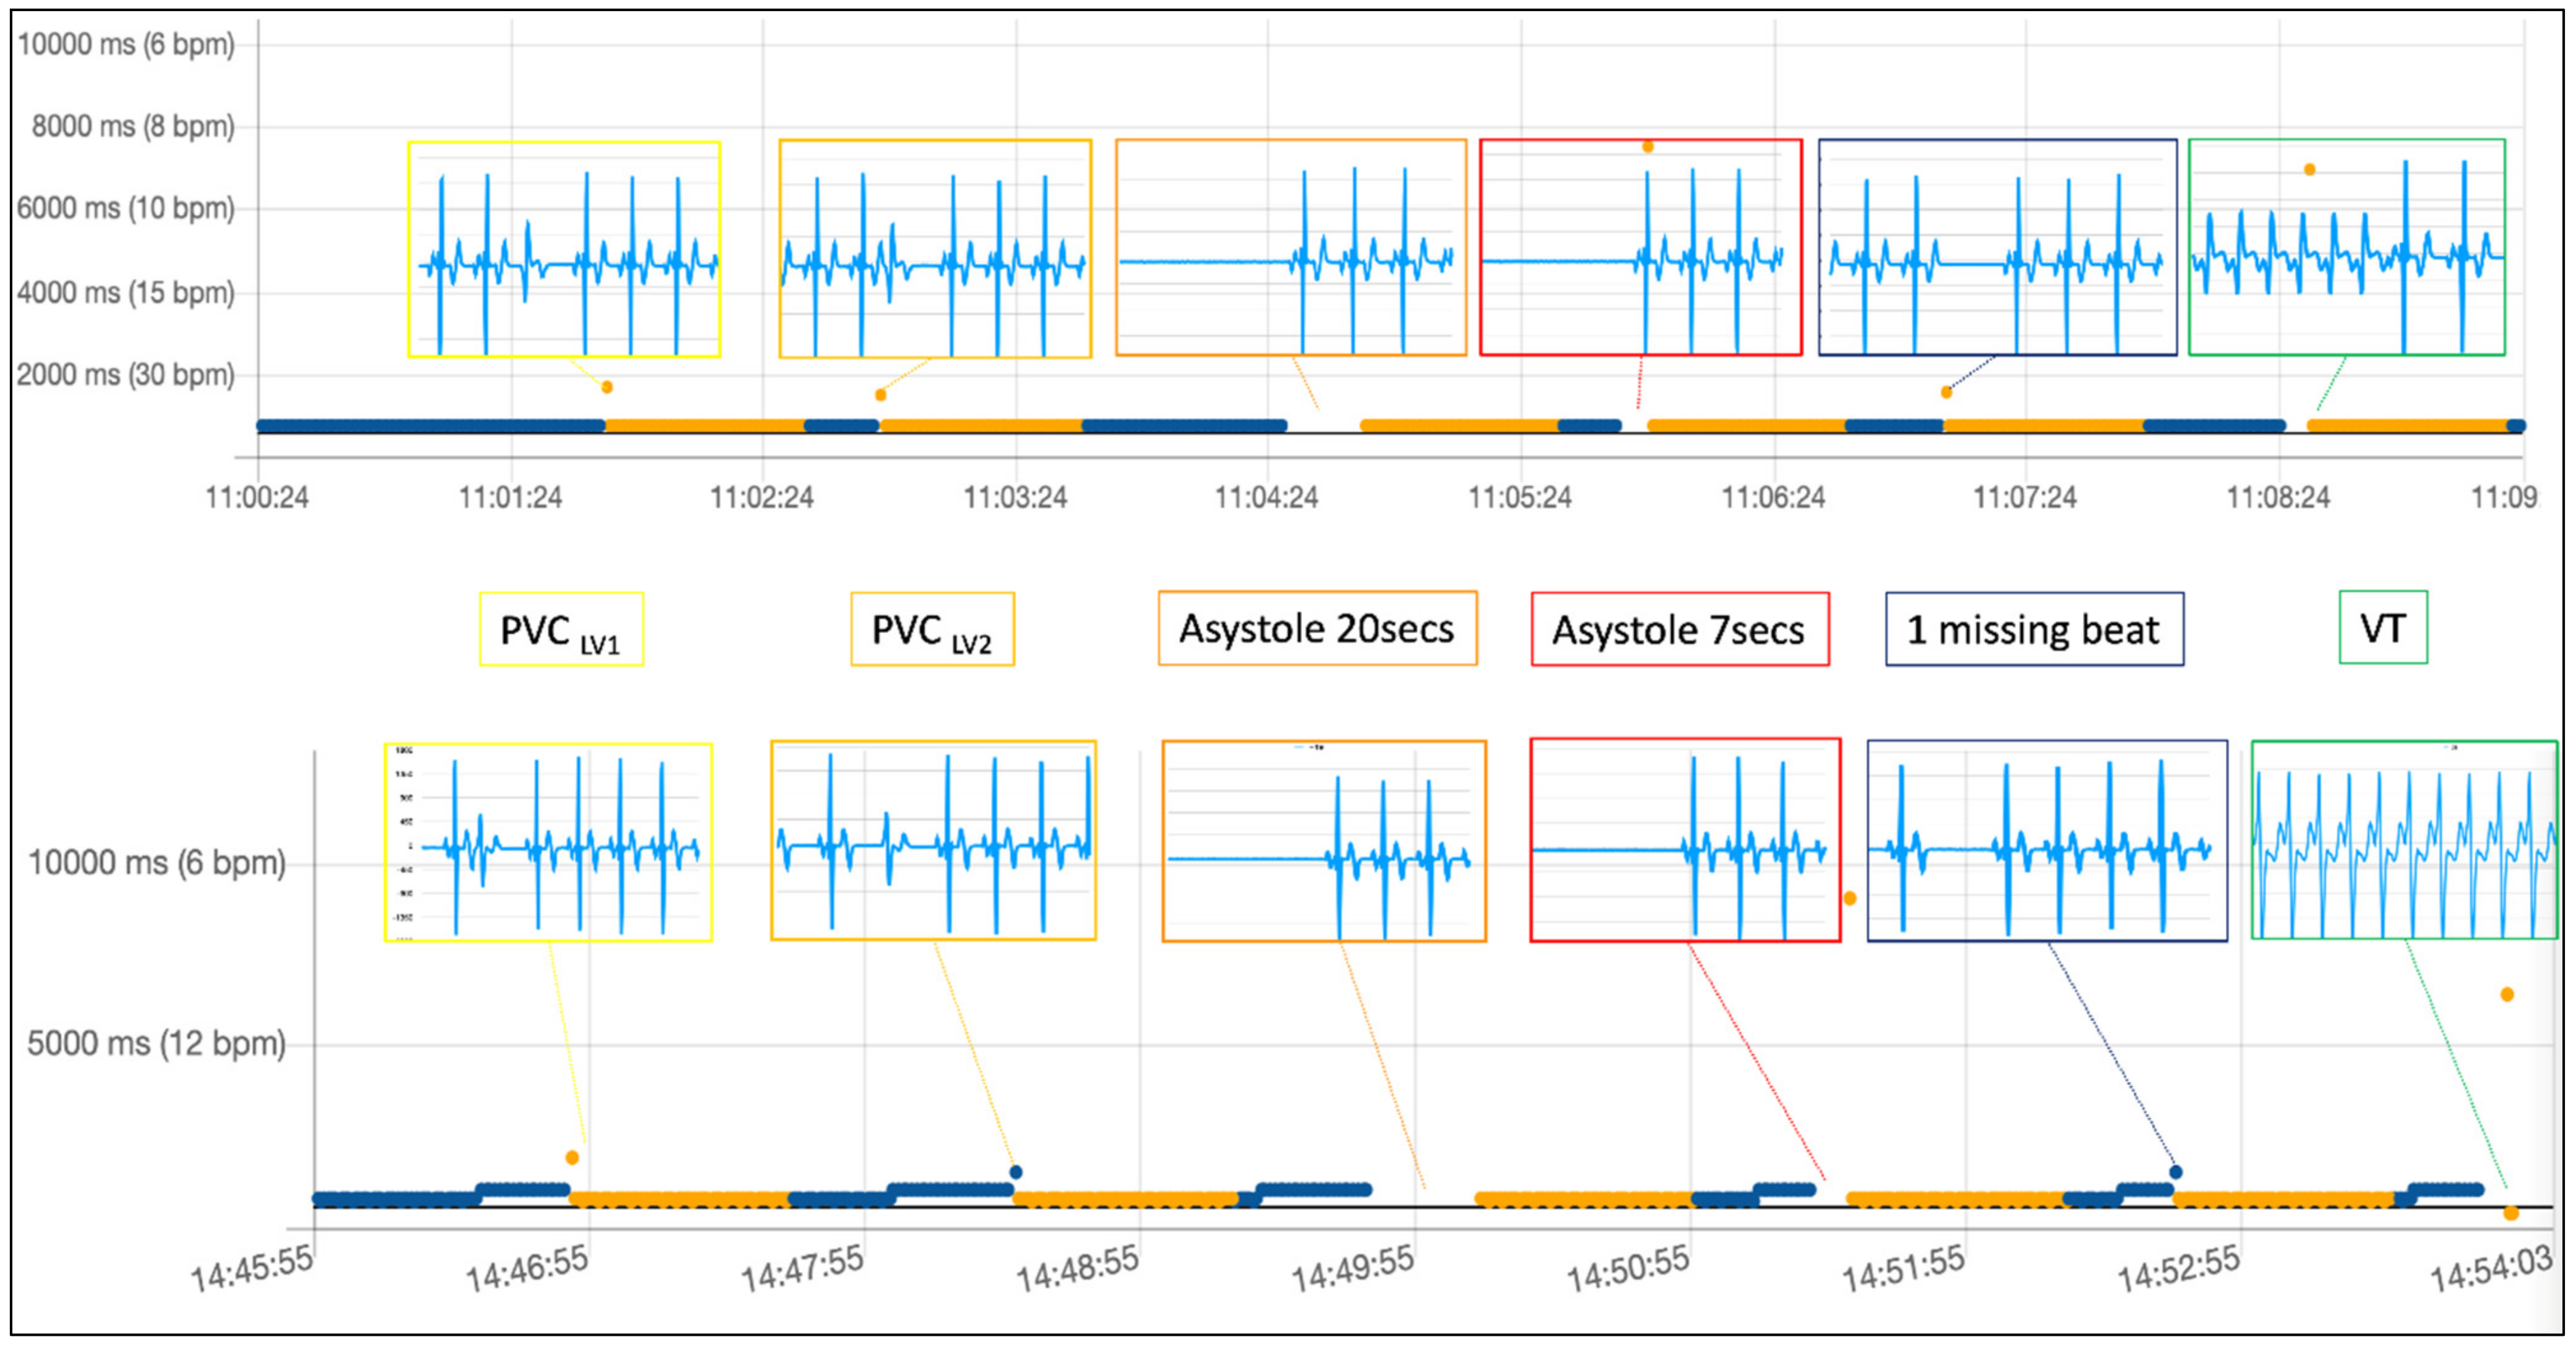
2.2. The Simulation Environment
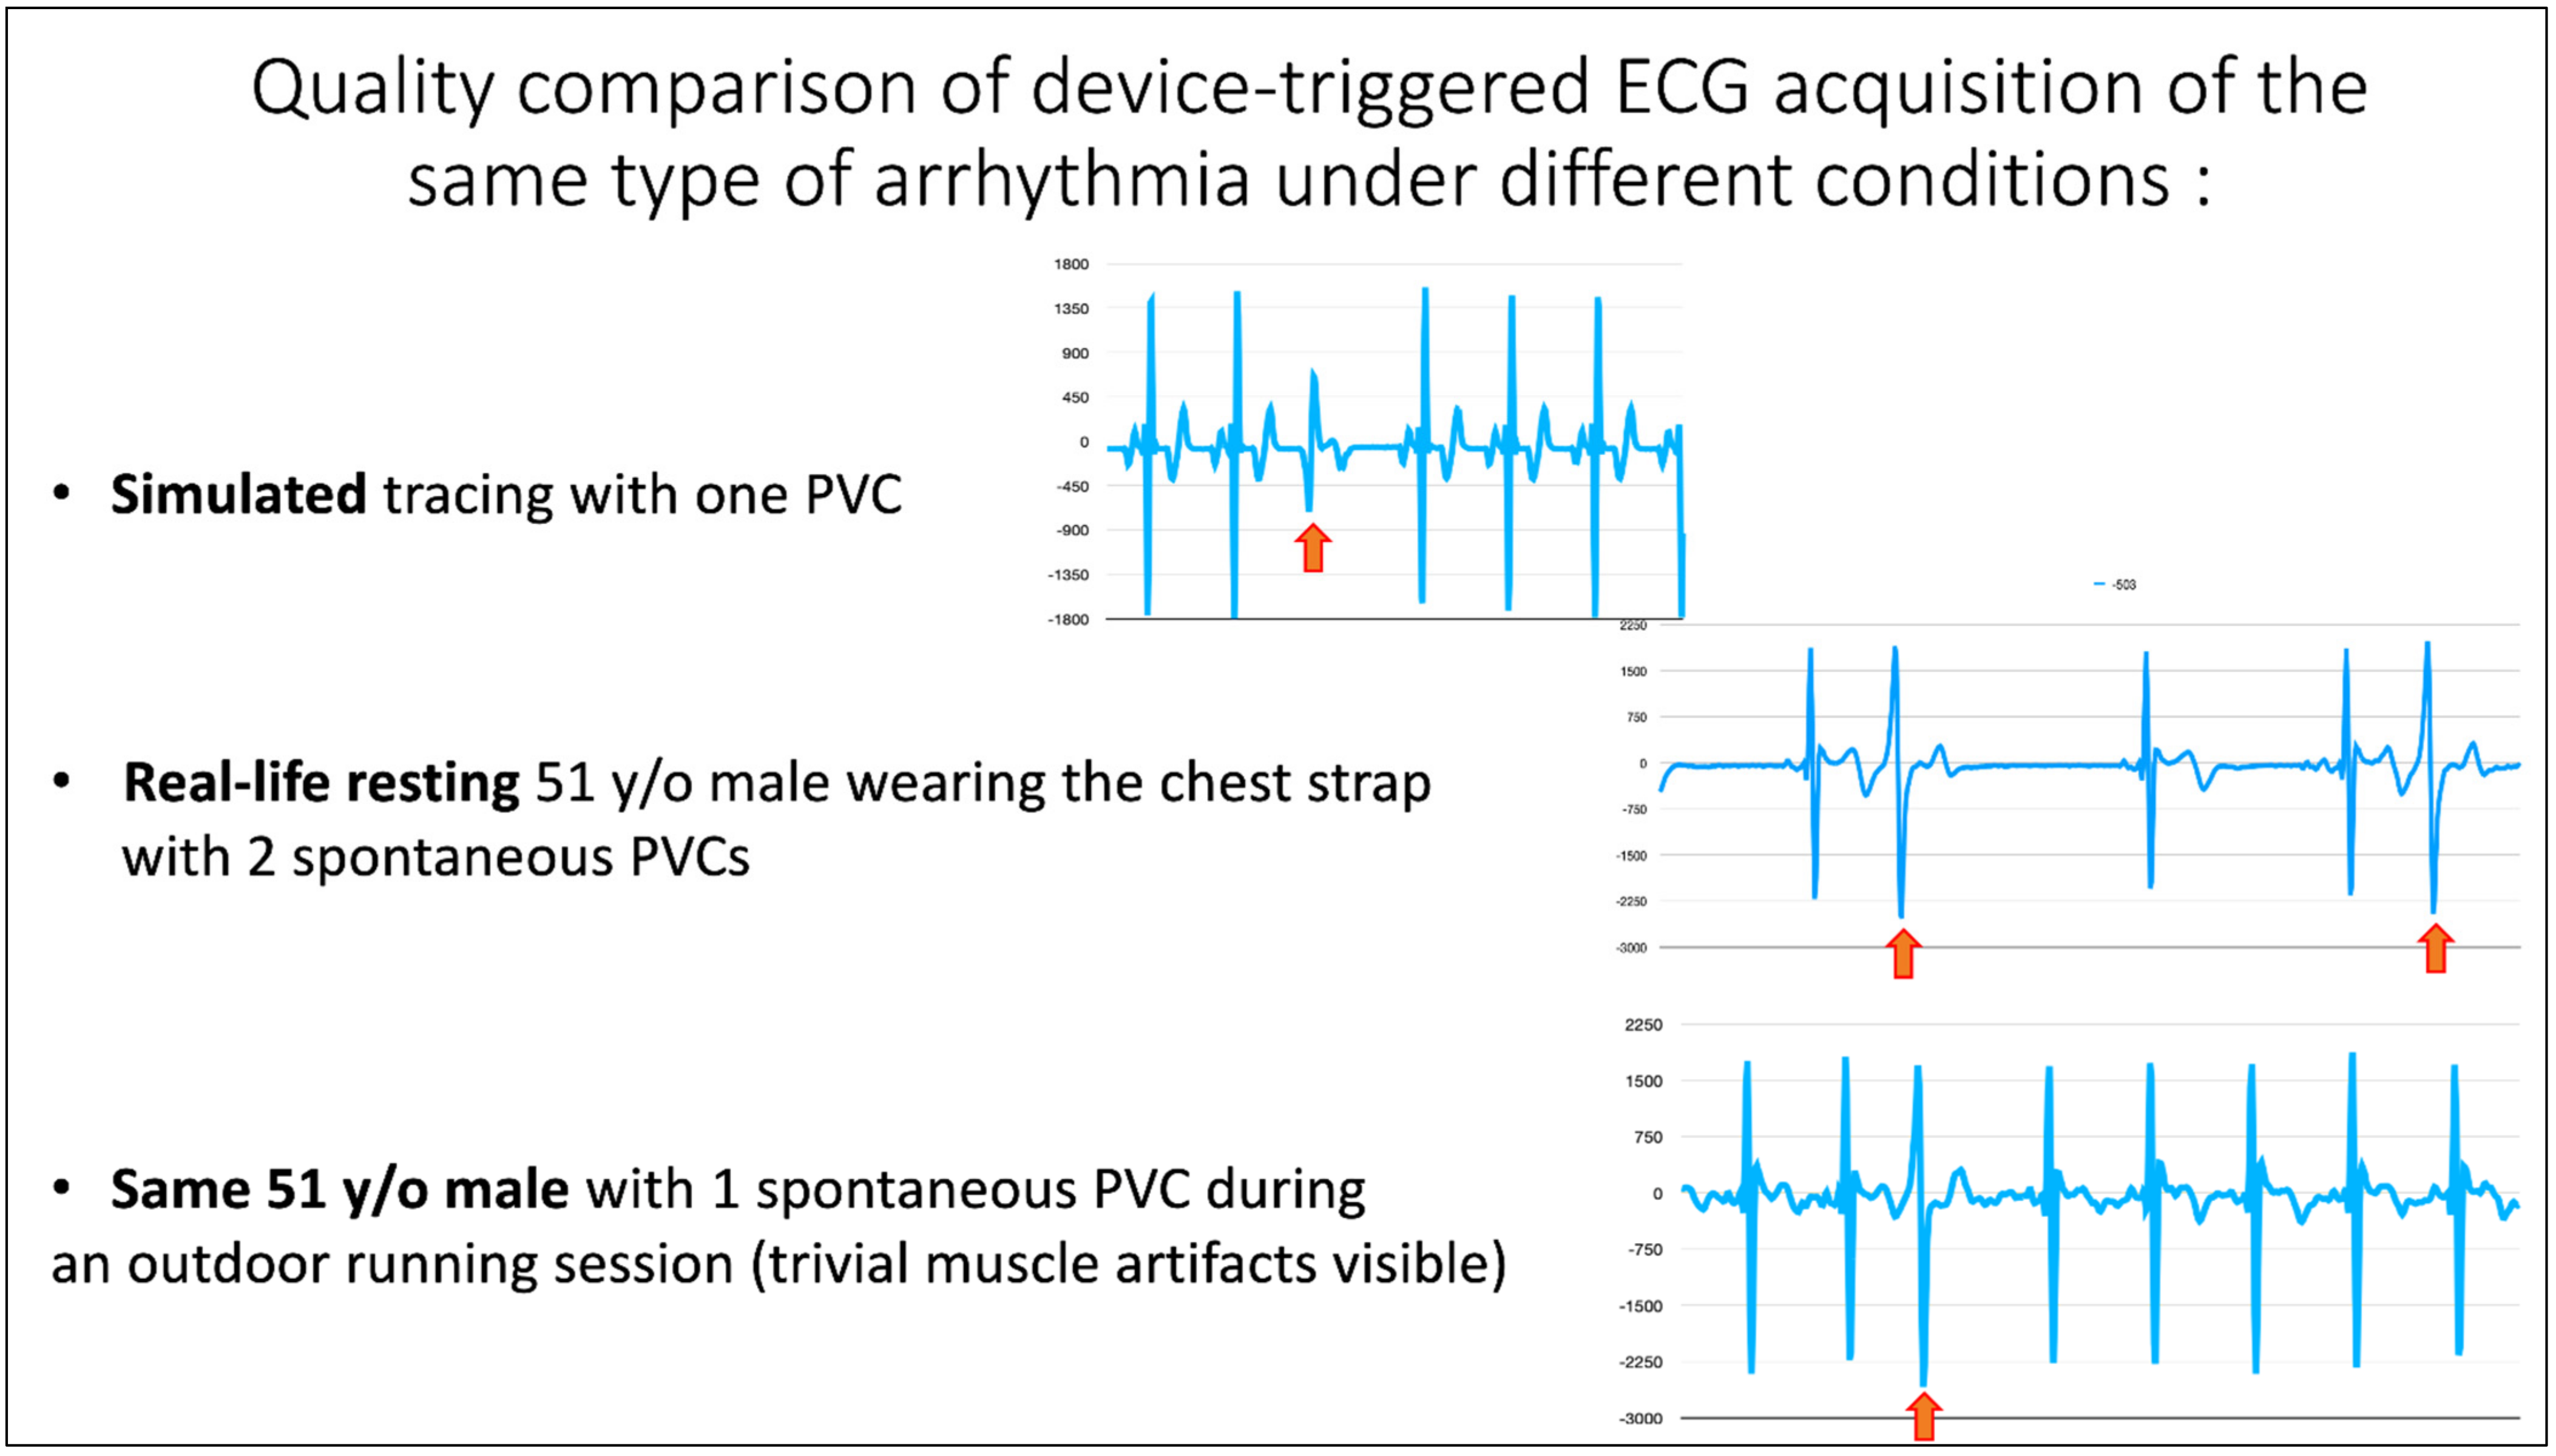
3. Results
4. Conclusions and Future Work
Author Contributions
Funding
Institutional Review Board Statement
Informed Consent Statement
Data Availability Statement
Conflicts of Interest
References
- Noseworthy, P.A.; Kaufman, E.S.; Chen, L.Y.; Chung, M.K.; Elkind, M.S.; Joglar, J.A.; Leal, M.A.; McCabe, P.J.; Pokorney, S.D.; Yao, X. Subclinical and Device-Detected Atrial Fibrillation: Pondering the Knowledge Gap: A Scientific Statement From the American Heart Association. Circulation 2019, 140, e944–e963. [Google Scholar] [CrossRef]
- Svendsen, J.H.; Diederichsen, S.Z.; Højberg, S.; Krieger, D.W.; Graff, C.; Kronborg, C.; Olesen, M.S.; Nielsen, J.B.; Holst, A.G.; Brandes, A.; et al. Implantable loop recorder detection of atrial fibrillation to prevent stroke (The LOOP Study): A randomised controlled trial. Lancet 2021, 398, 1507–1516. [Google Scholar] [CrossRef]
- Sana, F.; Isselbacher, E.M.; Singh, J.P.; Heist, E.K.; Pathik, B.; Armoundas, A.A. Wearable Devices for Ambulatory Cardiac Monitoring. J. Am. Coll. Cardiol. 2020, 75, 1582–1592. [Google Scholar] [CrossRef] [PubMed]
- McConnell, M.V.; Turakhia, M.P.; Harrington, R.A.; King, A.C.; Ashley, E.A. Mobile Health Advances in Physical Activity, Fitness, and Atrial Fibrillation. J. Am. Coll. Cardiol. 2018, 71, 2691–2701. [Google Scholar] [CrossRef]
- Zhu, H.; Pan, Y.; Wu, F.; Huan, R. Optimized Electrode Locations for Wearable Single-Lead ECG Monitoring Devices: A Case Study Using WFEES Modules based on the LANS Method. Sensors 2019, 19, 4458. [Google Scholar] [CrossRef] [Green Version]
- Xu, K.; Chen, Y.; Okhai, T.A.; Snyman, L.W. Micro optical sensors based on avalanching silicon light-emitting devices monolithically integrated on chips. Opt. Mater. Express 2019, 9, 3985–3997. [Google Scholar] [CrossRef]
- Welton, N.; McAleenan, A.; Thom, H.H.; Davies, P.; Hollingworth, W.; Higgins, J.; Okoli, G.; Sterne, J.; Feder, G.; Eaton, D.; et al. Screening strategies for atrial fibrillation: A systematic review and cost-effectiveness analysis. Health Technol. Assess. 2017, 21, 1–236. [Google Scholar] [CrossRef] [PubMed] [Green Version]
- Santala, O.E.; Halonen, J.; Martikainen, S.; Jäntti, H.; Rissanen, T.T.; Tarvainen, M.P.; Laitinen, T.P.; Laitinen, T.M.; Väliaho, E.-S.; Hartikainen, J.E.K.; et al. Automatic Mobile Health Arrhythmia Monitoring for the Detection of Atrial Fibrillation: Prospective Feasibility, Accuracy, and User Experience Study. JMIR mHealth uHealth 2021, 9, e29933. [Google Scholar] [CrossRef]
- Lown, M.; Brown, M.; Brown, C.; Yue, A.M.; Shah, B.N.; Corbett, S.J.; Lewith, G.; Stuart, B.; Moore, M.; Little, P. Machine learning detection of Atrial Fibrillation using wearable technology. PLoS ONE 2020, 15, e0227401. [Google Scholar] [CrossRef] [Green Version]
- Kovács, L.; Jurkovich, V.; Bakony, M.; Szenci, O.; Póti, P.; Tőzsér, J. Welfare implication of measuring heart rate and heart rate variability in dairy cattle: Literature review and conclusions for future research. Animal 2014, 8, 316–330. [Google Scholar] [CrossRef] [Green Version]
- Brachmann, J.; Morillo, C.A.; Sanna, T.; Di Lazzaro, V.; Diener, H.C.; Bernstein, R.A.; Passman, R.S. Uncovering atrial fibrillation beyond short-term monitoring in cryptogenic stroke patients: Three-year results from the cryptogenic strokeand underlying atrial fibrillation trial. Circ. Arrhythmia Electrophysiol. 2016, 9, e003333. [Google Scholar] [CrossRef] [PubMed] [Green Version]
- Gladstone, D.; Spring, M.; Dorian, P.; Panzov, V.; Thorpe, K.; Hall, J.; Vaid, H.; O’Donnell, M.; Laupacis, A.; Côté, R.; et al. Atrial Fibrillation in Patients with Cryptogenic Stroke. N. Engl. J. Med. 2014, 370, 2467–2477. [Google Scholar] [CrossRef] [PubMed] [Green Version]
- Willcox, M.E.; Compton, S.J.; Bardy, G.H. Continuous ECG monitoring versus mobile telemetry: A comparison of arrhythmia diagnostics in human- versus algorithmic-dependent systems. Hear. Rhythm O2 2021. [Google Scholar] [CrossRef] [PubMed]
- Reverberi, C.; Rabia, G.; De Rosa, F.; Bosi, D.; Botti, A.; Benatti, G. The RITMIA™ Smartphone App for Automated Detection of Atrial Fibrillation: Accuracy in Consecutive Patients Undergoing Elective Electrical Cardioversion. BioMed Res. Int. 2019, 2019, 4861951. [Google Scholar] [CrossRef] [PubMed] [Green Version]
- Gaibazzi, N.; Siniscalchi, C.; Reverberi, C. The Heart Sentinel™ app for detection and automatic alerting in cardiac arrest during outdoor sports: Field tests and ventricular fibrillation simulation results. Int. J. Cardiol. 2018, 269, 133–138. [Google Scholar] [CrossRef] [PubMed]
- Bumgarner, J.M.; Lambert, C.T.; Hussein, A.A.; Cantillon, D.J.; Baranowski, B.; Wolski, K.; Lindsay, B.D.; Wazni, O.M.; Tarakji, K.G. Smartwatch Algorithm for Automated Detection of Atrial Fibrillation. J. Am. Coll. Cardiol. 2018, 71, 2381–2388. [Google Scholar] [CrossRef] [PubMed]
- Park, D.; Lee, M.; Park, S.E.; Seong, J.-K.; Youn, I. Determination of Optimal Heart Rate Variability Features Based on SVM-Recursive Feature Elimination for Cumulative Stress Monitoring Using ECG Sensor. Sensors 2018, 18, 2387. [Google Scholar] [CrossRef] [Green Version]
- Hartikainen, S.; Lipponen, J.; Hiltunen, P.; Rissanen, T.T.; Kolk, I.; Tarvainen, M.; Martikainen, T.J.; Castren, M.; Väliaho, E.-S.; Jäntti, H. Effectiveness of the Chest Strap Electrocardiogram to Detect Atrial Fibrillation. Am. J. Cardiol. 2019, 123, 1643–1648. [Google Scholar] [CrossRef] [Green Version]
- Sayem, A.S.M.; Teay, S.H.; Shahariar, H.; Fink, P.L.; Albarbar, A. Review on Smart Electro-Clothing Systems (SeCSs). Sensors 2020, 20, 587. [Google Scholar] [CrossRef] [Green Version]
- Atzmon, Y.; Ben Ishay, E.; Hallak, M.; Littman, R.; Eisenkraft, A.; Gabbay-Benziv, R. Continuous Maternal Hemodynamics Monitoring at Delivery Using a Novel, Noninvasive, Wireless, PPG-Based Sensor. J. Clin. Med. 2020, 10, 8. [Google Scholar] [CrossRef]
- Väliaho, E.-S.; Lipponen, J.A.; Kuoppa, P.; Martikainen, T.J.; Jäntti, H.; Rissanen, T.T.; Castrén, M.; Halonen, J.; Tarvainen, M.P.; Laitinen, T.M.; et al. Continuous 24-h Photoplethysmogram Monitoring Enables Detection of Atrial Fibrillation. Front. Physiol. 2022, 12, 778775. [Google Scholar] [CrossRef] [PubMed]
- Ribeiro, H.D.M.; Arnold, A.; Howard, J.P.; Shun-Shin, M.J.; Zhang, Y.; Francis, D.P.; Lim, P.B.; Whinnett, Z.; Zolgharni, M. ECG-based real-time arrhythmia monitoring using quantized deep neural networks: A feasibility study. Comput. Biol. Med. 2022, 143, 105249. [Google Scholar] [CrossRef] [PubMed]
- Cho, G.W.; Almeida, S.O.; Gang, E.S.; Elad, Y.; Duncan, R.; Budoff, M.J.; Karlsberg, R.P. Performance and Integration of Smartphone Wireless ECG Monitoring into the Enterprise Electronic Health Record: First Clinical Experience. Clin. Med. Insights Case Rep. 2022, 15. [Google Scholar] [CrossRef] [PubMed]
- Xu, K. Silicon electro-optic micro-modulator fabricated in standard CMOS technology as components for all silicon monolithic integrated optoelectronic systems. J. Micromech. Microeng. 2021, 31, 054001. [Google Scholar] [CrossRef]
- Wiles, B.M.; Roberts, P.R.; Allavatam, V.; Acharyya, A.; Vemishetty, N.; ElRefai, M.; Wilson, D.G.; Maharatna, K.; Chen, H.; Morgan, J.M. Personalized subcutaneous implantable cardioverter-defibrillator sensing vectors generated by mathematical rotation increase device eligibility whilst preserving device performance. EP Eur. 2022. [Google Scholar] [CrossRef]
- Belchí Navarro, J.; Quesada Dorador, A.; Atienza Fernández, F.; Villalba Caballero, S.J.; Roda Nicolás, J.; de Velasco Ramí, J.A. Síncope y estudio electrofisiológico negativo. Utilidad del Holter implantable para el diagnóstico de arritmias ventriculares [Syncope and a negative electrophysiological study. The usefulness of an implantable Holter monitor for the diagnosis of ventricular arrhythmias]. Rev. Esp. Cardiol. 1999, 52, 1151–1153. [Google Scholar]
- Patent Number (Italy): IT201800000579A1. Available online: https://patents.google.com/patent/IT201800000579A1/it?inventor=gaibazzi&oq=gaibazzi (accessed on 26 January 2022).


Publisher’s Note: MDPI stays neutral with regard to jurisdictional claims in published maps and institutional affiliations. |
© 2022 by the authors. Licensee MDPI, Basel, Switzerland. This article is an open access article distributed under the terms and conditions of the Creative Commons Attribution (CC BY) license (https://creativecommons.org/licenses/by/4.0/).
Share and Cite
Martini, C.; Di Maria, B.; Reverberi, C.; Tuttolomondo, D.; Gaibazzi, N. Commercially Available Heart Rate Monitor Repurposed for Automatic Arrhythmia Detection with Snapshot Electrocardiographic Capability: A Pilot Validation. Diagnostics 2022, 12, 712. https://doi.org/10.3390/diagnostics12030712
Martini C, Di Maria B, Reverberi C, Tuttolomondo D, Gaibazzi N. Commercially Available Heart Rate Monitor Repurposed for Automatic Arrhythmia Detection with Snapshot Electrocardiographic Capability: A Pilot Validation. Diagnostics. 2022; 12(3):712. https://doi.org/10.3390/diagnostics12030712
Chicago/Turabian StyleMartini, Chiara, Bernardo Di Maria, Claudio Reverberi, Domenico Tuttolomondo, and Nicola Gaibazzi. 2022. "Commercially Available Heart Rate Monitor Repurposed for Automatic Arrhythmia Detection with Snapshot Electrocardiographic Capability: A Pilot Validation" Diagnostics 12, no. 3: 712. https://doi.org/10.3390/diagnostics12030712
APA StyleMartini, C., Di Maria, B., Reverberi, C., Tuttolomondo, D., & Gaibazzi, N. (2022). Commercially Available Heart Rate Monitor Repurposed for Automatic Arrhythmia Detection with Snapshot Electrocardiographic Capability: A Pilot Validation. Diagnostics, 12(3), 712. https://doi.org/10.3390/diagnostics12030712