
A Complex Radiomic Signature in Luminal Breast Cancer from a Weighted Statistical Framework: A Pilot Study

 ,
,  , ,
, ,  ,
,  , , and
Abstract
1. Introduction
2. Materials and Methods
2.1. Patient Selection
2.2. Clinical Parameters
2.3. Circulating miRNA Signatures
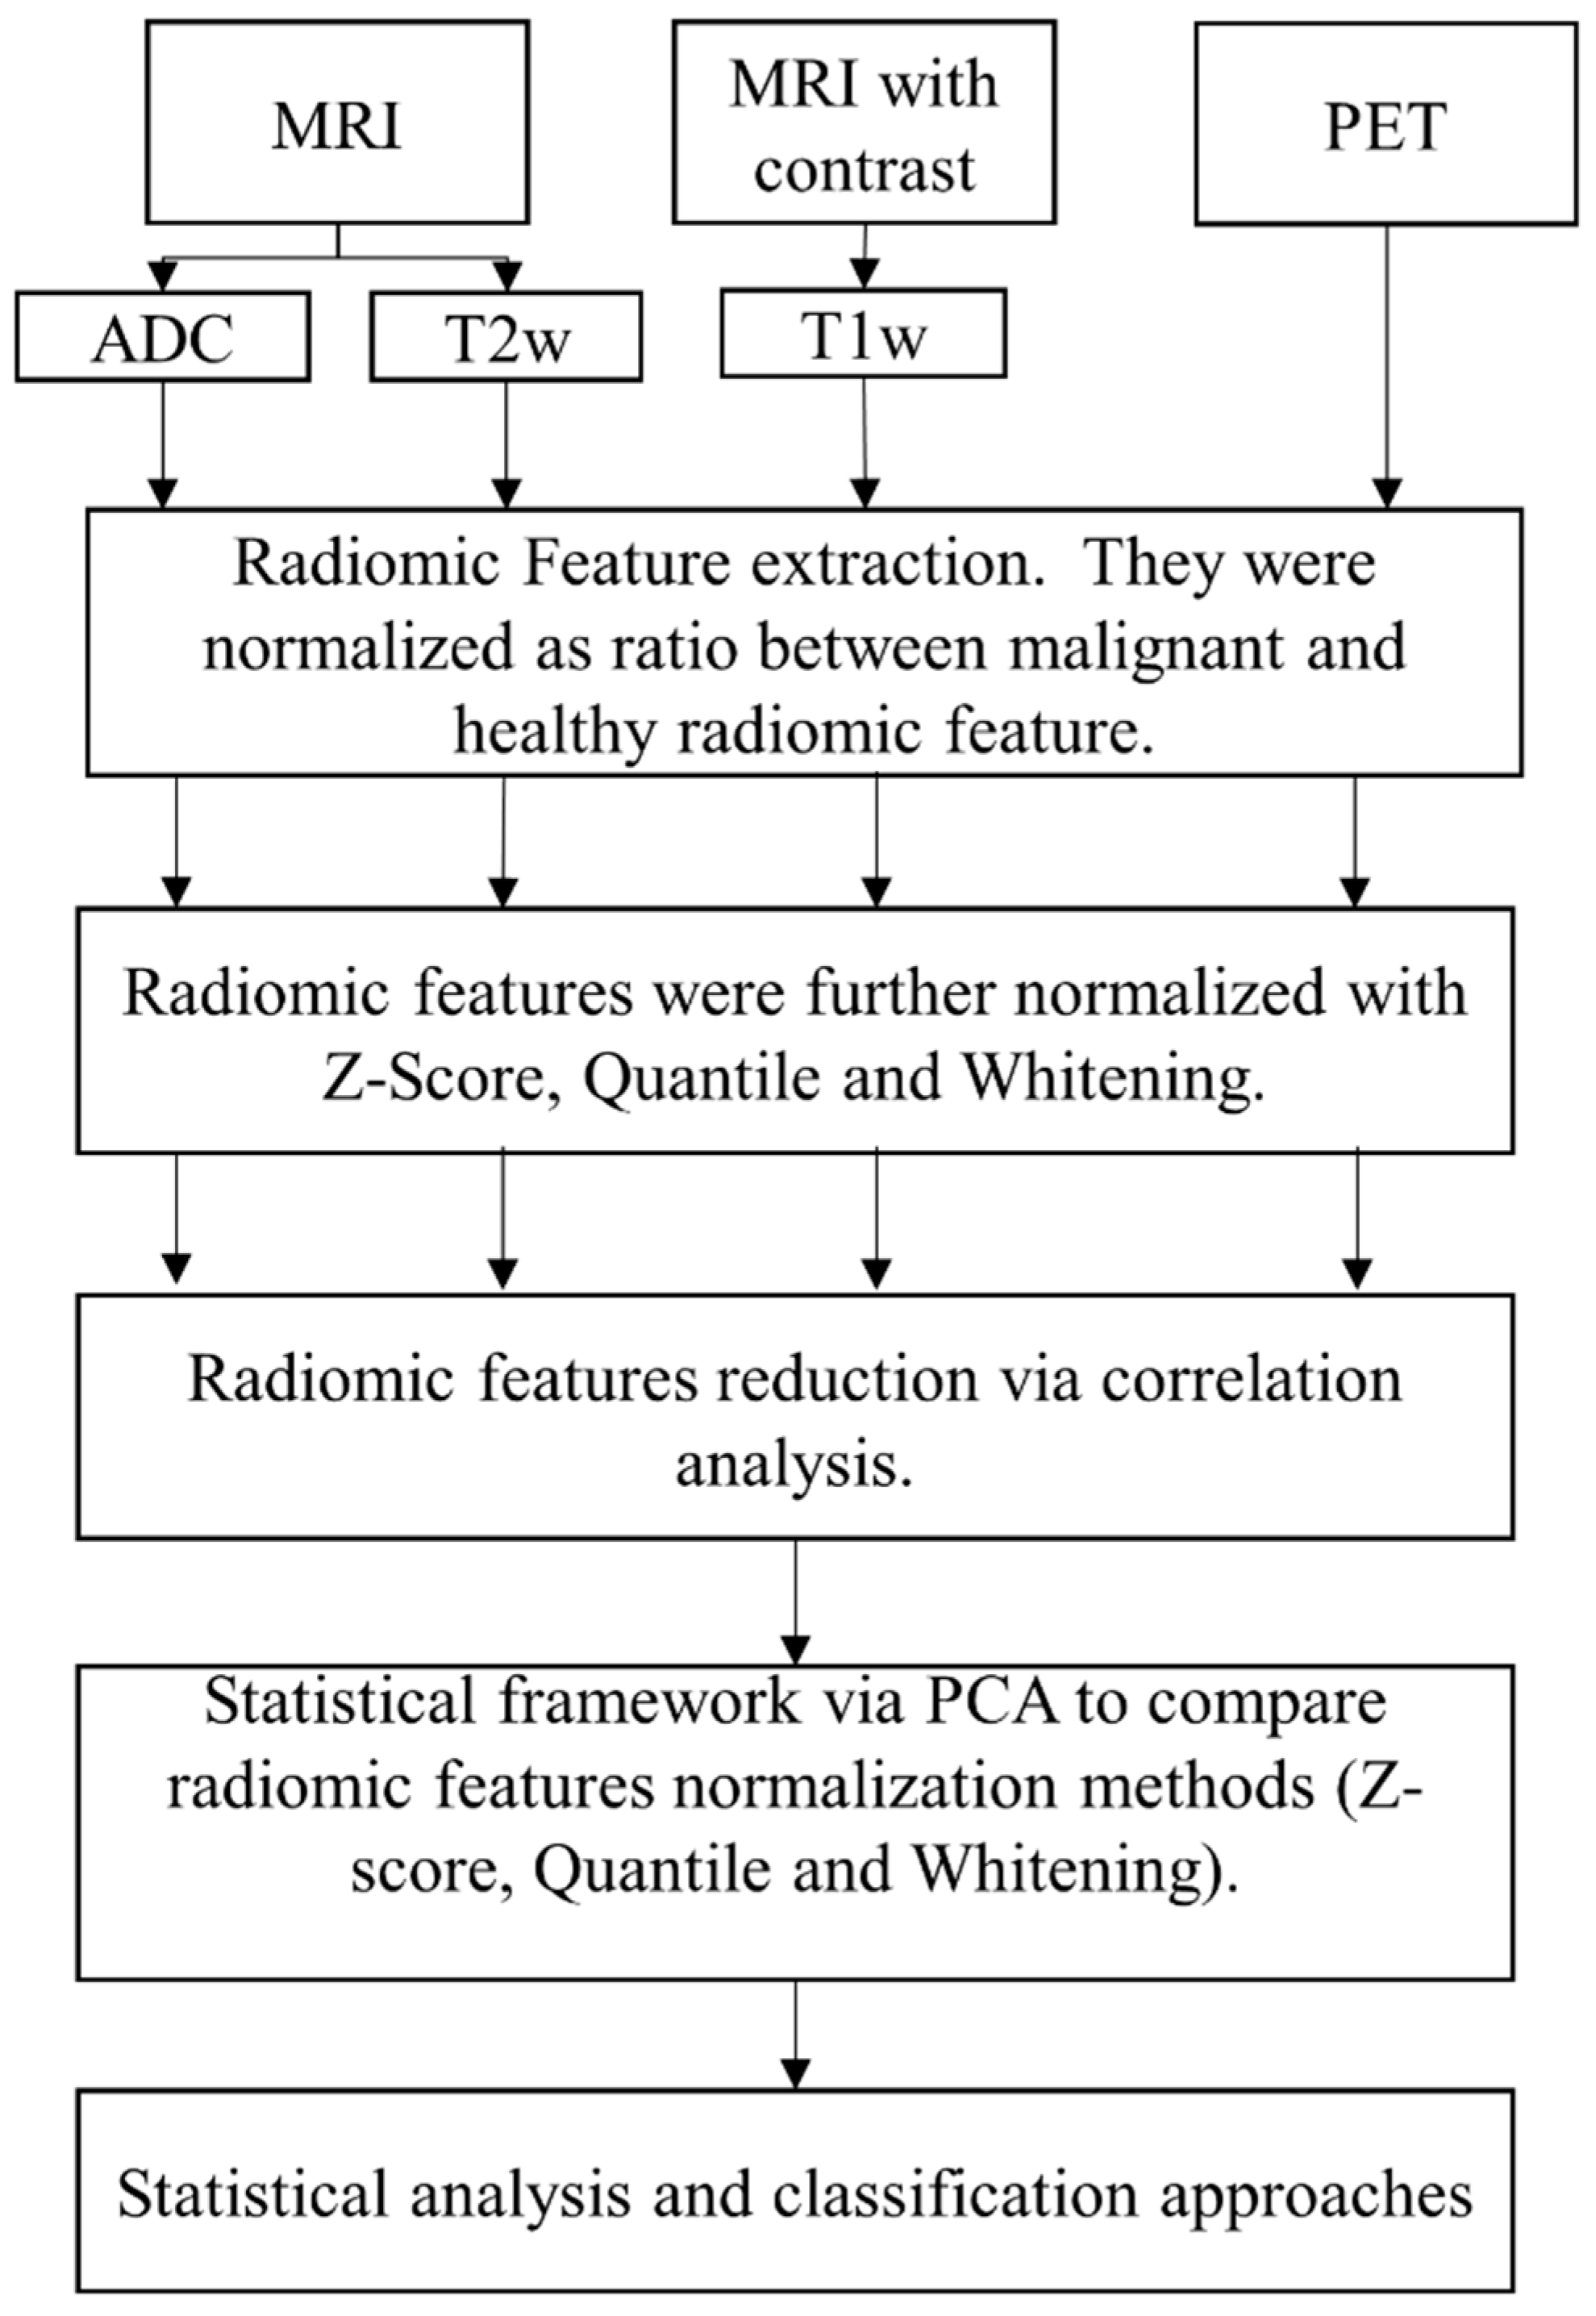
2.4. Image Acquisition and Pre-Processing
2.5. Radiomic Features
2.6. Statistical Analysis
2.6.1. Radiomic Statistical Analysis
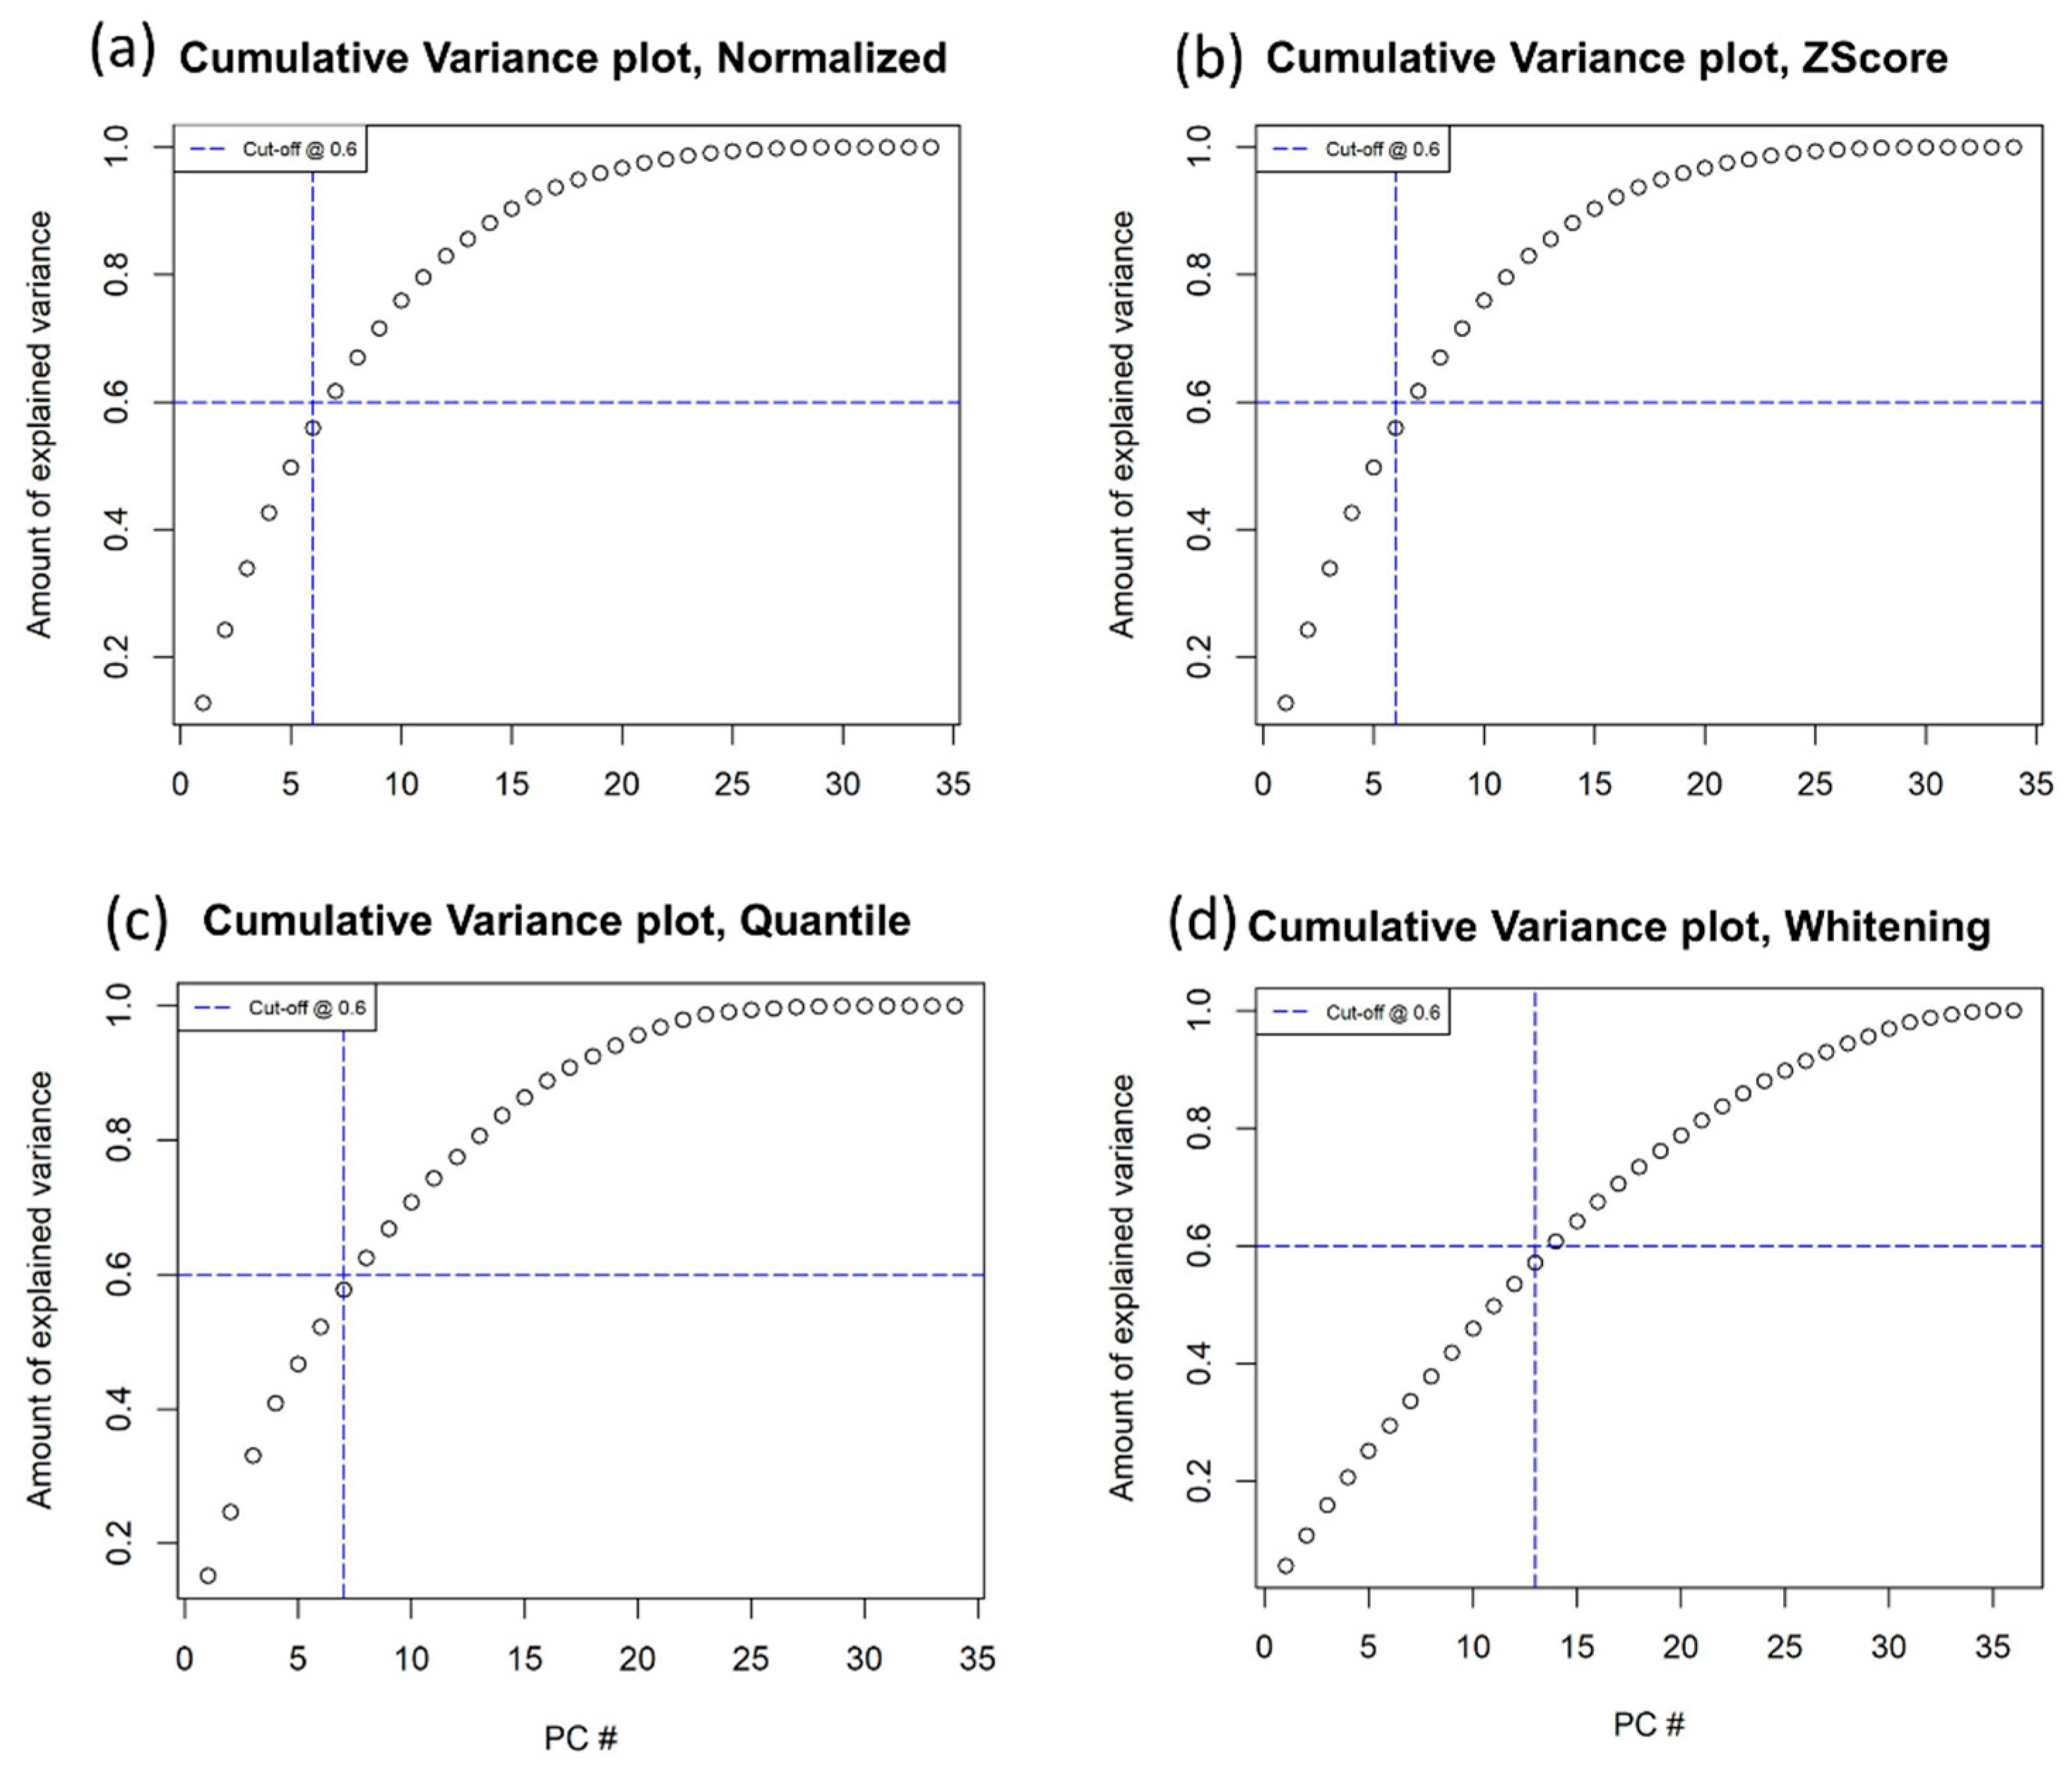
2.6.2. PCA on Radiomic Features
- Radiomic features normalized as the ratio of malignant and healthy radiomic features.
- Radiomic features normalized as the ratio of malignant and healthy radiomic features and z-scores.
- Radiomic features normalized as the ratio of malignant and healthy radiomic features and quantiles.
- Radiomic features normalized as the ratio of malignant and healthy radiomic features and whitening.
2.6.3. Clinical Investigation and Patient Stratification
2.6.4. Classification Methods
3. Results
3.1. Study Population
3.2. Radiomic Statistical Framework: Normalization and PCA
- Radiomic features only normalized as the ratio of malignant and healthy radiomic features.
- Radiomic features normalized as the ratio of malignant and healthy radiomic features and z-scores.
- Radiomic features normalized as the ratio of malignant and healthy radiomic features and quantiles.
- Radiomic features normalized as the ratio of malignant and healthy radiomic features and whitening.
3.3. Clinical Investigation and Classification Approaches
3.3.1. Grade
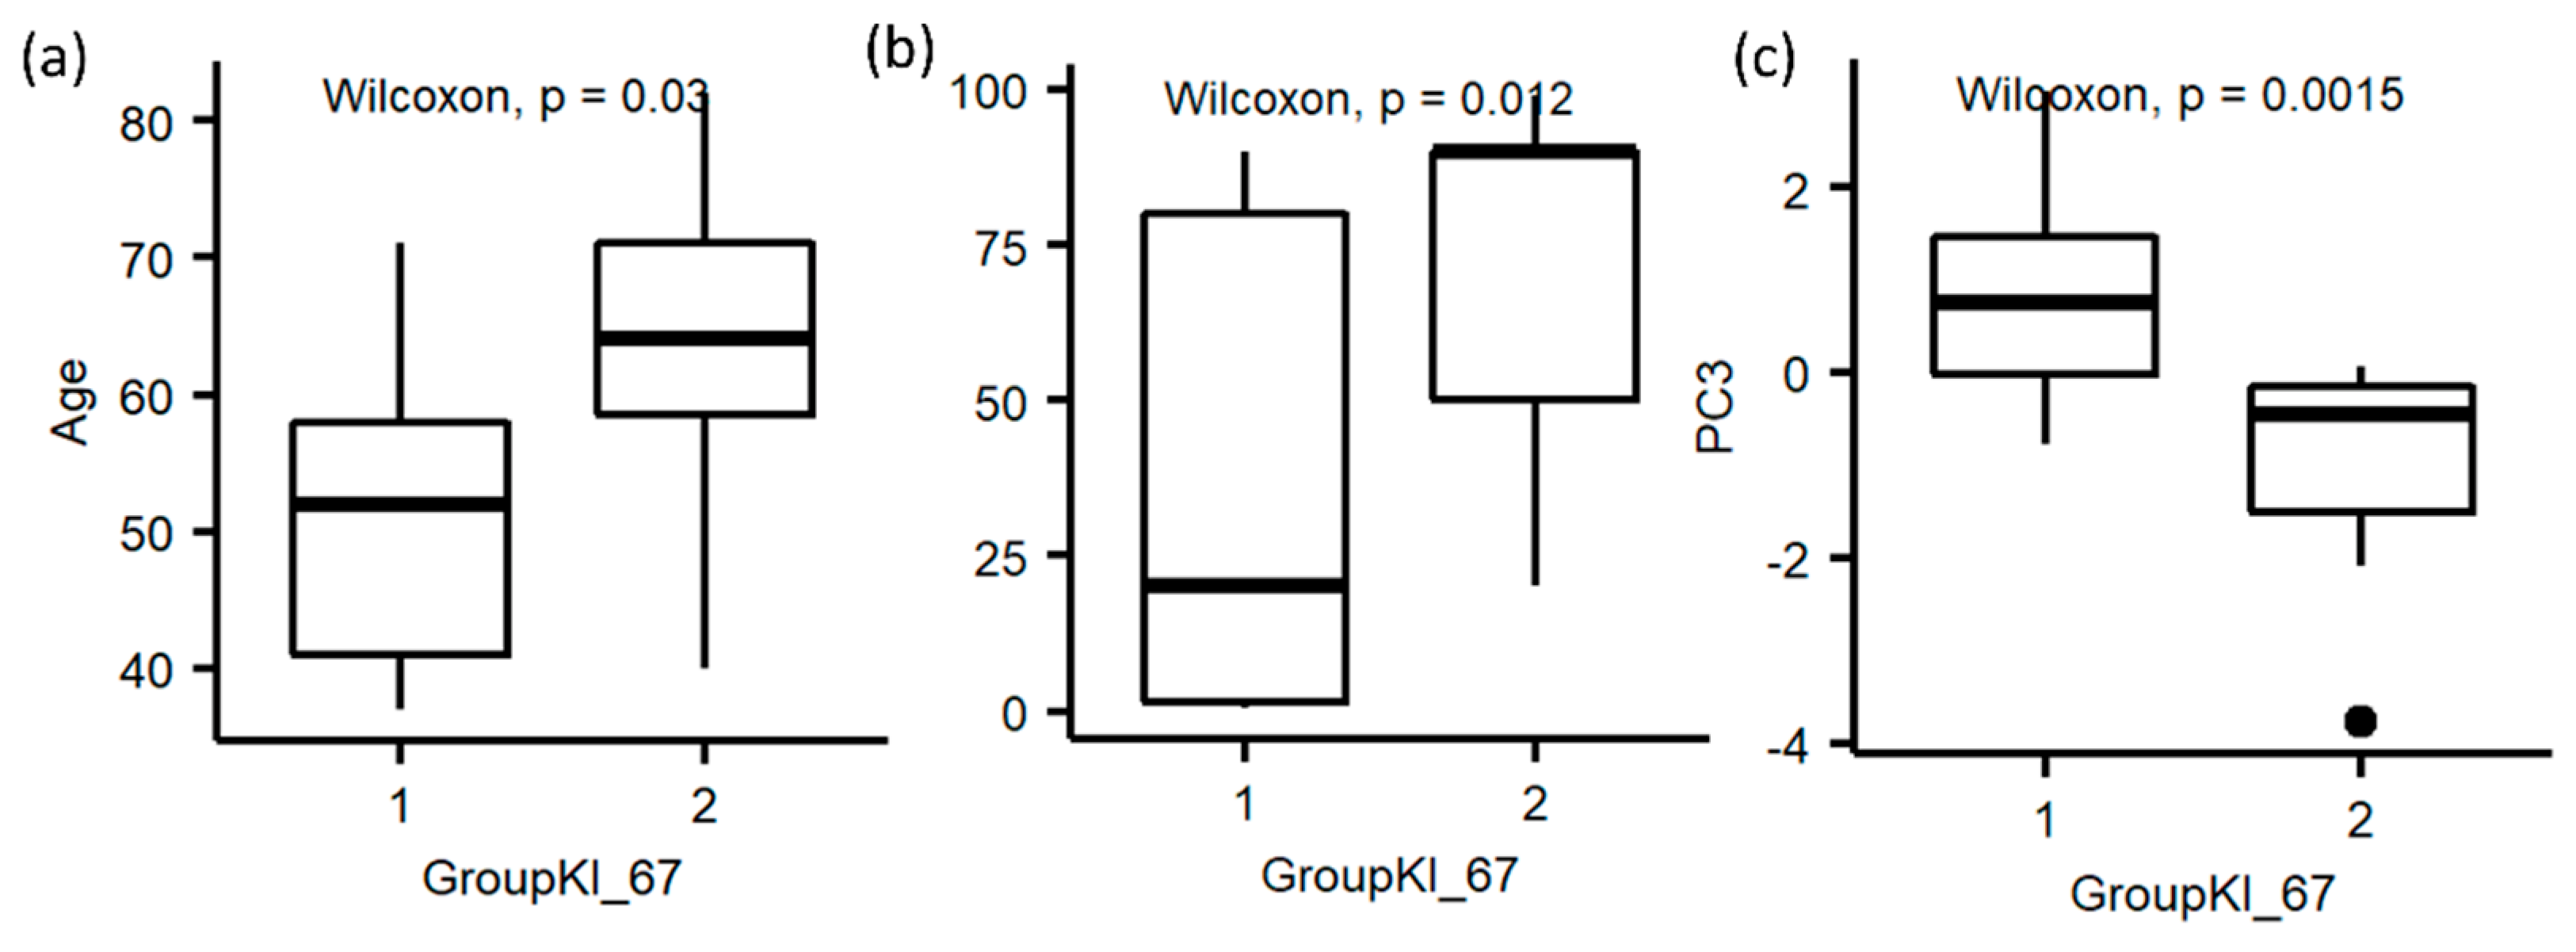
3.3.2. Ki-67
3.3.3. Luminal A and B
4. Discussion
5. Conclusions
Supplementary Materials
Author Contributions
Funding
Institutional Review Board Statement
Informed Consent Statement
Data Availability Statement
Conflicts of Interest
References
- Lambin, P.; Leijenaar, R.T.H.; Deist, T.M.; Peerlings, J.; de Jong, E.E.C.; van Timmeren, J.; Sanduleanu, S.; Larue, R.T.H.M.; Even, A.J.G.; Jochems, A.; et al. Radiomics: The bridge between medical imaging and personalized medicine. Nat. Rev. Clin. Oncol. 2017, 14, 749–762. [Google Scholar] [CrossRef] [PubMed]
- Gillies, R.J.; Kinahan, P.E.; Hricak, H. Radiomics: Images Are More than Pictures, They Are Data. Radiology 2016, 278, 563–577. [Google Scholar] [CrossRef] [PubMed]
- Aerts, H.J.; Velazquez, E.R.; Leijenaar, R.T.H.; Parmar, C.; Grossmann, P.; Carvalho, S.; Bussink, J.; Monshouwer, R.; Haibe-Kains, B.; Rietveld, D.; et al. Decoding tumour phenotype by noninvasive imaging using a quantitative radiomics approach. Nat. Commun. 2014, 5, 4006. [Google Scholar] [CrossRef] [PubMed]
- Park, H.; Lim, Y.; Ko, E.S.; Cho, H.-H.; Lee, J.E.; Han, B.-K.; Ko, E.Y.; Choi, J.S.; Park, K.W. Radiomics Signature on Magnetic Resonance Imaging: Association with Disease-Free Survival in Patients with Invasive Breast Cancer. Clin. Cancer Res. 2018, 24, 4705–4714. [Google Scholar] [CrossRef] [PubMed]
- Parikh, J.; Selmi, M.; Charles-Edwards, G.; Glendenning, J.; Ganeshan, B.; Verma, H.; Mansi, J.; Harries, M.; Tutt, A.; Goh, V. Changes in Primary Breast Cancer Heterogeneity May Augment Midtreatment MR Imaging Assessment of Response to Neoadjuvant Chemotherapy. Radiology 2014, 272, 100–112. [Google Scholar] [CrossRef]
- Pickles, M.D.; Lowry, M.; Gibbs, P. Pretreatment Prognostic Value of Dynamic Contrast-Enhanced Magnetic Resonance Imaging Vascular, Texture, Shape, and Size Parameters Compared with Traditional Survival Indicators Obtained from Locally Advanced Breast Cancer Patients. Investig. Radiol. 2016, 51, 177–185. [Google Scholar] [CrossRef]
- Kim, J.-H.; Ko, E.Y.; Lim, Y.; Lee, K.S.; Han, B.-K.; Hahn, S.Y.; Nam, S.J. Breast Cancer Heterogeneity: MR Imaging Texture Analysis and Survival Outcomes. Radiology 2017, 282, 665–675. [Google Scholar] [CrossRef]
- Jemal, A.; Bray, F.; Center, M.M.; Ferlay, J.; Ward, E.; Forman, D. Global cancer statistics. CA Cancer J. Clin. 2011, 61, 69–90. [Google Scholar] [CrossRef]
- Perou, C.M.; Sørlie, T.; Eisen, M.B.; Van De Rijn, M.; Jeffrey, S.S.; Rees, C.A.; Pollack, J.R.; Ross, D.T.; Johnsen, H.; Akslen, L.A.; et al. Molecular portraits of human breast tumours. Nature 2000, 406, 747–752. [Google Scholar] [CrossRef]
- Kim, D.-K.; Kim, D.W.; Kim, S.W.; Kim, D.Y.; Lee, C.H.; Rhee, C.S. Ki67 antigen as a predictive factor for prognosis of sinonasal mucosal melanoma. Clin. Exp. Otorhinolaryngol. 2008, 1, 206. [Google Scholar] [CrossRef]
- Rakha, E.A.; Reis-Filho, J.S.; Baehner, F.; Dabbs, D.J.; Decker, T.; Eusebi, V.; Fox, S.B.; Ichihara, S.; Jacquemier, J.; Lakhani, S.R.; et al. Breast cancer prognostic classification in the molecular era: The role of histological grade. Breast Cancer Res. 2010, 12, 207. [Google Scholar] [CrossRef] [PubMed]
- Grimm, L.J.; Zhang, J.; Mazurowski, M.A. Computational approach to radiogenomics of breast cancer: Luminal A and luminal B molecular subtypes are associated with imaging features on routine breast MRI extracted using computer vision algorithms. J. Magn. Reson. Imaging 2015, 42, 902–907. [Google Scholar] [CrossRef] [PubMed]
- Mazurowski, M.A.; Zhang, J.; Grimm, L.; Yoon, S.C.; Silber, J.I. Radiogenomic Analysis of Breast Cancer: Luminal B Molecular Subtype Is Associated with Enhancement Dynamics at MR Imaging. Radiology 2014, 273, 365–372. [Google Scholar] [CrossRef]
- Davey, M.G.; Davey, M.S.; Boland, M.R.; Ryan, É.J.; Lowery, A.J.; Kerin, M.J. Radiomic differentiation of breast cancer molecular subtypes using pre-operative breast imaging—A systematic review and meta-analysis. Eur. J. Radiol. 2021, 144, 109996. [Google Scholar] [CrossRef] [PubMed]
- Rizzo, S.; Botta, F.; Raimondi, S.; Origgi, D.; Fanciullo, C.; Morganti, A.G.; Bellomi, M. Radiomics: The facts and the challenges of image analysis. Eur. Radiol. Exp. 2018, 2, 36. [Google Scholar] [CrossRef]
- Parmar, C.; Barry, J.D.; Hosny, A.; Quackenbush, J.; Aerts, H.J. Data Analysis Strategies in Medical Imaging. Clin. Cancer Res. 2018, 24, 3492–3499. [Google Scholar] [CrossRef]
- Castaldo, R.; Pane, K.; Nicolai, E.; Salvatore, M.; Franzese, M. The Impact of Normalization Approaches to Automatically Detect Radiogenomic Phenotypes Characterizing Breast Cancer Receptors Status. Cancers 2020, 12, 518. [Google Scholar] [CrossRef]
- Madabhushi, A.; Udupa, J.K. New methods of MR image intensity standardization via generalized scale. Med. Phys. 2006, 33, 3426–3434. [Google Scholar] [CrossRef]
- Nyúl, L.G.; Udupa, J.K. On standardizing the MR image intensity scale. Magn. Reson. Med. 1999, 42, 1072–1081. [Google Scholar] [CrossRef]
- Nyul, L.; Udupa, J.; Zhang, X. New variants of a method of MRI scale standardization. IEEE Trans. Med. Imaging 2000, 19, 143–150. [Google Scholar] [CrossRef]
- Ge, Y.; Udupa, J.K.; Wei, L.; Grossman, R.I. Numerical tissue characterization in MS via standardization of the MR image intensity scale. J. Magn. Reson. Imaging 2000, 12, 715–721. [Google Scholar] [CrossRef]
- Csutak, C.; Ștefan, P.-A.; Lupean, R.-A.; Lenghel, L.M.; Mihu, C.M.; Lebovici, A. Computed tomography in the diagnosis of intraperitoneal effusions: The role of texture analysis. Bosn. J. Basic Med. Sci. 2021, 21, 488–494. [Google Scholar] [CrossRef] [PubMed]
- Ștefan, P.A.; Lupean, R.A.; Mihu, C.M.; Lebovici, A.; Oancea, M.D.; Hîțu, L.; Duma, D.; Csutak, C. Ultrasonography in the Diagnosis of Adnexal Lesions: The Role of Texture Analysis. Diagnostics 2021, 11, 812. [Google Scholar] [CrossRef] [PubMed]
- Zerouaoui, H.; Idri, A. Reviewing Machine Learning and Image Processing Based Decision-Making Systems for Breast Cancer Imaging. J. Med. Syst. 2021, 45, 8. [Google Scholar] [CrossRef]
- Huynh, E.; Coroller, T.P.; Narayan, V.; Agrawal, V.; Romano, J.; Franco, I.; Parmar, C.; Hou, Y.; Mak, R.H.; Aerts, H.J.W.L. Associations of Radiomic Data Extracted from Static and Respiratory-Gated CT Scans with Disease Recurrence in Lung Cancer Patients Treated with SBRT. PLoS ONE 2017, 12, e0169172. [Google Scholar] [CrossRef]
- Zhang, Y.; Oikonomou, A.; Wong, A.; Haider, M.A.; Khalvati, F. Radiomics-based Prognosis Analysis for Non-Small Cell Lung Cancer. Sci. Rep. 2017, 7, 46349. [Google Scholar] [CrossRef]
- Jolliffe, I.T. Principal Component Analysis; Springer Series in Statistics; Springer: Berlin/Heidelberg, Germany, 2002; Volume 29. [Google Scholar]
- Wold, S.; Esbensen, K.; Geladi, P. Principal component analysis. Chemom. Intell. Lab. Syst. 1987, 2, 37–52. [Google Scholar] [CrossRef]
- Traverso, A.; Kazmierski, M.; Zhovannik, I.; Welch, M.; Wee, L.; Jaffray, D.; Dekker, A.; Hope, A. Machine learning helps identifying volume-confounding effects in radiomics. Phys. Med. 2020, 71, 24–30. [Google Scholar] [CrossRef]
- Jolliffe, I.T. Rotation of principal components: Choice of normalization constraints. J. Appl. Stat. 1995, 22, 29–35. [Google Scholar] [CrossRef]
- R Team. R: A Language and Environment for Statistical Computing; R Foundation for Statistical Computing: Vienna, Austria, 2019. [Google Scholar]
- Yu, H.J.; Chen, J.-H.; Mehta, R.S.; Nalcioglu, O.; Su, M.-Y. MRI measurements of tumor size and pharmacokinetic parameters as early predictors of response in breast cancer patients undergoing neoadjuvant anthracycline chemotherapy. J. Magn. Reson. Imaging 2007, 26, 615–623. [Google Scholar] [CrossRef]
- Incoronato, M.; Grimaldi, A.M.; Mirabelli, P.; Cavaliere, C.; Parente, C.A.; Franzese, M.; Staibano, S.; Ilardi, G.; Russo, D.; Soricelli, A.; et al. Circulating miRNAs in Untreated Breast Cancer: An Exploratory Multimodality Morpho-Functional Study. Cancers 2019, 11, 876. [Google Scholar] [CrossRef] [PubMed]
- Erdi, Y.E.; Mawlawi, O.; Larson, S.M.; Imbriaco, M.; Yeung, H.; Finn, R.; Humm, J.L. Segmentation of lung lesion volume by adaptive positron emission tomography image thresholding. Cancer 1997, 80 (Suppl. 12), 2505–2509. [Google Scholar] [CrossRef]
- Chan, Y.H. Biostatistics 104: Correlational analysis. Singap. Med. J. 2003, 44, 614–619. [Google Scholar]
- Abdi, H. Z-scores. Encycl. Meas. Stat. 2007, 3, 1055–1058. [Google Scholar]
- Bolstad, B.; Irizarry, R.; Astrand, M.; Speed, T. A comparison of normalization methods for high density oligonucleotide array data based on variance and bias. Bioinformatics 2003, 19, 185–193. [Google Scholar] [CrossRef]
- Hicks, S.C.; Irizarry, R.A. When to use quantile normalization? BioRxiv 2014, 012203. [Google Scholar] [CrossRef]
- Kessy, A.; Lewin, A.; Strimmer, K. Optimal Whitening and Decorrelation. Am. Stat. 2018, 72, 309–314. [Google Scholar] [CrossRef]
- Chatterjee, A.; Vallieres, M.; Dohan, A.; Levesque, I.R.; Ueno, Y.; Saif, S.; Reinhold, C.; Seuntjens, J. Creating Robust Predictive Radiomic Models for Data from Independent Institutions Using Normalization. IEEE Trans. Radiat. Plasma Med. Sci. 2019, 3, 210–215. [Google Scholar] [CrossRef]
- Kuhn, M. Building predictive models in R using the caret package. J. Stat. Softw. 2008, 28, 1–26. [Google Scholar] [CrossRef]
- Flury, B. Common Principal Components & Related Multivariate Models; John Wiley & Sons, Inc.: Hoboken, NJ, USA, 1988. [Google Scholar]
- Zhu, X.; Chen, L.; Huang, B.; Wang, Y.; Ji, L.; Wu, J.; Di, G.; Liu, G.; Yu, K.; Shao, Z.; et al. The prognostic and predictive potential of Ki-67 in triple-negative breast cancer. Sci. Rep. 2020, 10, 225. [Google Scholar] [CrossRef]
- Aman, N.A.; Doukoure, B.; Koffi, K.D.; Koui, B.S.; Traore, Z.C.; Kouyate, M.; Toure, I.; Effi, A.B. Immunohistochemical Evaluation of Ki-67 and Comparison with Clinicopathologic Factors in Breast Carcinomas. Asian Pac. J. Cancer Prev. 2019, 20, 73–79. [Google Scholar] [CrossRef] [PubMed]
- Friedman, J.; Hastie, T.; Tibshirani, R. Additive logistic regression: A statistical view of boosting (with discussion and a rejoinder by the authors). Ann. Stat. 2000, 28, 337–407. [Google Scholar] [CrossRef]
- Quinlan, J.R. C4.5: Programs for Machine Learning; The Morgan Kaufmann Series in Machine Learning; Morgan Kaufmann Publishers: San Mateo, CA, USA, 1993. [Google Scholar]
- Nguyen, C.; Wang, Y.; Nguyen, H.N. Random forest classifier combined with feature selection for breast cancer diagnosis and prognostic. J. Biomed. Sci. Eng. 2013, 6, 551–560. [Google Scholar] [CrossRef]
- Xanthopoulos, P.; Pardalos, P.M.; Trafalis, T.B. Linear Discriminant Analysis, in Robust Data Mining; Springer: Berlin/Heidelberg, Germany, 2013; pp. 27–33. [Google Scholar]
- Yassin, N.I.; Omran, S.; Houby, E.M.; Allam, H. Machine learning techniques for breast cancer computer aided diagnosis using different image modalities: A systematic review. Comput. Methods Programs Biomed. 2018, 156, 25–45. [Google Scholar] [CrossRef] [PubMed]
- Refaeilzadeh, P.; Tang, L.; Liu, H. Cross-validation. Encycl. Database Syst. 2009, 5, 532–538. [Google Scholar]
- Sondakh, D.E. Comparative Study of Classification Algorithms: Holdouts as Accuracy Estimation. CogITo Smart J. 2016, 1, 13–23. [Google Scholar] [CrossRef]
- Chawla, N.V.; Bowyer, K.W.; Hall, L.O.; Kegelmeyer, W.P. SMOTE: Synthetic Minority Over-sampling Technique. J. Artif. Intell. Res. 2002, 16, 321–357. [Google Scholar] [CrossRef]
- Steyerberg, E.W.; Harrell, F.E.; Borsboom, G.J.; Eijkemans, M.; Vergouwe, Y.; Habbema, J.F. Internal validation of predictive models: Efficiency of some procedures for logistic regression analysis. J. Clin. Epidemiol. 2001, 54, 774–781. [Google Scholar] [CrossRef]
- Kohl, M. Performance measures in binary classification. Int. J. Stat. Med. Res. 2012, 1, 79–81. [Google Scholar] [CrossRef]
- Foster, K.R.; Koprowski, R.; Skufca, J.D. Machine learning, medical diagnosis, and biomedical engineering research-commentary. Biomed. Eng. Online 2014, 13, 94. [Google Scholar] [CrossRef]
- Power, M.; Fell, G.; Wright, M. Principles for high-quality, high-value testing. Evid.-Base. Med. 2013, 18, 5–10. [Google Scholar] [CrossRef] [PubMed]
- Goldhirsch, A.; Winer, E.P.; Coates, A.S.; Gelber, R.D.; Piccart-Gebhart, M.; Thürlimann, B.; Senn, H.-J. Personalizing the treatment of women with early breast cancer: Highlights of the St Gallen International Expert Consensus on the Primary Therapy of Early Breast Cancer 2013. Ann. Oncol. 2013, 24, 2206–2223. [Google Scholar] [CrossRef] [PubMed]
- Bene, I.B.; Ciurea, A.; Ciortea, C.; Ștefan, P.; Lisencu, L.; Dudea, S. Differentiating Breast Tumors from Background Parenchymal Enhancement at Contrast-Enhanced Mammography: The Role of Radiomics—A Pilot Reader Study. Diagnostics 2021, 11, 1248. [Google Scholar]
- Ye, D.-M.; Wang, H.-T.; Yu, T. The Application of Radiomics in Breast MRI: A Review. Technol. Cancer Res. Treat. 2020, 19, 1533033820916191. [Google Scholar] [CrossRef]
- Shinohara, R.T.; Sweeney, E.M.; Goldsmith, J.; Shiee, N.; Mateen, F.J.; Calabresi, P.; Jarso, S.; Pham, D.L.; Reich, D.S.; Crainiceanu, C.M. Statistical normalization techniques for magnetic resonance imaging. NeuroImage: Clin. 2014, 6, 9–19. [Google Scholar] [CrossRef]
- Isaksson, L.J.; Raimondi, S.; Botta, F.; Pepa, M.; Gugliandolo, S.G.; De Angelis, S.P.; Marvaso, G.; Petralia, G.; DE Cobelli, O.; Gandini, S.; et al. Effects of MRI image normalization techniques in prostate cancer radiomics. Phys. Med. 2020, 71, 7–13. [Google Scholar] [CrossRef]
- Haga, A.; Takahashi, W.; Aoki, S.; Nawa, K.; Yamashita, H.; Abe, O.; Nakagawa, K. Standardization of imaging features for radiomics analysis. J. Med. Investig. 2019, 66, 35–37. [Google Scholar] [CrossRef]
- Böhm, C.; Faloutsos, C.; Plant, C. Outlier-Robust Clustering Using Independent Components. In Proceedings of the 2008 ACM SIGMOD International Conference on Management of Data, Vancouver, BC, Canada, 9–12 June 2008. [Google Scholar]
- Elston, C.; Ellis, I. pathological prognostic factors in breast cancer. I. The value of histological grade in breast cancer: Experience from a large study with long-term follow-up. Histopathology 1991, 19, 403–410. [Google Scholar] [CrossRef]
- Weidner, N.; Ii, D.H.M.; Vartanian, R. Correlation of Ki-67 antigen expression with mitotic figure index and tumor grade in breast carcinomas using the novel “paraffin”-reactive MIB1 antibody. Hum. Pathol. 1994, 25, 337–342. [Google Scholar] [CrossRef]
- Nishimura, R.; Osako, T.; Nishiyama, Y.; Tashima, R.; Nakano, M.; Fujisue, M.; Toyozumi, Y.; Arima, N. Prognostic significance of Ki-67 index value at the primary breast tumor in recurrent breast cancer. Mol. Clin. Oncol. 2014, 2, 1062–1068. [Google Scholar] [CrossRef]
- Inic, Z.; Zegarac, M.; Inic, M.; Markovic, I.; Kozomara, Z.; Djurisic, I.; Inic, I.; Pupic, G.; Jancic, S. Difference between Luminal A and Luminal B Subtypes According to Ki-67, Tumor Size, and Progesterone Receptor Negativity Providing Prognostic Information. Clin. Med. Insights Oncol. 2014, 8, 107–111. [Google Scholar] [CrossRef] [PubMed]
- Hashmi, A.A.; Aijaz, S.; Khan, S.M.; Mahboob, R.; Irfan, M.; Zafar, N.I.; Nisar, M.; Siddiqui, M.; Edhi, M.M.; Faridi, N.; et al. Prognostic parameters of luminal A and luminal B intrinsic breast cancer subtypes of Pakistani patients. World J. Surg. Oncol. 2018, 16, 1. [Google Scholar] [CrossRef] [PubMed]
- Incoronato, M.; Grimaldi, A.M.; Cavaliere, C.; Inglese, M.; Mirabelli, P.; Monti, S.; Ferbo, U.; Nicolai, E.; Soricelli, A.; Catalano, O.A.; et al. Relationship between functional imaging and immunohistochemical markers and prediction of breast cancer subtype: A PET/MRI study. Eur. J. Pediatr. 2018, 45, 1680–1693. [Google Scholar] [CrossRef] [PubMed]
- Singh, D.; Singh, B. Investigating the impact of data normalization on classification performance. Appl. Soft Comput. 2020, 97, 105524. [Google Scholar] [CrossRef]
- Son, S.H.; Kim, D.-H.; Hong, C.M.; Kim, C.-Y.; Jeong, S.Y.; Lee, S.-W.; Lee, J.; Ahn, B.-C. Prognostic implication of intratumoral metabolic heterogeneity in invasive ductal carcinoma of the breast. BMC Cancer 2014, 14, 585. [Google Scholar] [CrossRef]
- Yoon, H.-J.; Kim, Y.; Kim, B.S. Intratumoral metabolic heterogeneity predicts invasive components in breast ductal carcinoma in situ. Eur. Radiol. 2015, 25, 3648–3658. [Google Scholar] [CrossRef]
- Le-Petross, H.T.; Cristofanilli, M.; Carkaci, S.; Krishnamurthy, S.; Jackson, E.F.; Harrell, R.K.; Reed, B.J.; Yang, W.T. MRI Features of Inflammatory Breast Cancer. Am. J. Roentgenol. 2011, 197, W769–W776. [Google Scholar] [CrossRef]
- Alili, C.; Pages, E.; Doyon, F.C.; Perrochia, H.; Millet, I.; Taourel, P. Correlation between MR imaging—Prognosis factors and molecular classification of breast cancers. Diagn. Interv. Imaging 2014, 95, 235–242. [Google Scholar] [CrossRef][Green Version]
- Holli-Helenius, K.; Salminen, A.; Rinta-Kiikka, I.; Koskivuo, I.; Brück, N.; Boström, P.; Parkkola, R. MRI texture analysis in differentiating luminal A and luminal B breast cancer molecular subtypes—A feasibility study. BMC Med. Imaging 2017, 17, 69. [Google Scholar] [CrossRef]
- Mert, A.; Kılıç, N.; Bilgili, E.; Akan, A. Breast cancer detection with reduced feature set. Comput. Math. Methods Med. 2015, 2015, 265138. [Google Scholar] [CrossRef]
- Tang, W.; Zhang, X.; Tan, W.; Gao, J.; Pan, L.; Ye, X.; Chen, L.; Zheng, W. miR-145-5p Suppresses Breast Cancer Progression by Inhibiting SOX2. J. Surg. Res. 2019, 236, 278–287. [Google Scholar] [CrossRef] [PubMed]
- Xie, H.; Xiao, R.; He, Y.; He, L.; Xie, C.; Chen, J.; Hong, Y. MicroRNA-100 inhibits breast cancer cell proliferation, invasion and migration by targeting FOXA1. Oncol. Lett. 2021, 22, 816. [Google Scholar] [CrossRef] [PubMed]
- Wu, K.; Ung, Y.C. Reply: Autocontouring versus Manual Contouring. J. Nucl. Med. 2011, 52, 658–659. [Google Scholar] [CrossRef]
- Jabbar, H.K.; Khan, R.Z. Methods to Avoid Over-Fitting and Under-Fitting in Supervised Machine Learning (Comparative Study). Comput. Sci. Commun. Instrum. Devices 2015, 70, 163–172. [Google Scholar]
- Bellinger, C.; Drummond, C.; Japkowicz, N. Beyond the boundaries of SMOTE. In Joint European Conference on Machine Learning and Knowledge Discovery in Databases; Springer: Berlin/Heidelberg, Germany, 2016. [Google Scholar]
- Vanwinckelen, G.; Blockeel, H. On estimating model accuracy with repeated cross-validation. In Proceedings of the BeneLearn 2012 21st Belgian-Dutch Conference on Machine Learning, Ghent, Belgium, 24–25 May 2012. [Google Scholar]


| Variables [N] | Number of Missing Patients | Median | Range [max–min] | Mean | SD |
|---|---|---|---|---|---|
| Age (years) [N = 27] | 0 | 57 | 82–35 | 55.259 | 13.75 |
| circulating miR-125b-5p [N = 22] | 5 | 0.017 | 0.102–0.006 | 0.026 | 0.024 |
| circulating miR-143-3p [N = 22] | 5 | 0.009 | 0.061–0.002 | 0.018 | 0.018 |
| circulating miR-145-5p [N = 22] | 5 | 0.006 | 0.045–0.002 | 0.012 | 0.012 |
| circulating miR_100_5p [N = 19] | 8 | 0.010 | 0.051–0.004 | 0.017 | 0.014 |
| circulating miR_23a_3p [N = 19] | 8 | 0.155 | 0.438–0.039 | 0.19 | 0.13 |
| ESTROGEN RECEPTOR STATUS (%) [N = 23] | 4 | 90 | 99–0.5 | 75.87 | 32.289 |
| PROGESTERONE RECEPTOR STATUS (%) [N = 24] | 3 | 55 | 99–0.5 | 52.979 | 38.606 |
| HER2 STATUS (%) [N = 10] | 17 | 90 | 99–60 | 84.2 | 15.747 |
| Ki-67 (%) [N = 24] | 3 | 40 | 80–5 | 41.25 | 26.996 |
| Number of Patients | Percentage (%) | ||||
| Molecular subtype classification ER/PR/HER [N = 24] | 3 | ||||
| +/−/+ | 1 | 4.17 | |||
| +/+/− | 13 | 54.17 | |||
| +/+/+ | 10 | 41.67 | |||
| Grading [N = 19] | 8 | ||||
| G2 | 11 | 57.89 | |||
| G3 | 8 | 42.11 | |||
Publisher’s Note: MDPI stays neutral with regard to jurisdictional claims in published maps and institutional affiliations. |
© 2022 by the authors. Licensee MDPI, Basel, Switzerland. This article is an open access article distributed under the terms and conditions of the Creative Commons Attribution (CC BY) license (https://creativecommons.org/licenses/by/4.0/).
Share and Cite
Castaldo, R.; Garbino, N.; Cavaliere, C.; Incoronato, M.; Basso, L.; Cuocolo, R.; Pace, L.; Salvatore, M.; Franzese, M.; Nicolai, E. A Complex Radiomic Signature in Luminal Breast Cancer from a Weighted Statistical Framework: A Pilot Study. Diagnostics 2022, 12, 499. https://doi.org/10.3390/diagnostics12020499
Castaldo R, Garbino N, Cavaliere C, Incoronato M, Basso L, Cuocolo R, Pace L, Salvatore M, Franzese M, Nicolai E. A Complex Radiomic Signature in Luminal Breast Cancer from a Weighted Statistical Framework: A Pilot Study. Diagnostics. 2022; 12(2):499. https://doi.org/10.3390/diagnostics12020499
Chicago/Turabian StyleCastaldo, Rossana, Nunzia Garbino, Carlo Cavaliere, Mariarosaria Incoronato, Luca Basso, Renato Cuocolo, Leonardo Pace, Marco Salvatore, Monica Franzese, and Emanuele Nicolai. 2022. "A Complex Radiomic Signature in Luminal Breast Cancer from a Weighted Statistical Framework: A Pilot Study" Diagnostics 12, no. 2: 499. https://doi.org/10.3390/diagnostics12020499
APA StyleCastaldo, R., Garbino, N., Cavaliere, C., Incoronato, M., Basso, L., Cuocolo, R., Pace, L., Salvatore, M., Franzese, M., & Nicolai, E. (2022). A Complex Radiomic Signature in Luminal Breast Cancer from a Weighted Statistical Framework: A Pilot Study. Diagnostics, 12(2), 499. https://doi.org/10.3390/diagnostics12020499