
Influences on PET Quantification and Interpretation

 ,
,  ,
, 
Abstract
1. Introduction
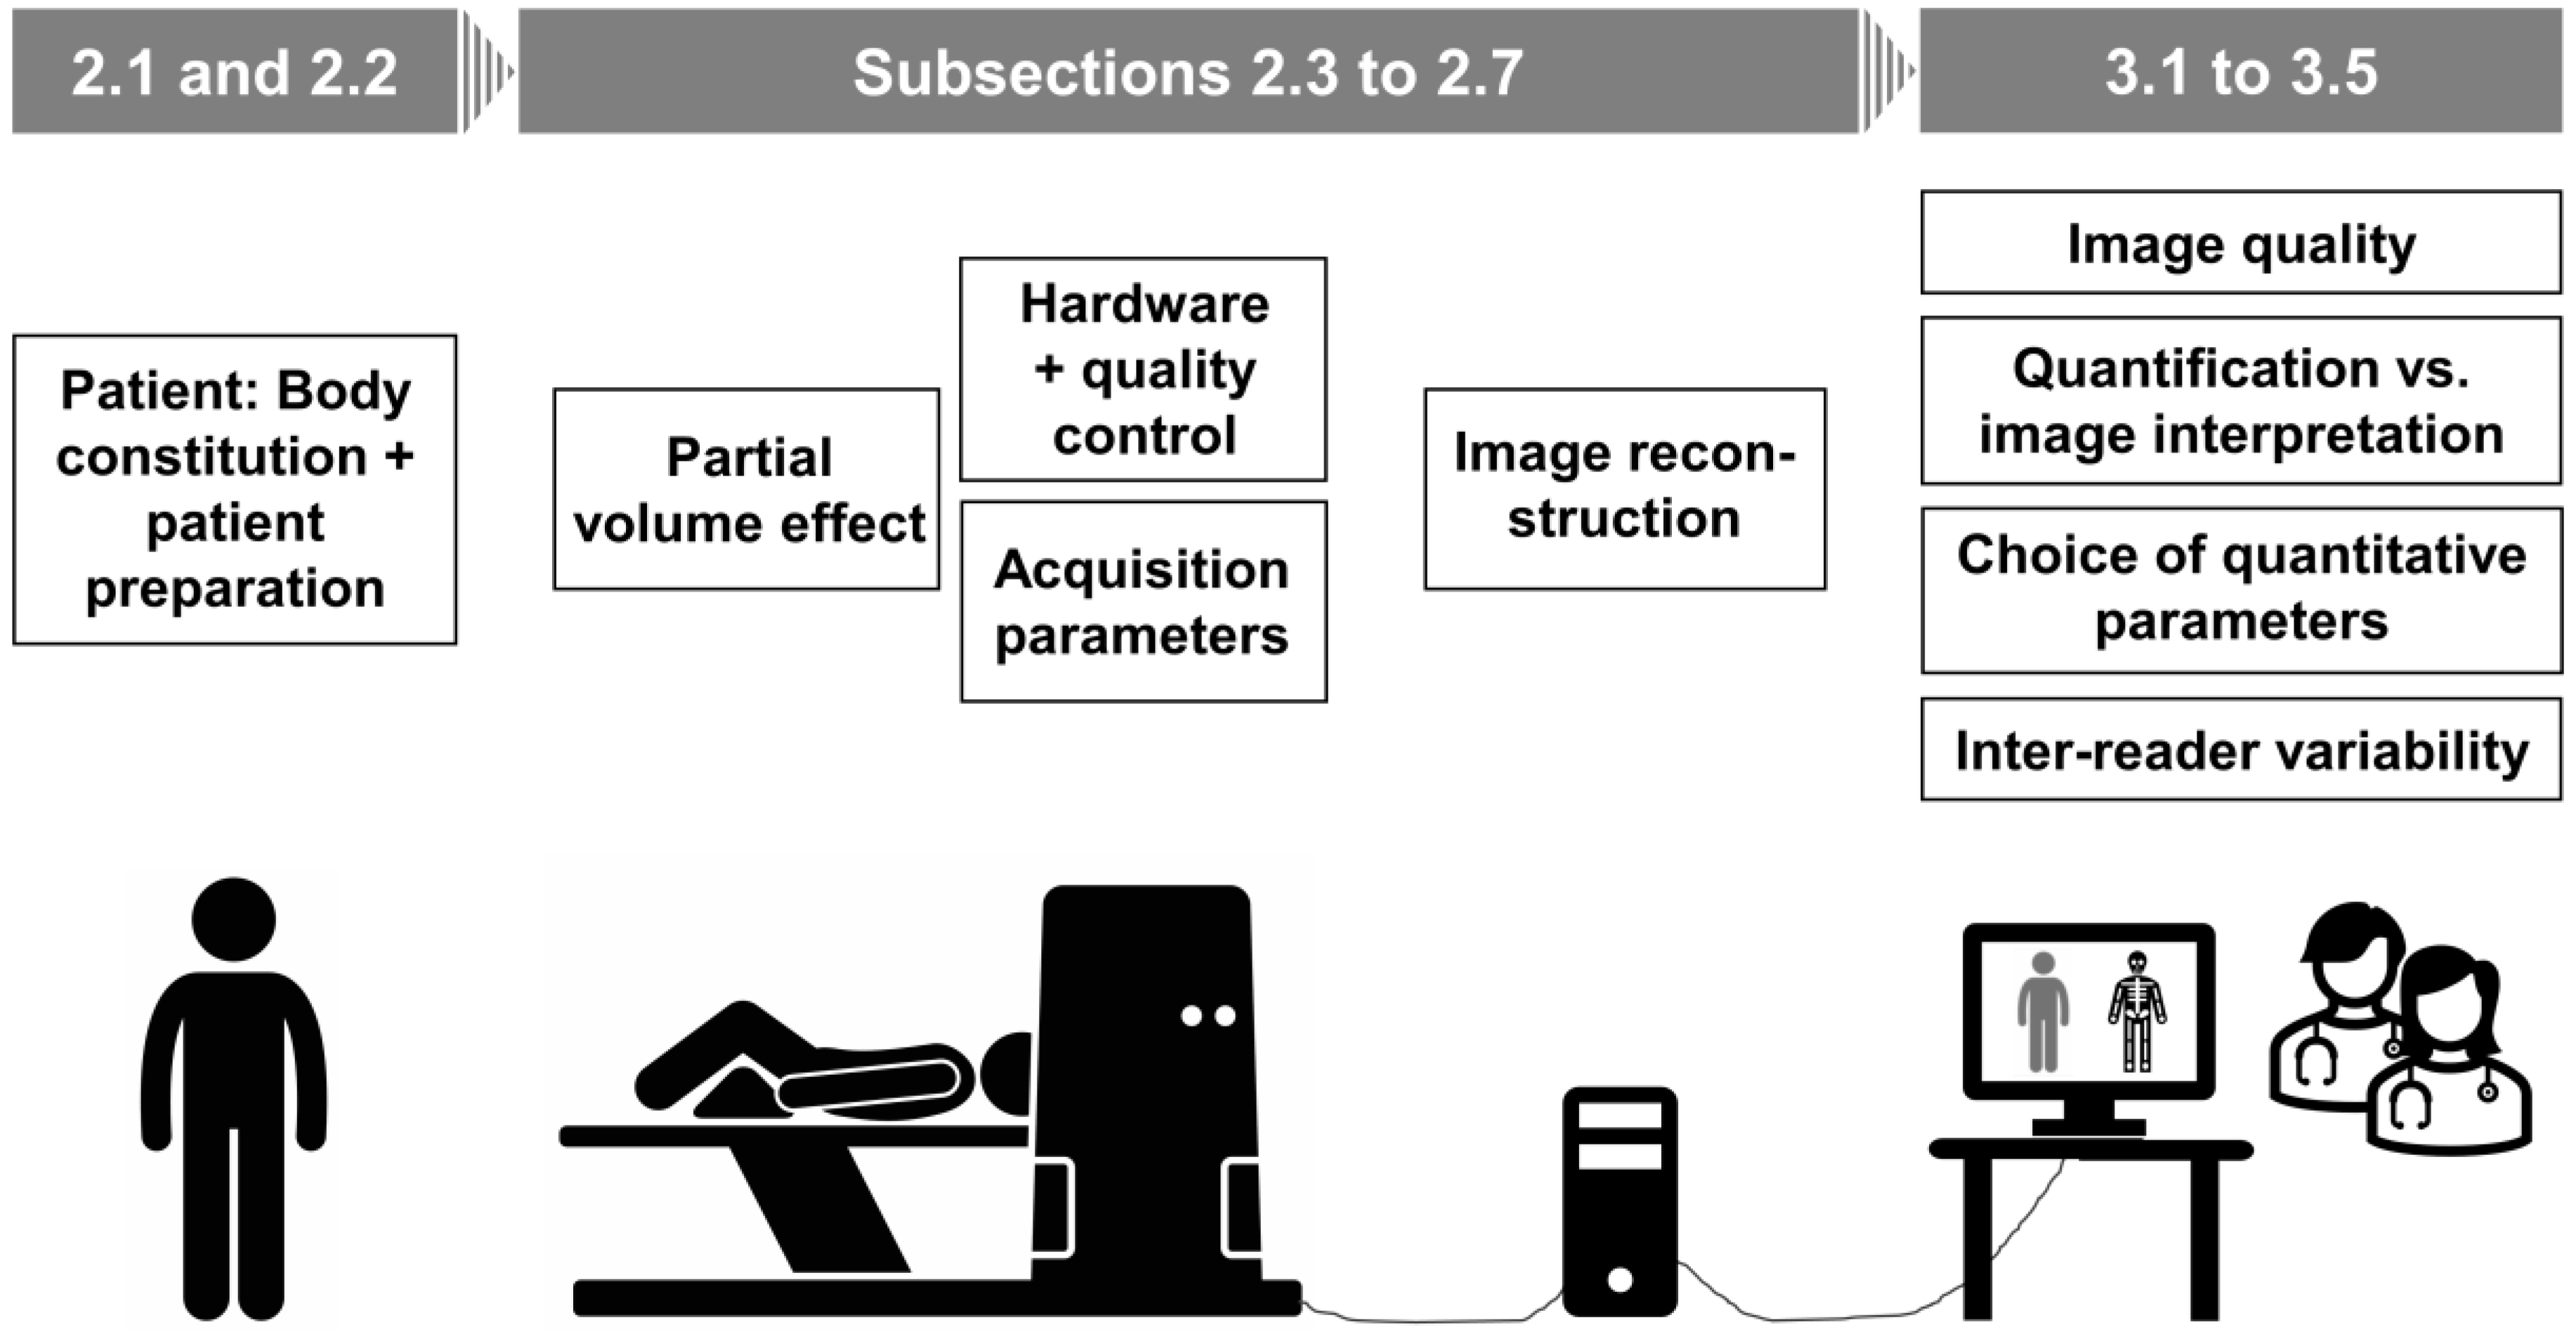
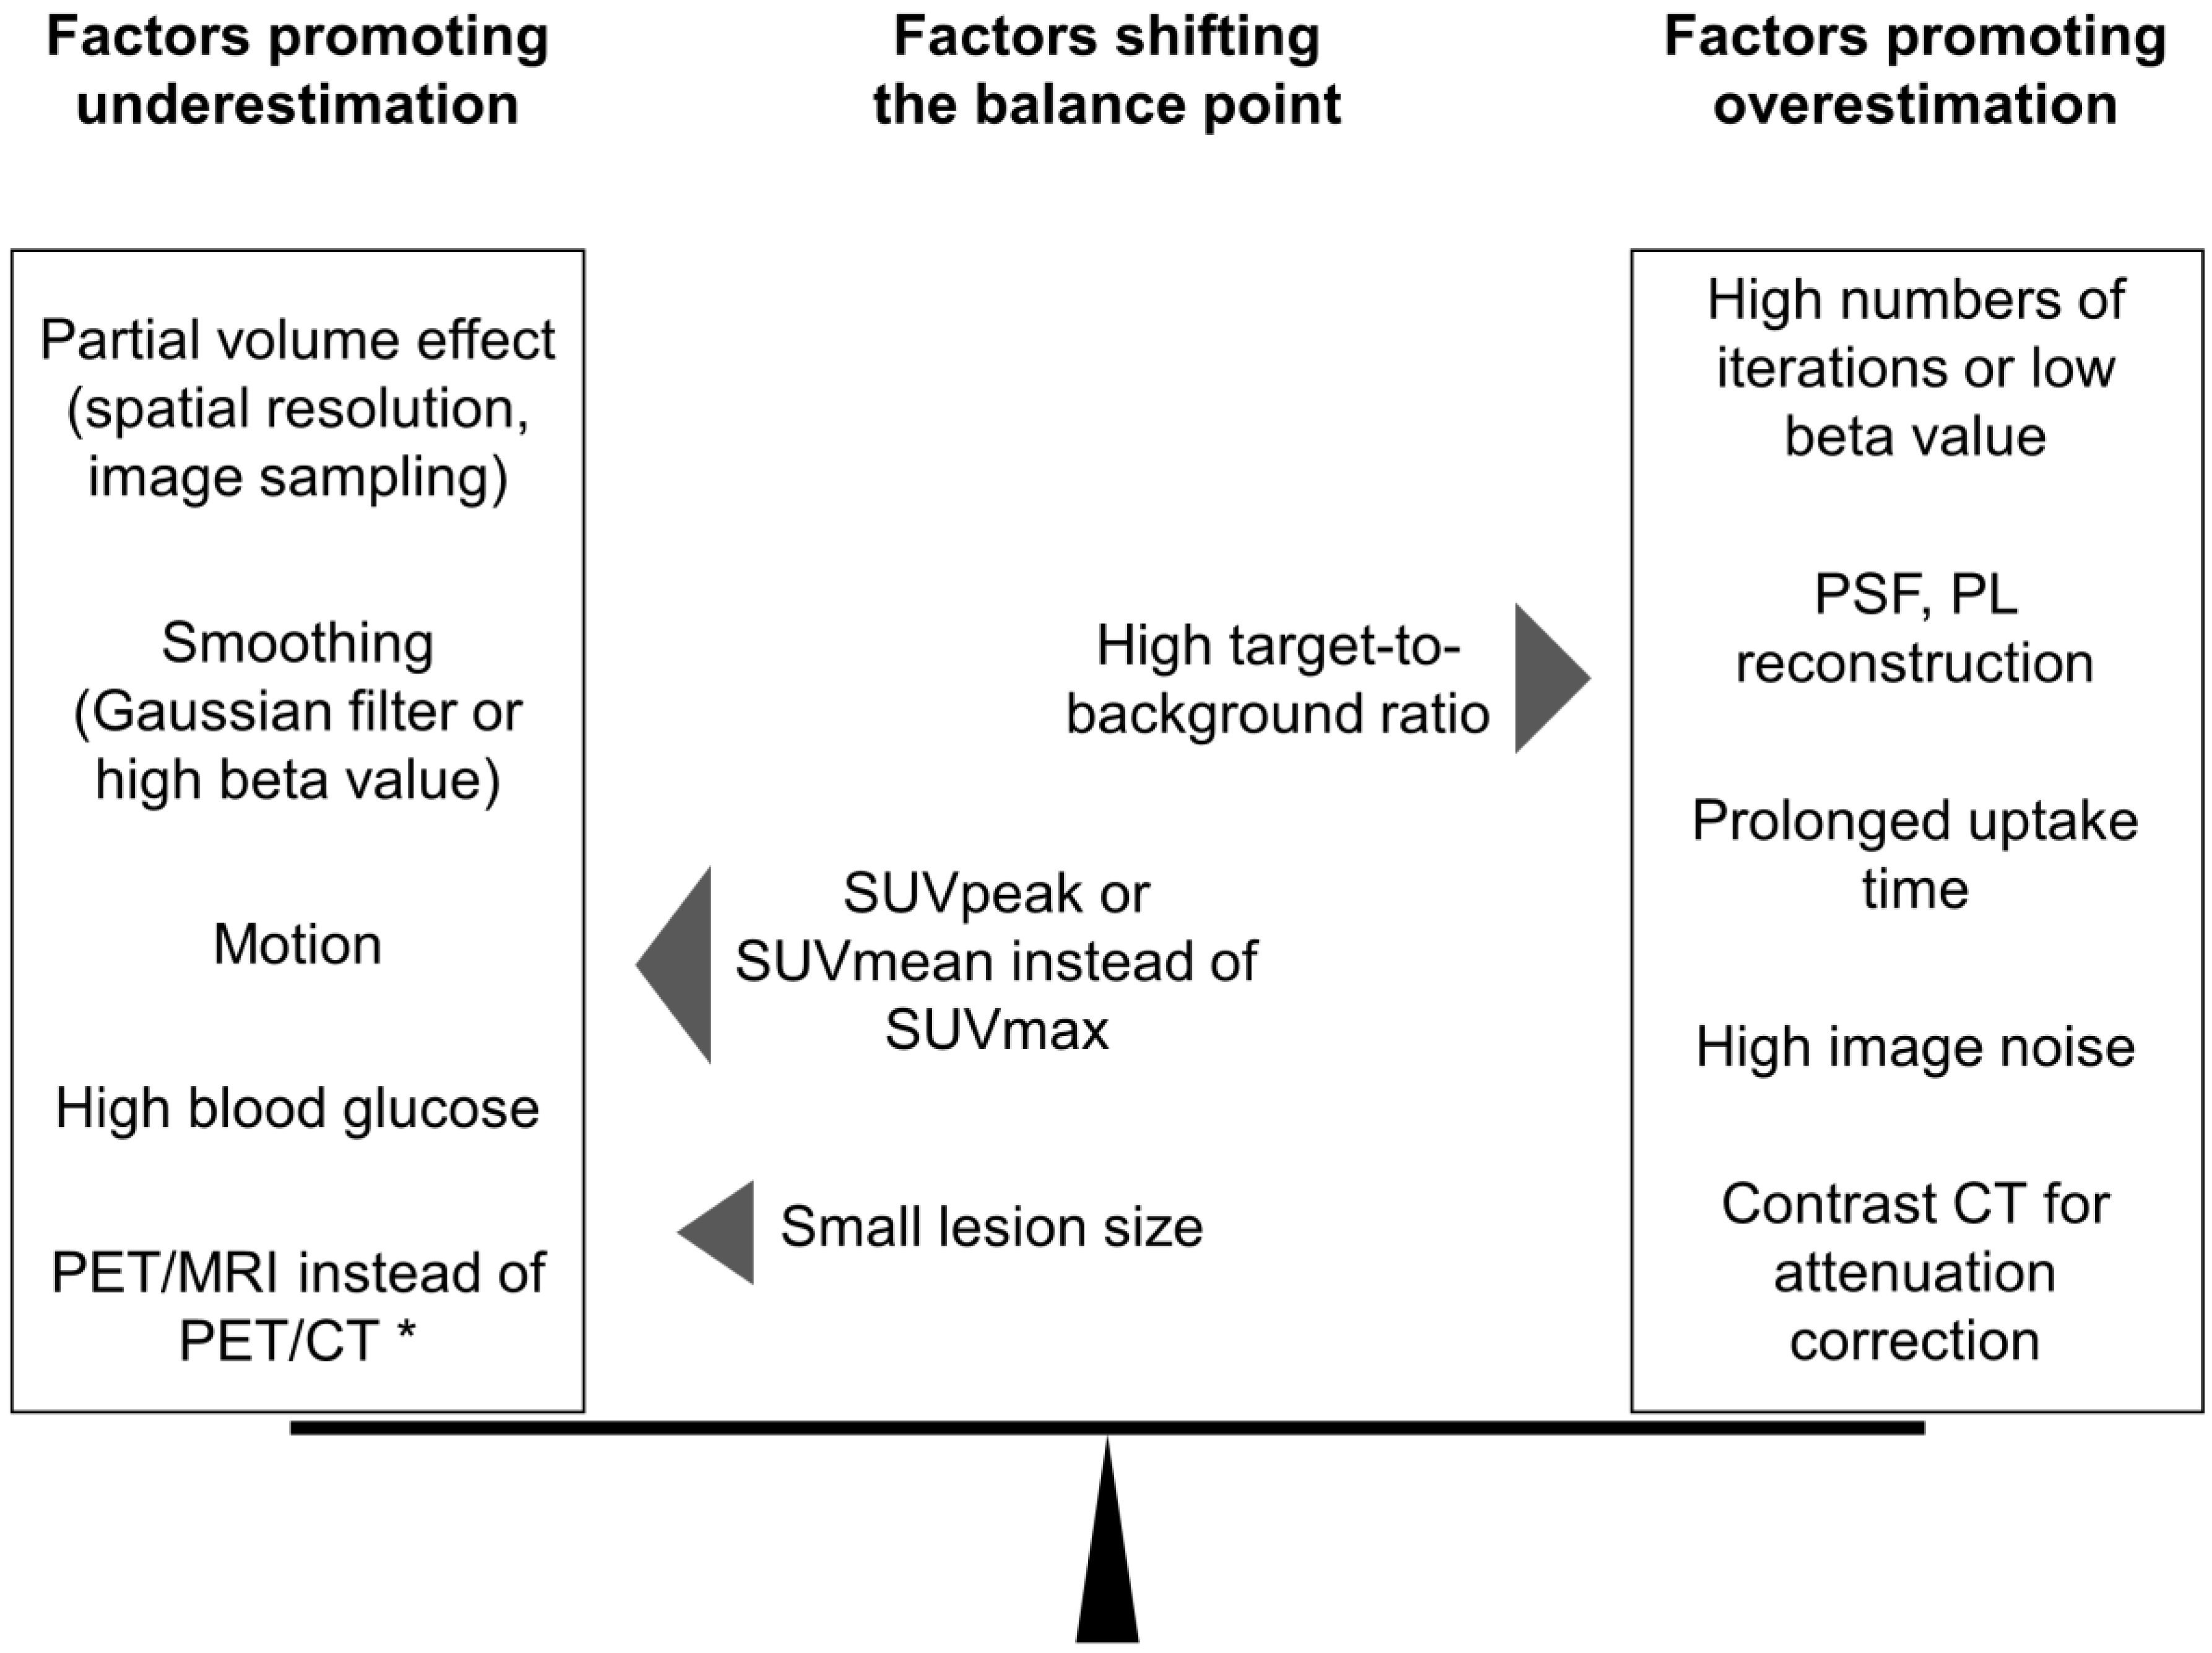
2. Factors Affecting PET Quantification
2.1. Patient
2.2. Patient Preparation
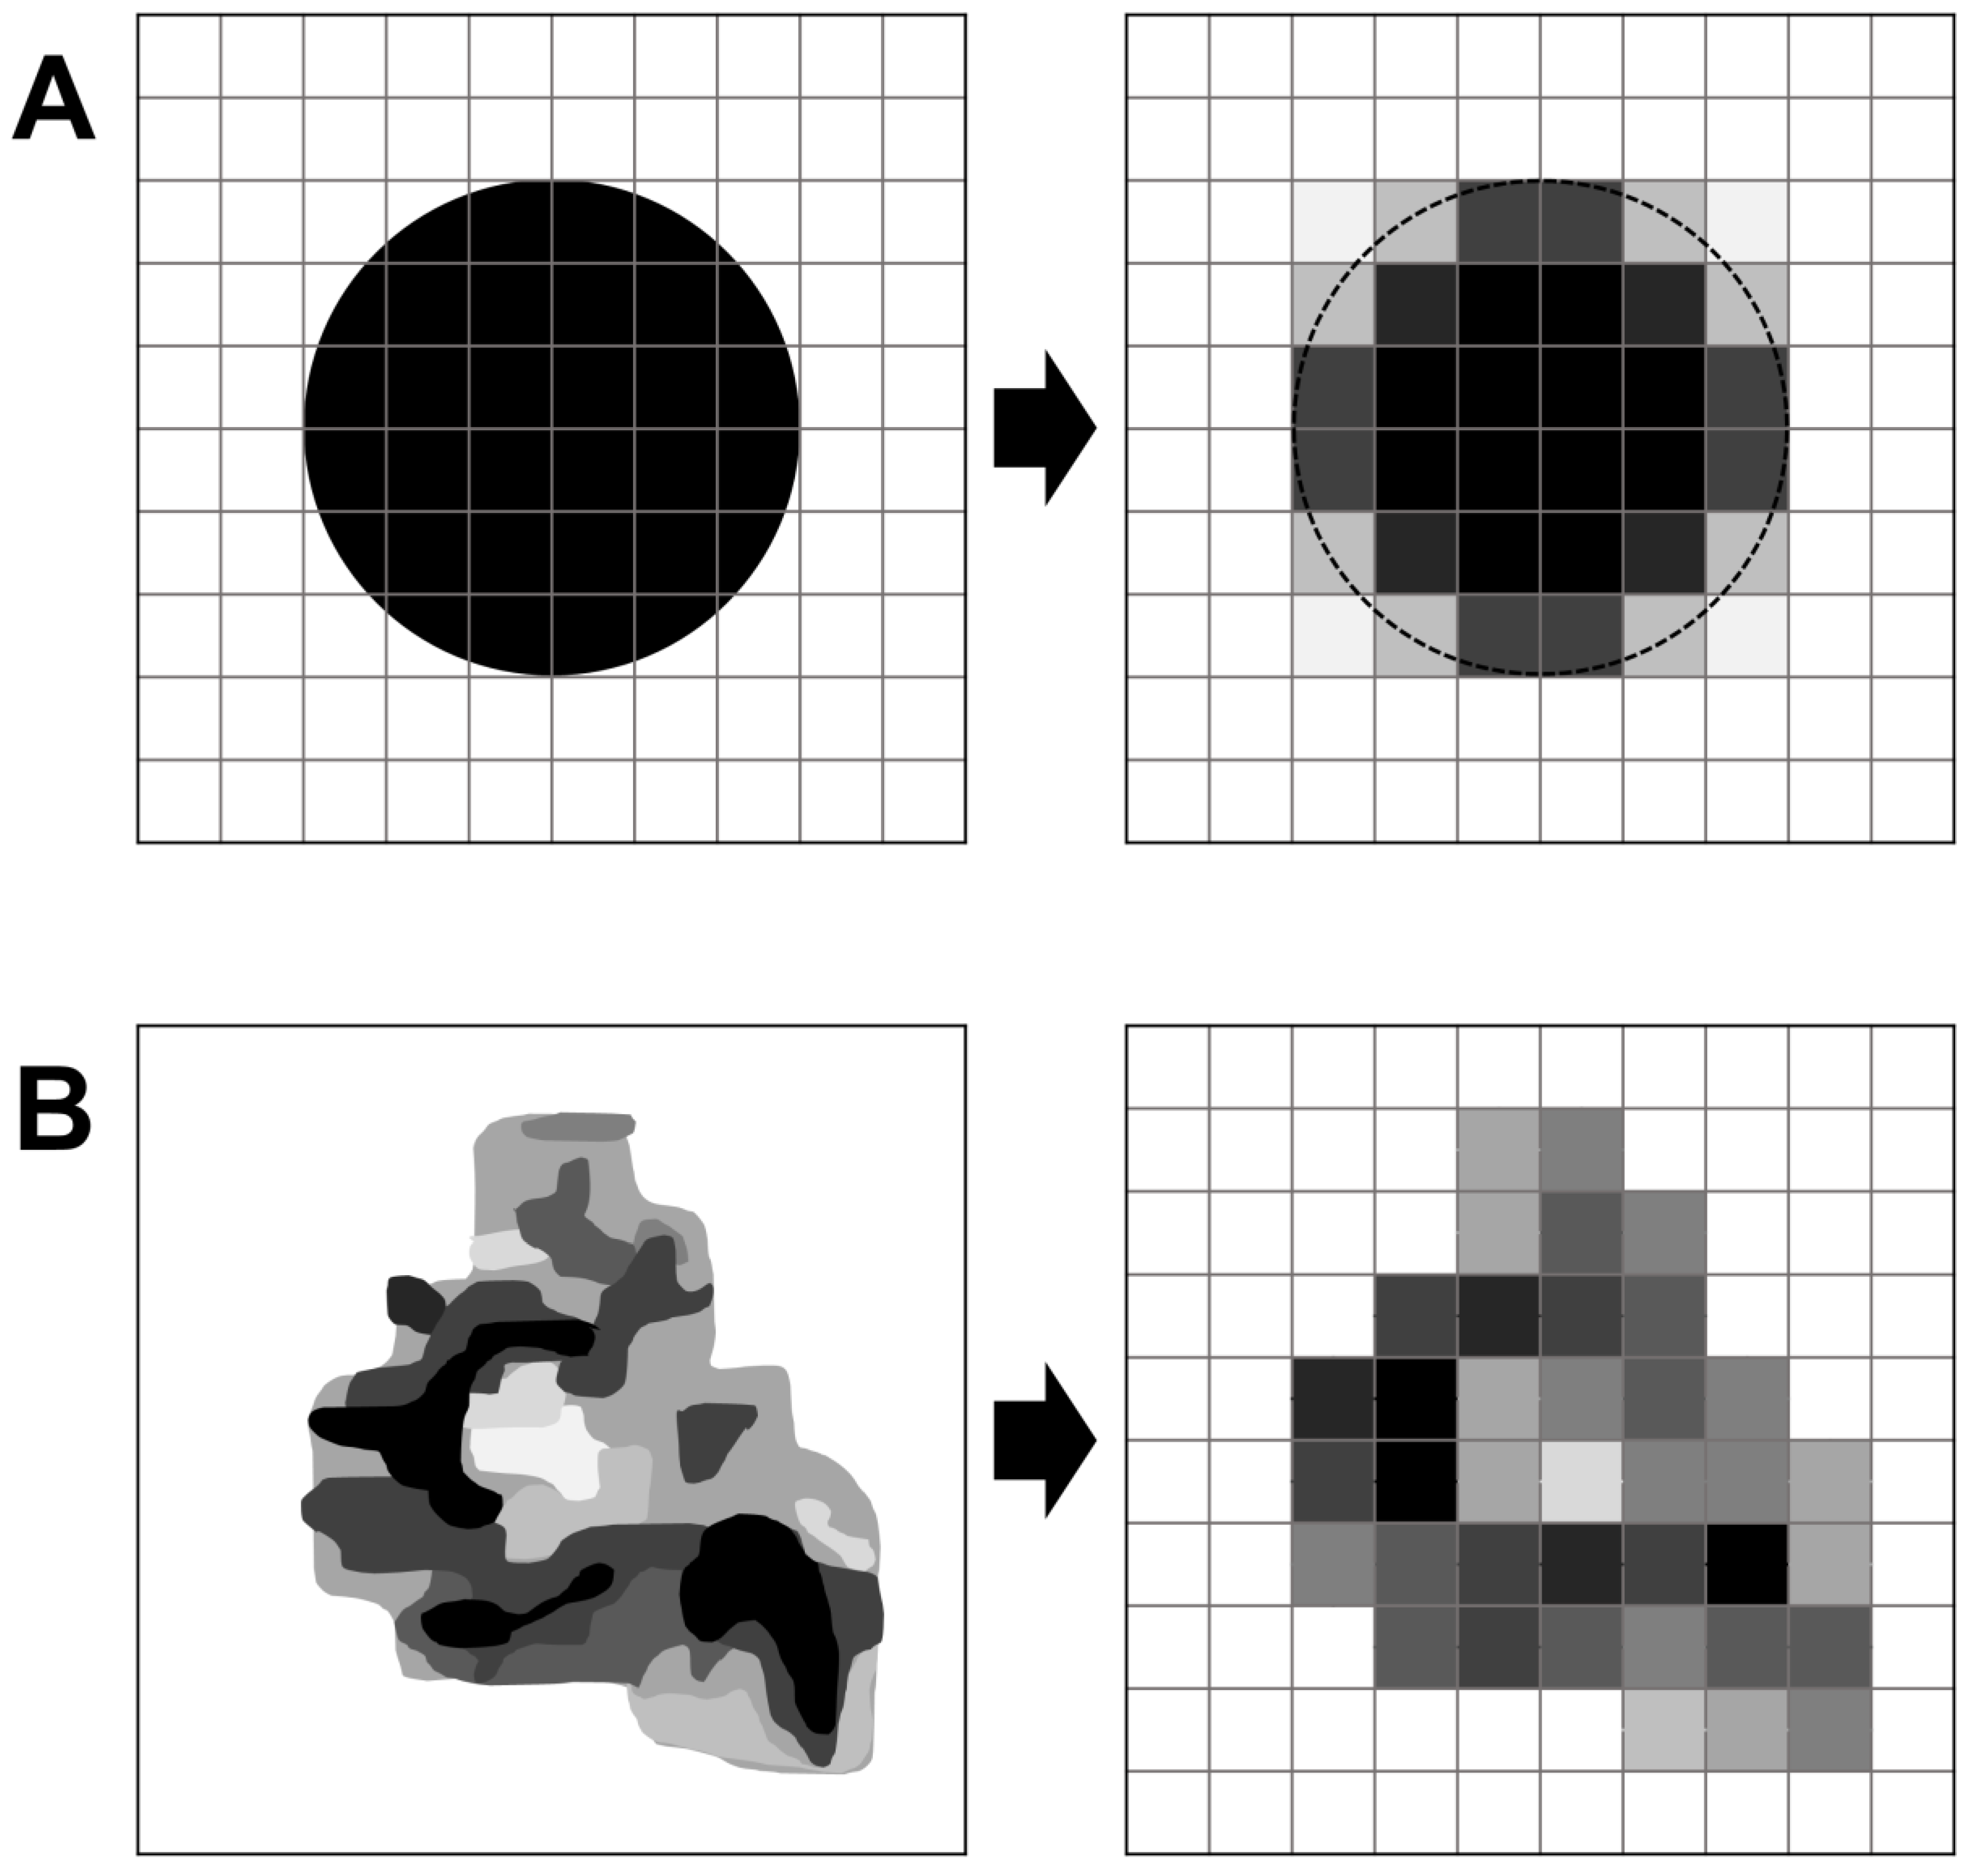
2.3. Partial Volume Effect
2.4. Hardware
2.4.1. Silicon Photomultiplier (SiPM) Technology
2.4.2. PET/CT vs. PET/MRI
2.5. Quality Control
2.6. Acquisition Parameters
2.6.1. Uptake Time after Tracer Administration
2.6.2. Acquisition Duration per Bed Position
2.6.3. Respiratory Motion Correction
2.7. Image Reconstruction
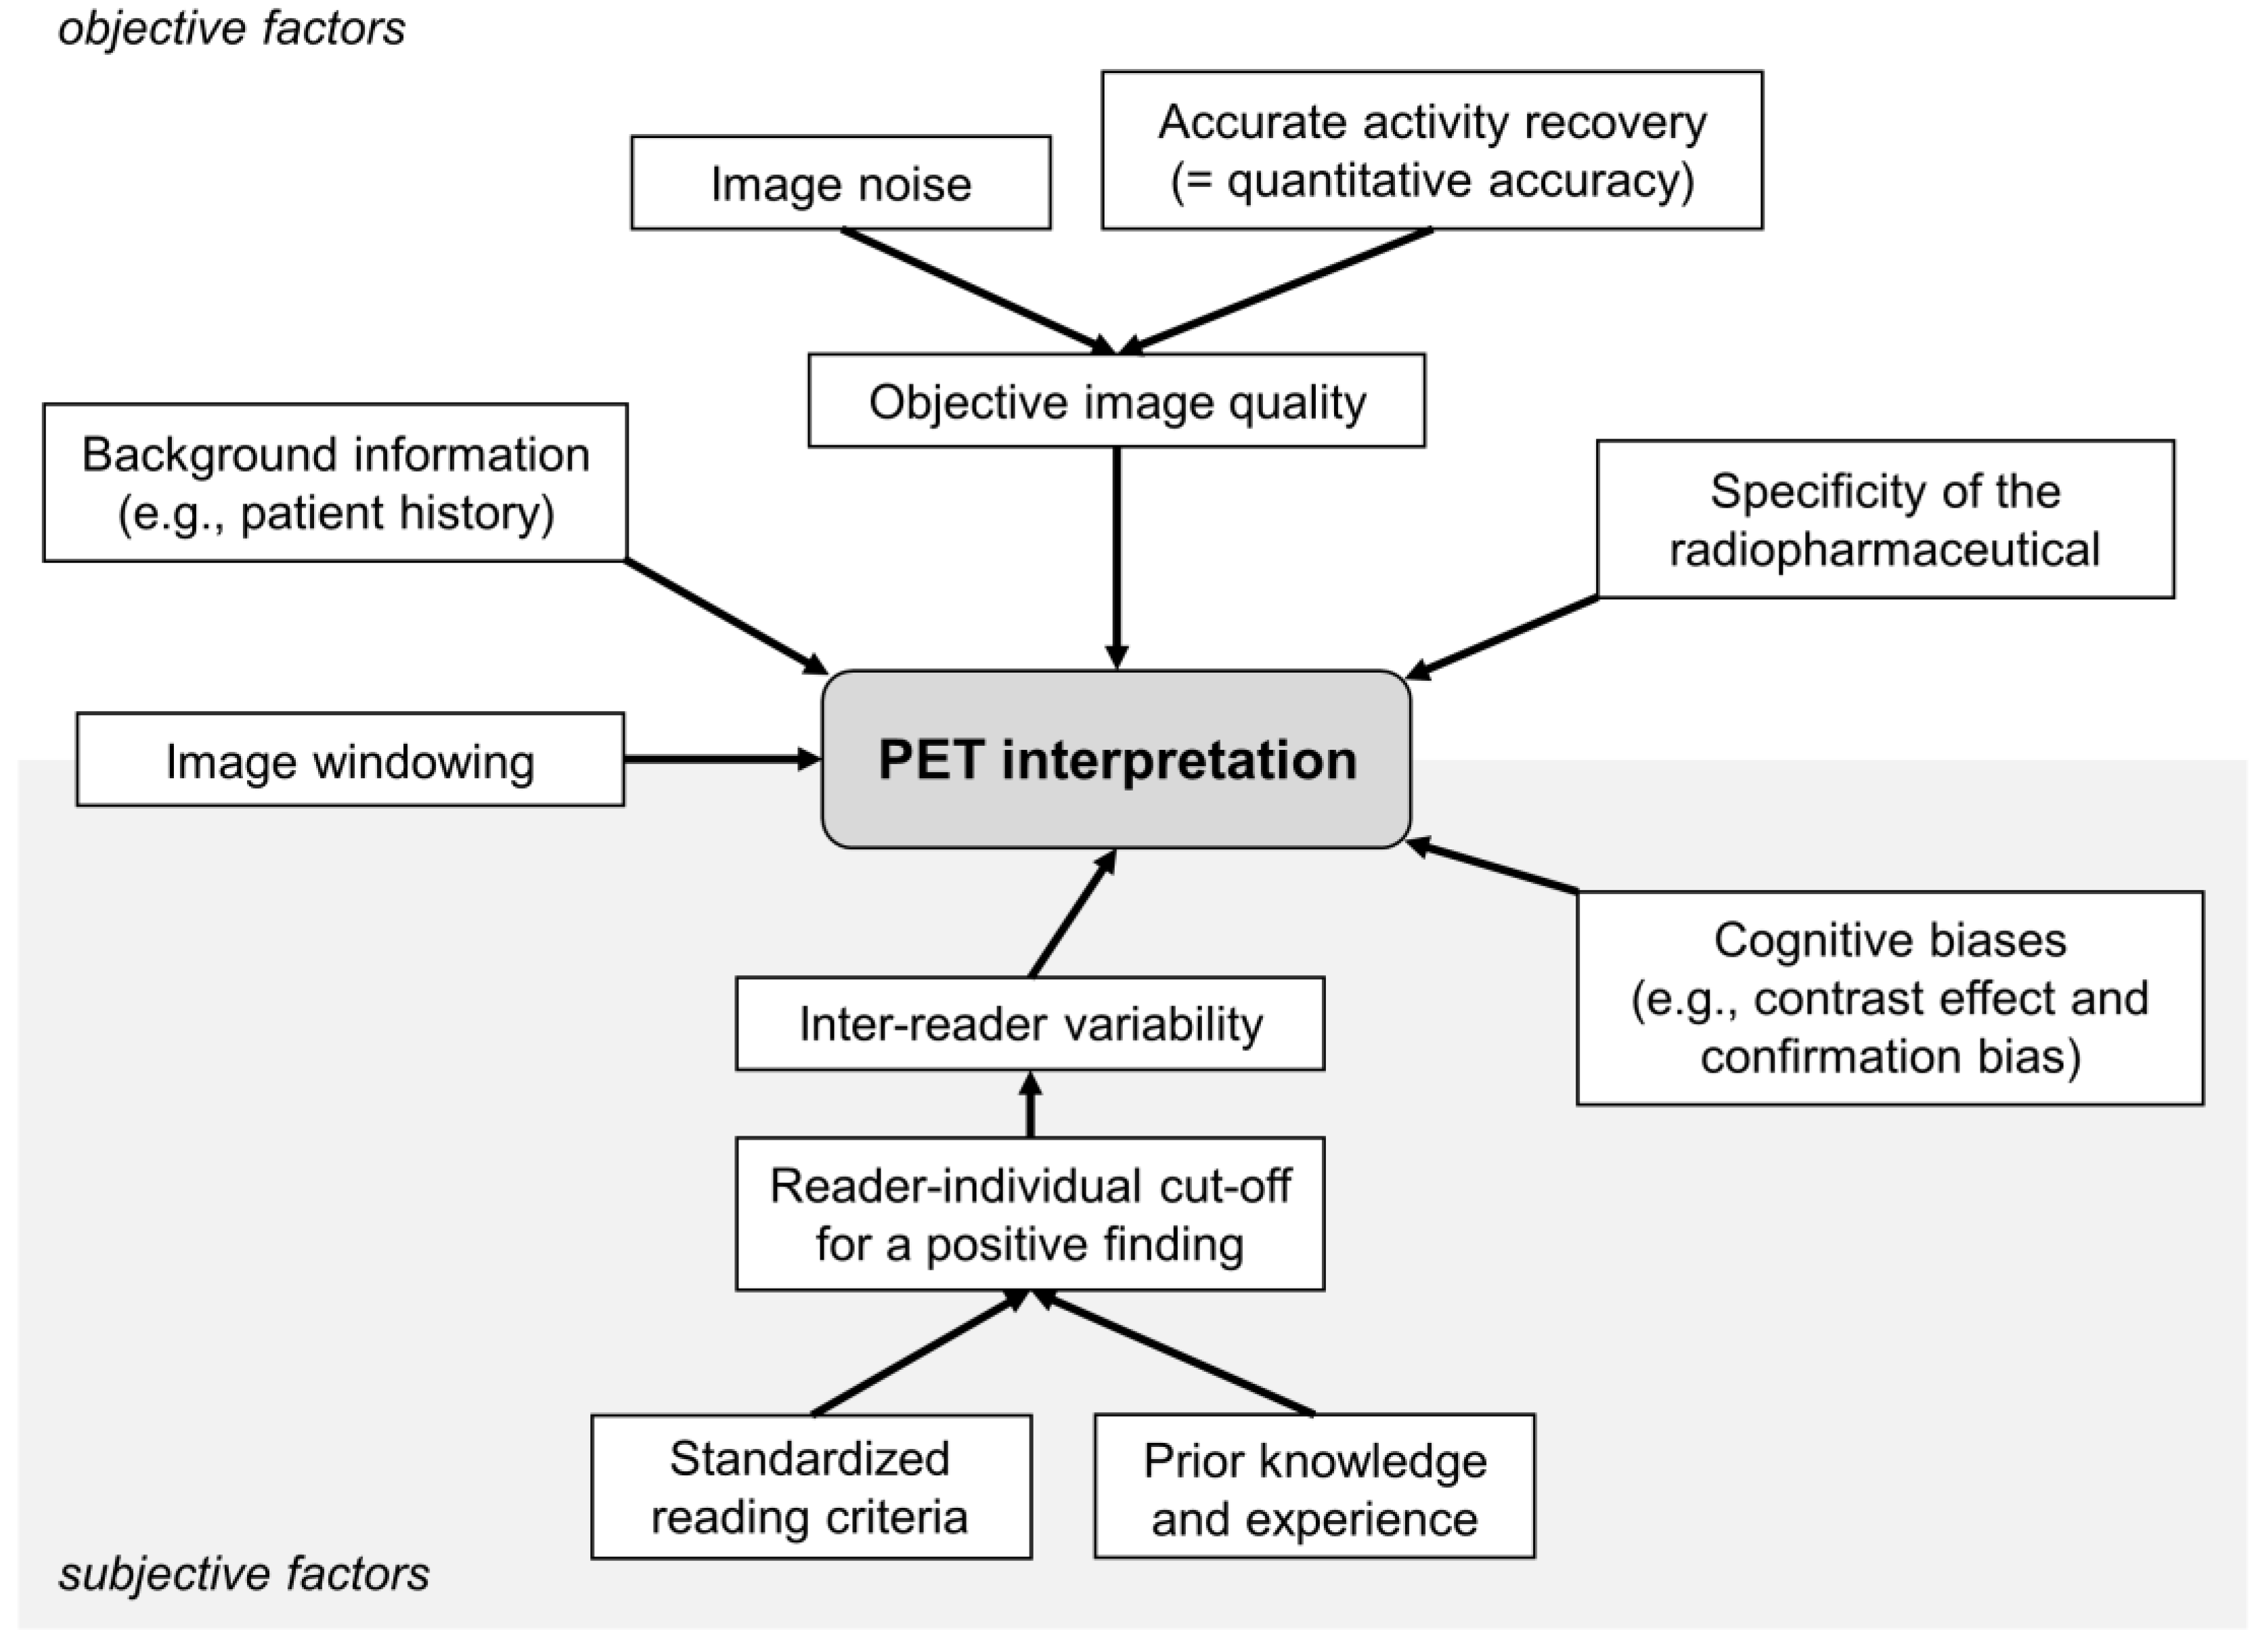
3. Factors Affecting PET Interpretation
3.1. Specificity of the Radiopharmaceutical
3.2. Image Quality and Lesion Detection
3.2.1. Injected Activity and Acquisition Time
3.2.2. SiPM Technology
3.2.3. Image Reconstruction
3.3. Relationship between Objective and Subjective Image Quality
3.4. Relationship between PET Quantification and Image Interpretation
3.4.1. Quantitative or Visual Interpretation Criteria?
3.4.2. SUV: Which Parameter?
3.4.3. MTV: Which Delineation Method?
3.5. Inter-Reader Variability
4. Conclusions and Perspectives
Author Contributions
Funding
Institutional Review Board Statement
Informed Consent Statement
Acknowledgments
Conflicts of Interest
References
- Eskian, M.; Alavi, A.; Khorasanizadeh, M.; Viglianti, B.L.; Jacobsson, H.; Barwick, T.D.; Meysamie, A.; Yi, S.K.; Iwano, S.; Bybel, B.; et al. Effect of blood glucose level on standardized uptake value (SUV) in 18F- FDG PET-scan: A systematic review and meta-analysis of 20,807 individual SUV measurements. Eur. J. Nucl. Med. Mol. Imaging 2019, 46, 224–237. [Google Scholar] [CrossRef] [PubMed]
- Keramida, G.; Peters, A.M. FDG PET/CT of the non-malignant liver in an increasingly obese world population. Clin. Physiol. Funct. Imaging 2020, 40, 304–319. [Google Scholar] [CrossRef] [PubMed]
- Sprinz, C.; Zanon, M.; Altmayer, S.; Watte, G.; Irion, K.; Marchiori, E.; Hochhegger, B. Effects of blood glucose level on 18F fluorodeoxyglucose (18F-FDG) uptake for PET/CT in normal organs: An analysis on 5623 patients. Sci. Rep. 2018, 8, 2126. [Google Scholar] [CrossRef]
- Christen, T.; Sheikine, Y.; Rocha, V.Z.; Hurwitz, S.; Goldfine, A.B.; Di Carli, M.; Libby, P. Increased glucose uptake in visceral versus subcutaneous adipose tissue revealed by PET imaging. JACC Cardiovasc. Imaging 2010, 3, 843–851. [Google Scholar] [CrossRef] [PubMed]
- Zhao, J.; Xue, Q.; Chen, X.; You, Z.; Wang, Z.; Yuan, J.; Liu, H.; Hu, L. Evaluation of SUVlean consistency in FDG and PSMA PET/MR with Dixon-, James-, and Janma-based lean body mass correction. EJNMMI Phys. 2021, 8, 17. [Google Scholar] [CrossRef]
- Büsing, K.A.; Schönberg, S.O.; Brade, J.; Wasser, K. Impact of blood glucose, diabetes, insulin, and obesity on standardized uptake values in tumors and healthy organs on 18F-FDG PET/CT. Nucl. Med. Biol. 2013, 40, 206–213. [Google Scholar] [CrossRef]
- Akers, S.R.; Werner, T.J.; Rubello, D.; Alavi, A.; Cheng, G. 18F-FDG uptake and clearance in patients with compromised renal function. Nucl. Med. Commun. 2016, 37, 825–832. [Google Scholar] [CrossRef]
- Toriihara, A.; Kitazume, Y.; Nishida, H.; Kubota, K.; Nakadate, M.; Tateishi, U. Comparison of FDG-PET/CT images between chronic renal failure patients on hemodialysis and controls. Am. J. Nucl. Med. Mol. Imaging 2015, 5, 204–211. [Google Scholar]
- Yoshizawa, H.; Gazes, Y.; Stern, Y.; Miyata, Y.; Uchiyama, S. Characterizing the normative profile of 18F-FDG PET brain imaging: Sex difference, aging effect, and cognitive reserve. Psychiatry Res. 2014, 221, 78–85. [Google Scholar] [CrossRef]
- Turpin, S.; Martineau, P.; Levasseur, M.A.; Lambert, R. Modeling the Effects of Age and Sex on Normal Pediatric Brain Metabolism Using 18F-FDG PET/CT. J. Nucl. Med. 2018, 59, 1118–1124. [Google Scholar] [CrossRef]
- Jung, Y.; Kim, T.H.; Kim, J.Y.; Han, S.; An, Y.S. The effect of sex hormones on normal breast tissue metabolism: Evaluation by FDG PET/CT. Medicine 2019, 98, e16306. [Google Scholar] [CrossRef] [PubMed]
- Kim, T.H.; Kim, M.R.; Jung, Y.; An, Y.S. Relationship between sex hormones levels and 18F-FDG uptake by the ovaries in premenopausal woman. Radiol. Oncol. 2019, 53, 293–299. [Google Scholar] [CrossRef] [PubMed]
- Brown, R.S.; Wahl, R.L. Overexpression of Glut-1 glucose transporter in human breast cancer. An immunohistochemical study. Cancer 1993, 72, 2979–2985. [Google Scholar] [CrossRef]
- Higashi, K.; Ueda, Y.; Sakurai, A.; Mingwang, X.; Xu, L.; Murakami, M.; Seki, H.; Oguchi, M.; Taki, S.; Nambu, Y.; et al. Correlation of Glut-1 glucose transporter expression with [18F]FDG uptake in non-small cell lung cancer. Eur. J. Nucl. Med. 2000, 27, 1778–1785. [Google Scholar] [CrossRef] [PubMed]
- Kubota, R.; Yamada, S.; Kubota, K.; Ishiwata, K.; Tamahashi, N.; Ido, T. Intratumoral distribution of fluorine-18-fluorodeoxyglucose in vivo: High accumulation in macrophages and granulation tissues studied by microautoradiography. J. Nucl. Med. 1992, 33, 1972–1980. [Google Scholar]
- Park, S.G.; Lee, J.H.; Lee, W.A.; Han, K.M. Biologic correlation between glucose transporters, hexokinase-II, Ki-67 and FDG uptake in malignant melanoma. Nucl. Med. Biol. 2012, 39, 1167–1172. [Google Scholar] [CrossRef]
- Paul, R.; Johansson, R.; Kellokumpu-Lehtinen, P.L.; Söderström, K.O.; Kangas, L. Tumor localization with 18F-2-fluoro-2-deoxy-D-glucose: Comparative autoradiography, glucose 6-phosphatase histochemistry, and histology of renally implanted sarcoma of the rat. Res. Exp. Med. 1985, 185, 87–94. [Google Scholar] [CrossRef]
- Yamada, S.; Kubota, K.; Kubota, R.; Ido, T.; Tamahashi, N. High accumulation of fluorine-18-fluorodeoxyglucose in turpentine-induced inflammatory tissue. J. Nucl. Med. 1995, 36, 1301–1306. [Google Scholar]
- Simpson, I.A.; Dwyer, D.; Malide, D.; Moley, K.H.; Travis, A.; Vannucci, S.J. The facilitative glucose transporter GLUT3: 20 years of distinction. Am. J. Physiol. Endocrinol. Metab. 2008, 295, E242–E253. [Google Scholar] [CrossRef]
- Langen, K.J.; Braun, U.; Rota Kops, E.; Herzog, H.; Kuwert, T.; Nebeling, B.; Feinendegen, L.E. The influence of plasma glucose levels on fluorine-18-fluorodeoxyglucose uptake in bronchial carcinomas. J. Nucl. Med. 1993, 34, 355–359. [Google Scholar]
- Lindholm, P.; Minn, H.; Leskinen-Kallio, S.; Bergman, J.; Ruotsalainen, U.; Joensuu, H. Influence of the blood glucose concentration on FDG uptake in cancer—A PET study. J. Nucl. Med. 1993, 34, 1–6. [Google Scholar] [PubMed]
- Namba, H.; Nakagawa, K.; Iyo, M.; Fukushi, K.; Irie, T. A simple method for measuring glucose utilization of insulin-sensitive tissues by using the brain as a reference. Eur. J. Nucl. Med. 1994, 21, 228–231. [Google Scholar] [CrossRef]
- Jensen, T.E.; Sylow, L.; Rose, A.J.; Madsen, A.B.; Angin, Y.; Maarbjerg, S.J.; Richter, E.A. Contraction-stimulated glucose transport in muscle is controlled by AMPK and mechanical stress but not sarcoplasmatic reticulum Ca(2+) release. Mol. Metab. 2014, 3, 742–753. [Google Scholar] [CrossRef] [PubMed]
- Boellaard, R.; Delgado-Bolton, R.; Oyen, W.J.; Giammarile, F.; Tatsch, K.; Eschner, W.; Verzijlbergen, F.J.; Barrington, S.F.; Pike, L.C.; Weber, W.A.; et al. FDG PET/CT: EANM procedure guidelines for tumour imaging: Version 2.0. Eur. J. Nucl. Med. Mol. Imaging 2015, 42, 328–354. [Google Scholar] [CrossRef]
- Lee, Y.A.; Kim, J.I.; Lee, J.W.; Cho, Y.J.; Lee, B.H.; Chung, H.W.; Park, K.K.; Han, J.S. Effects of various anesthetic protocols on 18F-flurodeoxyglucose uptake into the brains and hearts of normal miniature pigs (Sus scrofa domestica). J. Am. Assoc. Lab. Anim. Sci. 2012, 51, 246–252. [Google Scholar] [PubMed]
- Israel, O.; Weiler-Sagie, M.; Rispler, S.; Bar-Shalom, R.; Frenkel, A.; Keidar, Z.; Bar-Shalev, A.; Strauss, H.W. PET/CT quantitation of the effect of patient-related factors on cardiac 18F-FDG uptake. J. Nucl. Med. 2007, 48, 234–239. [Google Scholar] [PubMed]
- Yao, W.J.; Hoh, C.K.; Hawkins, R.A.; Glaspy, J.A.; Weil, J.A.; Lee, S.J.; Maddahi, J.; Phelps, M.E. Quantitative PET imaging of bone marrow glucose metabolic response to hematopoietic cytokines. J. Nucl. Med. 1995, 36, 794–799. [Google Scholar]
- Aalbersberg, E.A.; de Wit-van der Veen, B.J.; Versleijen, M.W.J.; Saveur, L.J.; Valk, G.D.; Tesselaar, M.E.T.; Stokkel, M.P.M. Influence of lanreotide on uptake of 68Ga-DOTATATE in patients with neuroendocrine tumours: A prospective intra-patient evaluation. Eur. J. Nucl. Med. Mol. Imaging 2019, 46, 696–703. [Google Scholar] [CrossRef]
- Mathy, C.S.; Mayr, T.; Kürpig, S.; Meisenheimer, M.; Dolscheid-Pommerich, R.C.; Stoffel-Wagner, B.; Kristiansen, G.; Essler, M.; Muders, M.H.; Bundschuh, R.A. Antihormone treatment differentially regulates PSA secretion, PSMA expression and 68Ga-PSMA uptake in LNCaP cells. J. Cancer Res. Clin. Oncol. 2021, 147, 1733–1743. [Google Scholar] [CrossRef]
- Brumberg, J.; Beckl, M.; Dierks, A.; Schirbel, A.; Krebs, M.; Buck, A.; Kübler, H.; Lapa, C.; Seitz, A.K. Detection Rate of 68Ga-PSMA Ligand PET/CT in Patients with Recurrent Prostate Cancer and Androgen Deprivation Therapy. Biomedicines 2020, 8, 511. [Google Scholar] [CrossRef]
- Vallabhajosula, S.; Killeen, R.P.; Osborne, J.R. Altered biodistribution of radiopharmaceuticals: Role of radiochemical/pharmaceutical purity, physiological, and pharmacologic factors. Semin. Nucl. Med. 2010, 40, 220–241. [Google Scholar] [CrossRef]
- Evans, B.J.; King, A.T.; Katsifis, A.; Matesic, L.; Jamie, J.F. Methods to Enhance the Metabolic Stability of Peptide-Based PET Radiopharmaceuticals. Molecules 2020, 25, 2314. [Google Scholar] [CrossRef] [PubMed]
- Lilburn, D.M.L.; Groves, A.M. The role of PET in imaging of the tumour microenvironment and response to immunotherapy. Clin. Radiol. 2021, 76, 784.e1–784.e15. [Google Scholar] [CrossRef]
- Chaturvedi, S.; Hazari, P.P.; Kaul, A.; Anju; Mishra, A.K. Microenvironment Stimulated Bioresponsive Small Molecule Carriers for Radiopharmaceuticals. ACS Omega 2020, 5, 26297–26306. [Google Scholar] [CrossRef] [PubMed]
- Parker, C.C.; Lapi, S.E. Positron Emission Tomography Imaging of Macrophages in Cancer. Cancers 2021, 13, 1921. [Google Scholar] [CrossRef]
- Iravani, A.; Hicks, R.J. Imaging the Cancer Immune Environment and Its Response to Pharmacologic Intervention, Part 1: The Role of 18F-FDG PET/CT. J. Nucl. Med. 2020, 61, 943–950. [Google Scholar] [CrossRef] [PubMed]
- Dimitrakopoulou-Strauss, A.; Pan, L.; Sachpekidis, C. Kinetic modeling and parametric imaging with dynamic PET for oncological applications: General considerations, current clinical applications, and future perspectives. Eur. J. Nucl. Med. Mol. Imaging 2021, 48, 21–39. [Google Scholar] [CrossRef]
- Kletting, P.; Thieme, A.; Eberhardt, N.; Rinscheid, A.; D’Alessandria, C.; Allmann, J.; Wester, H.J.; Tauber, R.; Beer, A.J.; Glatting, G.; et al. Modeling and Predicting Tumor Response in Radioligand Therapy. J. Nucl. Med. 2019, 60, 65–70. [Google Scholar] [CrossRef]
- Wimberley, C.; Lavisse, S.; Hillmer, A.; Hinz, R.; Turkheimer, F.; Zanotti-Fregonara, P. Kinetic modeling and parameter estimation of TSPO PET imaging in the human brain. Eur. J. Nucl. Med. Mol. Imaging 2021, 49, 246–256. [Google Scholar] [CrossRef]
- Lammertsma, A.A. Radioligand studies: Imaging and quantitative analysis. Eur. Neuropsychopharmacol. J. Eur. Coll. Neuropsychopharmacol. 2002, 12, 513–516. [Google Scholar] [CrossRef]
- Rogasch, J.M.; Suleiman, S.; Hofheinz, F.; Bluemel, S.; Lukas, M.; Amthauer, H.; Furth, C. Reconstructed spatial resolution and contrast recovery with Bayesian penalized likelihood reconstruction (Q.Clear) for FDG-PET compared to time-of-flight (TOF) with point spread function (PSF). EJNMMI Phys. 2020, 7, 2. [Google Scholar] [CrossRef] [PubMed]
- Bettinardi, V.; Castiglioni, I.; De Bernardi, E.; Gilardi, M.C. PET quantification: Strategies for partial volume correction. Clin. Transl. Imaging 2014, 2, 199–218. [Google Scholar] [CrossRef]
- Hofheinz, F.; Langner, J.; Petr, J.; Beuthien-Baumann, B.; Oehme, L.; Steinbach, J.; Kotzerke, J.; van den Hoff, J. A method for model-free partial volume correction in oncological PET. EJNMMI Res. 2012, 2, 16. [Google Scholar] [CrossRef]
- Surti, S.; Karp, J.S. Update on latest advances in time-of-flight PET. Phys. Med. 2020, 80, 251–258. [Google Scholar] [CrossRef] [PubMed]
- Pan, T.; Einstein, S.A.; Kappadath, S.C.; Grogg, K.S.; Lois Gomez, C.; Alessio, A.M.; Hunter, W.C.; El Fakhri, G.; Kinahan, P.E.; Mawlawi, O.R. Performance evaluation of the 5-Ring GE Discovery MI PET/CT system using the national electrical manufacturers association NU 2-2012 Standard. Med. Phys. 2019, 46, 3025–3033. [Google Scholar] [CrossRef]
- Reynés-Llompart, G.; Gámez-Cenzano, C.; Romero-Zayas, I.; Rodríguez-Bel, L.; Vercher-Conejero, J.L.; Martí-Climent, J.M. Performance Characteristics of the Whole-Body Discovery IQ PET/CT System. J. Nucl. Med. 2017, 58, 1155–1161. [Google Scholar] [CrossRef]
- Van Sluis, J.; de Jong, J.; Schaar, J.; Noordzij, W.; van Snick, P.; Dierckx, R.; Borra, R.; Willemsen, A.; Boellaard, R. Performance Characteristics of the Digital Biograph Vision PET/CT System. J. Nucl. Med. 2019, 60, 1031–1036. [Google Scholar] [CrossRef]
- Rausch, I.; Cal-González, J.; Dapra, D.; Gallowitsch, H.J.; Lind, P.; Beyer, T.; Minear, G. Performance evaluation of the Biograph mCT Flow PET/CT system according to the NEMA NU2-2012 standard. EJNMMI Phys. 2015, 2, 26. [Google Scholar] [CrossRef]
- Conti, M. Focus on time-of-flight PET: The benefits of improved time resolution. Eur. J. Nucl. Med. Mol. Imaging 2011, 38, 1147–1157. [Google Scholar] [CrossRef]
- Bailey, D.; Meikle, S.; Jones, T. Effective sensitivity in 3D PET: The impact of detector dead time on 3D system performance. IEEE Trans. Nucl. Sci. 1997, 44, 1180–1185. [Google Scholar] [CrossRef]
- Cherry, S.R.; Jones, T.; Karp, J.S.; Qi, J.; Moses, W.W.; Badawi, R.D. Total-Body PET: Maximizing Sensitivity to Create New Opportunities for Clinical Research and Patient Care. J. Nucl. Med. 2018, 59, 3–12. [Google Scholar] [CrossRef] [PubMed]
- Rausch, I.; Ruiz, A.; Valverde-Pascual, I.; Cal-González, J.; Beyer, T.; Carrio, I. Performance Evaluation of the Vereos PET/CT System According to the NEMA NU2-2012 Standard. J. Nucl. Med. 2019, 60, 561–567. [Google Scholar] [CrossRef] [PubMed]
- Fuentes-Ocampo, F.; López-Mora, D.A.; Flotats, A.; Paillahueque, G.; Camacho, V.; Duch, J.; Fernández, A.; Domènech, A.; Estorch, M.; Carrió, I. Digital vs. analog PET/CT: Intra-subject comparison of the SUVmax in target lesions and reference regions. Eur. J. Nucl. Med. Mol. Imaging 2019, 46, 1745–1750. [Google Scholar] [CrossRef] [PubMed]
- Hsu, D.F.C.; Ilan, E.; Peterson, W.T.; Uribe, J.; Lubberink, M.; Levin, C.S. Studies of a Next-Generation Silicon-Photomultiplier-Based Time-of-Flight PET/CT System. J. Nucl. Med. 2017, 58, 1511–1518. [Google Scholar] [CrossRef] [PubMed]
- Zhang, J.; Maniawski, P.; Knopp, M.V. Performance evaluation of the next generation solid-state digital photon counting PET/CT system. EJNMMI Res. 2018, 8, 97. [Google Scholar] [CrossRef]
- Oddstig, J.; Brolin, G.; Trägårdh, E.; Minarik, D. Head-to-head comparison of a Si-photomultiplier-based and a conventional photomultiplier-based PET-CT system. EJNMMI Phys. 2021, 8, 19. [Google Scholar] [CrossRef]
- Kinahan, P.E.; Townsend, D.W.; Beyer, T.; Sashin, D. Attenuation correction for a combined 3D PET/CT scanner. Med. Phys. 1998, 25, 2046–2053. [Google Scholar] [CrossRef]
- Boellaard, R.; Rausch, I.; Beyer, T.; Delso, G.; Yaqub, M.; Quick, H.H.; Sattler, B. Quality control for quantitative multicenter whole-body PET/MR studies: A NEMA image quality phantom study with three current PET/MR systems. Med. Phys. 2015, 42, 5961–5969. [Google Scholar] [CrossRef]
- Mackewn, J.E.; Stirling, J.; Jeljeli, S.; Gould, S.M.; Johnstone, R.I.; Merida, I.; Pike, L.C.; McGinnity, C.J.; Beck, K.; Howes, O.; et al. Practical issues and limitations of brain attenuation correction on a simultaneous PET-MR scanner. EJNMMI Phys. 2020, 7, 24. [Google Scholar] [CrossRef]
- Schäfer, J.F.; Gatidis, S.; Schmidt, H.; Gückel, B.; Bezrukov, I.; Pfannenberg, C.A.; Reimold, M.; Ebinger, M.; Fuchs, J.; Claussen, C.D.; et al. Simultaneous whole-body PET/MR imaging in comparison to PET/CT in pediatric oncology: Initial results. Radiology 2014, 273, 220–231. [Google Scholar] [CrossRef]
- Beyer, T.; Lassen, M.L.; Boellaard, R.; Delso, G.; Yaqub, M.; Sattler, B.; Quick, H.H. Investigating the state-of-the-art in whole-body MR-based attenuation correction: An intra-individual, inter-system, inventory study on three clinical PET/MR systems. Magma 2016, 29, 75–87. [Google Scholar] [CrossRef]
- Samarin, A.; Burger, C.; Wollenweber, S.D.; Crook, D.W.; Burger, I.A.; Schmid, D.T.; von Schulthess, G.K.; Kuhn, F.P. PET/MR imaging of bone lesions—Implications for PET quantification from imperfect attenuation correction. Eur. J. Nucl. Med. Mol. Imaging 2012, 39, 1154–1160. [Google Scholar] [CrossRef] [PubMed]
- Ziegler, S.; Braun, H.; Ritt, P.; Hocke, C.; Kuwert, T.; Quick, H.H. Systematic evaluation of phantom fluids for simultaneous PET/MR hybrid imaging. J. Nucl. Med. 2013, 54, 1464–1471. [Google Scholar] [CrossRef] [PubMed]
- Rausch, I.; Valladares, A.; Sundar, L.K.S.; Beyer, T.; Hacker, M.; Meyerspeer, M.; Unger, E. Standard MRI-based attenuation correction for PET/MRI phantoms: A novel concept using MRI-visible polymer. EJNMMI Phys. 2021, 8, 18. [Google Scholar] [CrossRef]
- Heusch, P.; Buchbender, C.; Beiderwellen, K.; Nensa, F.; Hartung-Knemeyer, V.; Lauenstein, T.C.; Bockisch, A.; Forsting, M.; Antoch, G.; Heusner, T.A. Standardized uptake values for [¹⁸F] FDG in normal organ tissues: Comparison of whole-body PET/CT and PET/MRI. Eur. J. Radiol. 2013, 82, 870–876. [Google Scholar] [CrossRef] [PubMed]
- Al-Nabhani, K.Z.; Syed, R.; Michopoulou, S.; Alkalbani, J.; Afaq, A.; Panagiotidis, E.; O’Meara, C.; Groves, A.; Ell, P.; Bomanji, J. Qualitative and quantitative comparison of PET/CT and PET/MR imaging in clinical practice. J. Nucl. Med. 2014, 55, 88–94. [Google Scholar] [CrossRef]
- Kaalep, A.; Sera, T.; Oyen, W.; Krause, B.J.; Chiti, A.; Liu, Y.; Boellaard, R. EANM/EARL FDG-PET/CT accreditation - Summary results from the first 200 accredited imaging systems. Eur. J. Nucl. Med. Mol. Imaging 2018, 45, 412–422. [Google Scholar] [CrossRef]
- Sokoloff, L.; Reivich, M.; Kennedy, C.; Des Rosiers, M.H.; Patlak, C.S.; Pettigrew, K.D.; Sakurada, O.; Shinohara, M. The [14C]deoxyglucose method for the measurement of local cerebral glucose utilization: Theory, procedure, and normal values in the conscious and anesthetized albino rat. J. Neurochem. 1977, 28, 897–916. [Google Scholar] [CrossRef]
- van den Hoff, J.; Oehme, L.; Schramm, G.; Maus, J.; Lougovski, A.; Petr, J.; Beuthien-Baumann, B.; Hofheinz, F. The PET-derived tumor-to-blood standard uptake ratio (SUR) is superior to tumor SUV as a surrogate parameter of the metabolic rate of FDG. EJNMMI Res. 2013, 3, 77. [Google Scholar] [CrossRef]
- Kramer, G.M.; Frings, V.; Hoetjes, N.; Hoekstra, O.S.; Smit, E.F.; de Langen, A.J.; Boellaard, R. Repeatability of Quantitative Whole-Body 18F-FDG PET/CT Uptake Measures as Function of Uptake Interval and Lesion Selection in Non-Small Cell Lung Cancer Patients. J. Nucl. Med. 2016, 57, 1343–1349. [Google Scholar] [CrossRef]
- van den Hoff, J.; Lougovski, A.; Schramm, G.; Maus, J.; Oehme, L.; Petr, J.; Beuthien-Baumann, B.; Kotzerke, J.; Hofheinz, F. Correction of scan time dependence of standard uptake values in oncological PET. EJNMMI Res. 2014, 4, 18. [Google Scholar] [CrossRef]
- Wang, R.; Chen, H.; Fan, C. Impacts of time interval on 18F-FDG uptake for PET/CT in normal organs: A systematic review. Medicine 2018, 97, e13122. [Google Scholar] [CrossRef]
- Chin, B.B.; Green, E.D.; Turkington, T.G.; Hawk, T.C.; Coleman, R.E. Increasing uptake time in FDG-PET: Standardized uptake values in normal tissues at 1 versus 3 h. Mol. Imaging Biol. 2009, 11, 118–122. [Google Scholar] [CrossRef]
- Ringheim, A.; Campos Neto, G.C.; Anazodo, U.; Cui, L.; da Cunha, M.L.; Vitor, T.; Martins, K.M.; Miranda, A.C.C.; de Barboza, M.F.; Fuscaldi, L.L.; et al. Kinetic modeling of 68Ga-PSMA-11 and validation of simplified methods for quantification in primary prostate cancer patients. EJNMMI Res. 2020, 10, 12. [Google Scholar] [CrossRef]
- Ilan, E.; Sandström, M.; Velikyan, I.; Sundin, A.; Eriksson, B.; Lubberink, M. Parametric Net Influx Rate Images of 68Ga-DOTATOC and 68Ga-DOTATATE: Quantitative Accuracy and Improved Image Contrast. J. Nucl. Med. 2017, 58, 744–749. [Google Scholar] [CrossRef] [PubMed][Green Version]
- Trägårdh, E.; Minarik, D.; Almquist, H.; Bitzén, U.; Garpered, S.; Hvittfelt, E.; Olsson, B.; Oddstig, J. Impact of acquisition time and penalizing factor in a block-sequential regularized expectation maximization reconstruction algorithm on a Si-photomultiplier-based PET-CT system for 18F-FDG. EJNMMI Res. 2019, 9, 64. [Google Scholar] [CrossRef] [PubMed]
- Masuda, Y.; Kondo, C.; Matsuo, Y.; Uetani, M.; Kusakabe, K. Comparison of imaging protocols for 18F-FDG PET/CT in overweight patients: Optimizing scan duration versus administered dose. J. Nucl. Med. 2009, 50, 844–848. [Google Scholar] [CrossRef]
- Pilz, J.; Hehenwarter, L.; Zimmermann, G.; Rendl, G.; Schweighofer-Zwink, G.; Beheshti, M.; Pirich, C. Feasibility of equivalent performance of 3D TOF [18F]-FDG PET/CT with reduced acquisition time using clinical and semiquantitative parameters. EJNMMI Res. 2021, 11, 44. [Google Scholar] [CrossRef] [PubMed]
- Alberts, I.; Sachpekidis, C.; Prenosil, G.; Viscione, M.; Bohn, K.P.; Mingels, C.; Shi, K.; Ashar-Oromieh, A.; Rominger, A. Digital PET/CT allows for shorter acquisition protocols or reduced radiopharmaceutical dose in [18F]-FDG PET/CT. Ann. Nucl. Med. 2021, 35, 485–492. [Google Scholar] [CrossRef] [PubMed]
- Sher, A.; Lacoeuille, F.; Fosse, P.; Vervueren, L.; Cahouet-Vannier, A.; Dabli, D.; Bouchet, F.; Couturier, O. For avid glucose tumors, the SUV peak is the most reliable parameter for [18F]FDG-PET/CT quantification, regardless of acquisition time. EJNMMI Res. 2016, 6, 21. [Google Scholar] [CrossRef] [PubMed]
- Sonni, I.; Baratto, L.; Park, S.; Hatami, N.; Srinivas, S.; Davidzon, G.; Gambhir, S.S.; Iagaru, A. Initial experience with a SiPM-based PET/CT scanner: Influence of acquisition time on image quality. EJNMMI Phys. 2018, 5, 9. [Google Scholar] [CrossRef] [PubMed]
- Hausmann, D.; Dinter, D.J.; Sadick, M.; Brade, J.; Schoenberg, S.O.; Büsing, K. The impact of acquisition time on image quality in whole-body 18F-FDG PET/CT for cancer staging. J. Nucl. Med. Technol. 2012, 40, 255–258. [Google Scholar] [CrossRef]
- Werner, M.K.; Parker, J.A.; Kolodny, G.M.; English, J.R.; Palmer, M.R. Respiratory gating enhances imaging of pulmonary nodules and measurement of tracer uptake in FDG PET/CT. AJR Am. J. Roentgenol. 2009, 193, 1640–1645. [Google Scholar] [CrossRef]
- Frood, R.; Prestwich, R.; Tsoumpas, C.; Murray, P.; Franks, K.; Scarsbrook, A. Effectiveness of Respiratory-gated Positron Emission Tomography/Computed Tomography for Radiotherapy Planning in Patients with Lung Carcinoma—A Systematic Review. Clin. Oncol. R. Coll. Radiol. 2018, 30, 225–232. [Google Scholar] [CrossRef] [PubMed]
- Grootjans, W.; de Geus-Oei, L.F.; Meeuwis, A.P.; van der Vos, C.S.; Gotthardt, M.; Oyen, W.J.; Visser, E.P. Amplitude-based optimal respiratory gating in positron emission tomography in patients with primary lung cancer. Eur. Radiol. 2014, 24, 3242–3250. [Google Scholar] [CrossRef]
- Suenaga, Y.; Kitajima, K.; Aoki, H.; Okunaga, T.; Kono, A.; Matsumoto, I.; Fukumoto, T.; Tanaka, K.; Sugimura, K. Respiratory-gated ¹⁸F-FDG PET/CT for the diagnosis of liver metastasis. Eur. J. Radiol. 2013, 82, 1696–1701. [Google Scholar] [CrossRef] [PubMed]
- Schulz, A.; Godt, J.C.; Dormagen, J.B.; Holtedahl, J.E.; Bogsrud, T.V.; Labori, K.J.; Kløw, N.E.; Bach-Gansmo, T. Respiratory gated PET/CT of the liver: A novel method and its impact on the detection of colorectal liver metastases. Eur. J. Radiol. 2015, 84, 1424–1431. [Google Scholar] [CrossRef]
- Smeets, E.M.M.; Withaar, D.S.; Grootjans, W.; Hermans, J.J.; van Laarhoven, K.; de Geus-Oei, L.F.; Gotthardt, M.; Aarntzen, E. Optimal respiratory-gated [18F]FDG PET/CT significantly impacts the quantification of metabolic parameters and their correlation with overall survival in patients with pancreatic ductal adenocarcinoma. EJNMMI Res. 2019, 9, 24. [Google Scholar] [CrossRef]
- Pépin, A.; Daouk, J.; Bailly, P.; Hapdey, S.; Meyer, M.E. Management of respiratory motion in PET/computed tomography: The state of the art. Nucl. Med. Commun. 2014, 35, 113–122. [Google Scholar] [CrossRef]
- Lassen, M.L.; Kwiecinski, J.; Slomka, P.J. Gating Approaches in Cardiac PET Imaging. PET Clin. 2019, 14, 271–279. [Google Scholar] [CrossRef]
- Rubeaux, M.; Doris, M.K.; Alessio, A.; Slomka, P.J. Enhancing Cardiac PET by Motion Correction Techniques. Curr. Cardiol. Rep. 2017, 19, 14. [Google Scholar] [CrossRef]
- Rogasch, J.M.M.; Boellaard, R.; Pike, L.; Borchmann, P.; Johnson, P.; Wolf, J.; Barrington, S.F.; Kobe, C. Moving the goalposts while scoring―the dilemma posed by new PET technologies. Eur. J. Nucl. Med. Mol. Imaging 2021, 48, 2696–2710. [Google Scholar] [CrossRef]
- Aide, N.; Lasnon, C.; Kesner, A.; Levin, C.S.; Buvat, I.; Iagaru, A.; Hermann, K.; Badawi, R.D.; Cherry, S.R.; Bradley, K.M.; et al. New PET technologies—Embracing progress and pushing the limits. Eur. J. Nucl. Med. Mol. Imaging 2021, 48, 2711–2726. [Google Scholar] [CrossRef]
- Surti, S. Update on time-of-flight PET imaging. J. Nucl. Med. 2015, 56, 98–105. [Google Scholar] [CrossRef]
- Rogasch, J.M.; Steffen, I.G.; Hofheinz, F.; Großer, O.S.; Furth, C.; Mohnike, K.; Hass, P.; Walke, M.; Apostolova, I.; Amthauer, H. The association of tumor-to-background ratios and SUVmax deviations related to point spread function and time-of-flight F18-FDG-PET/CT reconstruction in colorectal liver metastases. EJNMMI Res. 2015, 5, 31. [Google Scholar] [CrossRef] [PubMed]
- Li, C.Y.; Klohr, S.; Sadick, H.; Weiss, C.; Hoermann, K.; Schoenberg, S.O.; Sadick, M. Effect of time-of-flight technique on the diagnostic performance of 18F-FDG PET/CT for assessment of lymph node metastases in head and neck squamous cell carcinoma. J. Nucl. Med. Technol. 2014, 42, 181–187. [Google Scholar] [CrossRef][Green Version]
- Rogasch, J.M.; Hofheinz, F.; Lougovski, A.; Furth, C.; Ruf, J.; Großer, O.S.; Mohnike, K.; Hass, P.; Walke, M.; Amthauer, H.; et al. The influence of different signal-to-background ratios on spatial resolution and F18-FDG-PET quantification using point spread function and time-of-flight reconstruction. EJNMMI Phys. 2014, 1, 12. [Google Scholar] [CrossRef]
- Rapisarda, E.; Bettinardi, V.; Thielemans, K.; Gilardi, M.C. Image-based point spread function implementation in a fully 3D OSEM reconstruction algorithm for PET. Phys. Med. Biol. 2010, 55, 4131–4151. [Google Scholar] [CrossRef] [PubMed]
- Akamatsu, G.; Mitsumoto, K.; Taniguchi, T.; Tsutsui, Y.; Baba, S.; Sasaki, M. Influences of point-spread function and time-of-flight reconstructions on standardized uptake value of lymph node metastases in FDG-PET. Eur. J. Radiol. 2014, 83, 226–230. [Google Scholar] [CrossRef]
- Quak, E.; Le Roux, P.Y.; Hofman, M.S.; Robin, P.; Bourhis, D.; Callahan, J.; Binns, D.; Desmonts, C.; Salaun, P.Y.; Hicks, R.J.; et al. Harmonizing FDG PET quantification while maintaining optimal lesion detection: Prospective multicentre validation in 517 oncology patients. Eur. J. Nucl. Med. Mol. Imaging 2015, 42, 2072–2082. [Google Scholar] [CrossRef] [PubMed]
- Kaalep, A.; Sera, T.; Rijnsdorp, S.; Yaqub, M.; Talsma, A.; Lodge, M.A.; Boellaard, R. Feasibility of state of the art PET/CT systems performance harmonisation. Eur. J. Nucl. Med. Mol. Imaging 2018, 45, 1344–1361. [Google Scholar] [CrossRef] [PubMed]
- Kaalep, A.; Burggraaff, C.N.; Pieplenbosch, S.; Verwer, E.E.; Sera, T.; Zijlstra, J.; Hoekstra, O.S.; Oprea-Lager, D.E.; Boellaard, R. Quantitative implications of the updated EARL 2019 PET-CT performance standards. EJNMMI Phys. 2019, 6, 28. [Google Scholar] [CrossRef] [PubMed]
- Houdu, B.; Lasnon, C.; Licaj, I.; Thomas, G.; Do, P.; Guizard, A.V.; Desmonts, C.; Aide, N. Why harmonization is needed when using FDG PET/CT as a prognosticator: Demonstration with EARL-compliant SUV as an independent prognostic factor in lung cancer. Eur. J. Nucl. Med. Mol. Imaging 2019, 46, 421–428. [Google Scholar] [CrossRef] [PubMed]
- Mumcuoğlu, E.U.; Leahy, R.M.; Cherry, S.R. Bayesian reconstruction of PET images: Methodology and performance analysis. Phys. Med. Biol. 1996, 41, 1777–1807. [Google Scholar] [CrossRef]
- Ahn, S.; Ross, S.G.; Asma, E.; Miao, J.; Jin, X.; Cheng, L.; Wollenweber, S.D.; Manjeshwar, R.M. Quantitative comparison of OSEM and penalized likelihood image reconstruction using relative difference penalties for clinical PET. Phys. Med. Biol. 2015, 60, 5733–5751. [Google Scholar] [CrossRef]
- Ahn, S.; Fessler, J.A. Globally convergent image reconstruction for emission tomography using relaxed ordered subsets algorithms. IEEE Trans. Med. Imaging 2003, 22, 613–626. [Google Scholar] [CrossRef]
- Teoh, E.J.; McGowan, D.R.; Macpherson, R.E.; Bradley, K.M.; Gleeson, F.V. Phantom and Clinical Evaluation of the Bayesian Penalized Likelihood Reconstruction Algorithm Q.Clear on an LYSO PET/CT System. J. Nucl. Med. 2015, 56, 1447–1452. [Google Scholar] [CrossRef]
- Lindström, E.; Sundin, A.; Trampal, C.; Lindsjö, L.; Ilan, E.; Danfors, T.; Antoni, G.; Sörensen, J.; Lubberink, M. Evaluation of Penalized-Likelihood Estimation Reconstruction on a Digital Time-of-Flight PET/CT Scanner for 18F-FDG Whole-Body Examinations. J. Nucl. Med. 2018, 59, 1152–1158. [Google Scholar] [CrossRef]
- Te Riet, J.; Rijnsdorp, S.; Roef, M.J.; Arends, A.J. Evaluation of a Bayesian penalized likelihood reconstruction algorithm for low-count clinical 18F-FDG PET/CT. EJNMMI Phys. 2019, 6, 32. [Google Scholar] [CrossRef]
- Wu, Z.; Qin, Z.; Huang, B.; Guo, B.; Hao, X.; Wu, P.; Zhao, B.; Xie, J.; Li, S. Improved Absolute Quantification using Bayesian Penalized Likelihood Reconstruction on a Digital PET/CT—Towards True Uptake Measurement. Res. Sq. 2021. [Google Scholar] [CrossRef]
- Howard, B.A.; Morgan, R.; Thorpe, M.P.; Turkington, T.G.; Oldan, J.; James, O.G.; Borges-Neto, S. Comparison of Bayesian penalized likelihood reconstruction versus OS-EM for characterization of small pulmonary nodules in oncologic PET/CT. Ann. Nucl. Med. 2017, 31, 623–628. [Google Scholar] [CrossRef]
- Messerli, M.; Stolzmann, P.; Egger-Sigg, M.; Trinckauf, J.; D’Aguanno, S.; Burger, I.A.; von Schulthess, G.K.; Kaufmann, P.A.; Huellner, M.W. Impact of a Bayesian penalized likelihood reconstruction algorithm on image quality in novel digital PET/CT: Clinical implications for the assessment of lung tumors. EJNMMI Phys. 2018, 5, 27. [Google Scholar] [CrossRef] [PubMed]
- Otani, T.; Hosono, M.; Kanagaki, M.; Onishi, Y.; Matsubara, N.; Kawabata, K.; Kimura, H. Evaluation and Optimization of a New PET Reconstruction Algorithm, Bayesian Penalized Likelihood Reconstruction, for Lung Cancer Assessment According to Lesion Size. AJR Am. J. Roentgenol. 2019, 213, W50–W56. [Google Scholar] [CrossRef] [PubMed]
- Reader, A.J.; Corda, G.; Mehranian, A.; Costa-Luis, C.d.; Ellis, S.; Schnabel, J.A. Deep Learning for PET Image Reconstruction. IEEE Trans. Radiat. Plasma Med. Sci. 2021, 5, 1–25. [Google Scholar] [CrossRef]
- Aschoff, P.; Plathow, C.; Beyer, T.; Lichy, M.P.; Erb, G.; Öksüz, M.; Claussen, C.D.; Pfannenberg, C. Multiphase contrast-enhanced CT with highly concentrated contrast agent can be used for PET attenuation correction in integrated PET/CT imaging. Eur. J. Nucl. Med. Mol. Imaging 2012, 39, 316–325. [Google Scholar] [CrossRef] [PubMed]
- Behrendt, F.F.; Temur, Y.; Verburg, F.A.; Palmowski, M.; Krohn, T.; Pietsch, H.; Kuhl, C.K.; Mottaghy, F.M. PET/CT in lung cancer: Influence of contrast medium on quantitative and clinical assessment. Eur. Radiol. 2012, 22, 2458–2464. [Google Scholar] [CrossRef]
- Yau, Y.Y.; Chan, W.S.; Tam, Y.M.; Vernon, P.; Wong, S.; Coel, M.; Chu, S.K. Application of intravenous contrast in PET/CT: Does it really introduce significant attenuation correction error? J. Nucl. Med. 2005, 46, 283–291. [Google Scholar]
- Rebière, M.; Verburg, F.A.; Palmowski, M.; Krohn, T.; Pietsch, H.; Kuhl, C.K.; Mottaghy, F.M.; Behrendt, F.F. Multiphase CT scanning and different intravenous contrast media concentrations in combined F-18-FDG PET/CT: Effect on quantitative and clinical assessment. Eur. J. Radiol. 2012, 81, e862–e869. [Google Scholar] [CrossRef]
- Berthelsen, A.K.; Holm, S.; Loft, A.; Klausen, T.L.; Andersen, F.; Højgaard, L. PET/CT with intravenous contrast can be used for PET attenuation correction in cancer patients. Eur. J. Nucl. Med. Mol. Imaging 2005, 32, 1167–1175. [Google Scholar] [CrossRef]
- Nakamoto, Y.; Chin, B.B.; Kraitchman, D.L.; Lawler, L.P.; Marshall, L.T.; Wahl, R.L. Effects of nonionic intravenous contrast agents at PET/CT imaging: Phantom and canine studies. Radiology 2003, 227, 817–824. [Google Scholar] [CrossRef]
- Voltin, C.A.; Mettler, J.; Boellaard, R.; Kuhnert, G.; Dietlein, M.; Borchmann, P.; Drzezga, A.; Kobe, C. Quantitative assessment of 18F-FDG PET in patients with Hodgkin lymphoma: Is it significantly affected by contrast-enhanced computed tomography attenuation correction? Nucl. Med. Commun. 2019, 40, 249–257. [Google Scholar] [CrossRef] [PubMed]
- Berger, K.L.; Nicholson, S.A.; Dehdashti, F.; Siegel, B.A. FDG PET evaluation of mucinous neoplasms: Correlation of FDG uptake with histopathologic features. AJR Am. J. Roentgenol. 2000, 174, 1005–1008. [Google Scholar] [CrossRef] [PubMed]
- Kang, D.E.; White, R.L., Jr.; Zuger, J.H.; Sasser, H.C.; Teigland, C.M. Clinical use of fluorodeoxyglucose F 18 positron emission tomography for detection of renal cell carcinoma. J. Urol. 2004, 171, 1806–1809. [Google Scholar] [CrossRef] [PubMed]
- Vesselle, H.; Salskov, A.; Turcotte, E.; Wiens, L.; Schmidt, R.; Jordan, C.D.; Vallières, E.; Wood, D.E. Relationship between non-small cell lung cancer FDG uptake at PET, tumor histology, and Ki-67 proliferation index. J. Thorac. Oncol. 2008, 3, 971–978. [Google Scholar] [CrossRef]
- Ioannidis, J.P.; Lau, J. 18F-FDG PET for the diagnosis and grading of soft-tissue sarcoma: A meta-analysis. J. Nucl. Med. 2003, 44, 717–724. [Google Scholar]
- Liu, I.J.; Zafar, M.B.; Lai, Y.H.; Segall, G.M.; Terris, M.K. Fluorodeoxyglucose positron emission tomography studies in diagnosis and staging of clinically organ-confined prostate cancer. Urology 2001, 57, 108–111. [Google Scholar] [CrossRef]
- Hofman, M.S.; Lawrentschuk, N.; Francis, R.J.; Tang, C.; Vela, I.; Thomas, P.; Rutherford, N.; Martin, J.M.; Frydenberg, M.; Shakher, R.; et al. Prostate-specific membrane antigen PET-CT in patients with high-risk prostate cancer before curative-intent surgery or radiotherapy (proPSMA): A prospective, randomised, multicentre study. Lancet 2020, 395, 1208–1216. [Google Scholar] [CrossRef]
- Naswa, N.; Sharma, P.; Gupta, S.K.; Karunanithi, S.; Reddy, R.M.; Patnecha, M.; Lata, S.; Kumar, R.; Malhotra, A.; Bal, C. Dual tracer functional imaging of gastroenteropancreatic neuroendocrine tumors using 68Ga-DOTA-NOC PET-CT and 18F-FDG PET-CT: Competitive or complimentary? Clin. Nucl. Med. 2014, 39, e27–e34. [Google Scholar] [CrossRef]
- Dunet, V.; Pomoni, A.; Hottinger, A.; Nicod-Lalonde, M.; Prior, J.O. Performance of 18F-FET versus 18F-FDG-PET for the diagnosis and grading of brain tumors: Systematic review and meta-analysis. Neuro-Oncology 2016, 18, 426–434. [Google Scholar] [CrossRef]
- Chen, H.; Pang, Y.; Wu, J.; Zhao, L.; Hao, B.; Wu, J.; Wei, J.; Wu, S.; Zhao, L.; Luo, Z.; et al. Comparison of [68Ga]Ga-DOTA-FAPI-04 and [18F] FDG PET/CT for the diagnosis of primary and metastatic lesions in patients with various types of cancer. Eur. J. Nucl. Med. Mol. Imaging 2020, 47, 1820–1832. [Google Scholar] [CrossRef]
- Fendler, W.P.; Calais, J.; Eiber, M.; Simko, J.P.; Kurhanewicz, J.; Santos, R.D.; Feng, F.Y.; Reiter, R.E.; Rettig, M.B.; Nickols, N.G.; et al. False positive PSMA PET for tumor remnants in the irradiated prostate and other interpretation pitfalls in a prospective multi-center trial. Eur. J. Nucl. Med. Mol. Imaging 2021, 48, 501–508. [Google Scholar] [CrossRef] [PubMed]
- Barbosa, F.; Queiroz, M.; Nunes, R.; Costa, L.; Zaniboni, E.; Marin, J.; Cerri, G.; Buchpiguel, C. Nonprostatic diseases on PSMA PET imaging: A spectrum of benign and malignant findings. Cancer Imaging 2020, 20, 23. [Google Scholar] [CrossRef] [PubMed]
- Hofman, M.S.; Lau, W.F.; Hicks, R.J. Somatostatin receptor imaging with 68Ga DOTATATE PET/CT: Clinical utility, normal patterns, pearls, and pitfalls in interpretation. Radiographics 2015, 35, 500–516. [Google Scholar] [CrossRef] [PubMed]
- Zheng, S.; Lin, R.; Chen, S.; Zheng, J.; Lin, Z.; Zhang, Y.; Xue, Q.; Chen, Y.; Zhang, J.; Lin, K.; et al. Characterization of the benign lesions with increased 68Ga-FAPI-04 uptake in PET/CT. Ann. Nucl. Med. 2021, 35, 1312–1320. [Google Scholar] [CrossRef] [PubMed]
- Atterton-Evans, V.; Turner, J.; Vivanti, A.; Robertson, T. Variances of dietary preparation for suppression of physiological 18F-FDG myocardial uptake in the presence of cardiac sarcoidosis: A systematic review. J. Nucl. Cardiol. Off. Publ. Am. Soc. Nucl. Cardiol. 2020, 27, 481–489. [Google Scholar] [CrossRef] [PubMed]
- Rouzet, F.; Chequer, R.; Benali, K.; Lepage, L.; Ghodbane, W.; Duval, X.; Iung, B.; Vahanian, A.; Le Guludec, D.; Hyafil, F. Respective performance of 18F-FDG PET and radiolabeled leukocyte scintigraphy for the diagnosis of prosthetic valve endocarditis. J. Nucl. Med. 2014, 55, 1980–1985. [Google Scholar] [CrossRef] [PubMed]
- Scholtens, A.M.; Swart, L.E.; Verberne, H.J.; Tanis, W.; Lam, M.G.; Budde, R.P. Confounders in FDG-PET/CT Imaging of Suspected Prosthetic Valve Endocarditis. JACC Cardiovasc. Imaging 2016, 9, 1462–1465. [Google Scholar] [CrossRef]
- Mathieu, C.; Mikaïl, N.; Benali, K.; Iung, B.; Duval, X.; Nataf, P.; Jondeau, G.; Hyafil, F.; Le Guludec, D.; Rouzet, F. Characterization of 18F-Fluorodeoxyglucose Uptake Pattern in Noninfected Prosthetic Heart Valves. Circ. Cardiovasc. Imaging 2017, 10, e005585. [Google Scholar] [CrossRef]
- Sohns, J.M.; Bavendiek, U.; Ross, T.L.; Bengel, F.M. Targeting Cardiovascular Implant Infection: Multimodality and Molecular Imaging. Circ. Cardiovasc. Imaging 2017, 10, e005376. [Google Scholar] [CrossRef]
- Thackeray, J.T.; Derlin, T.; Haghikia, A.; Napp, L.C.; Wang, Y.; Ross, T.L.; Schäfer, A.; Tillmanns, J.; Wester, H.J.; Wollert, K.C.; et al. Molecular Imaging of the Chemokine Receptor CXCR4 After Acute Myocardial Infarction. JACC Cardiovasc. Imaging 2015, 8, 1417–1426. [Google Scholar] [CrossRef]
- Takemiya, K.; Ning, X.; Seo, W.; Wang, X.; Mohammad, R.; Joseph, G.; Titterington, J.S.; Kraft, C.S.; Nye, J.A.; Murthy, N.; et al. Novel PET and Near Infrared Imaging Probes for the Specific Detection of Bacterial Infections Associated with Cardiac Devices. JACC Cardiovasc. Imaging 2019, 12, 875–886. [Google Scholar] [CrossRef] [PubMed]
- Fin, L.; Bailly, P.; Daouk, J.; Meyer, M.E. A practical way to improve contrast-to-noise ratio and quantitation for statistical-based iterative reconstruction in whole-body PET imaging. Med. Phys. 2009, 36, 3072–3079. [Google Scholar] [CrossRef] [PubMed]
- Trägårdh, E.; Minarik, D.; Brolin, G.; Bitzén, U.; Olsson, B.; Oddstig, J. Optimization of [18F]PSMA-1007 PET-CT using regularized reconstruction in patients with prostate cancer. EJNMMI Phys. 2020, 7, 31. [Google Scholar] [CrossRef] [PubMed]
- Geismar, J.H.; Stolzmann, P.; Sah, B.R.; Burger, I.A.; Seifert, B.; Delso, G.; von Schulthess, G.K.; Veit-Haibach, P.; Husmann, L. Intra-individual comparison of PET/CT with different body weight-adapted FDG dosage regimens. Acta Radiol. Open 2015, 4, 2047981614560076. [Google Scholar] [CrossRef] [PubMed]
- EANM Research Ltd. (EARL) Publications and Guidelines. Available online: https://earl.eanm.org/guidelines-and-publications/ (accessed on 11 August 2021).
- Teräs, M.; Tolvanen, T.; Johansson, J.J.; Williams, J.J.; Knuuti, J. Performance of the new generation of whole-body PET/CT scanners: Discovery STE and Discovery VCT. Eur. J. Nucl. Med. Mol. Imaging 2007, 34, 1683–1692. [Google Scholar] [CrossRef]
- Wickham, F.; McMeekin, H.; Burniston, M.; McCool, D.; Pencharz, D.; Skillen, A.; Wagner, T. Patient-specific optimisation of administered activity and acquisition times for 18F-FDG PET imaging. EJNMMI Res. 2017, 7, 3. [Google Scholar] [CrossRef]
- Jakoby, B.W.; Bercier, Y.; Conti, M.; Casey, M.E.; Bendriem, B.; Townsend, D.W. Physical and clinical performance of the mCT time-of-flight PET/CT scanner. Phys. Med. Biol. 2011, 56, 2375–2389. [Google Scholar] [CrossRef]
- Prenosil, G.A.; Sari, H.; Fürstner, M.; Afshar-Oromieh, A.; Shi, K.; Rominger, A.; Hentschel, M. Performance Characteristics of the Biograph Vision Quadra PET/CT system with long axial field of view using the NEMA NU 2-2018 Standard. J. Nucl. Med. 2021. [Google Scholar] [CrossRef]
- Spencer, B.A.; Berg, E.; Schmall, J.P.; Omidvari, N.; Leung, E.K.; Abdelhafez, Y.G.; Tang, S.; Deng, Z.; Dong, Y.; Lv, Y.; et al. Performance Evaluation of the uEXPLORER Total-Body PET/CT Scanner Based on NEMA NU 2-2018 with Additional Tests to Characterize PET Scanners with a Long Axial Field of View. J. Nucl. Med. 2021, 62, 861–870. [Google Scholar] [CrossRef]
- Halpern, B.S.; Dahlbom, M.; Quon, A.; Schiepers, C.; Waldherr, C.; Silverman, D.H.; Ratib, O.; Czernin, J. Impact of patient weight and emission scan duration on PET/CT image quality and lesion detectability. J. Nucl. Med. 2004, 45, 797–801. [Google Scholar]
- Halpern, B.S.; Dahlbom, M.; Auerbach, M.A.; Schiepers, C.; Fueger, B.J.; Weber, W.A.; Silverman, D.H.; Ratib, O.; Czernin, J. Optimizing imaging protocols for overweight and obese patients: A lutetium orthosilicate PET/CT study. J. Nucl. Med. 2005, 46, 603–607. [Google Scholar] [PubMed]
- Sekine, T.; Delso, G.; Zeimpekis, K.G.; de Galiza Barbosa, F.; ter Voert, E.E.G.W.; Huellner, M.; Veit-Haibach, P. Reduction of 18F-FDG Dose in Clinical PET/MR Imaging by Using Silicon Photomultiplier Detectors. Radiology 2017, 286, 249–259. [Google Scholar] [CrossRef] [PubMed]
- López-Mora, D.A.; Flotats, A.; Fuentes-Ocampo, F.; Camacho, V.; Fernández, A.; Ruiz, A.; Duch, J.; Sizova, M.; Domènech, A.; Estorch, M.; et al. Comparison of image quality and lesion detection between digital and analog PET/CT. Eur. J. Nucl. Med. Mol. Imaging 2019, 46, 1383–1390. [Google Scholar] [CrossRef] [PubMed]
- Baratto, L.; Toriihara, A.; Hatami, N.; Aparici, C.M.; Davidzon, G.; Levin, C.S.; Iagaru, A. Results of a Prospective Trial to Compare 68Ga-DOTA-TATE with SiPM-Based PET/CT vs. Conventional PET/CT in Patients with Neuroendocrine Tumors. Diagnostics 2021, 11, 992. [Google Scholar] [CrossRef]
- Minamimoto, R.; Levin, C.; Jamali, M.; Holley, D.; Barkhodari, A.; Zaharchuk, G.; Iagaru, A. Improvements in PET Image Quality in Time of Flight (TOF) Simultaneous PET/MRI. Mol. Imaging Biol. 2016, 18, 776–781. [Google Scholar] [CrossRef]
- Akamatsu, G.; Ishikawa, K.; Mitsumoto, K.; Taniguchi, T.; Ohya, N.; Baba, S.; Abe, K.; Sasaki, M. Improvement in PET/CT image quality with a combination of point-spread function and time-of-flight in relation to reconstruction parameters. J. Nucl. Med. 2012, 53, 1716–1722. [Google Scholar] [CrossRef]
- Taniguchi, T.; Akamatsu, G.; Kasahara, Y.; Mitsumoto, K.; Baba, S.; Tsutsui, Y.; Himuro, K.; Mikasa, S.; Kidera, D.; Sasaki, M. Improvement in PET/CT image quality in overweight patients with PSF and TOF. Ann. Nucl. Med. 2015, 29, 71–77. [Google Scholar] [CrossRef]
- Surti, S.; Scheuermann, J.; El Fakhri, G.; Daube-witherspoon, M.E.; Lim, R.; Abi-Hatem, N.; Moussallem, E.; Benard, F.; Mankoff, D.; Karp, J.S. Impact of time-of-flight PET on whole-body oncologic studies: A human observer lesion detection and localization study. J. Nucl. Med. 2011, 52, 712–719. [Google Scholar] [CrossRef]
- El Fakhri, G.; Surti, S.; Trott, C.M.; Scheuermann, J.; Karp, J.S. Improvement in lesion detection with whole-body oncologic time-of-flight PET. J. Nucl. Med. 2011, 52, 347–353. [Google Scholar] [CrossRef]
- Schaefferkoetter, J.; Casey, M.; Townsend, D.; El Fakhri, G. Clinical impact of time-of-flight and point response modeling in PET reconstructions: A lesion detection study. Phys. Med. Biol. 2013, 58, 1465–1478. [Google Scholar] [CrossRef]
- Aklan, B.; Oehmigen, M.; Beiderwellen, K.; Ruhlmann, M.; Paulus, D.H.; Jakoby, B.W.; Ritt, P.; Quick, H.H. Impact of Point-Spread Function Modeling on PET Image Quality in Integrated PET/MR Hybrid Imaging. J. Nucl. Med. 2016, 57, 78–84. [Google Scholar] [CrossRef] [PubMed]
- Kadrmas, D.J.; Casey, M.E.; Conti, M.; Jakoby, B.W.; Lois, C.; Townsend, D.W. Impact of time-of-flight on PET tumor detection. J. Nucl. Med. 2009, 50, 1315–1323. [Google Scholar] [CrossRef] [PubMed]
- Kurita, Y.; Ichikawa, Y.; Nakanishi, T.; Tomita, Y.; Hasegawa, D.; Murashima, S.; Hirano, T.; Sakuma, H. The value of Bayesian penalized likelihood reconstruction for improving lesion conspicuity of malignant lung tumors on 18F-FDG PET/CT: Comparison with ordered subset expectation maximization reconstruction incorporating time-of-flight model and point spread function correction. Ann. Nucl. Med. 2020, 34, 272–279. [Google Scholar] [CrossRef] [PubMed]
- Jansen, B.H.E.; Jansen, R.W.; Wondergem, M.; Srbljin, S.; de Klerk, J.M.H.; Lissenberg-Witte, B.I.; Vis, A.N.; van Moorselaar, R.J.A.; Boellaard, R.; Hoekstra, O.S.; et al. Lesion Detection and Interobserver Agreement with Advanced Image Reconstruction for 18F-DCFPyL PET/CT in Patients with Biochemically Recurrent Prostate Cancer. J. Nucl. Med. 2020, 61, 210–216. [Google Scholar] [CrossRef]
- Andersen, F.L.; Klausen, T.L.; Loft, A.; Beyer, T.; Holm, S. Clinical evaluation of PET image reconstruction using a spatial resolution model. Eur. J. Radiol. 2013, 82, 862–869. [Google Scholar] [CrossRef]
- Panin, V.Y.; Kehren, F.; Michel, C.; Casey, M. Fully 3-D PET reconstruction with system matrix derived from point source measurements. IEEE Trans. Med. Imaging 2006, 25, 907–921. [Google Scholar] [CrossRef]
- Caribé, P.; Koole, M.; D’Asseler, Y.; Van Den Broeck, B.; Vandenberghe, S. Noise reduction using a Bayesian penalized-likelihood reconstruction algorithm on a time-of-flight PET-CT scanner. EJNMMI Phys. 2019, 6, 22. [Google Scholar] [CrossRef]
- Guo, B.; Wu, Z.; Zhao, B.; Huang, B.; Li, X.; Zhao, J.; Li, Y. Quantification Accuracy Using Bayesian Penalized Likelihood Based Reconstruction on 68Ga PET-CT. J. Nucl. Med. 2020, 61 (Suppl. S1), 162. [Google Scholar]
- Lindström, E.; Velikyan, I.; Regula, N.; Alhuseinalkhudhur, A.; Sundin, A.; Sörensen, J.; Lubberink, M. Regularized reconstruction of digital time-of-flight 68Ga-PSMA-11 PET/CT for the detection of recurrent disease in prostate cancer patients. Theranostics 2019, 9, 3476–3484. [Google Scholar] [CrossRef]
- Chicheportiche, A.; Goshen, E.; Godefroy, J.; Grozinsky-Glasberg, S.; Oleinikov, K.; Meirovitz, A.; Gross, D.J.; Ben-Haim, S. Can a penalized-likelihood estimation algorithm be used to reduce the injected dose or the acquisition time in 68Ga-DOTATATE PET/CT studies? EJNMMI Phys. 2021, 8, 13. [Google Scholar] [CrossRef]
- Kirchner, J.; O’Donoghue, J.A.; Becker, A.S.; Ulaner, G.A. Improved image reconstruction of 89Zr-immunoPET studies using a Bayesian penalized likelihood reconstruction algorithm. EJNMMI Phys. 2021, 8, 6. [Google Scholar] [CrossRef] [PubMed]
- Teoh, E.J.; McGowan, D.R.; Bradley, K.M.; Belcher, E.; Black, E.; Gleeson, F.V. Novel penalised likelihood reconstruction of PET in the assessment of histologically verified small pulmonary nodules. Eur. Radiol. 2016, 26, 576–584. [Google Scholar] [CrossRef] [PubMed]
- Schwyzer, M.; Martini, K.; Benz, D.C.; Burger, I.A.; Ferraro, D.A.; Kudura, K.; Treyer, V.; von Schulthess, G.K.; Kaufmann, P.A.; Huellner, M.W.; et al. Artificial intelligence for detecting small FDG-positive lung nodules in digital PET/CT: Impact of image reconstructions on diagnostic performance. Eur. Radiol. 2020, 30, 2031–2040. [Google Scholar] [CrossRef]
- Bjöersdorff, M.; Oddstig, J.; Karindotter-Borgendahl, N.; Almquist, H.; Zackrisson, S.; Minarik, D.; Trägårdh, E. Impact of penalizing factor in a block-sequential regularized expectation maximization reconstruction algorithm for 18F-fluorocholine PET-CT regarding image quality and interpretation. EJNMMI Phys. 2019, 6, 5. [Google Scholar] [CrossRef] [PubMed]
- Ly, J.; Minarik, D.; Edenbrandt, L.; Wollmer, P.; Trägårdh, E. The use of a proposed updated EARL harmonization of 18F-FDG PET-CT in patients with lymphoma yields significant differences in Deauville score compared with current EARL recommendations. EJNMMI Res. 2019, 9, 65. [Google Scholar] [CrossRef]
- Reynés-Llompart, G.; Sabaté-Llobera, A.; Llinares-Tello, E.; Martí-Climent, J.M.; Gámez-Cenzano, C. Image quality evaluation in a modern PET system: Impact of new reconstructions methods and a radiomics approach. Sci. Rep. 2019, 9, 10640. [Google Scholar] [CrossRef]
- Salvadori, J.; Imbert, L.; Perrin, M.; Karcher, G.; Lamiral, Z.; Marie, P.-Y.; Verger, A. Head-to-head comparison of image quality between brain 18F-FDG images recorded with a fully digital versus a last-generation analog PET camera. EJNMMI Res. 2019, 9, 61. [Google Scholar] [CrossRef]
- Reynés-Llompart, G.; Gámez-Cenzano, C.; Vercher-Conejero, J.L.; Sabaté-Llobera, A.; Calvo-Malvar, N.; Martí-Climent, J.M. Phantom, clinical, and texture indices evaluation and optimization of a penalized-likelihood image reconstruction method (Q.Clear) on a BGO PET/CT scanner. Med. Phys. 2018, 45, 3214–3222. [Google Scholar] [CrossRef]
- Zhang, Y.Q.; Hu, P.C.; Wu, R.Z.; Gu, Y.S.; Chen, S.G.; Yu, H.J.; Wang, X.Q.; Song, J.; Shi, H.C. The image quality, lesion detectability, and acquisition time of 18F-FDG total-body PET/CT in oncological patients. Eur. J. Nucl. Med. Mol. Imaging 2020, 47, 2507–2515. [Google Scholar] [CrossRef]
- Aide, N.; Lasnon, C.; Veit-Haibach, P.; Sera, T.; Sattler, B.; Boellaard, R. EANM/EARL harmonization strategies in PET quantification: From daily practice to multicentre oncological studies. Eur. J. Nucl. Med. Mol. Imaging 2017, 44, 17–31. [Google Scholar] [CrossRef]
- Lasnon, C.; Desmonts, C.; Quak, E.; Gervais, R.; Do, P.; Dubos-Arvis, C.; Aide, N. Harmonizing SUVs in multicentre trials when using different generation PET systems: Prospective validation in non-small cell lung cancer patients. Eur. J. Nucl. Med. Mol. Imaging 2013, 40, 985–996. [Google Scholar] [CrossRef][Green Version]
- Khalaf, M.; Abdel-Nabi, H.; Baker, J.; Shao, Y.; Lamonica, D.; Gona, J. Relation between nodule size and 18F-FDG-PET SUV for malignant and benign pulmonary nodules. J. Hematol. Oncol. 2008, 1, 13. [Google Scholar] [CrossRef]
- Schmidt-Hansen, M.; Baldwin, D.R.; Hasler, E.; Zamora, J.; Abraira, V.; Roqué, I.F.M. PET-CT for assessing mediastinal lymph node involvement in patients with suspected resectable non-small cell lung cancer. Cochrane Database Syst. Rev. 2014, 2014, Cd009519. [Google Scholar] [CrossRef]
- Kunikowska, J.; Matyskiel, R.; Toutounchi, S.; Grabowska-Derlatka, L.; Koperski, L.; Królicki, L. What parameters from 18F-FDG PET/CT are useful in evaluation of adrenal lesions? Eur. J. Nucl. Med. Mol. Imaging 2014, 41, 2273–2280. [Google Scholar] [CrossRef] [PubMed]
- Shin, D.S.; Shon, O.J.; Han, D.S.; Choi, J.H.; Chun, K.A.; Cho, I.H. The clinical efficacy of 18F-FDG-PET/CT in benign and malignant musculoskeletal tumors. Ann. Nucl. Med. 2008, 22, 603–609. [Google Scholar] [CrossRef] [PubMed]
- Pauleit, D.; Floeth, F.; Hamacher, K.; Riemenschneider, M.J.; Reifenberger, G.; Müller, H.-W.; Zilles, K.; Coenen, H.H.; Langen, K.-J. O-(2-[18F]fluoroethyl)-l-tyrosine PET combined with MRI improves the diagnostic assessment of cerebral gliomas. Brain 2005, 128, 678–687. [Google Scholar] [CrossRef]
- Hasenclever, D.; Kurch, L.; Mauz-Körholz, C.; Elsner, A.; Georgi, T.; Wallace, H.; Landman-Parker, J.; Moryl-Bujakowska, A.; Cepelová, M.; Karlén, J.; et al. qPET—A quantitative extension of the Deauville scale to assess response in interim FDG-PET scans in lymphoma. Eur. J. Nucl. Med. Mol. Imaging 2014, 41, 1301–1308. [Google Scholar] [CrossRef]
- de Langen, A.J.; Vincent, A.; Velasquez, L.M.; van Tinteren, H.; Boellaard, R.; Shankar, L.K.; Boers, M.; Smit, E.F.; Stroobants, S.; Weber, W.A.; et al. Repeatability of 18F-FDG uptake measurements in tumors: A metaanalysis. J. Nucl. Med. 2012, 53, 701–708. [Google Scholar] [CrossRef] [PubMed]
- Kumar, V.; Nath, K.; Berman, C.G.; Kim, J.; Tanvetyanon, T.; Chiappori, A.A.; Gatenby, R.A.; Gillies, R.J.; Eikman, E.A. Variance of SUVs for FDG-PET/CT is greater in clinical practice than under ideal study settings. Clin. Nucl. Med. 2013, 38, 175–182. [Google Scholar] [CrossRef]
- Lodge, M.A. Repeatability of SUV in Oncologic 18F-FDG PET. J. Nucl. Med. 2017, 58, 523–532. [Google Scholar] [CrossRef]
- Vanderhoek, M.; Perlman, S.B.; Jeraj, R. Impact of the definition of peak standardized uptake value on quantification of treatment response. J. Nucl. Med. 2012, 53, 4–11. [Google Scholar] [CrossRef] [PubMed]
- Vanderhoek, M.; Perlman, S.B.; Jeraj, R. Impact of different standardized uptake value measures on PET-based quantification of treatment response. J. Nucl. Med. 2013, 54, 1188–1194. [Google Scholar] [CrossRef] [PubMed]
- Wahl, R.L.; Jacene, H.; Kasamon, Y.; Lodge, M.A. From RECIST to PERCIST: Evolving Considerations for PET response criteria in solid tumors. J. Nucl. Med. 2009, 50 (Suppl. S1), 122s–150s. [Google Scholar] [CrossRef]
- Tahari, A.K.; Paidpally, V.; Chirindel, A.; Wahl, R.L.; Subramaniam, R.M. Two-time-point FDG PET/CT: Liver SULmean repeatability. AJR Am. J. Roentgenol. 2015, 204, 402–407. [Google Scholar] [CrossRef]
- Lee, P.; Bazan, J.G.; Lavori, P.W.; Weerasuriya, D.K.; Quon, A.; Le, Q.T.; Wakelee, H.A.; Graves, E.E.; Loo, B.W. Metabolic tumor volume is an independent prognostic factor in patients treated definitively for non-small-cell lung cancer. Clin. Lung Cancer 2012, 13, 52–58. [Google Scholar] [CrossRef] [PubMed]
- Dosani, M.; Yang, R.; McLay, M.; Wilson, D.; Liu, M.; Yong-Hing, C.J.; Hamm, J.; Lund, C.R.; Olson, R.; Schellenberg, D. Metabolic tumour volume is prognostic in patients with non-small-cell lung cancer treated with stereotactic ablative radiotherapy. Curr. Oncol. 2019, 26, e57–e63. [Google Scholar] [CrossRef] [PubMed]
- Han, S.; Kim, H.; Kim, Y.J.; Suh, C.H.; Woo, S. Prognostic Value of Volume-Based Metabolic Parameters of 18F-FDG PET/CT in Uterine Cervical Cancer: A Systematic Review and Meta-Analysis. AJR Am. J. Roentgenol. 2018, 211, 1112–1121. [Google Scholar] [CrossRef]
- Erdogan, M.; Erdemoglu, E.; Evrimler, Ş.; Hanedan, C.; Şengül, S.S. Prognostic value of metabolic tumor volume and total lesion glycolysis assessed by 18F-FDG PET/CT in endometrial cancer. Nucl. Med. Commun. 2019, 40, 1099–1104. [Google Scholar] [CrossRef]
- Wen, W.; Xuan, D.; Hu, Y.; Li, X.; Liu, L.; Xu, D. Prognostic value of maximum standard uptake value, metabolic tumor volume, and total lesion glycolysis of positron emission tomography/computed tomography in patients with breast cancer: A systematic review and meta-analysis. PLoS ONE 2019, 14, e0225959. [Google Scholar] [CrossRef] [PubMed]
- Chung, H.H.; Kim, J.W.; Han, K.H.; Eo, J.S.; Kang, K.W.; Park, N.H.; Song, Y.S.; Chung, J.K.; Kang, S.B. Prognostic value of metabolic tumor volume measured by FDG-PET/CT in patients with cervical cancer. Gynecol. Oncol. 2011, 120, 270–274. [Google Scholar] [CrossRef]
- Zschaeck, S.; Li, Y.; Lin, Q.; Beck, M.; Amthauer, H.; Bauersachs, L.; Hajiyianni, M.; Rogasch, J.; Ehrhardt, V.H.; Kalinauskaite, G.; et al. Prognostic value of baseline [18F]-fluorodeoxyglucose positron emission tomography parameters MTV, TLG and asphericity in an international multicenter cohort of nasopharyngeal carcinoma patients. PLoS ONE 2020, 15, e0236841. [Google Scholar] [CrossRef]
- Pak, K.; Cheon, G.J.; Nam, H.Y.; Kim, S.J.; Kang, K.W.; Chung, J.K.; Kim, E.E.; Lee, D.S. Prognostic value of metabolic tumor volume and total lesion glycolysis in head and neck cancer: A systematic review and meta-analysis. J. Nucl. Med. 2014, 55, 884–890. [Google Scholar] [CrossRef] [PubMed]
- Seifert, R.; Kessel, K.; Schlack, K.; Weber, M.; Herrmann, K.; Spanke, M.; Fendler, W.P.; Hadaschik, B.; Kleesiek, J.; Schäfers, M.; et al. PSMA PET total tumor volume predicts outcome of patients with advanced prostate cancer receiving [177Lu]Lu-PSMA-617 radioligand therapy in a bicentric analysis. Eur. J. Nucl. Med. Mol. Imaging 2021, 48, 1200–1210. [Google Scholar] [CrossRef]
- Kitao, T.; Hirata, K.; Shima, K.; Hayashi, T.; Sekizawa, M.; Takei, T.; Ichimura, W.; Harada, M.; Kondo, K.; Tamaki, N. Reproducibility and uptake time dependency of volume-based parameters on FDG-PET for lung cancer. BMC Cancer 2016, 16, 576. [Google Scholar] [CrossRef]
- Nestle, U.; Kremp, S.; Schaefer-Schuler, A.; Sebastian-Welsch, C.; Hellwig, D.; Rübe, C.; Kirsch, C.M. Comparison of different methods for delineation of 18F-FDG PET-positive tissue for target volume definition in radiotherapy of patients with non-Small cell lung cancer. J. Nucl. Med. 2005, 46, 1342–1348. [Google Scholar] [PubMed]
- Ilyas, H.; Mikhaeel, N.G.; Dunn, J.T.; Rahman, F.; Møller, H.; Smith, D.; Barrington, S.F. Defining the optimal method for measuring baseline metabolic tumour volume in diffuse large B cell lymphoma. Eur. J. Nucl. Med. Mol. Imaging 2018, 45, 1142–1154. [Google Scholar] [CrossRef]
- Cottereau, A.S.; Hapdey, S.; Chartier, L.; Modzelewski, R.; Casasnovas, O.; Itti, E.; Tilly, H.; Vera, P.; Meignan, M.A.; Becker, S. Baseline Total Metabolic Tumor Volume Measured with Fixed or Different Adaptive Thresholding Methods Equally Predicts Outcome in Peripheral T Cell Lymphoma. J. Nucl. Med. 2017, 58, 276–281. [Google Scholar] [CrossRef]
- Mettler, J.; Müller, H.; Voltin, C.A.; Baues, C.; Klaeser, B.; Moccia, A.; Borchmann, P.; Engert, A.; Kuhnert, G.; Drzezga, A.E.; et al. Metabolic Tumour Volume for Response Prediction in Advanced-Stage Hodgkin Lymphoma. J. Nucl. Med. 2018. [Google Scholar] [CrossRef]
- Furth, C.; Amthauer, H.; Hautzel, H.; Steffen, I.G.; Ruf, J.; Schiefer, J.; Schönberger, S.; Henze, G.; Grandt, R.; Hundsdoerfer, P.; et al. Evaluation of interim PET response criteria in paediatric Hodgkin’s lymphoma—Results for dedicated assessment criteria in a blinded dual-centre read. Ann. Oncol. Off. J. Eur. Soc. Med. Oncol. 2011, 22, 1198–1203. [Google Scholar] [CrossRef]
- Hofman, M.S.; Smeeton, N.C.; Rankin, S.C.; Nunan, T.; O’Doherty, M.J. Observer variation in interpreting 18F-FDG PET/CT findings for lymphoma staging. J. Nucl. Med. 2009, 50, 1594–1597. [Google Scholar] [CrossRef]
- Kluge, R.; Chavdarova, L.; Hoffmann, M.; Kobe, C.; Malkowski, B.; Montravers, F.; Kurch, L.; Georgi, T.; Dietlein, M.; Wallace, W.H.; et al. Inter-Reader Reliability of Early FDG-PET/CT Response Assessment Using the Deauville Scale after 2 Cycles of Intensive Chemotherapy (OEPA) in Hodgkin’s Lymphoma. PLoS ONE 2016, 11, e0149072. [Google Scholar] [CrossRef] [PubMed]
- Ceriani, L.; Barrington, S.; Biggi, A.; Malkowski, B.; Metser, U.; Versari, A.; Martelli, M.; Davies, A.; Johnson, P.W.; Zucca, E.; et al. Training improves the interobserver agreement of the expert positron emission tomography review panel in primary mediastinal B-cell lymphoma: Interim analysis in the ongoing International Extranodal Lymphoma Study Group-37 study. Hematol. Oncol. 2017, 35, 548–553. [Google Scholar] [CrossRef] [PubMed]
- Fledelius, J.; Khalil, A.; Hjorthaug, K.; Frøkiær, J. Inter-observer agreement improves with PERCIST 1.0 as opposed to qualitative evaluation in non-small cell lung cancer patients evaluated with F-18-FDG PET/CT early in the course of chemo-radiotherapy. EJNMMI Res. 2016, 6, 71. [Google Scholar] [CrossRef] [PubMed]
- Sørensen, J.S.; Vilstrup, M.H.; Holm, J.; Vogsen, M.; Bülow, J.L.; Ljungstrøm, L.; Braad, P.E.; Gerke, O.; Hildebrandt, M.G. Interrater Agreement and Reliability of PERCIST and Visual Assessment When Using 18F-FDG-PET/CT for Response Monitoring of Metastatic Breast Cancer. Diagnostics 2020, 10, 1001. [Google Scholar] [CrossRef] [PubMed]
- Rowe, S.P.; Pienta, K.J.; Pomper, M.G.; Gorin, M.A. Proposal for a Structured Reporting System for Prostate-Specific Membrane Antigen-Targeted PET Imaging: PSMA-RADS Version 1.0. J. Nucl. Med. 2018, 59, 479–485. [Google Scholar] [CrossRef]
- Ceci, F.; Oprea-Lager, D.E.; Emmett, L.; Adam, J.A.; Bomanji, J.; Czernin, J.; Eiber, M.; Haberkorn, U.; Hofman, M.S.; Hope, T.A.; et al. E-PSMA: The EANM standardized reporting guidelines v1.0 for PSMA-PET. Eur. J. Nucl. Med. Mol. Imaging 2021, 48, 1626–1638. [Google Scholar] [CrossRef]
- Eiber, M.; Herrmann, K.; Calais, J.; Hadaschik, B.; Giesel, F.L.; Hartenbach, M.; Hope, T.; Reiter, R.; Maurer, T.; Weber, W.A.; et al. Prostate Cancer Molecular Imaging Standardized Evaluation (PROMISE): Proposed miTNM Classification for the Interpretation of PSMA-Ligand PET/CT. J. Nucl. Med. 2018, 59, 469–478. [Google Scholar] [CrossRef]
- Fanti, S.; Minozzi, S.; Morigi, J.J.; Giesel, F.; Ceci, F.; Uprimny, C.; Hofman, M.S.; Eiber, M.; Schwarzenbock, S.; Castellucci, P.; et al. Development of standardized image interpretation for 68Ga-PSMA PET/CT to detect prostate cancer recurrent lesions. Eur. J. Nucl. Med. Mol. Imaging 2017, 44, 1622–1635. [Google Scholar] [CrossRef]
- Werner, R.A.; Bundschuh, R.A.; Bundschuh, L.; Javadi, M.S.; Leal, J.P.; Higuchi, T.; Pienta, K.J.; Buck, A.K.; Pomper, M.G.; Gorin, M.A.; et al. Interobserver Agreement for the Standardized Reporting System PSMA-RADS 1.0 on 18F-DCFPyL PET/CT Imaging. J. Nucl. Med. 2018, 59, 1857–1864. [Google Scholar] [CrossRef]
- Fendler, W.P.; Calais, J.; Allen-Auerbach, M.; Bluemel, C.; Eberhardt, N.; Emmett, L.; Gupta, P.; Hartenbach, M.; Hope, T.A.; Okamoto, S.; et al. 68Ga-PSMA-11 PET/CT Interobserver Agreement for Prostate Cancer Assessments: An International Multicenter Prospective Study. J. Nucl. Med. 2017, 58, 1617–1623. [Google Scholar] [CrossRef]
- Demirci, E.; Akyel, R.; Caner, B.; Alan-Selçuk, N.; Güven-Meşe, Ş.; Ocak, M.; Kabasakal, L. Interobserver and intraobserver agreement on prostate-specific membrane antigen PET/CT images according to the miTNM and PSMA-RADS criteria. Nucl. Med. Commun. 2020, 41, 759–767. [Google Scholar] [CrossRef]
- Derwael, C.; Lavergne, O.; Lovinfosse, P.; Nechifor, V.; Salvé, M.; Waltregny, D.; Hustinx, R.; Withofs, N. Interobserver agreement of [68Ga]Ga-PSMA-11 PET/CT images interpretation in men with newly diagnosed prostate cancer. EJNMMI Res. 2020, 10, 15. [Google Scholar] [CrossRef] [PubMed]
- Toriihara, A.; Nobashi, T.; Baratto, L.; Duan, H.; Moradi, F.; Park, S.; Hatami, N.; Aparici, C.M.; Davidzon, G.; Iagaru, A. Comparison of 3 Interpretation Criteria for 68Ga-PSMA11 PET Based on Inter- and Intrareader Agreement. J. Nucl. Med. 2020, 61, 533–539. [Google Scholar] [CrossRef] [PubMed]
- Khatri, W.; Chung, H.W.; Werner, R.A.; Leal, J.P.; Pienta, K.J.; Lodge, M.A.; Gorin, M.A.; Pomper, M.G.; Rowe, S.P. Effect of Point-Spread Function Reconstruction for Indeterminate PSMA-RADS-3A Lesions on PSMA-Targeted PET Imaging of Men with Prostate Cancer. Diagnostics 2021, 11, 665. [Google Scholar] [CrossRef] [PubMed]


Publisher’s Note: MDPI stays neutral with regard to jurisdictional claims in published maps and institutional affiliations. |
© 2022 by the authors. Licensee MDPI, Basel, Switzerland. This article is an open access article distributed under the terms and conditions of the Creative Commons Attribution (CC BY) license (https://creativecommons.org/licenses/by/4.0/).
Share and Cite
Rogasch, J.M.M.; Hofheinz, F.; van Heek, L.; Voltin, C.-A.; Boellaard, R.; Kobe, C. Influences on PET Quantification and Interpretation. Diagnostics 2022, 12, 451. https://doi.org/10.3390/diagnostics12020451
Rogasch JMM, Hofheinz F, van Heek L, Voltin C-A, Boellaard R, Kobe C. Influences on PET Quantification and Interpretation. Diagnostics. 2022; 12(2):451. https://doi.org/10.3390/diagnostics12020451
Chicago/Turabian StyleRogasch, Julian M. M., Frank Hofheinz, Lutz van Heek, Conrad-Amadeus Voltin, Ronald Boellaard, and Carsten Kobe. 2022. "Influences on PET Quantification and Interpretation" Diagnostics 12, no. 2: 451. https://doi.org/10.3390/diagnostics12020451
APA StyleRogasch, J. M. M., Hofheinz, F., van Heek, L., Voltin, C.-A., Boellaard, R., & Kobe, C. (2022). Influences on PET Quantification and Interpretation. Diagnostics, 12(2), 451. https://doi.org/10.3390/diagnostics12020451