Effects of High-Intensity Interval Training (HIIT) on Patients with Musculoskeletal Disorders: A Systematic Review and Meta-Analysis with a Meta-Regression and Mapping Report

 ,
,  , ,
, ,  ,
,  ,
, 

Abstract
1. Introduction
2. Materials and Methods
2.1. Inclusion Criteria
2.1.1. Population
2.1.2. Intervention and Control
2.1.3. Outcomes
2.1.4. Study Design
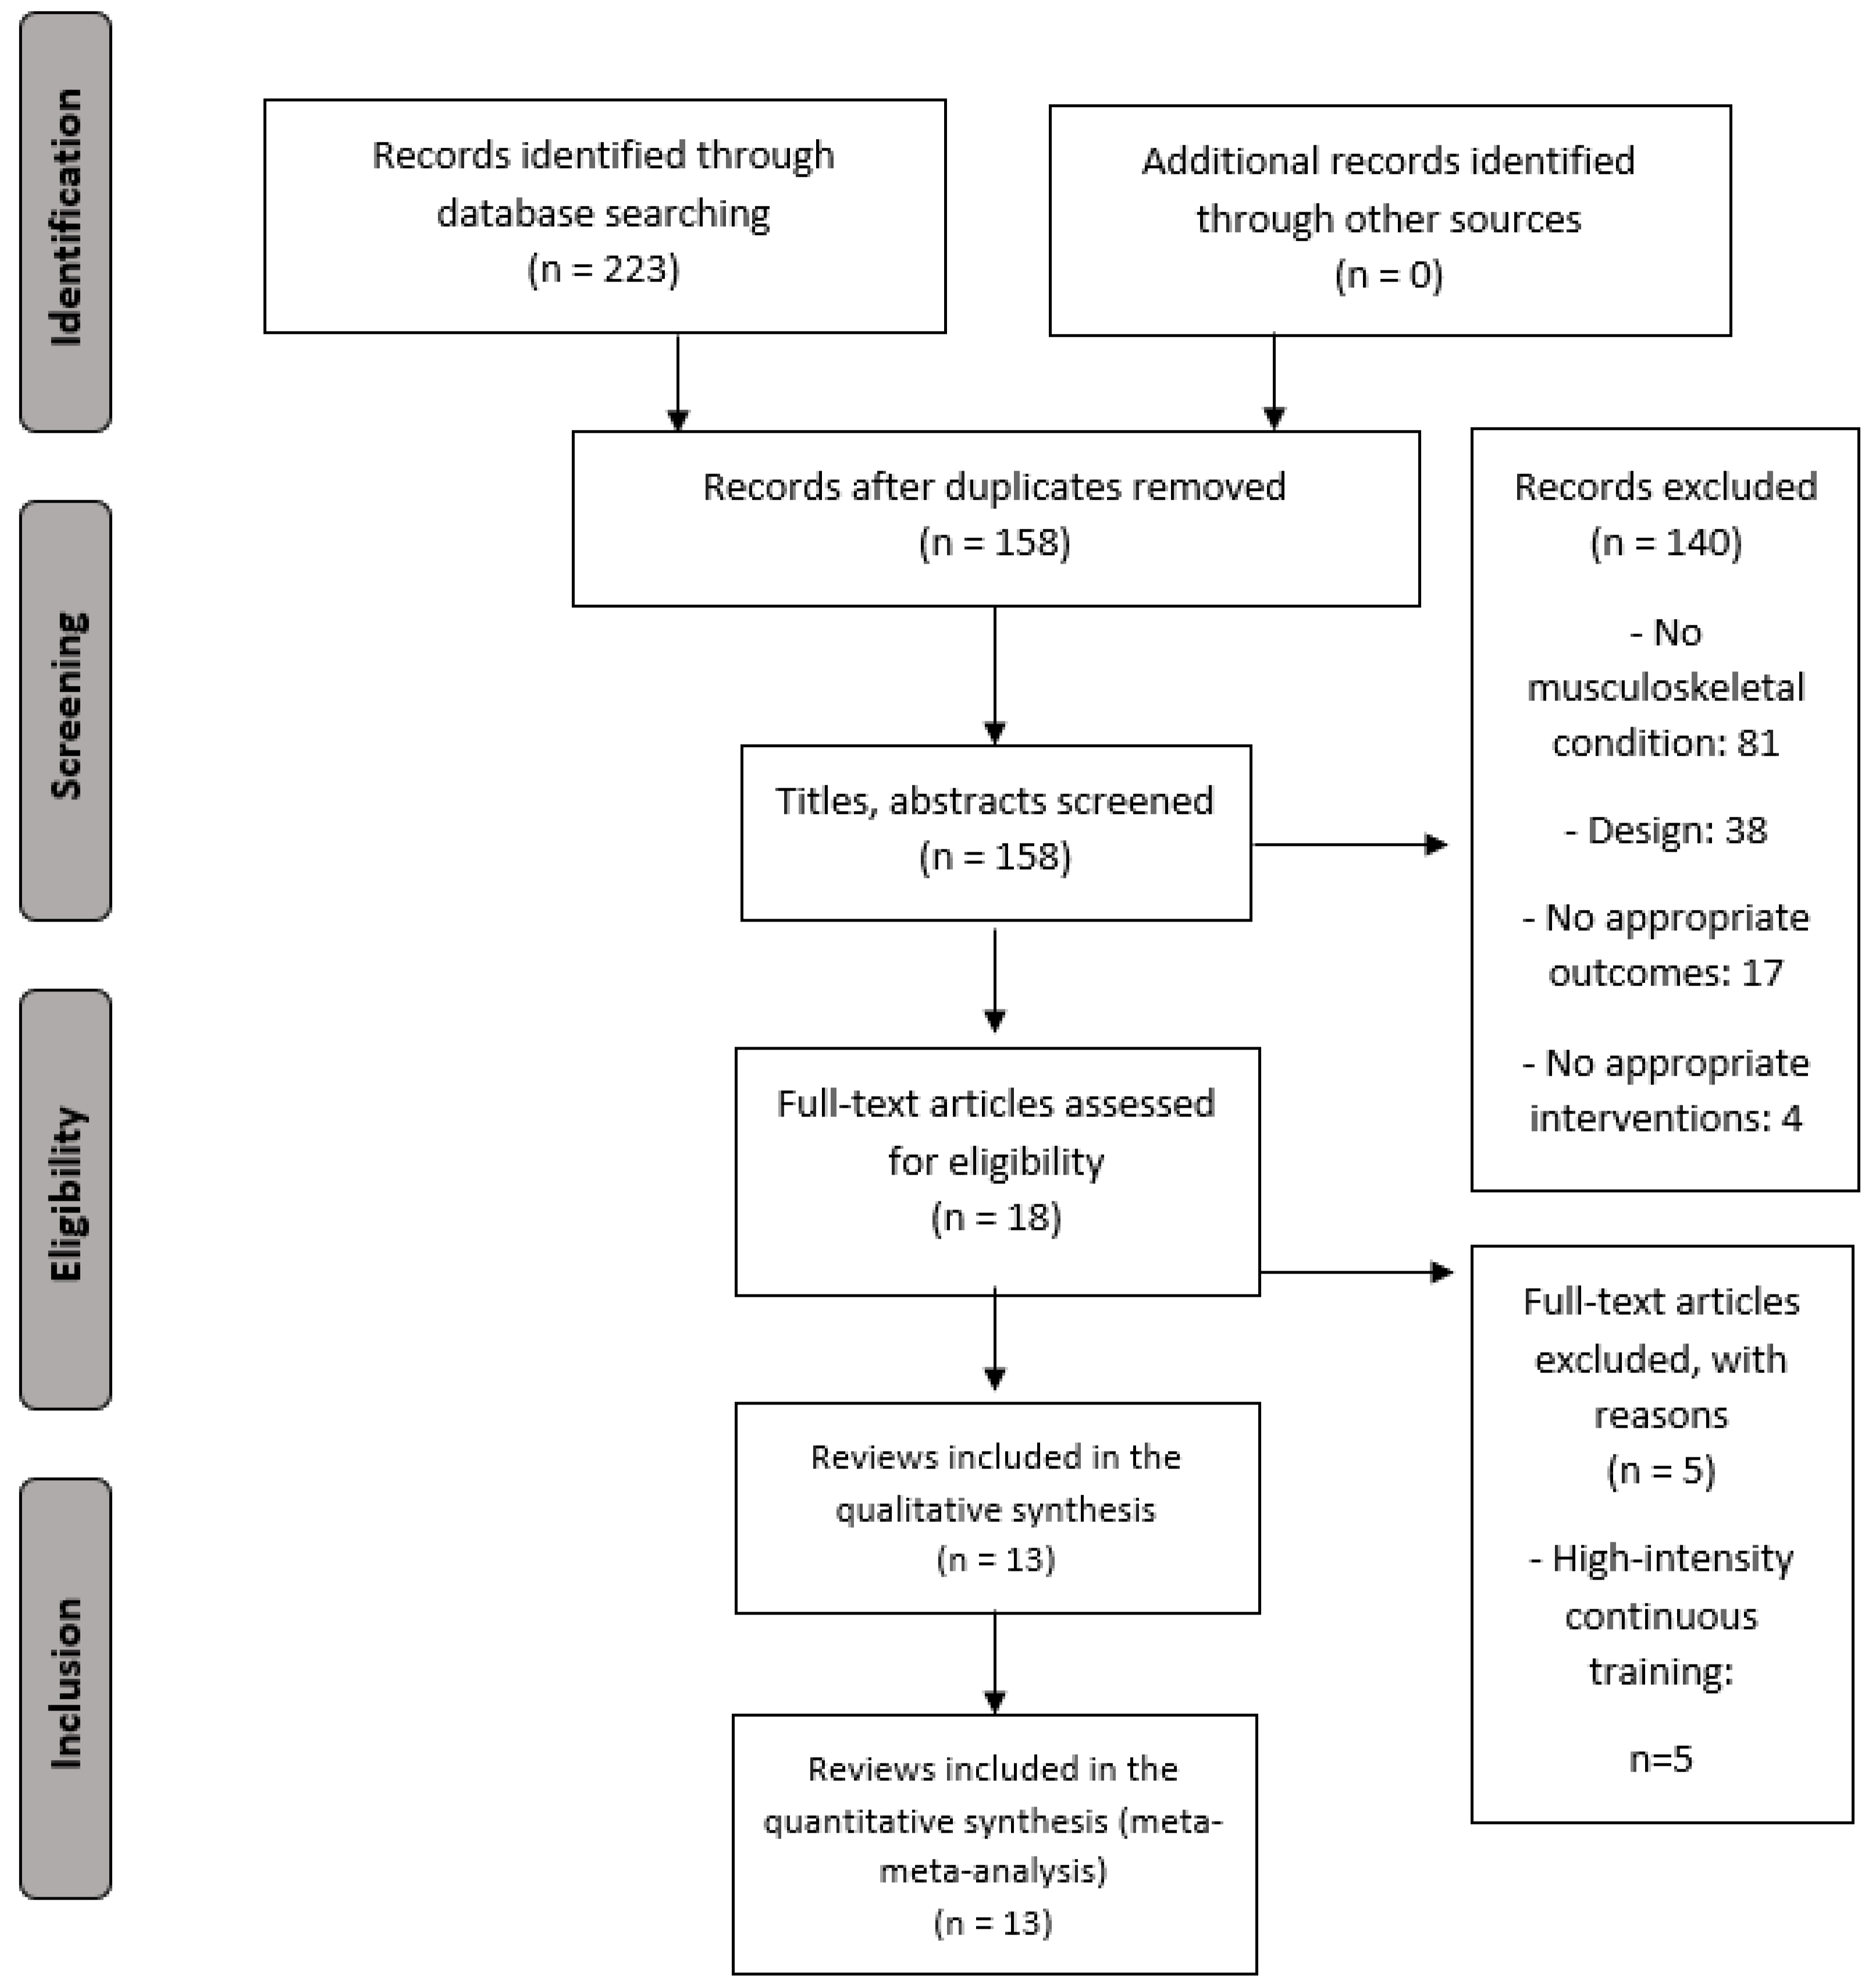
2.2. Search Strategy
2.3. Selection Criteria and Data Extraction
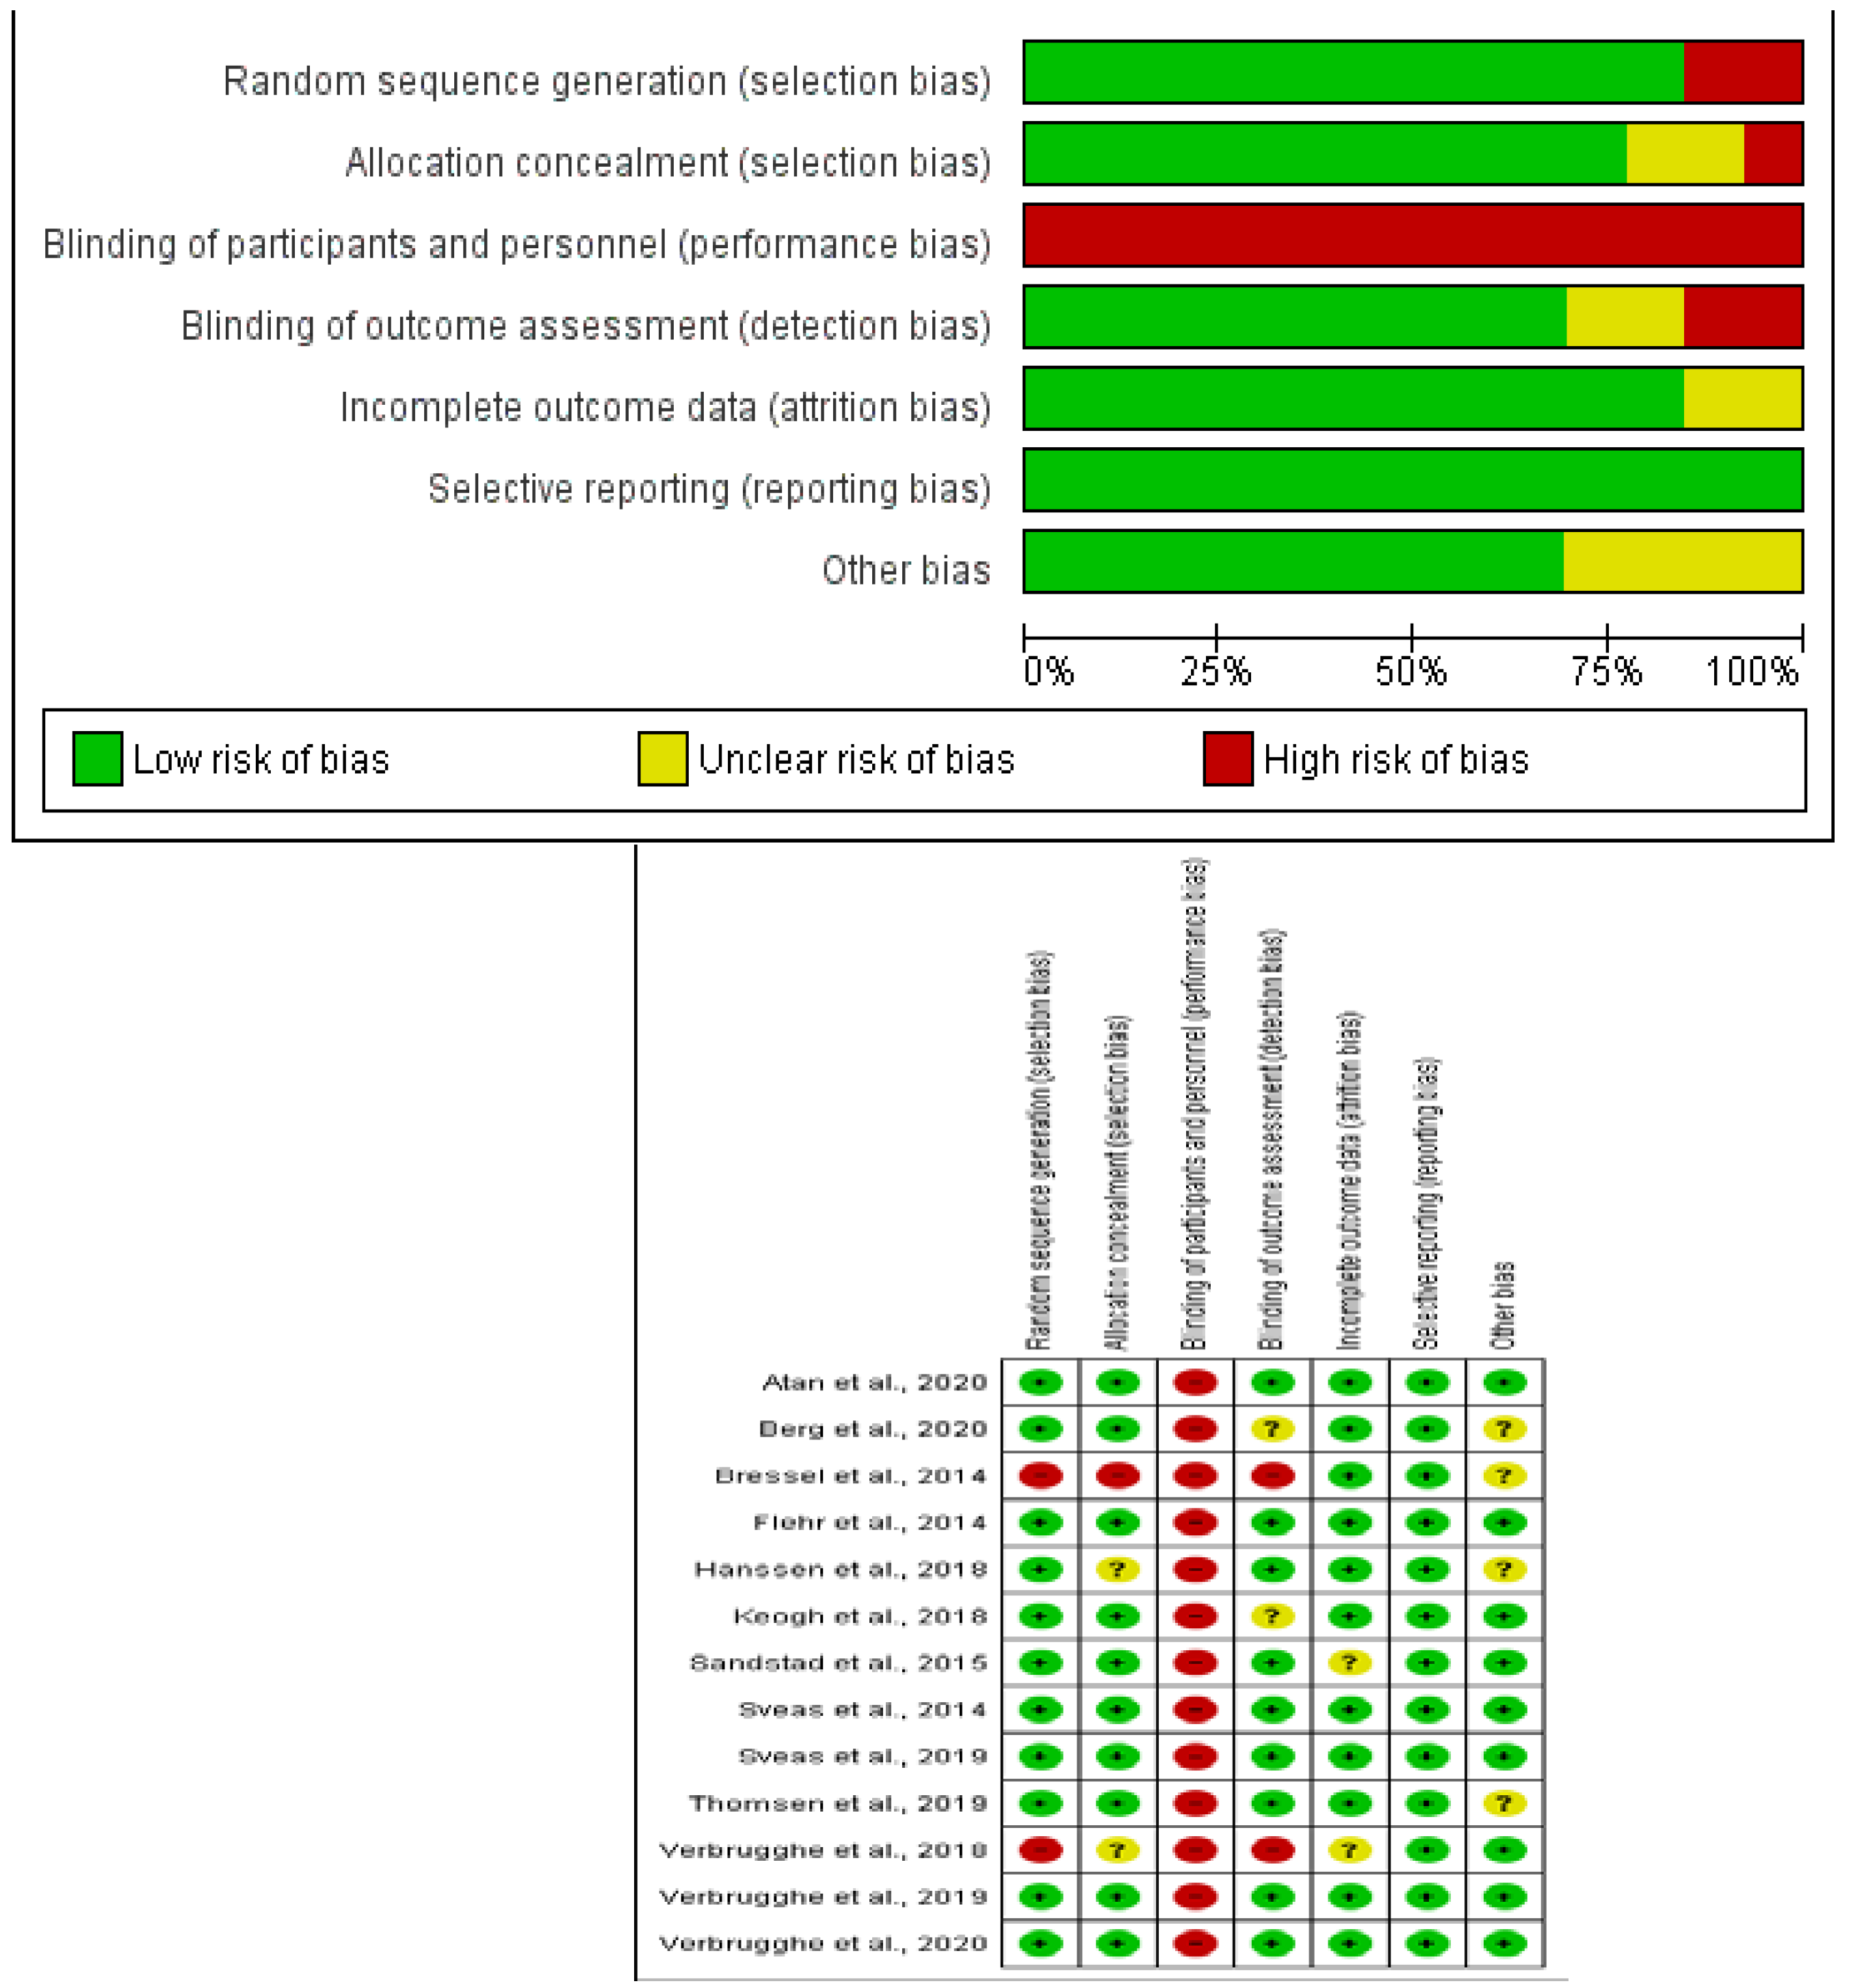
2.4. Methodological Quality Assessment
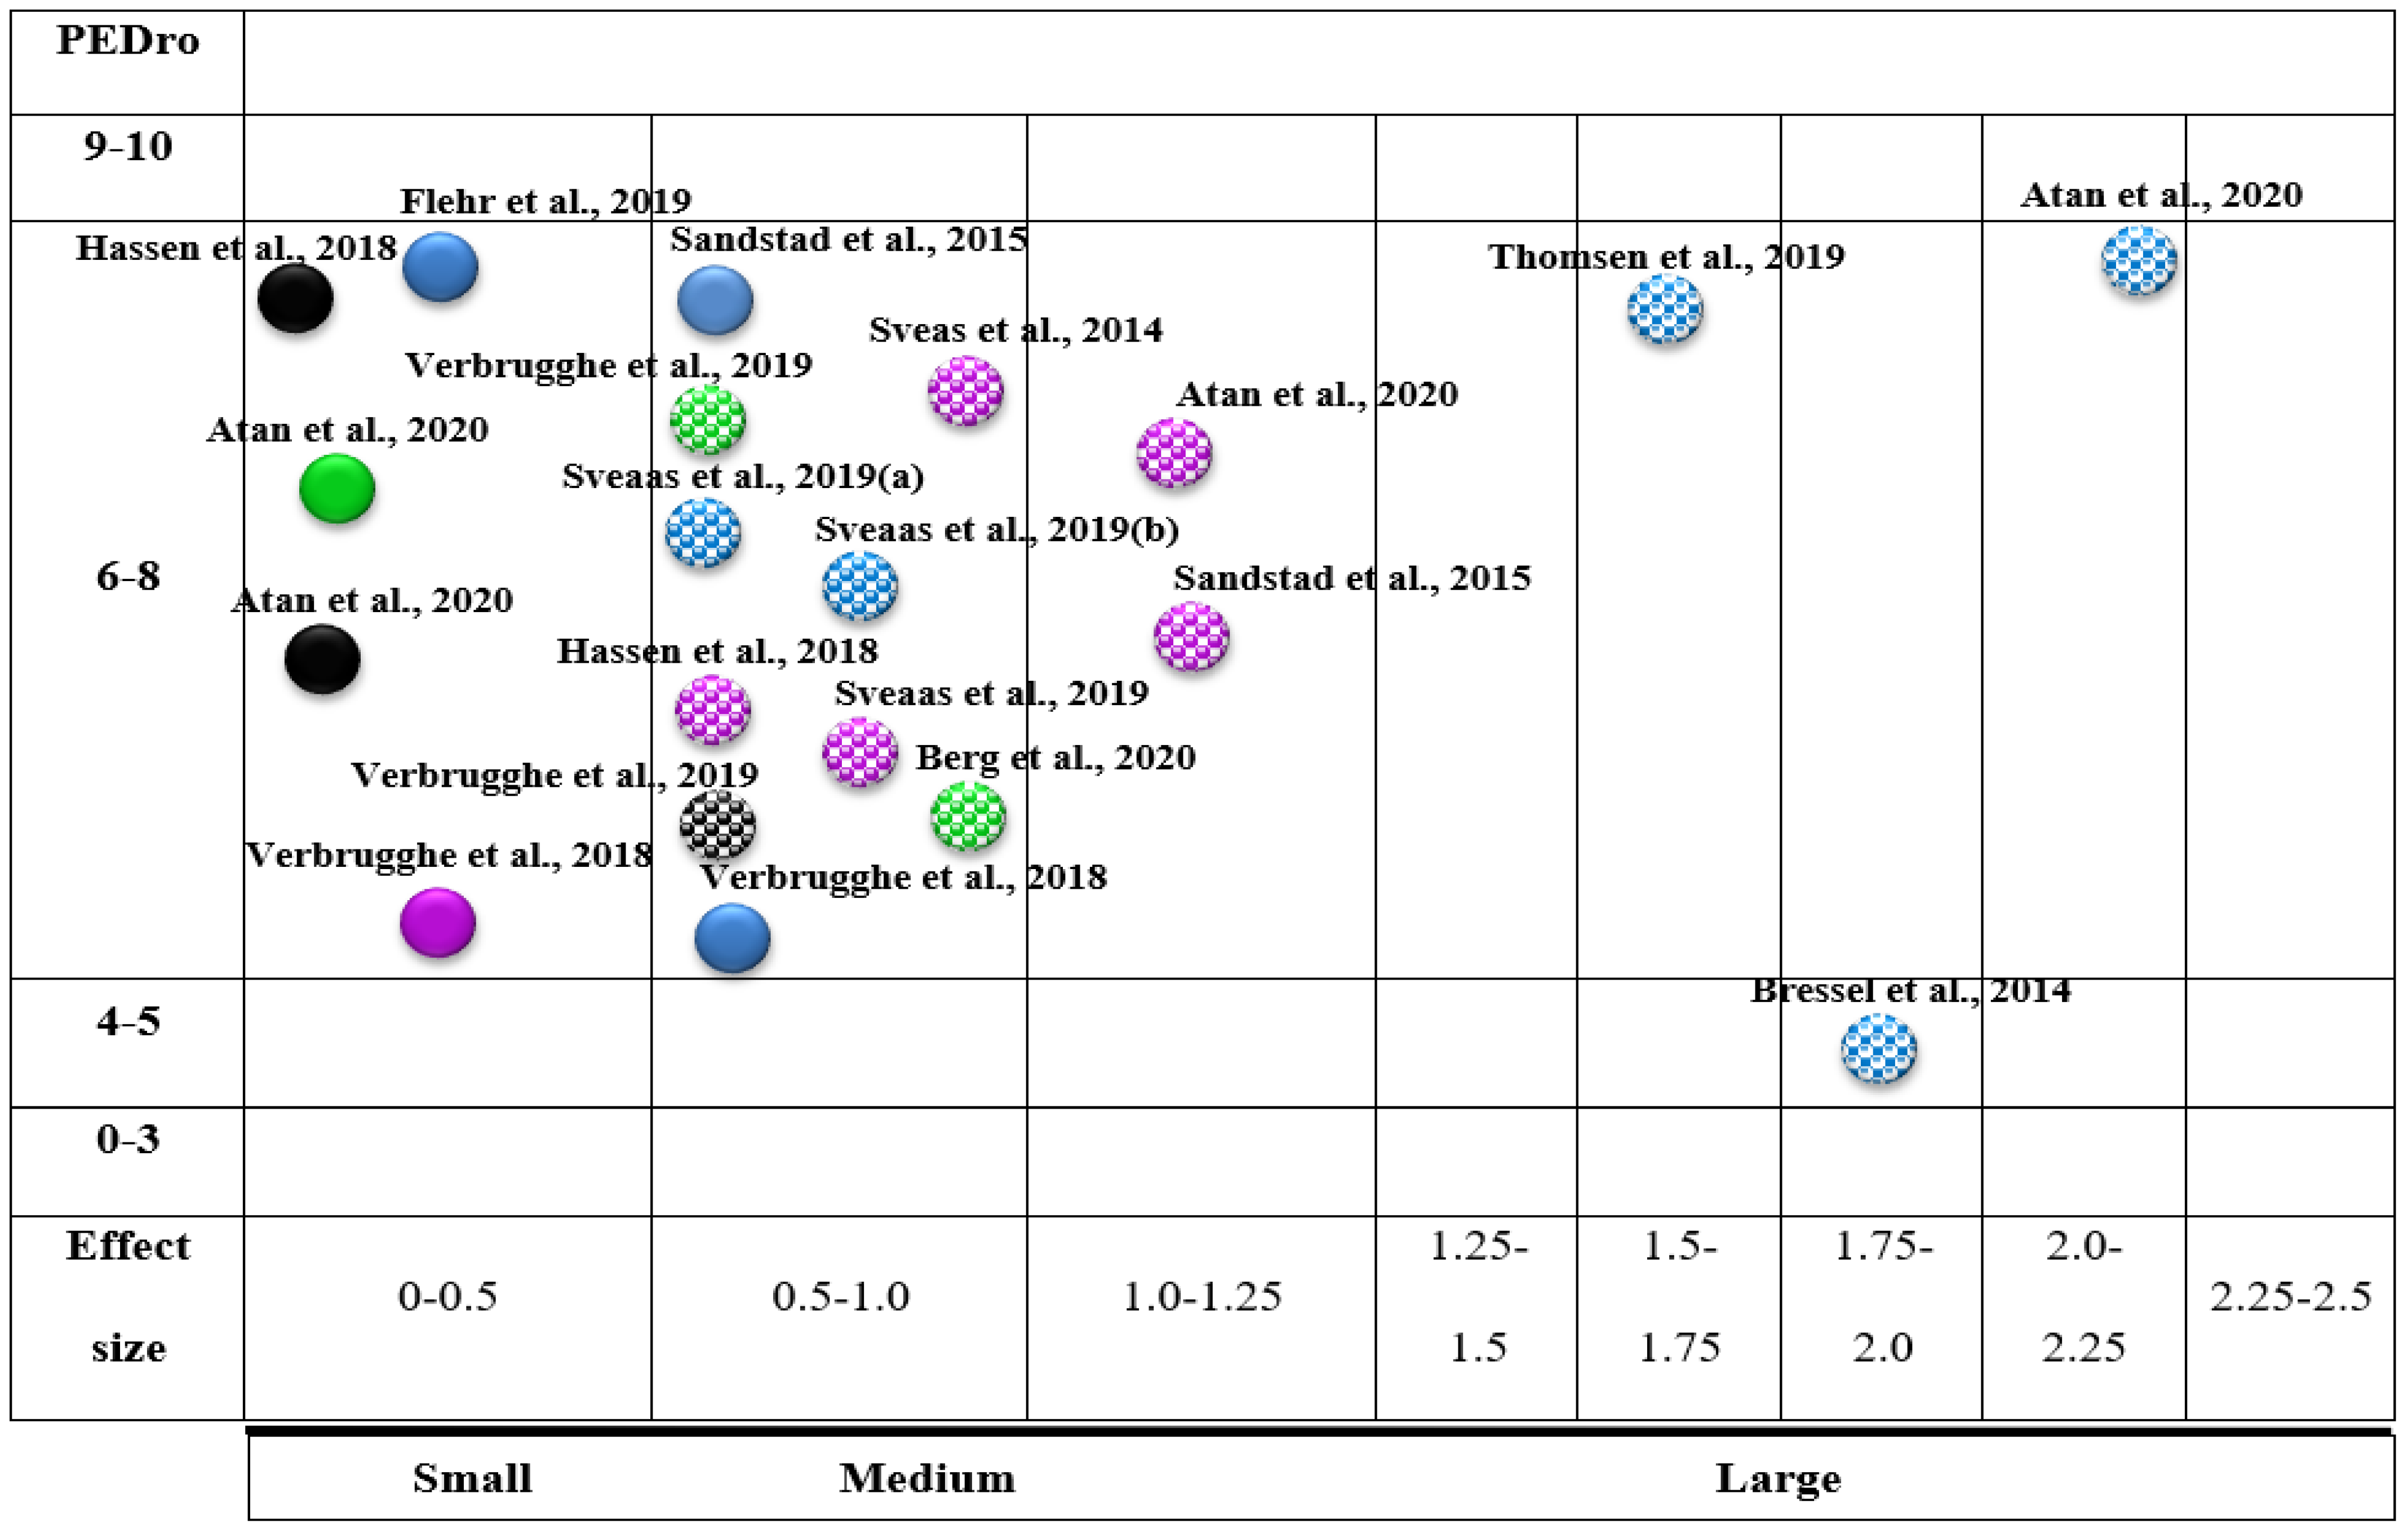
2.5. Evidence Map
- Type of outcome measure (bubble colour): The bubble colour represents the variables (pain intensity, blue; VO2 max, violet; disability, green; QoL, black).
- Variable (x-axis): We employed the calculation of effect sizes.
- Effect (y-axis): Each of the reviews was classified according to its methodological quality using the PEDro scale.
- Statistically significant differences: Articles with statistically significant differences were marked with white dots.
2.6. Certainty of Evidence
2.7. Data Synthesis and Analysis
3. Results
3.1. Characteristics of the Included Studies
3.2. Interventions
3.3. Methodological Quality Results
3.4. Evidence Map
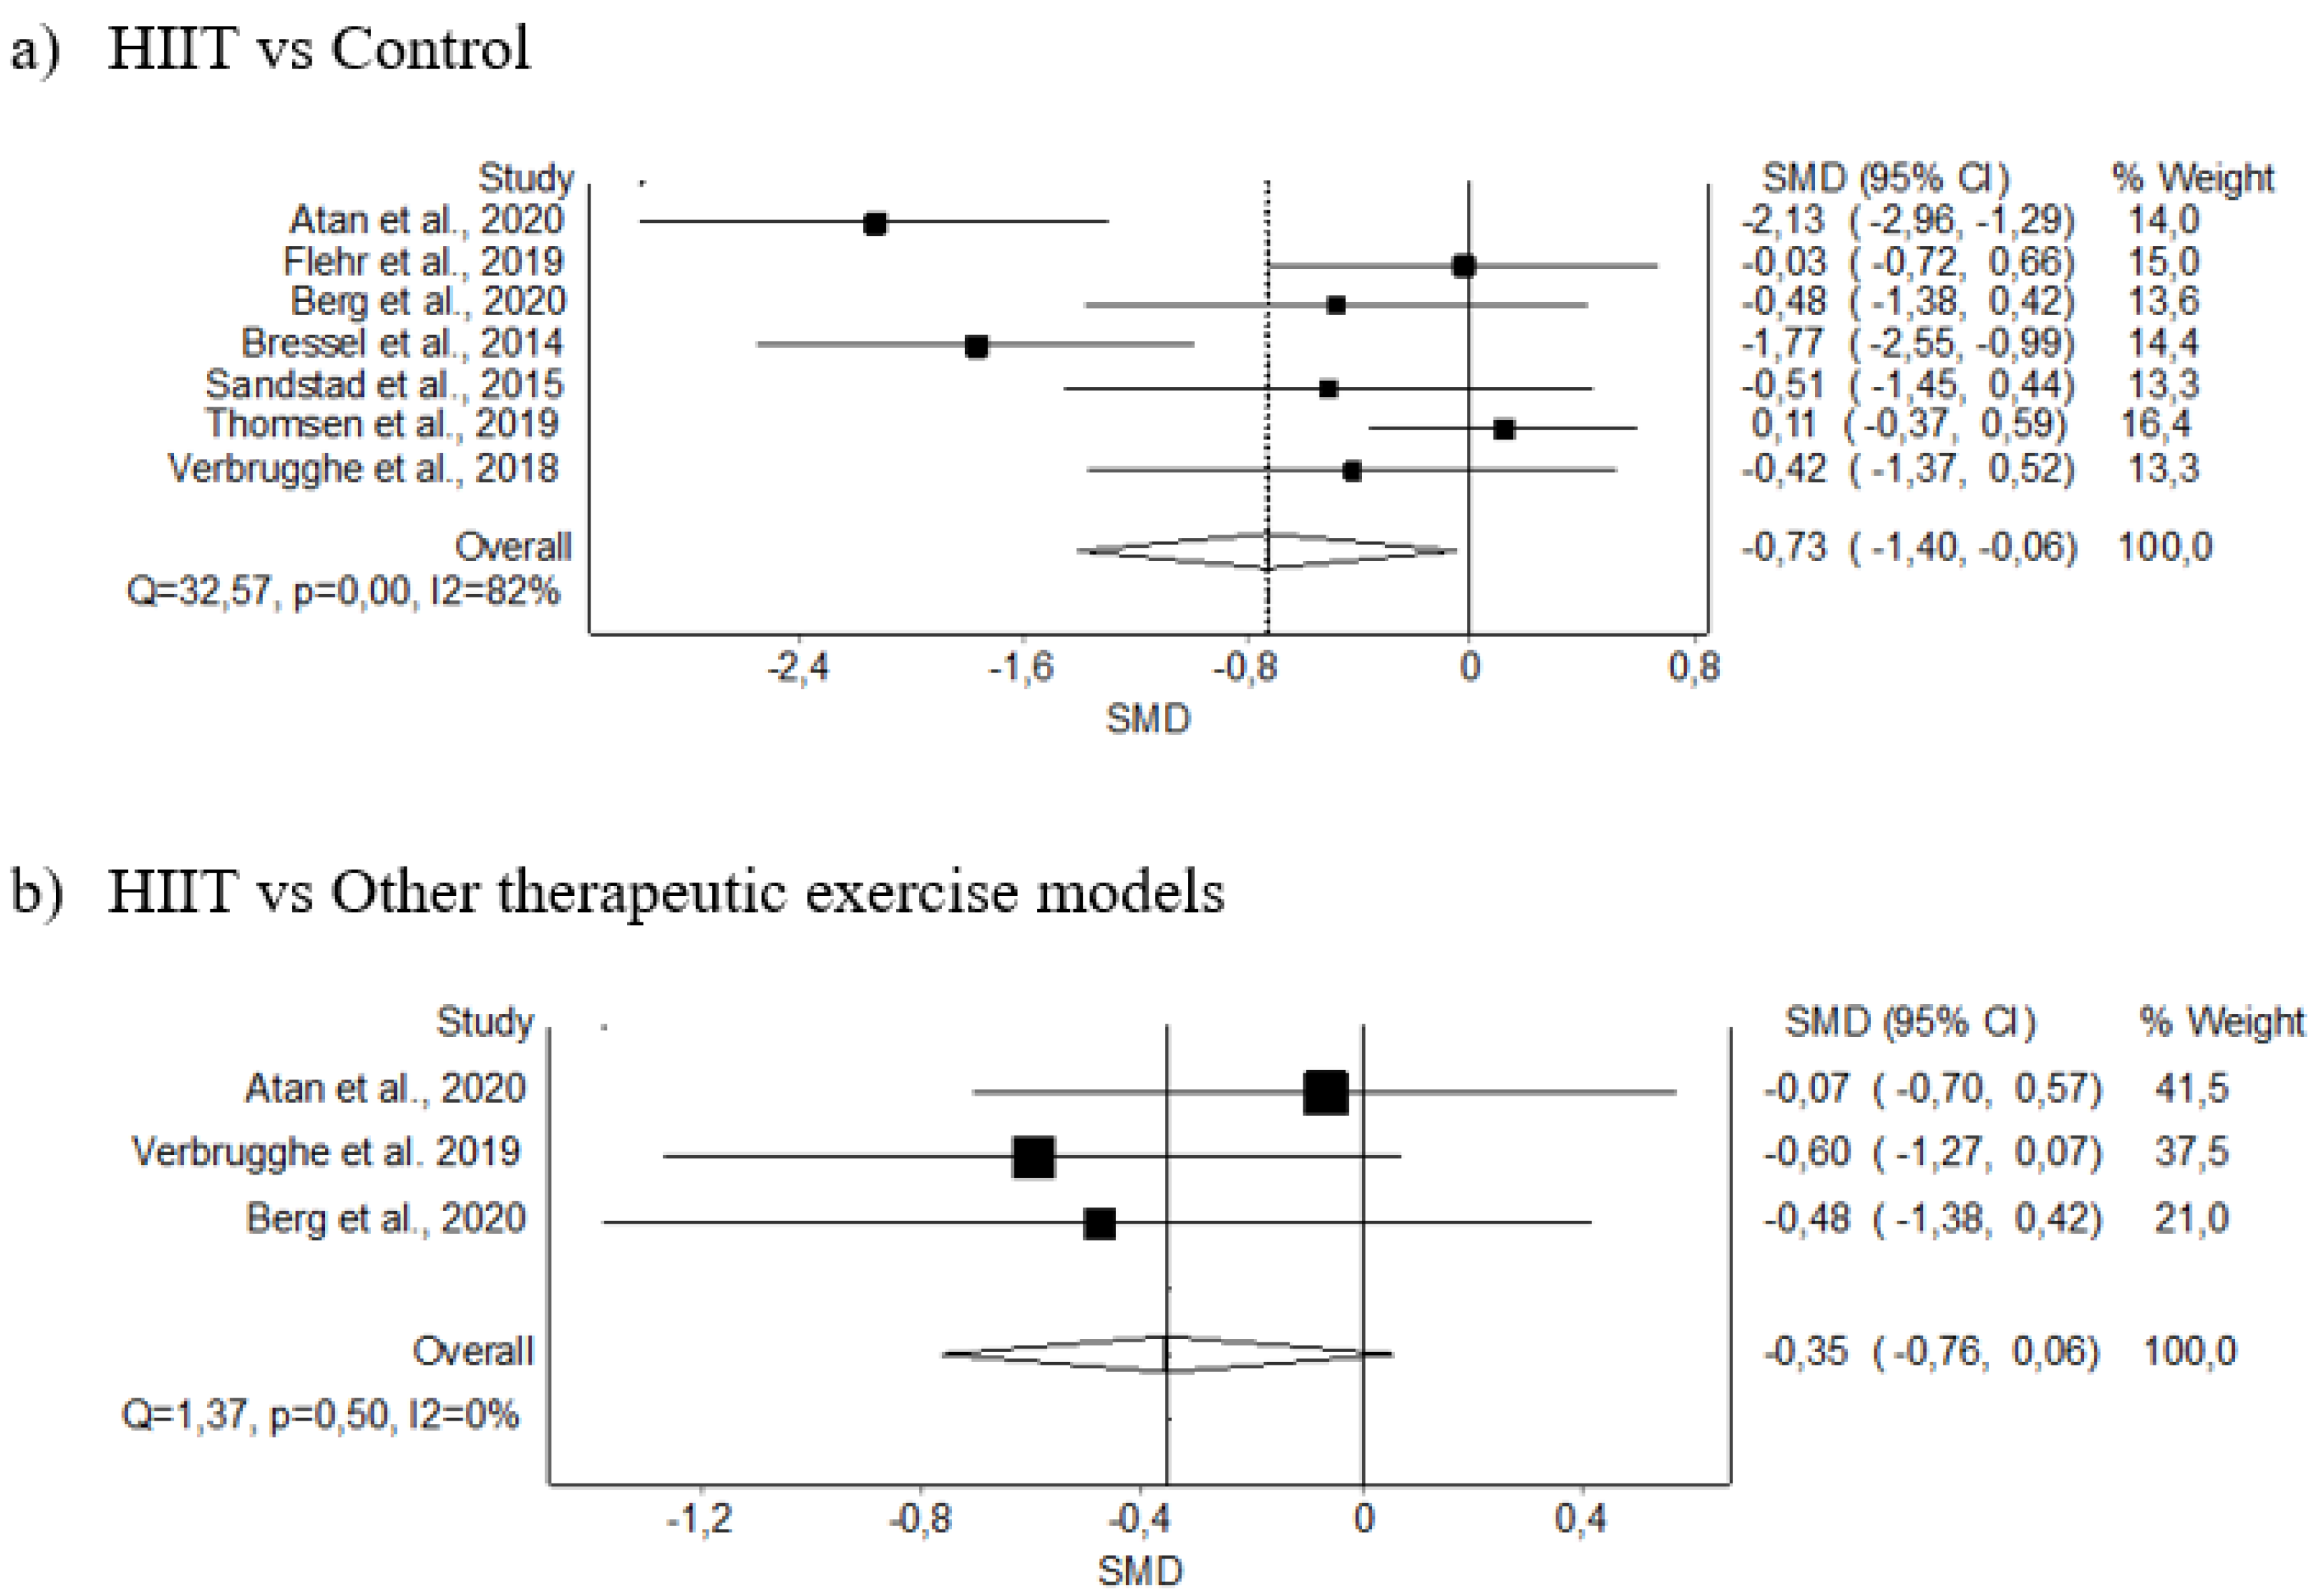
3.5. Meta-Analysis Results
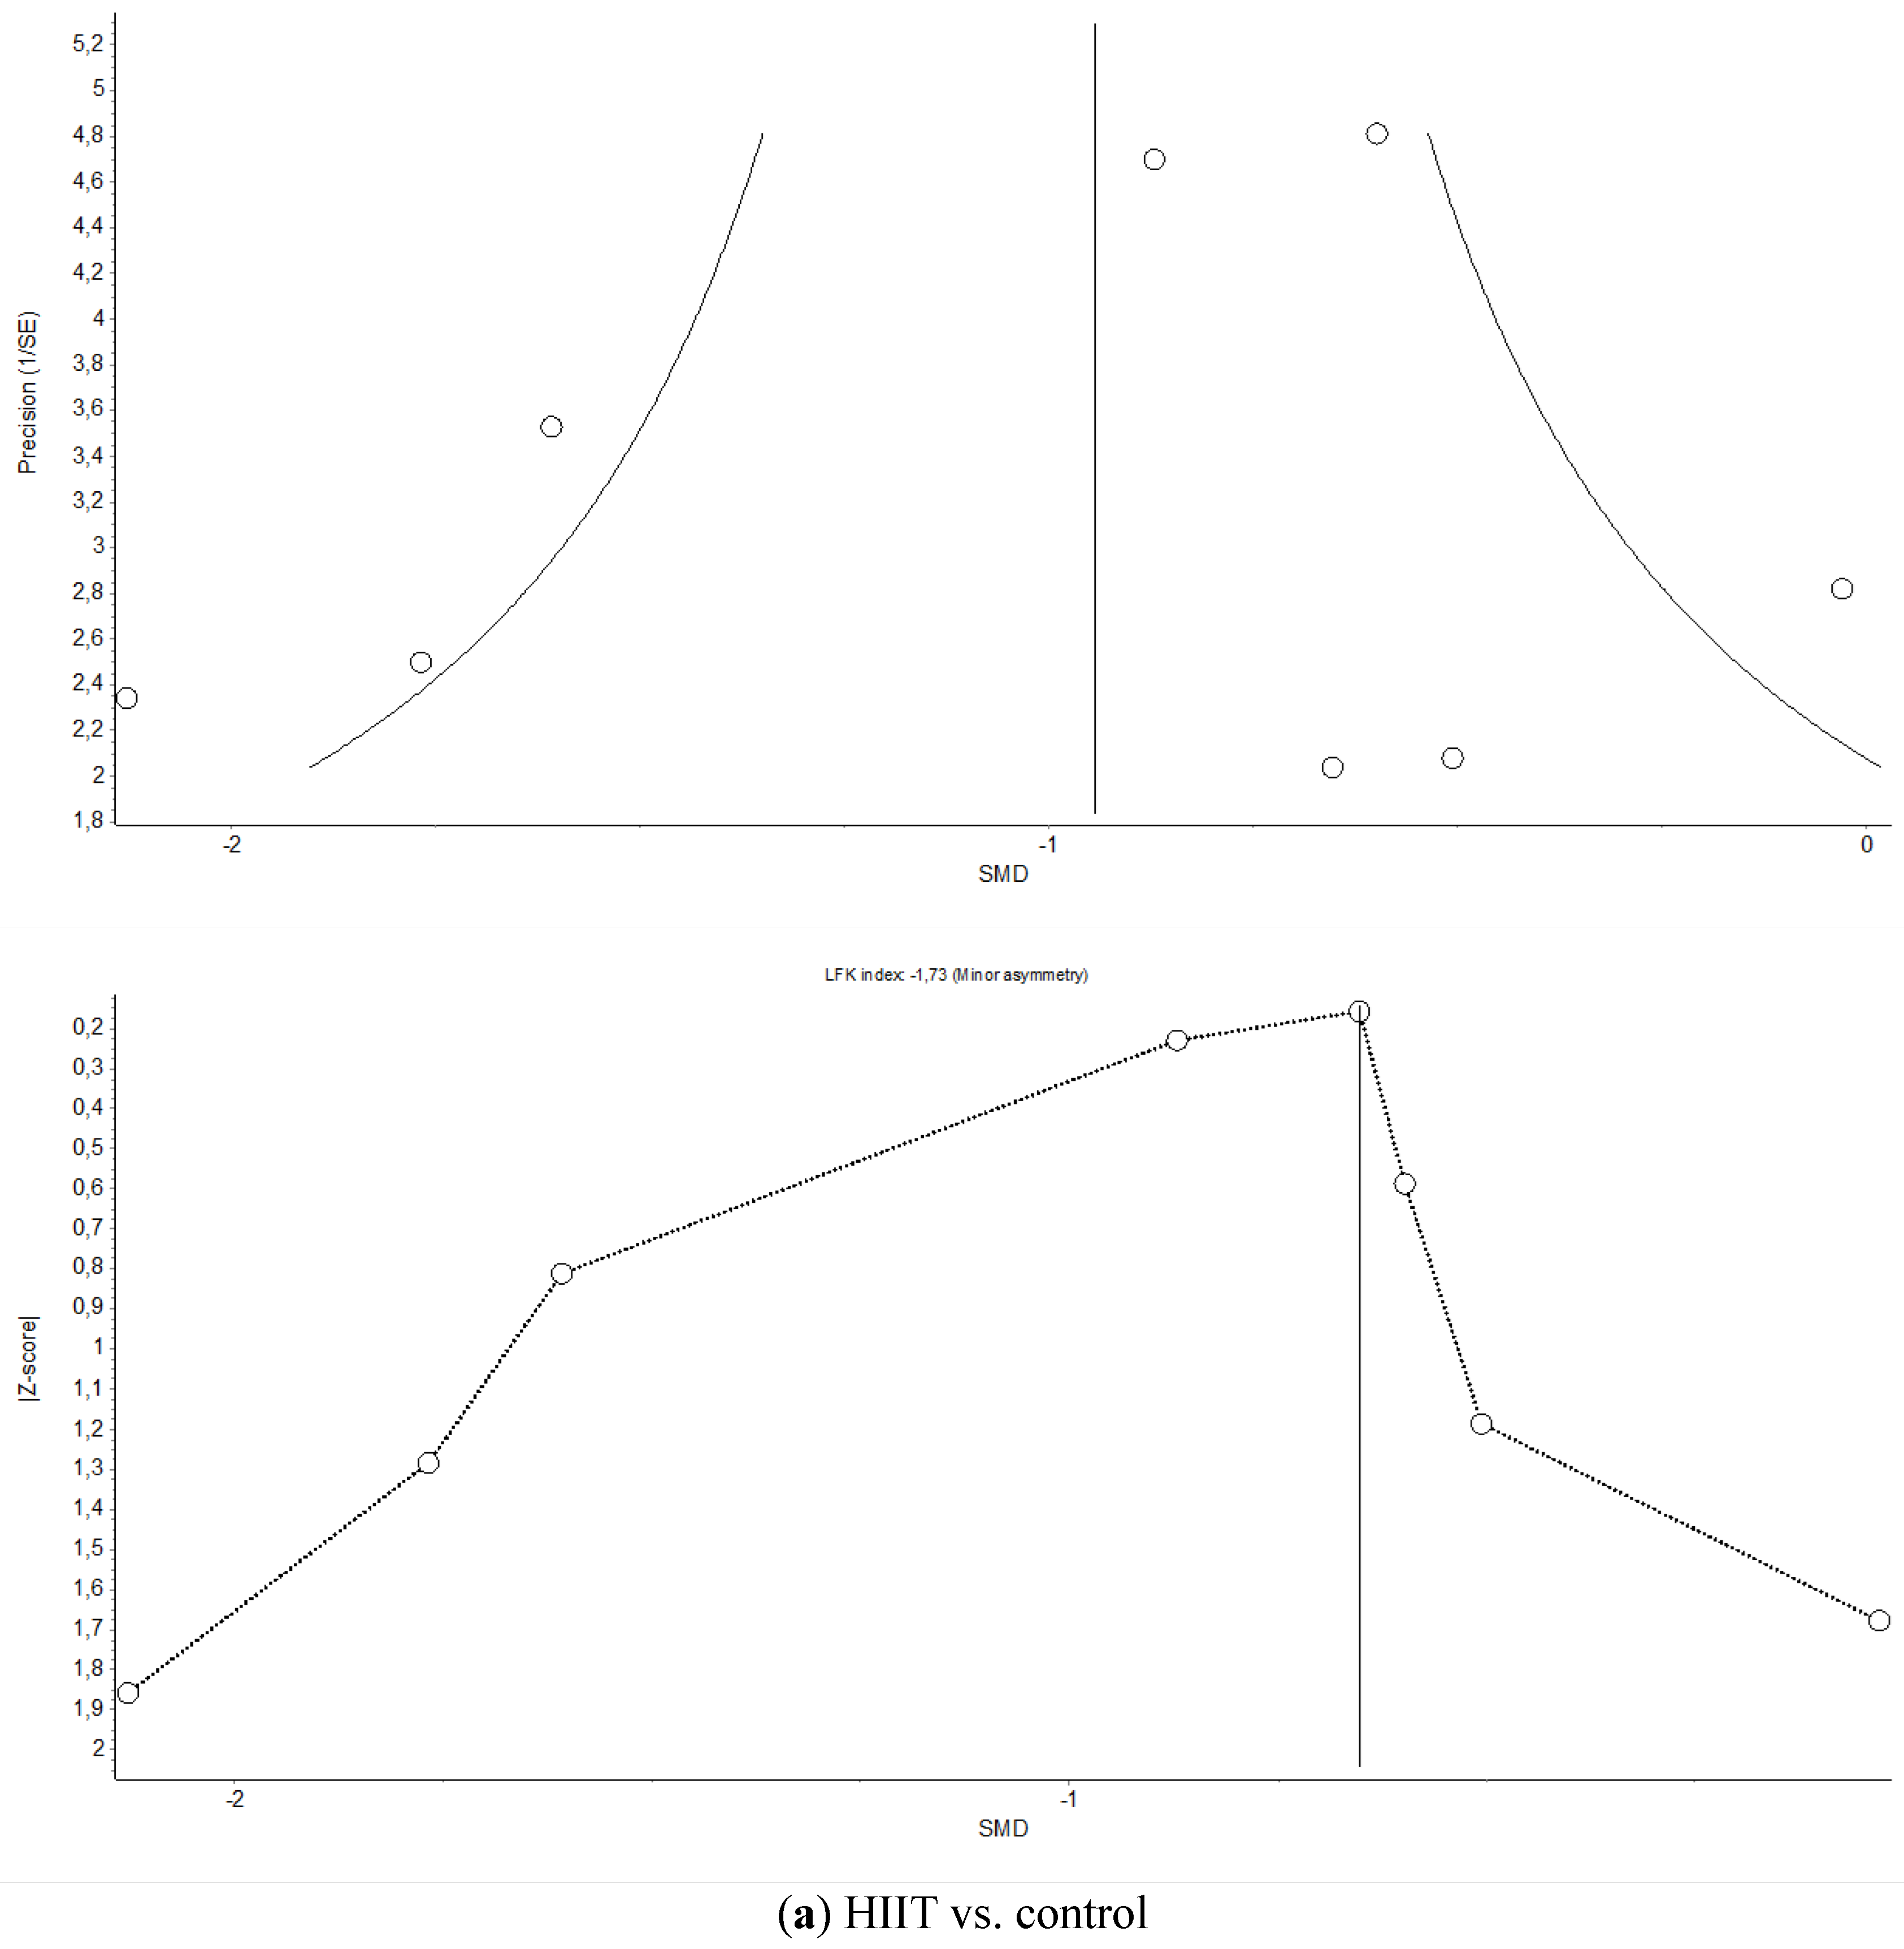
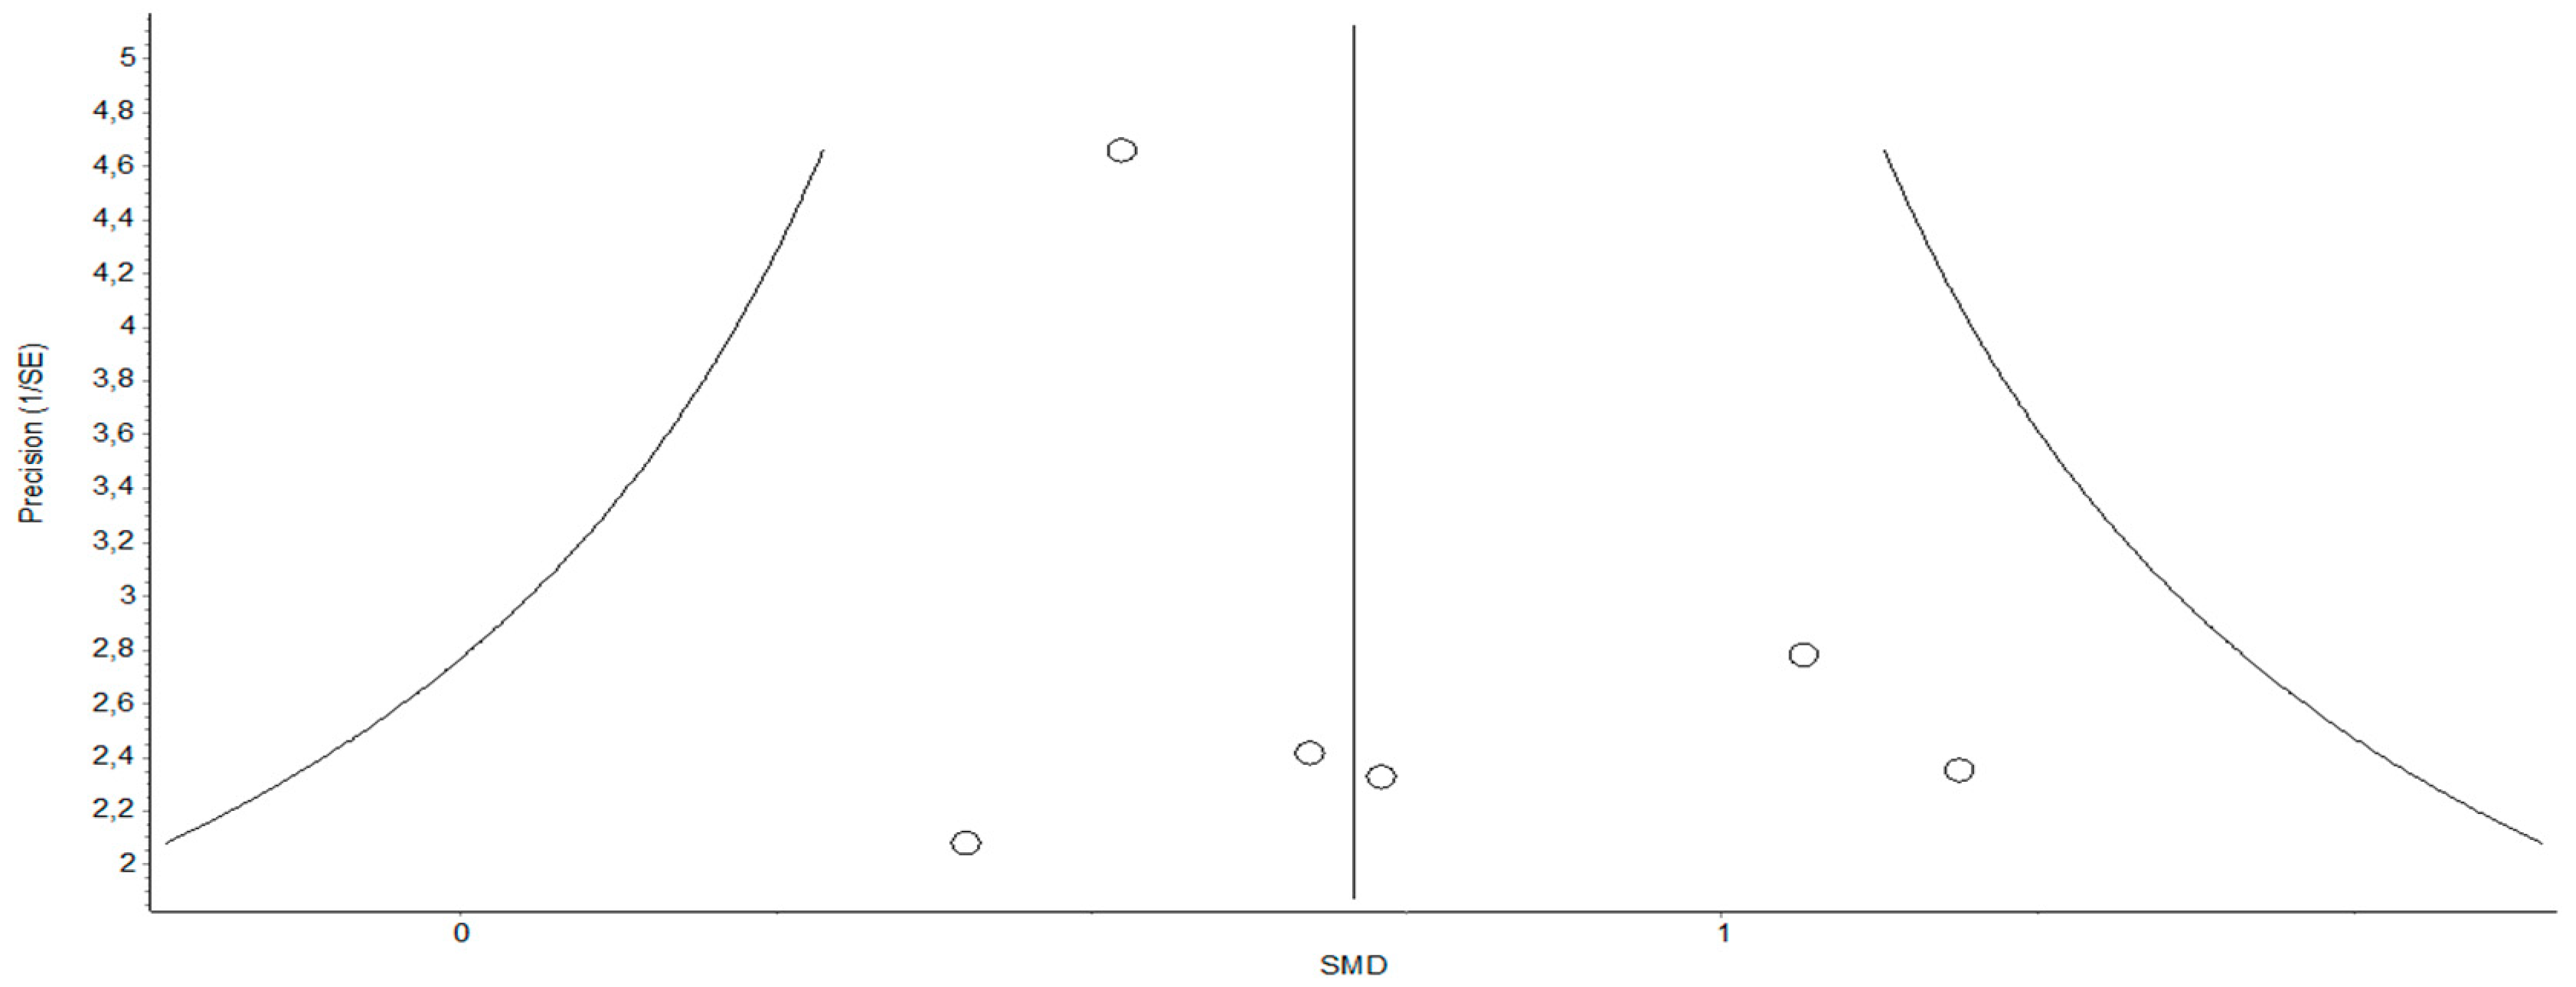
3.5.1. Pain Intensity
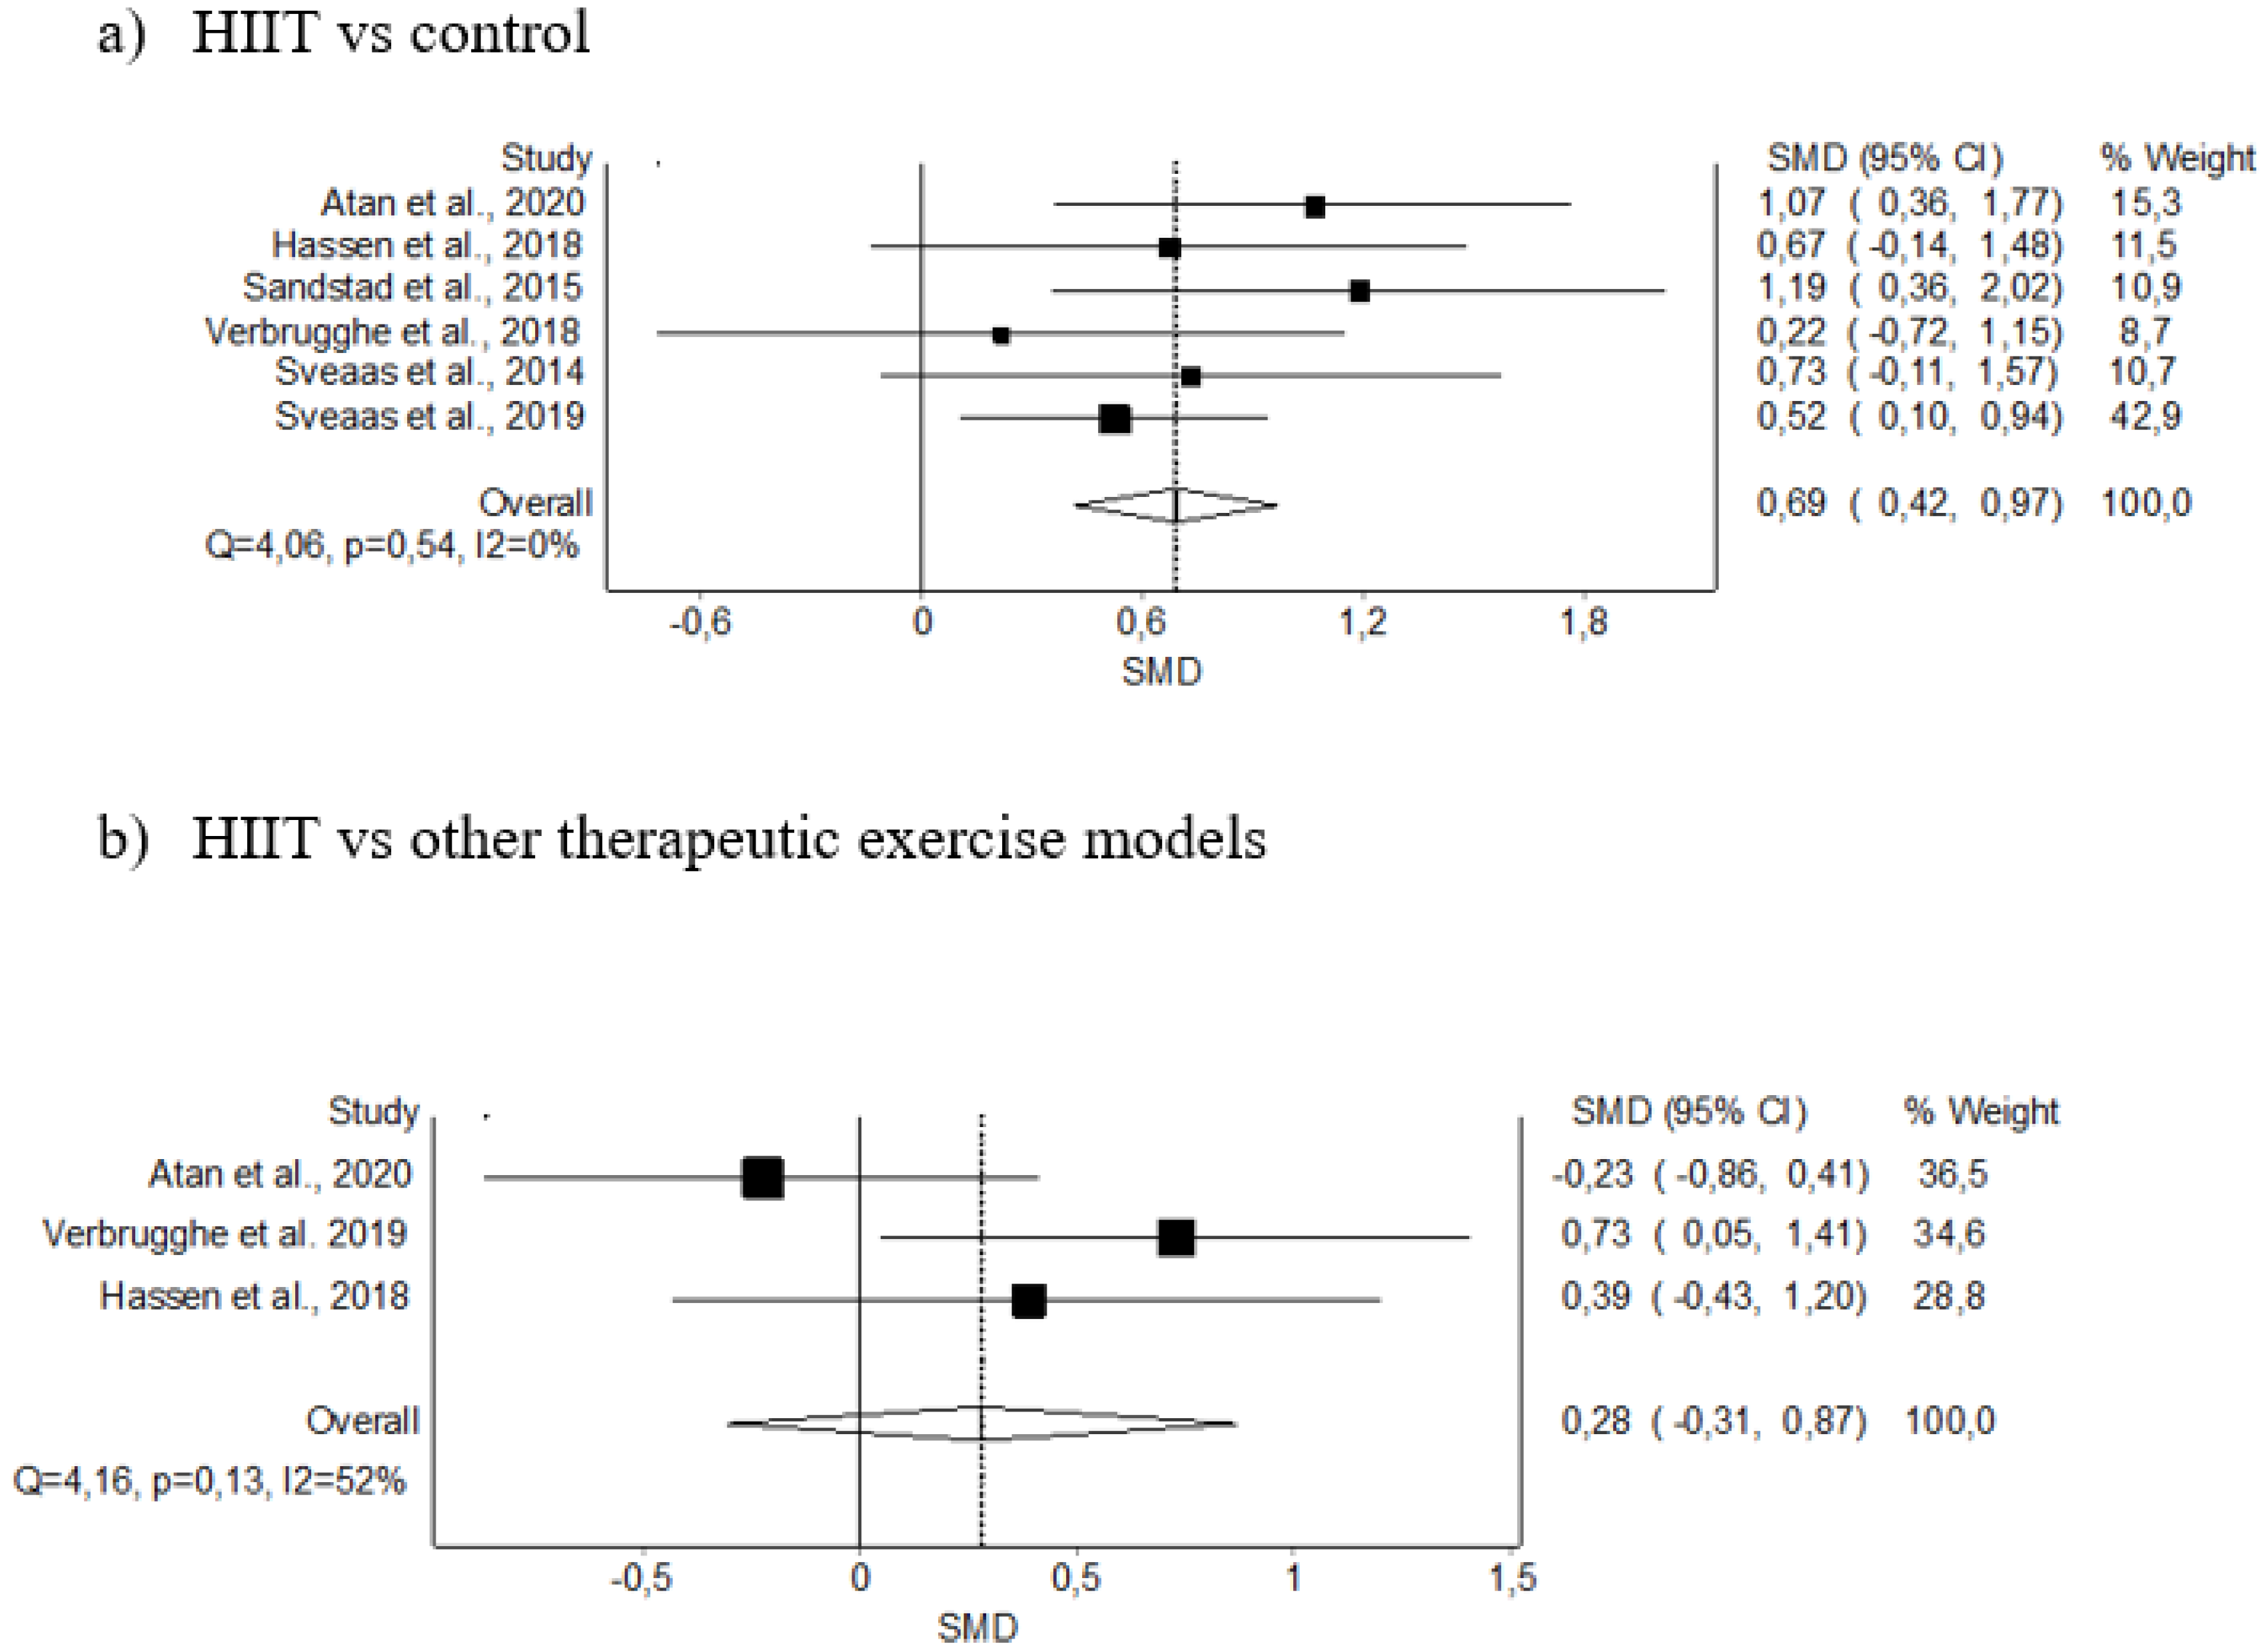
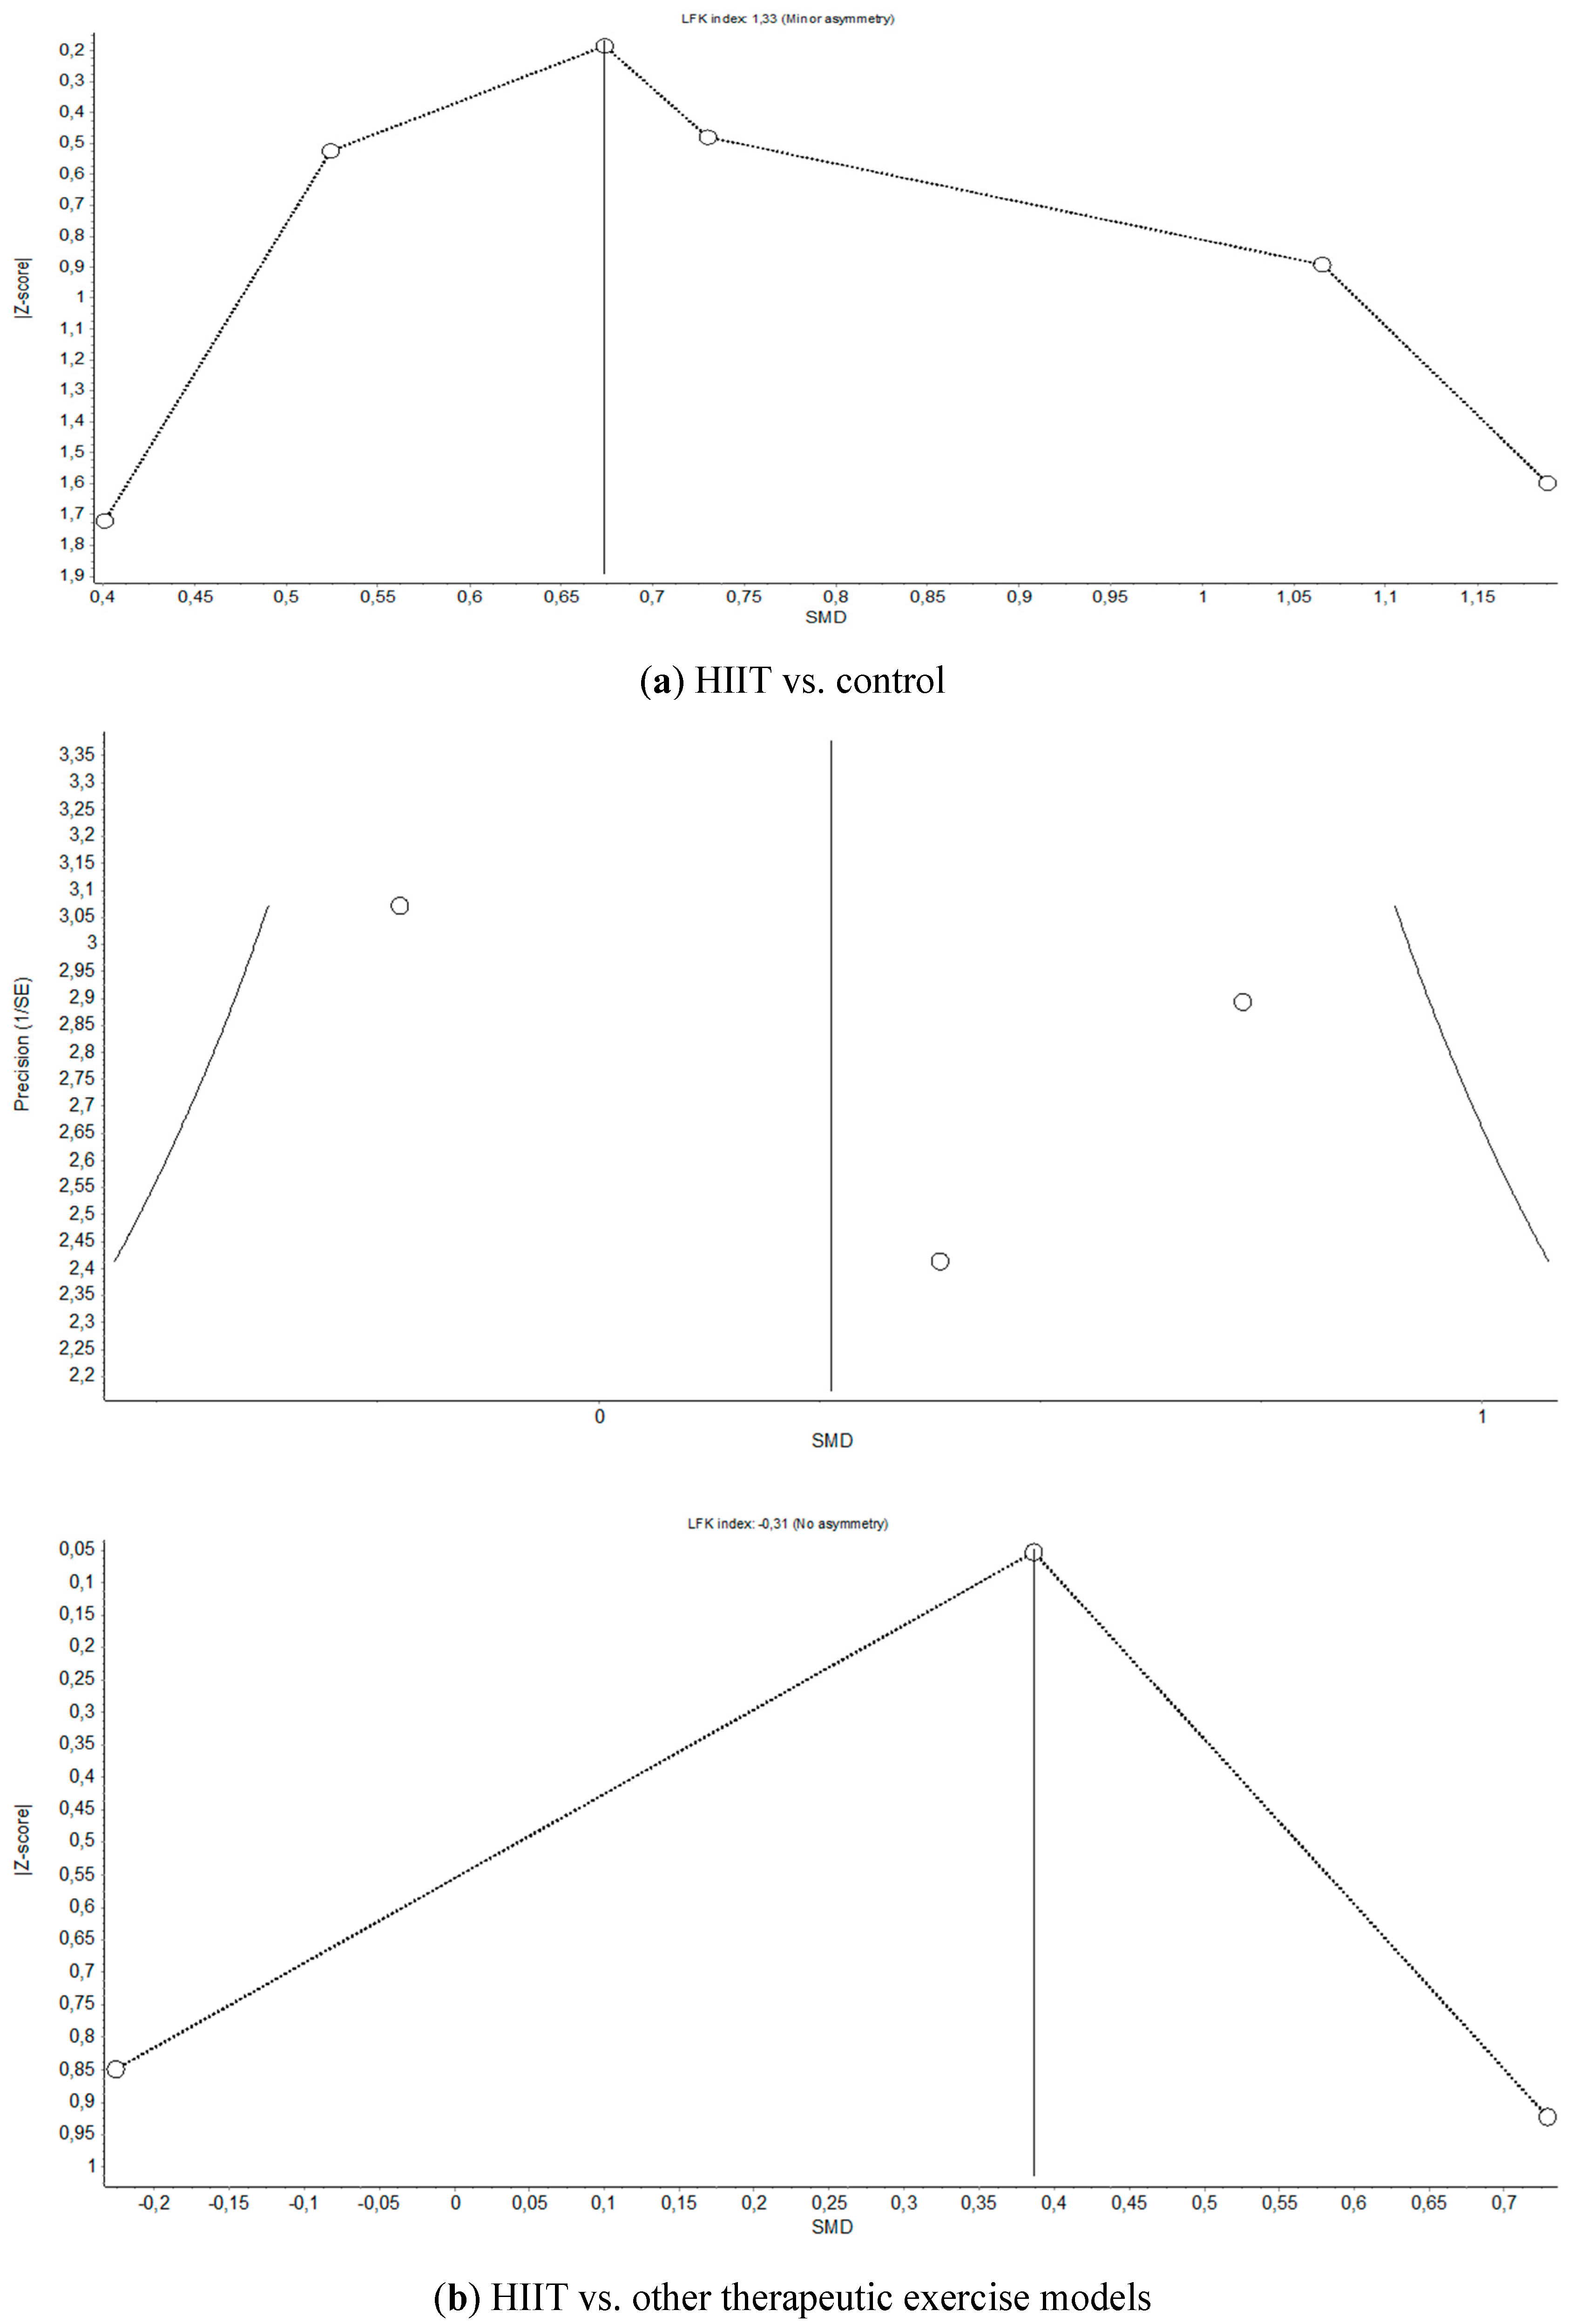
3.5.2. VO2 max
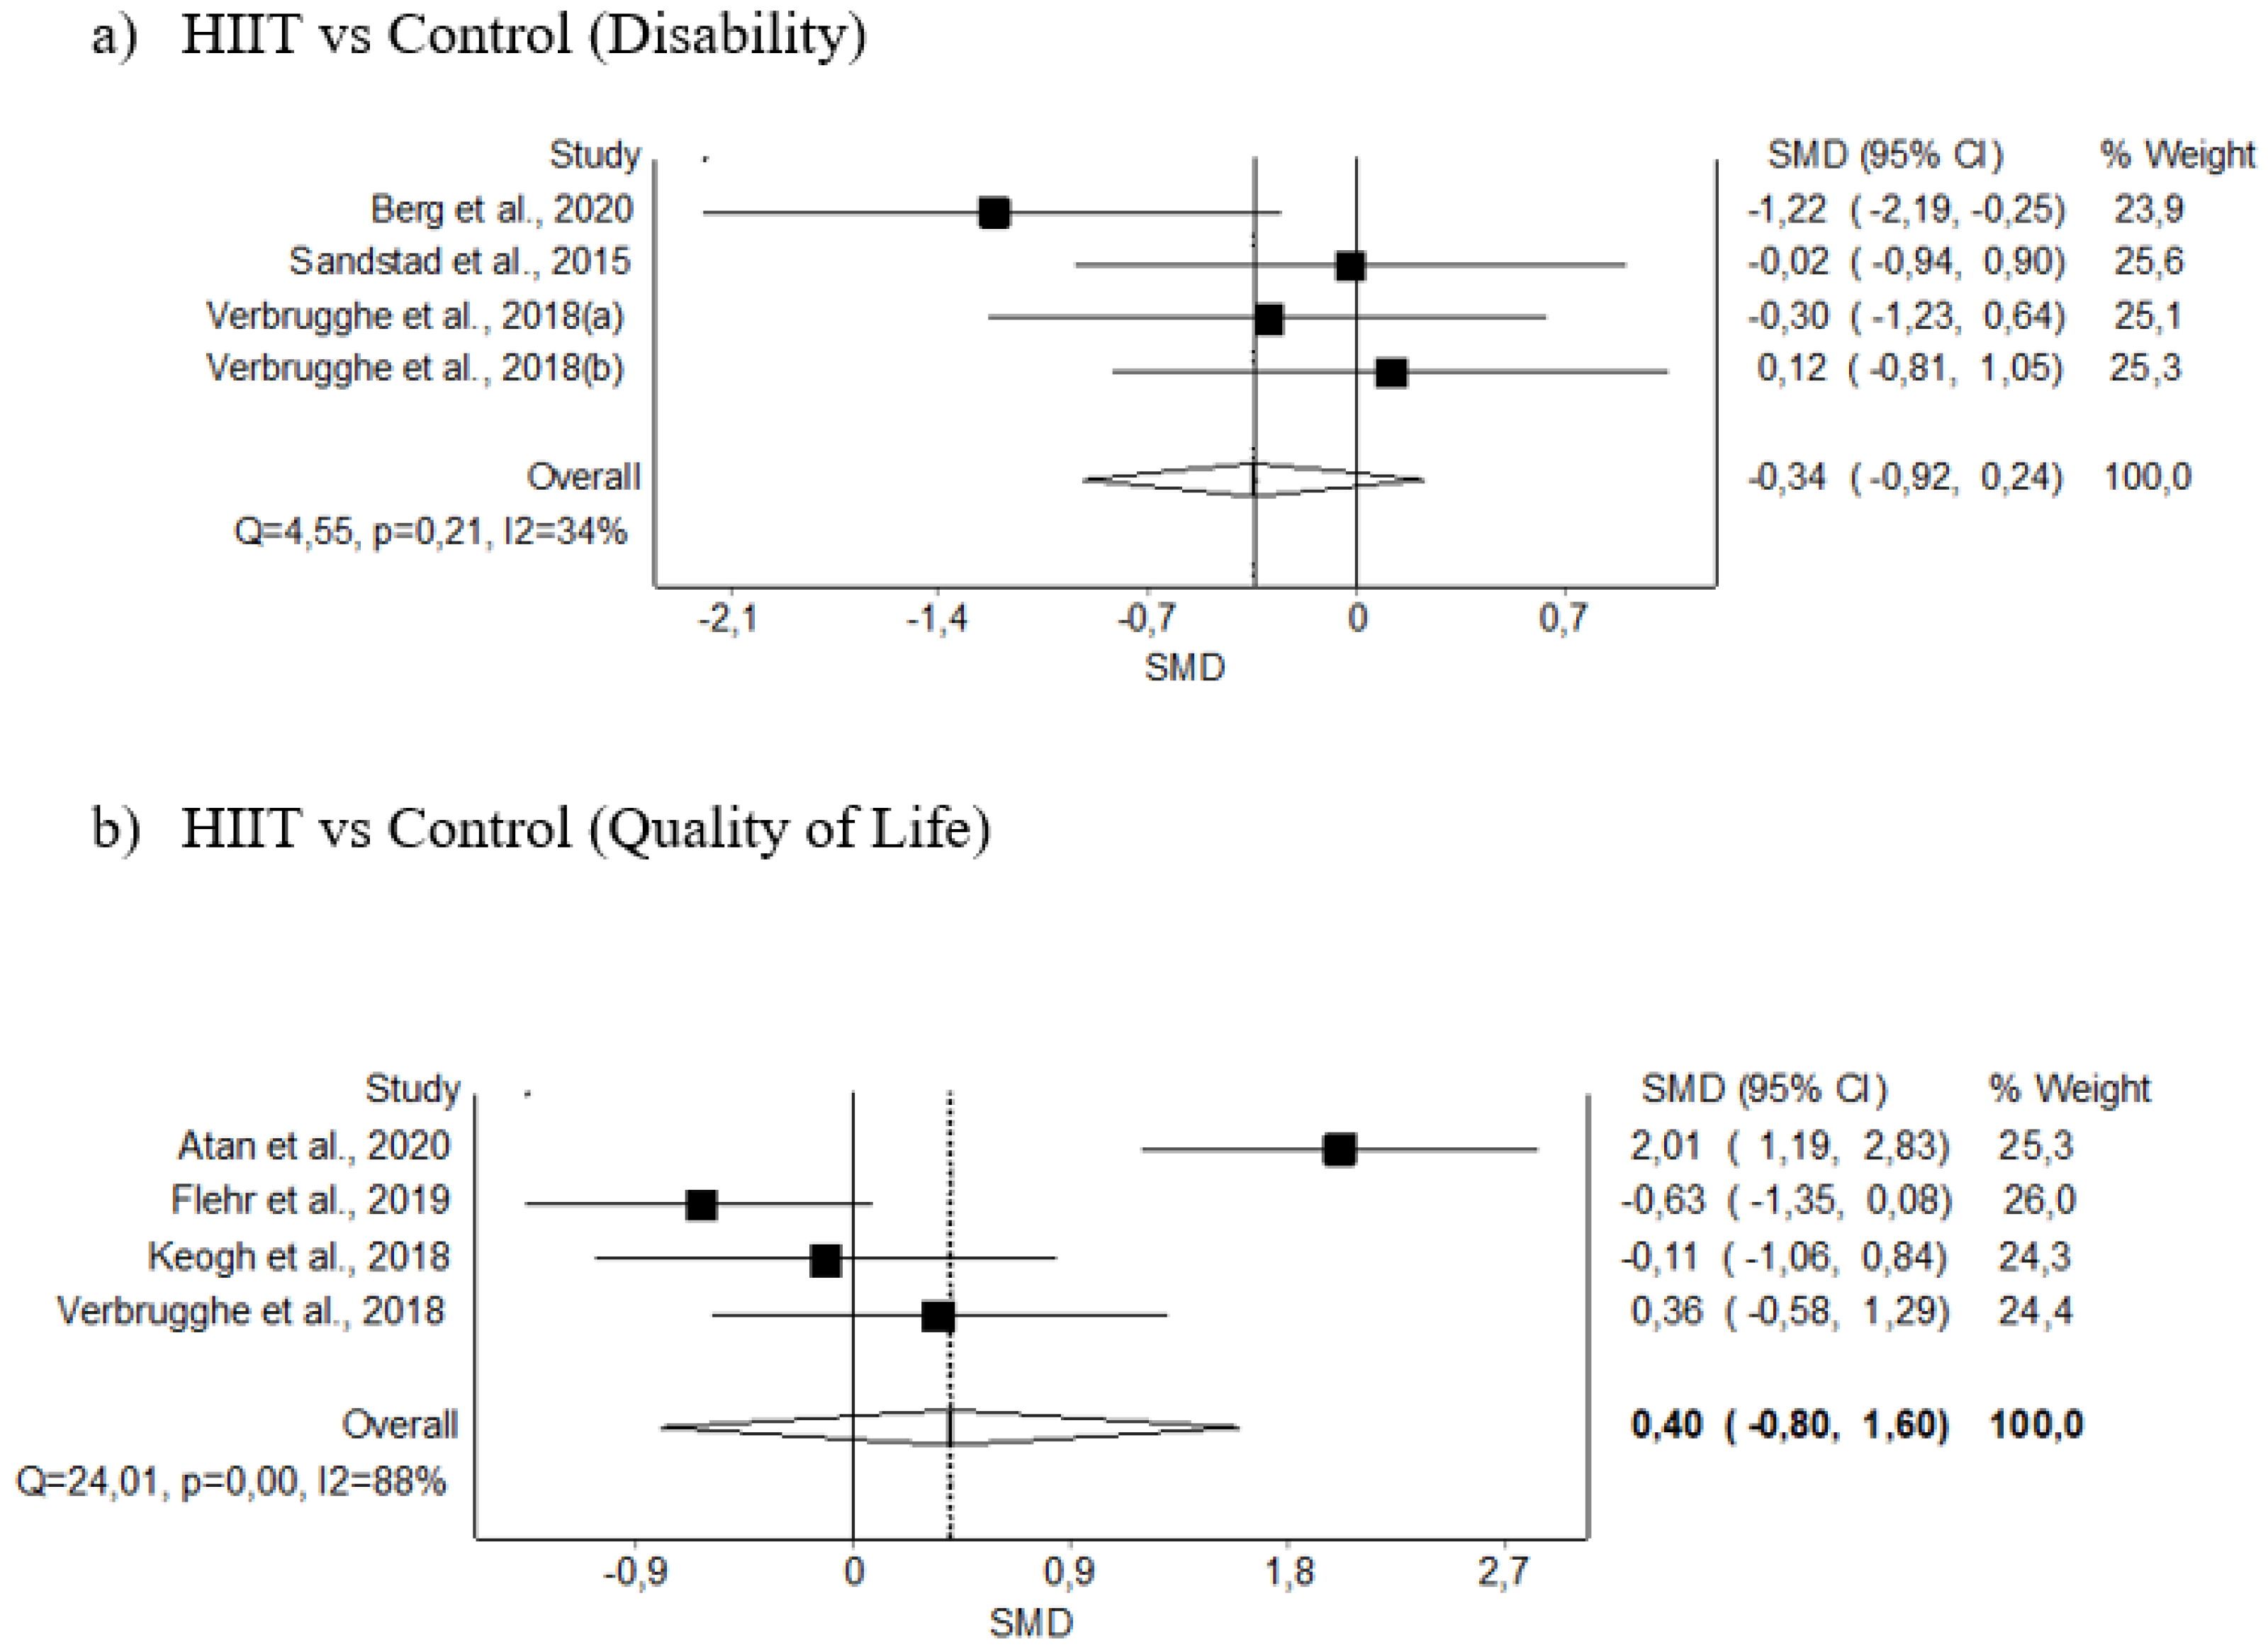
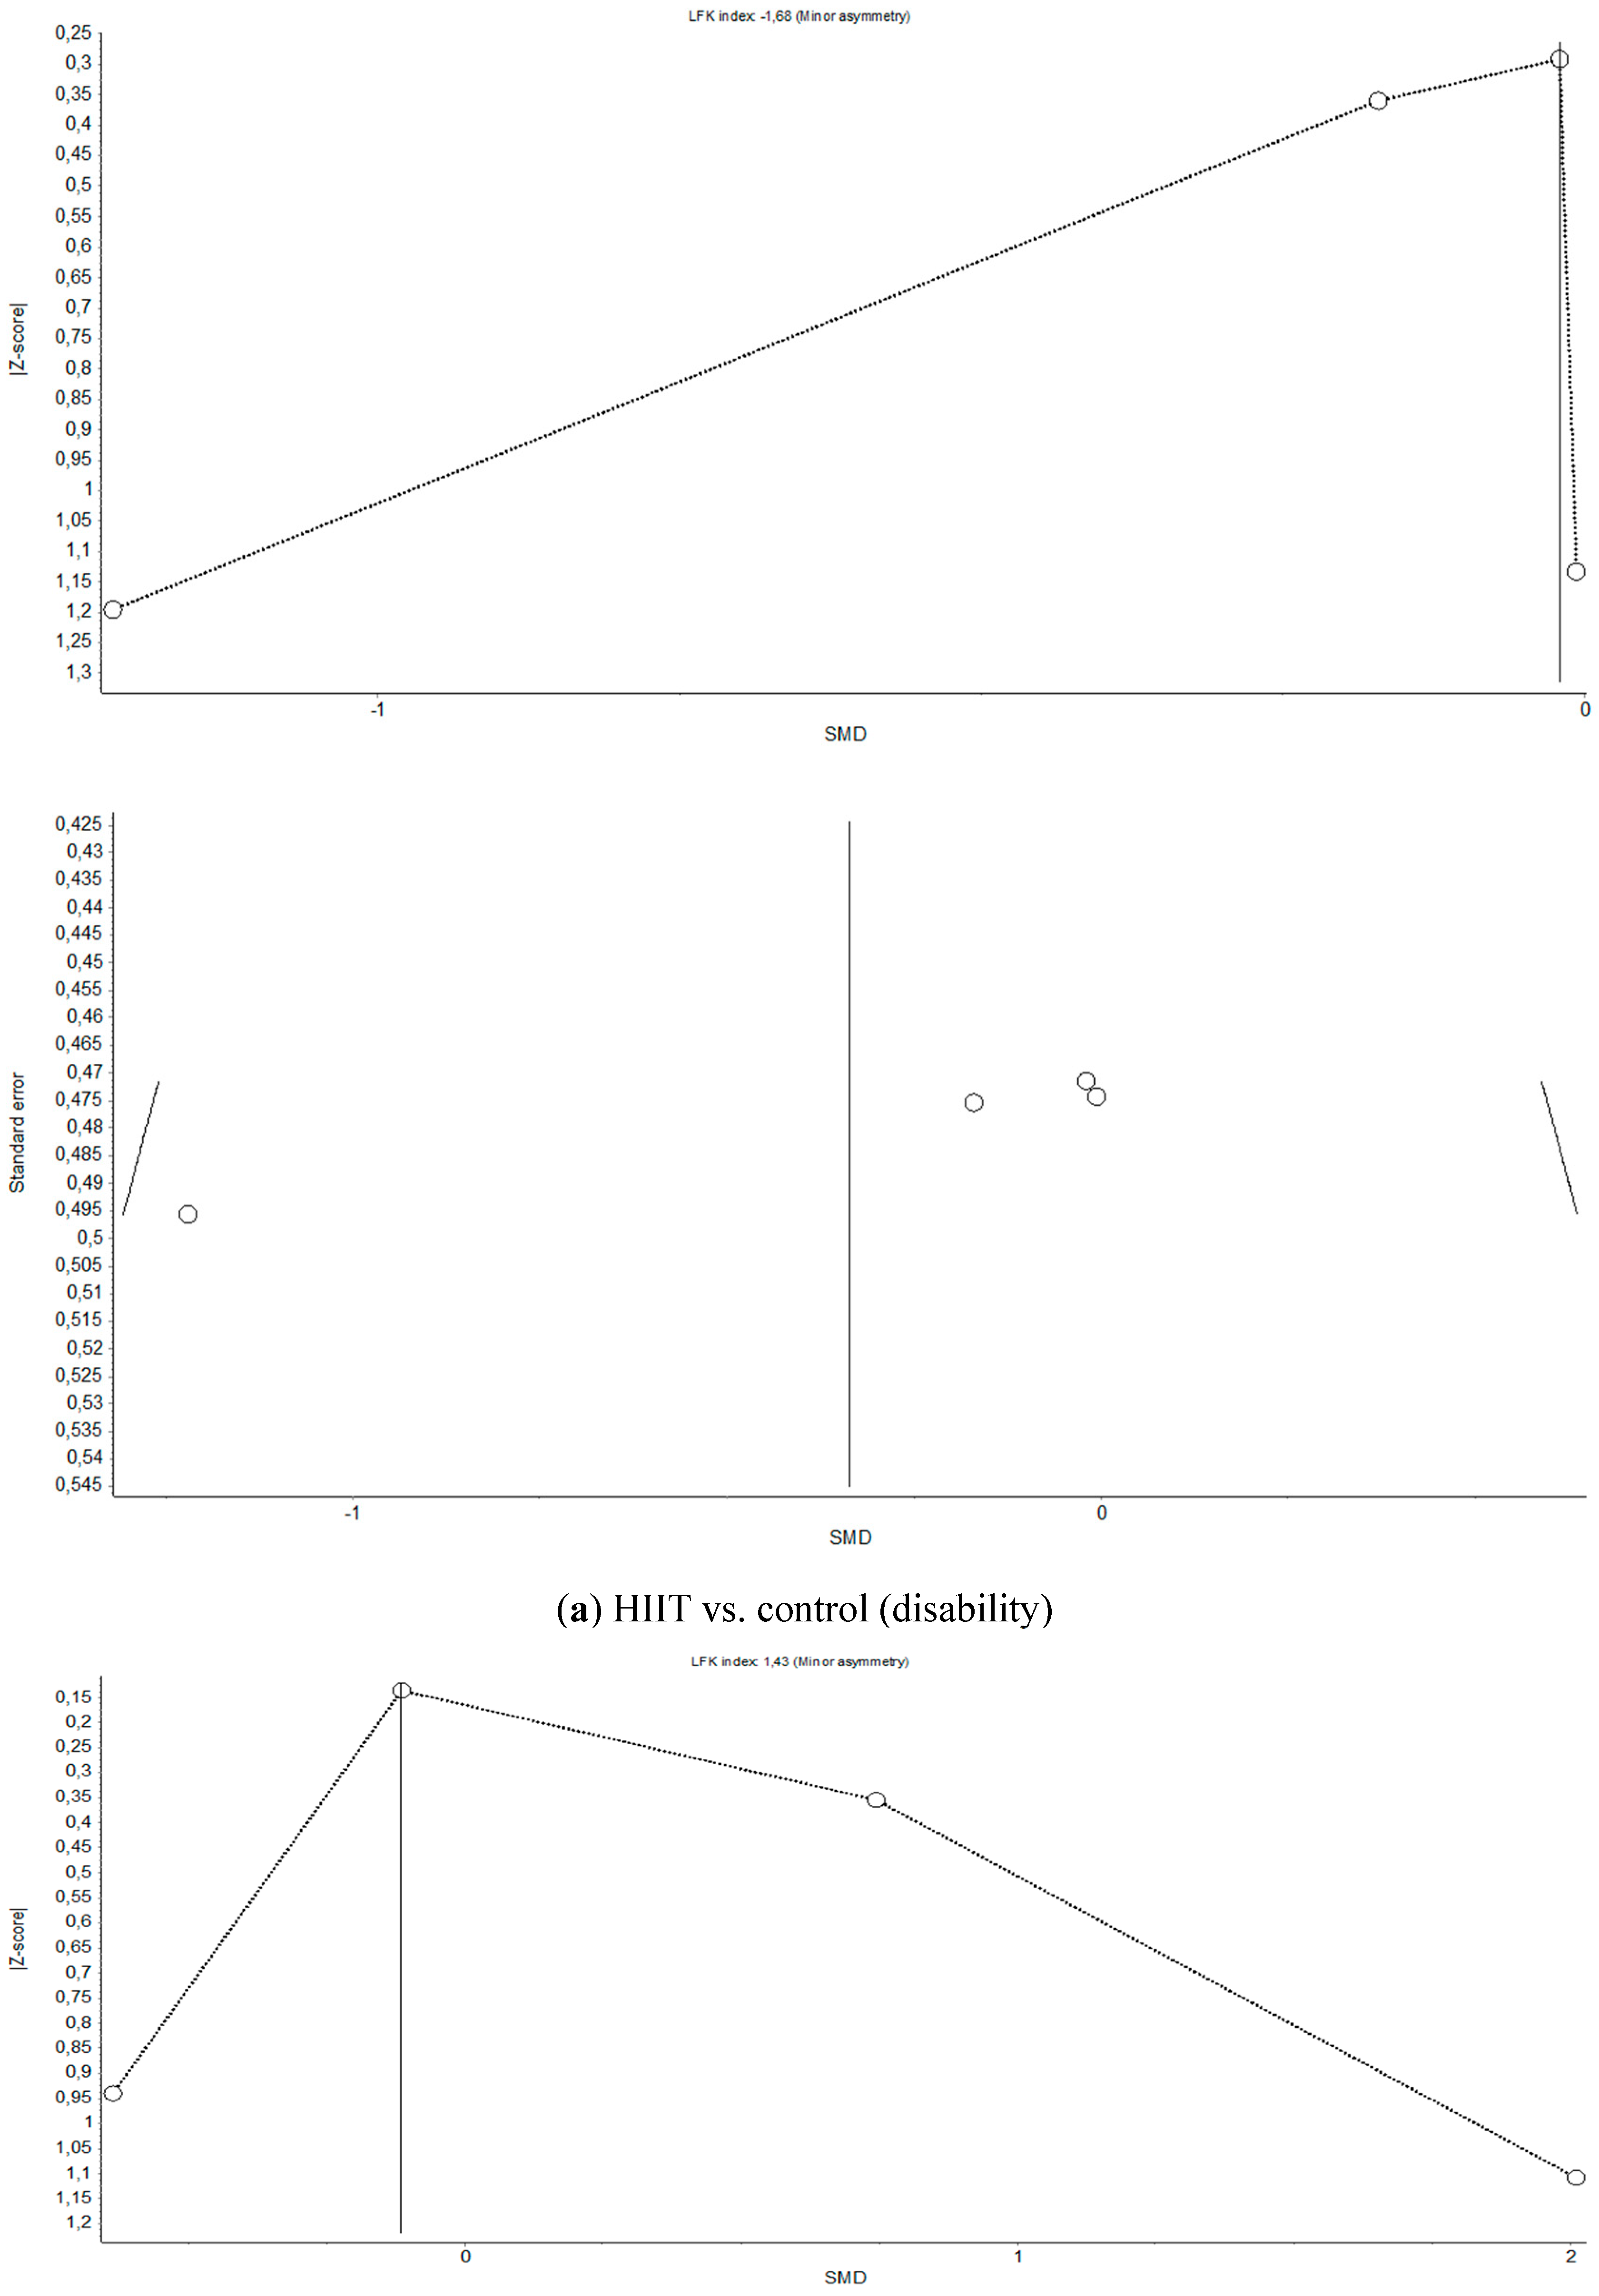
3.5.3. Disability
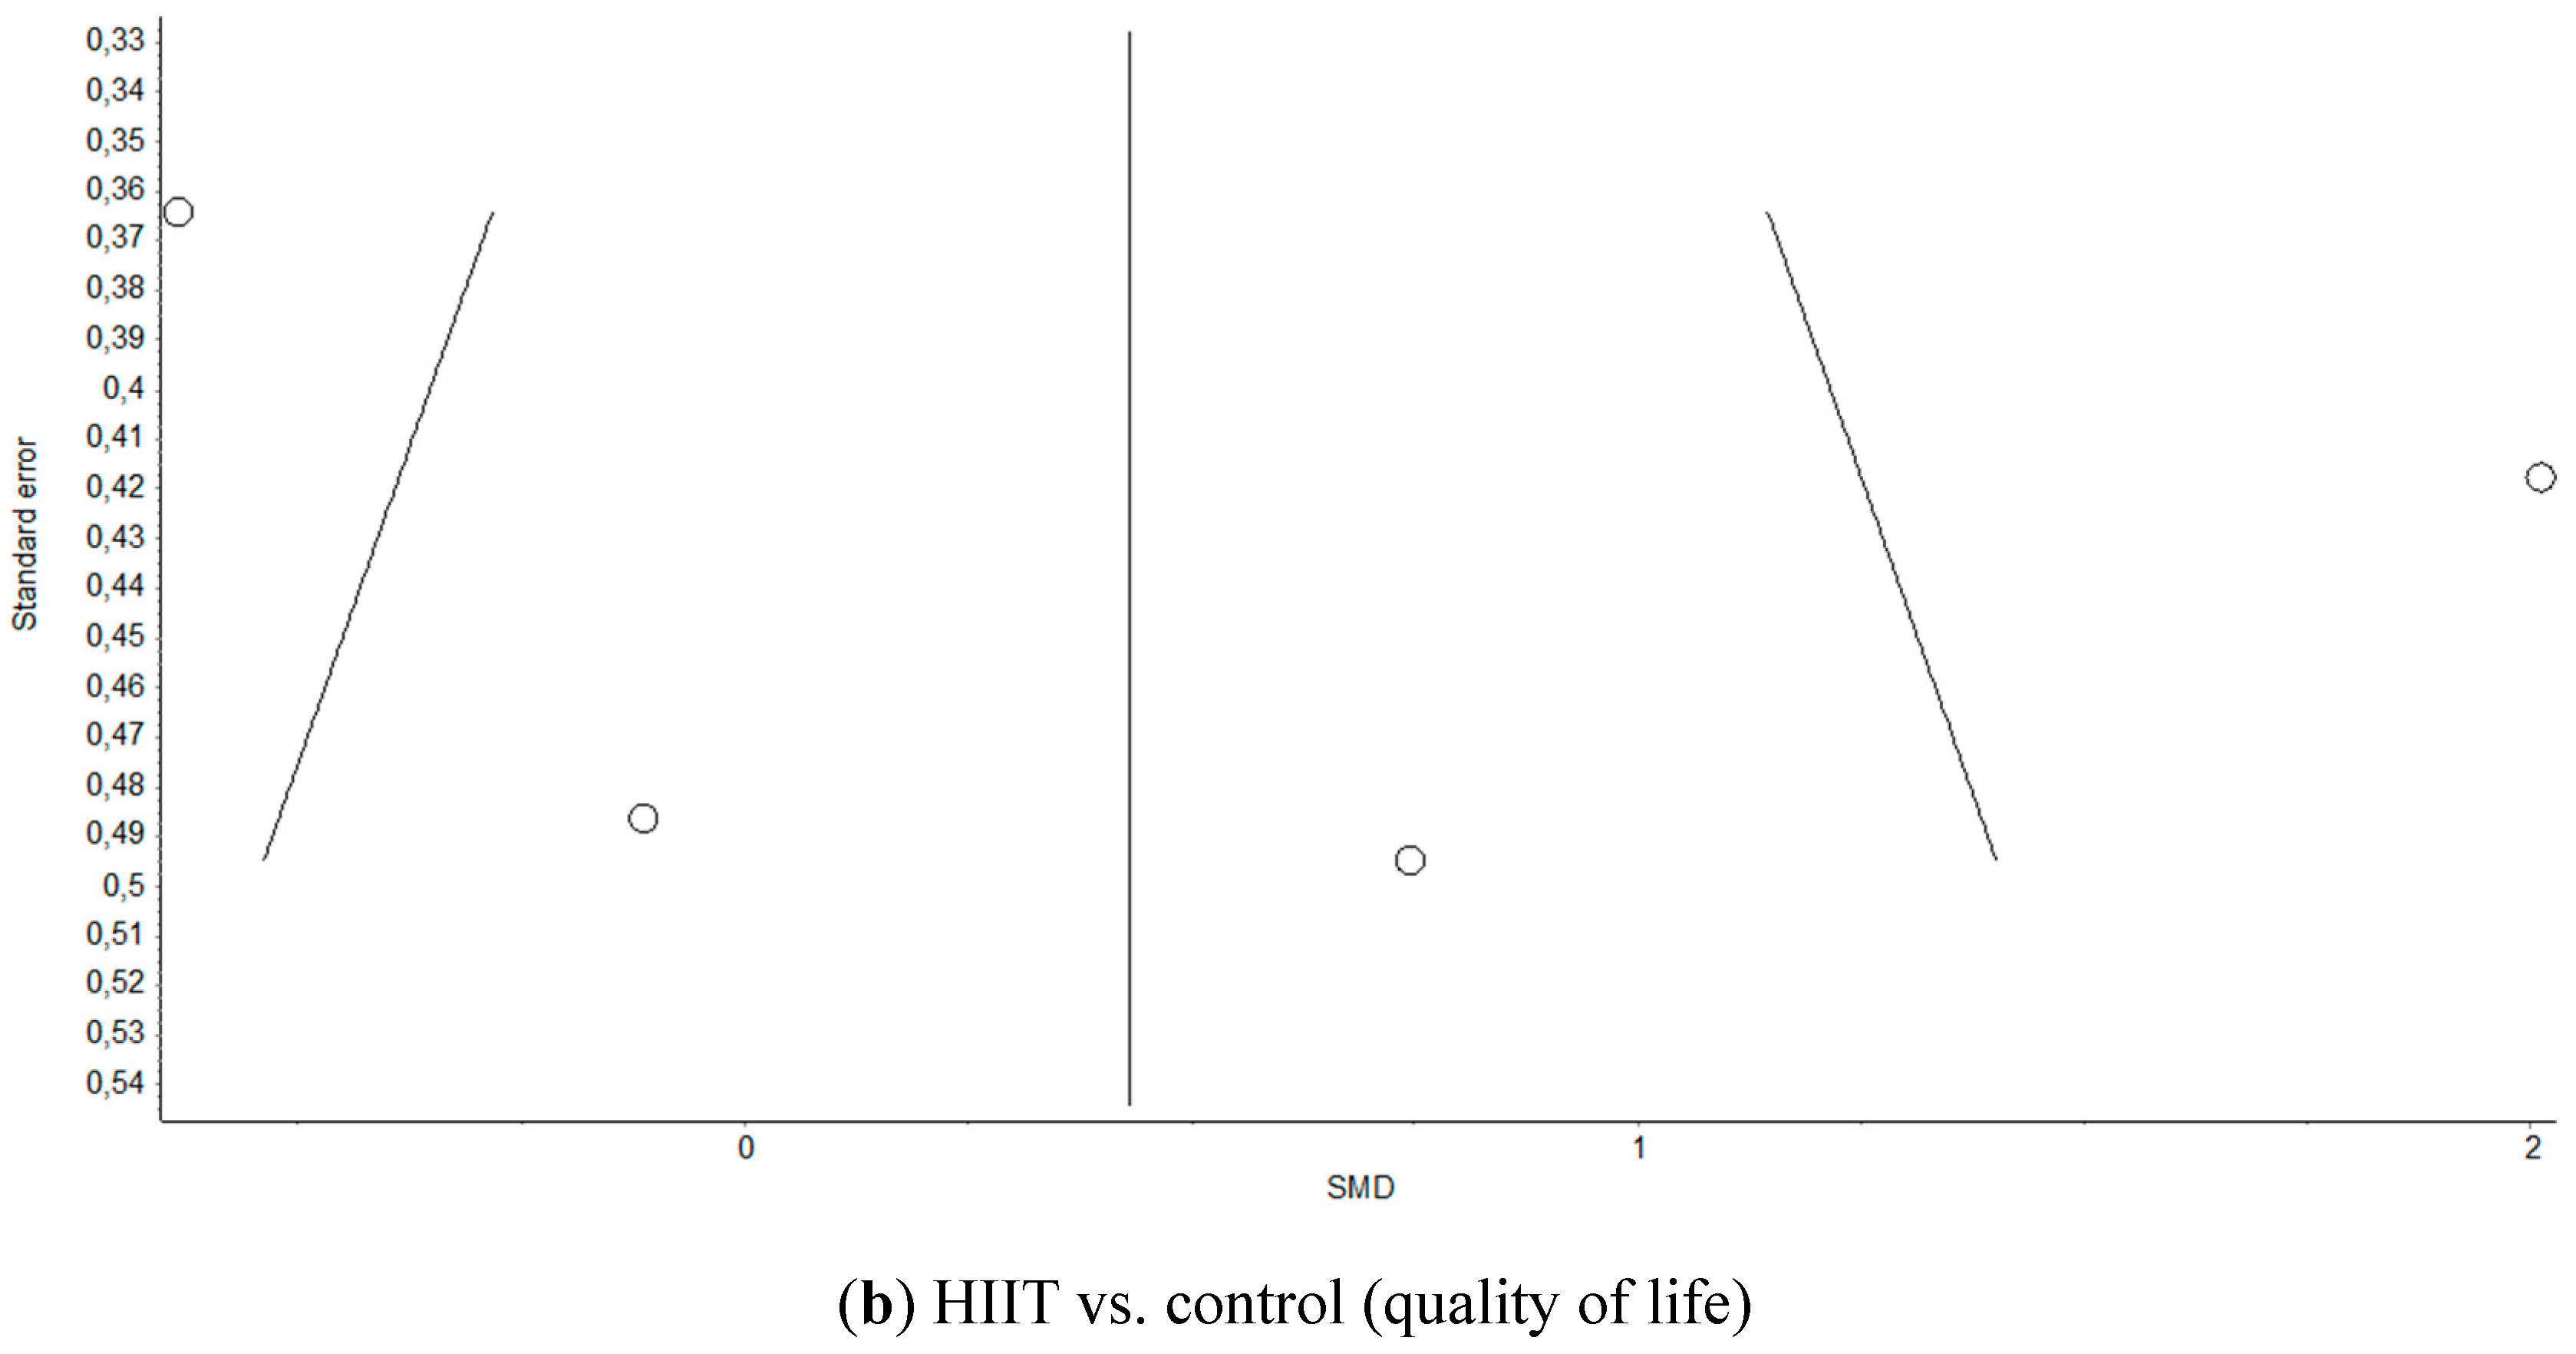
3.5.4. Quality of Life
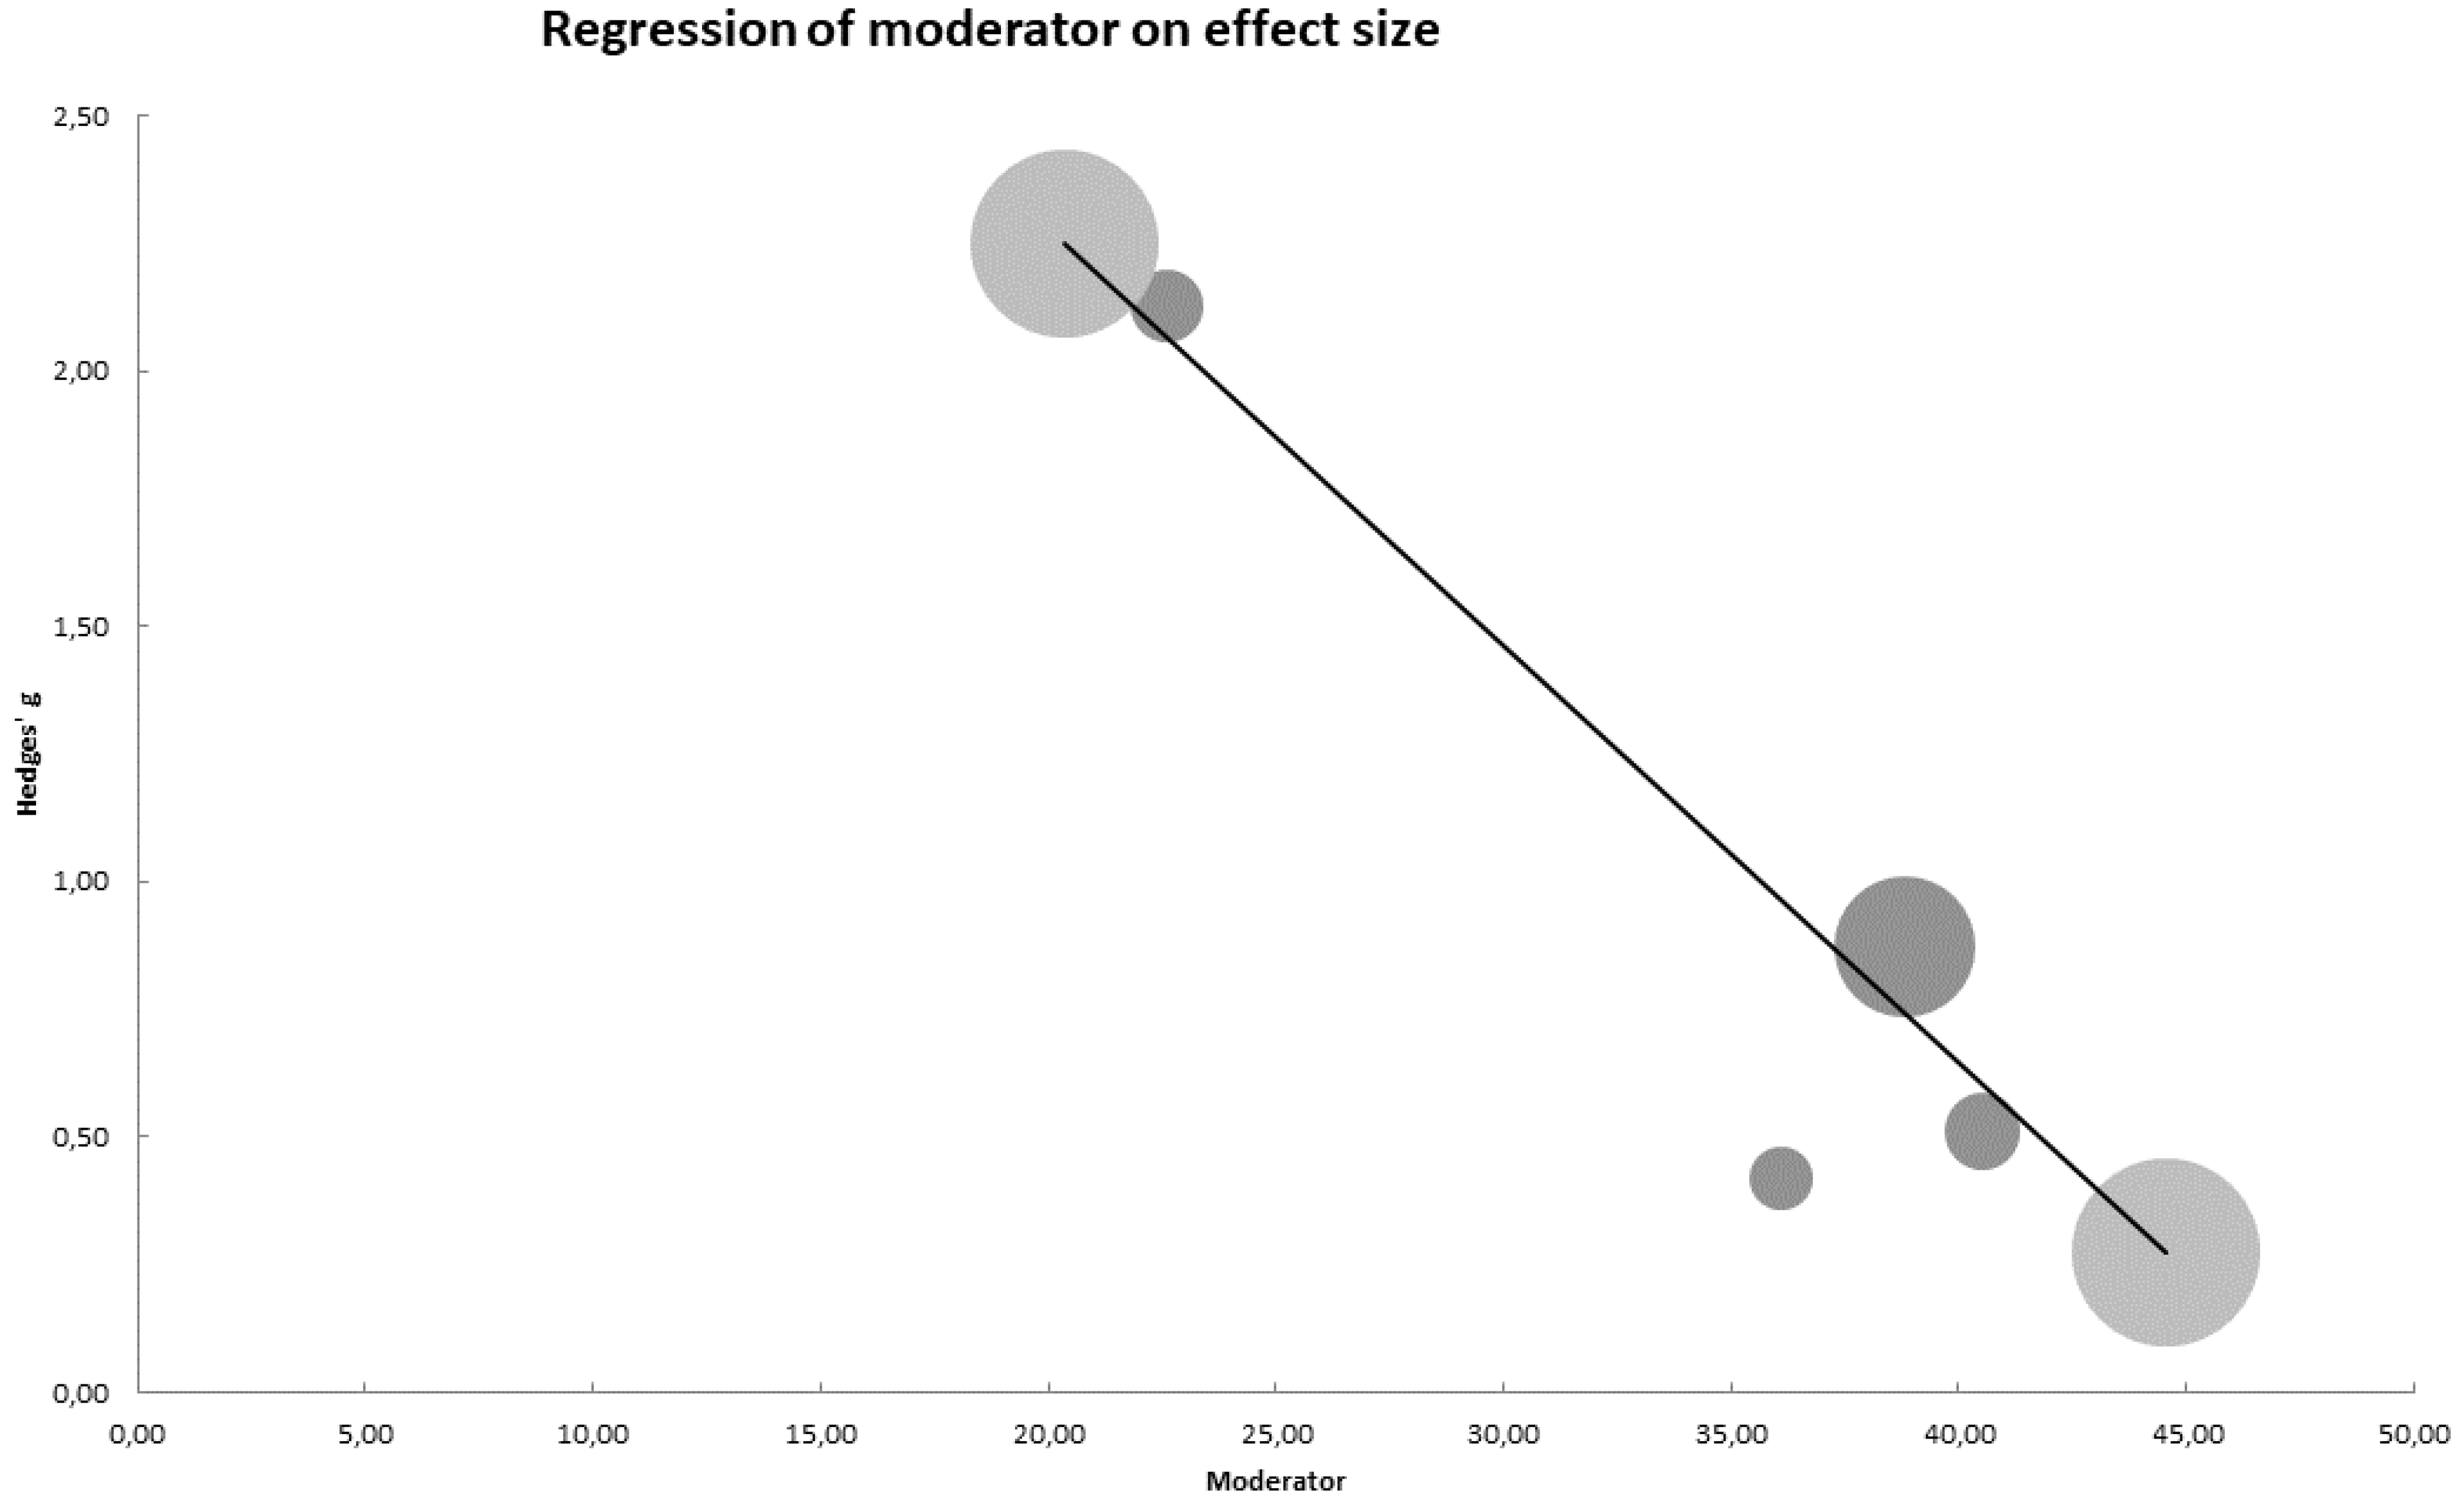
3.6. Meta-Regression Analysis
4. Discussion
Limitations
5. Conclusions
Author Contributions
Funding
Institutional Review Board Statement
Informed Consent Statement
Data Availability Statement
Acknowledgments
Conflicts of Interest
Appendix A


Appendix B


Appendix C


References
- Picavet, H.S.J.; Schouten, J.S.A.G. Musculoskeletal pain in the Netherlands: Prevalences, consequences and risk groups, the DMC3-study. Pain 2003, 102, 167–178. [Google Scholar] [CrossRef]
- Silva, A.G.; Alvarelhão, J.; Queirós, A.; Rocha, N.P. Pain intensity is associated with self-reported disability for several domains of life in a sample of patients with musculoskeletal pain aged 50 or more. Disabil. Health J. 2013, 6, 369–376. [Google Scholar] [CrossRef] [PubMed]
- Nielson, W.R.; Weir, R. Biopsychosocial Approaches to the Treatment of Chronic Pain. Clin. J. Pain 2001, 17, S114–S127. [Google Scholar] [CrossRef] [PubMed]
- Wright, A.; Sluka, K.A. Nonpharmacological Treatments for Musculoskeletal Pain. Clin. J. Pain 2001, 17, 33–46. [Google Scholar] [CrossRef]
- Babatunde, O.O.; Jordan, J.L.; Van Der Windt, D.A.; Hill, J.C.; Foster, N.E.; Protheroe, J. Effective treatment options for musculoskeletal pain in primary care: A systematic overview of current evidence. PLoS ONE 2017, 12. [Google Scholar] [CrossRef]
- Dietrich, A. Endocannabinoids and exercise. Br. J. Sports Med. 2004, 38, 536–541. [Google Scholar] [CrossRef]
- Goldfarb, A.H.; Jamurtas, A.Z. Beta-Endorphin Response to Exercise—An update. Sports Med. 1997, 24, 8–16. [Google Scholar] [CrossRef]
- Naugle, K.M.; Fillingim, R.B.; Riley, J.L., III. A meta-analytic review of the hypoalgesic effects of exercise. J. Pain 2012, 13, 1139–1150. [Google Scholar] [CrossRef]
- Booth, J.; Moseley, G.L.; Schiltenwolf, M.; Cashin, A.; Davies, M.; Hübscher, M. Exercise for chronic musculoskeletal pain: A biopsychosocial approach. Musculoskelet. Care 2017, 15, 413–421. [Google Scholar] [CrossRef]
- Smith, B.E.; Hendrick, P.; Bateman, M.; Holden, S.; Littlewood, C.; Smith, T.O.; Logan, P. Musculoskeletal pain and exercise-challenging existing paradigms and introducing new. Br. J. Sports Med. 2019, 53, 907–912. [Google Scholar] [CrossRef]
- La Touche, R.; Fernández Pérez, J.J.; Proy Acosta, A.; González Campodónico, L.; Martínez García, S.; Adraos Juárez, D.; Serrano García, B.; Angulo-Díaz-Parreño, S.; Cuenca-Martínez, F.; Suso-Martí, L.; et al. Is aerobic exercise helpful in patients with migraine? A systematic review and meta-analysis. Scand. J. Med. Sci. Sports 2020, 30, 965–982. [Google Scholar] [CrossRef] [PubMed]
- Hakansson, S.; Jones, M.D.; Ristov, M.; Marcos, L.; Clark, T.; Ram, A.; Morey, R.; Franklin, A.; McCarthy, C.; Carli, L.D.; et al. Intensity-dependent effects of aerobic training on pressure pain threshold in overweight men: A randomized trial. Eur. J. Pain 2018, 22, 1813–1823. [Google Scholar] [CrossRef] [PubMed]
- O’Leary, T.J.; Collett, J.; Howells, K.; Morris, M.G. High but not moderate-intensity endurance training increases pain tolerance: A randomised trial. Eur. J. Appl. Physiol. 2017, 117, 2201–2210. [Google Scholar] [CrossRef] [PubMed]
- Andreato, L.V. High-Intensity Interval Training: Methodological Considerations for Interpreting Results and Conducting Research. Trends Endocrinol. Metab. 2020, 31, 812–817. [Google Scholar] [CrossRef] [PubMed]
- Atan, T.; Karavelioğlu, Y. Effectiveness of High-Intensity Interval Training vs Moderate-Intensity Continuous Training in Patients with Fibromyalgia: A Pilot Randomized Controlled Trial. Arch. Phys. Med. Rehabil. 2020, 101, 1865–1876. [Google Scholar] [CrossRef]
- Sveaas, S.H.; Bilberg, A.; Berg, I.J.; Provan, S.A.; Rollefstad, S.; Semb, A.G.; Hagen, K.B.; Johansen, M.W.; Pedersen, E.; Dagfinrud, H. High intensity exercise for 3 months reduces disease activity in axial spondyloarthritis (axSpA): A multicentre randomised trial of 100 patients. Br. J. Sports Med. 2019, 54, 292–297. [Google Scholar] [CrossRef]
- Verbrugghe, J.; Agten, A.; Stevens, S.; Hansen, D.; Demoulin, C.; Eijnde, B.O.; Vandenabeele, F.; Timmermans, A. Exercise Intensity Matters in Chronic Nonspecific Low Back Pain Rehabilitation. Med. Sci. Sports Exerc. 2019, 51, 2434–2442. [Google Scholar] [CrossRef]
- Batacan, R.B.; Duncan, M.J.; Dalbo, V.J.; Tucker, P.S.; Fenning, A.S. Effects of high-intensity interval training on cardiometabolic health: A systematic review and meta-analysis of intervention studies. Br. J. Sports Med. 2017, 51, 494–503. [Google Scholar] [CrossRef]
- Mugele, H.; Freitag, N.; Wilhelmi, J.; Yang, Y.; Cheng, S.; Bloch, W.; Schumann, M. High-intensity interval training in the therapy and aftercare of cancer patients: A systematic review with meta-analysis. J. Cancer Surviv. 2019, 13, 205–223. [Google Scholar] [CrossRef]
- Weston, K.S.; Wisløff, U.; Coombes, J.S. High-intensity interval training in patients with lifestyle-induced cardiometabolic disease: A systematic review and meta-analysis. Br. J. Sports Med. 2014, 48, 1227–1234. [Google Scholar] [CrossRef]
- Doury-Panchout, F.; Métivier, J.C.; Fouquet, B. VO2max in patients with chronic pain: The effect of a 4-week rehabilitation program. Ann. Phys. Rehabil. Med. 2014, 57, 1–10. [Google Scholar] [CrossRef] [PubMed]
- Moher, D.; Liberati, A.; Tetzlaff, J.; Altman, D.G. Preferred reporting items for systematic reviews and meta-analyses: The PRISMA statement. Int. J. Surg. 2009, 8, 6. [Google Scholar]
- Stone, P.W. Popping the (PICO) question in research and evidence-based practice. Appl. Nurs. Res. 2002, 15, 197–198. [Google Scholar] [CrossRef] [PubMed]
- Terwee, C.B.; Jansma, E.P.; Riphagen, I.I.; de Vet, H.C.W. Development of a methodological PubMed search filter for finding studies on measurement properties of measurement instruments. Qual. Life Res. 2009, 18, 1115–1123. [Google Scholar] [CrossRef]
- Shariff, S.Z.; Bejaimal, S.A.; Sontrop, J.M.; Iansavichus, A.V.; Haynes, R.B.; Weir, M.A.; Garg, A.X. Retrieving clinical evidence: A comparison of PubMed and Google Scholar for quick clinical searches. J. Med. Internet Res. 2013, 15, e164. [Google Scholar] [CrossRef]
- Haddaway, N.R.; Collins, A.M.; Coughlin, D.; Kirk, S. The Role of Google Scholar in Evidence Reviews and Its Applicability to Grey Literature Searching. PLoS ONE 2015, 10, e0138237. [Google Scholar] [CrossRef]
- Moher, D.; Pham, B.; Jones, A.; Cook, D.J.; Jadad, A.R.; Moher, M.; Tugwell, P.; Klassen, T.P. Does quality of reports of randomised trials affect estimates of intervention efficacy reported in meta-analyses? Lancet 1998, 352, 609–613. [Google Scholar] [CrossRef]
- Kwon, Y.; Lemieux, M.; McTavish, J.; Wathen, N. Identifying and removing duplicate records from systematic review searches. J. Med. Libr. Assoc. 2015, 103, 184–188. [Google Scholar] [CrossRef]
- Furlan, A.D.; Pennick, V.; Bombardier, C.; van Tulder, M. 2009 updated method guidelines for systematic reviews in the Cochrane Back Review Group. Spine 2009, 34, 1929–1941. [Google Scholar] [CrossRef]
- Higgins, J.; Green, S. Cochrane Handbook for Systematic Reviews of Interventions; Version 5.1.0[M]; Wiley-Blackwell: Hoboken, NJ, USA, 2008. [Google Scholar]
- de Morton, N.A. The PEDro scale is a valid measure of the methodological quality of clinical trials: A demographic study. Aust. J. Physiother. 2009, 55, 129–133. [Google Scholar] [CrossRef]
- Hariohm, K.; Prakash, V.; Saravankumar, J. Quantity and quality of randomized controlled trials published by Indian physiotherapists. Perspect. Clin. Res. 2015, 6, 91. [Google Scholar] [CrossRef] [PubMed]
- Landis, J.R.; Koch, G.G. An Application of Hierarchical Kappa-type Statistics in the Assessment of Majority Agreement among Multiple Observers. Biometrics 1977, 33, 363. [Google Scholar] [CrossRef] [PubMed]
- Guyatt, G.H.; Oxman, A.D.; Vist, G.E.; Kunz, R.; Falck-Ytter, Y.; Alonso-Coello, P.; Schünemann, H.J. GRADE Working Group GRADE: An emerging consensus on rating quality of evidence and strength of recommendations. BMJ 2008, 336, 924–926. [Google Scholar] [CrossRef] [PubMed]
- Andrews, J.; Guyatt, G.; Oxman, A.D.; Alderson, P.; Dahm, P.; Falck-Ytter, Y.; Nasser, M.; Meerpohl, J.; Post, P.N.; Kunz, R.; et al. GRADE guidelines: 14. Going from evidence to recommendations: The significance and presentation of recommendations. J. Clin. Epidemiol. 2013, 66, 719–725. [Google Scholar] [CrossRef]
- Balshem, H.; Helfand, M.; Schünemann, H.J.; Oxman, A.D.; Kunz, R.; Brozek, J.; Vist, G.E.; Falck-Ytter, Y.; Meerpohl, J.; Norris, S.; et al. GRADE guidelines: 3. Rating the quality of evidence. J. Clin. Epidemiol. 2011, 64, 401–406. [Google Scholar] [CrossRef]
- Sanabria, A.J.; Rigau, D.; Rotaeche, R.; Selva, A.; Marzo-Castillejo, M.; Alonso-Coello, P. GRADE: Methodology for formulating and grading recommendations in clinical practice. Aten. Primaria 2015, 47, 48–55. [Google Scholar] [CrossRef] [PubMed]
- Barendregt, J.J.; Doi, S.A. MetaXL User Guide Version 5.3; EpiGear International Pty Ltd.: Brisbane, Australia, 2016. [Google Scholar]
- Hedges, L. Estimation of effect size from a series of independent experiments. Psychol. Bull. 1982, 92, 490–499. [Google Scholar] [CrossRef]
- Hopkins, W.G.; Marshall, S.W.; Batterham, A.M.; Hanin, J. Progressive statistics for studies in sports medicine and exercise science. Med. Sci. Sports Exerc. 2009, 41, 3–13. [Google Scholar] [CrossRef]
- Huedo-Medina, T.B.; Sánchez-Meca, J.; Marín-Martínez, F.; Botella, J. Assessing heterogeneity in meta-analysis: Q statistic or I2 index? Psychol. Methods 2006, 11, 193–206. [Google Scholar] [CrossRef]
- Doi, S.A. Rendering the Doi plot properly in meta-analysis. Int. J. Evid. Based. Healthc. 2018, 16, 242–243. [Google Scholar] [CrossRef]
- Furuya-Kanamori, L.; Barendregt, J.J.; Doi, S.A.R. A new improved graphical and quantitative method for detecting bias in meta-analysis. Int. J. Evid. Based. Healthc. 2018, 16, 195–203. [Google Scholar] [CrossRef] [PubMed]
- Suurmond, R.; van Rhee, H.; Hak, T. Introduction, comparison, and validation of Meta-Essentials: A free and simple tool for meta-analysis. Res. Synth. Methods 2017, 8, 537–553. [Google Scholar] [CrossRef] [PubMed]
- Bressel, E.; Wing, J.E.; Miller, A.I.; Dolny, D.G. High-intensity interval training on an aquatic treadmill in adults with osteoarthritis: Effect on pain, balance, function, and mobility. J. Strength Cond. Res. 2014, 28, 2088–2096. [Google Scholar] [CrossRef] [PubMed]
- Keogh, J.W.; Grigg, J.; Vertullo, C.J. Is high-intensity interval cycling feasible and more beneficial than continuous cycling for knee osteoarthritic patients? Results of a randomised control feasibility trial. PeerJ 2018, 6, e4738. [Google Scholar] [CrossRef] [PubMed]
- Sveaas, S.H.; Berg, I.J.; Provan, S.A.; Semb, A.G.; Hagen, K.B.; Vøllestad, N.; Fongen, C.; Olsen, I.C.; Michelsen, A.; Ueland, T.; et al. Efficacy of high intensity exercise on disease activity and cardiovascular risk in active axial spondyloarthritis: A randomized controlled pilot study. PLoS ONE 2014, 9, e108688. [Google Scholar] [CrossRef] [PubMed]
- Verbrugghe, J.; Agten, A.; Eijnde, B.O.; Olivieri, E.; Huybrechts, X.; Seelen, H.; Vandenabeele, F.; Timmermans, A. Feasibility of high intensity training in nonspecific chronic low back pain: A clinical trial. J. Back Musculoskelet. Rehabil. 2018, 31, 657–666. [Google Scholar] [CrossRef] [PubMed]
- Verbrugghe, J.; Agten, A.; Stevens, S.; Hansen, D.; Demoulin, C.; Eijnde, B.O.; Vandenabeele, F.; Timmermans, A. High Intensity Training to Treat Chronic Nonspecific Low Back Pain: Effectiveness of Various Exercise Modes. J. Clin. Med. 2020, 9, 2401. [Google Scholar] [CrossRef]
- Hanssen, H.; Minghetti, A.; Magon, S.; Rossmeissl, A.; Rasenack, M.; Papadopoulou, A.; Klenk, C.; Faude, O.; Zahner, L.; Sprenger, T.; et al. Effects of different endurance exercise modalities on migraine days and cerebrovascular health in episodic migraineurs: A randomized controlled trial. Scand. J. Med. Sci. Sports 2018, 28, 1103–1112. [Google Scholar] [CrossRef]
- Berg, O.K.; Paulsberg, F.; Brabant, C.; Arabsolghar, K.; Ronglan, S.; BjØrnsen, N.; TØrhaug, T.; Granviken, F.; Gismervik, S.; Hoff, J. High-Intensity Shoulder Abduction Exercise in Subacromial Pain Syndrome. Med. Sci. Sports Exerc. 2020, 53, 1–9. [Google Scholar] [CrossRef]
- Sandstad, J.; Stensvold, D.; Hoff, M.; Nes, B.M.; Arbo, I.; Bye, A. The effects of high intensity interval training in women with rheumatic disease: A pilot study. Eur. J. Appl. Physiol. 2015, 115, 2081–2089. [Google Scholar] [CrossRef]
- Flehr, A.; Barton, C.; Coles, J.; Gibson, S.J.; Lambert, G.W.; Lambert, E.A.; Dhar, A.K.; Dixon, J.B. #MindinBody—Feasibility of vigorous exercise (Bikram yoga versus high intensity interval training) to improve persistent pain in women with a history of trauma: A pilot randomized control trial. BMC Complement. Altern. Med. 2019, 19, 234. [Google Scholar]
- Thomsen, R.S.; Nilsen, T.I.L.; Haugeberg, G.; Bye, A.; Kavanaugh, A.; Hoff, M. Impact of High-Intensity Interval Training on Disease Activity and Disease in Patients with Psoriatic Arthritis: A Randomized Controlled Trial. Arthritis Care Res. 2019, 71, 530–537. [Google Scholar] [CrossRef] [PubMed]
- Palma, S.; Hasenoehrl, T.; Jordakieva, G.; Ramazanova, D.; Crevenna, R. High-intensity interval training in the prehabilitation of cancer patients—A systematic review and meta-analysis. Support. Care Cancer 2021, 29, 1781–1794. [Google Scholar] [CrossRef]
- Milanović, Z.; Sporiš, G.; Weston, M. Effectiveness of High-Intensity Interval Training (HIT) and Continuous Endurance Training for VO2max Improvements: A Systematic Review and Meta-Analysis of Controlled Trials. Sports Med. 2015, 45, 1469–1481. [Google Scholar] [CrossRef]
- Ramos, J.S.; Dalleck, L.C.; Tjonna, A.E.; Beetham, K.S.; Coombes, J.S. The impact of high-intensity interval training versus moderate-intensity continuous training on vascular function: A systematic review and meta-analysis. Sports Med. 2015, 45, 679–692. [Google Scholar] [CrossRef] [PubMed]
- Gibala, M. Molecular responses to high-intensity interval exercise. Appl. Physiol. Nutr. Metab. 2009, 34, 428–432. [Google Scholar] [CrossRef] [PubMed]
- MacInnis, M.J.; Gibala, M.J. Physiological adaptations to interval training and the role of exercise intensity. J. Physiol. 2017, 595, 2915–2930. [Google Scholar] [CrossRef] [PubMed]
- Belviranli, M.; Okudan, N.; Kabak, B. The Effects of Acute High-Intensity Interval Training on Hematological Parameters in Sedentary Subjects. Med. Sci. 2017, 5, 15. [Google Scholar] [CrossRef]
- Huang, Y.-C.; Tsai, H.-H.; Fu, T.-C.; Hsu, C.-C.; Wang, J.-S. High-Intensity Interval Training Improves Left Ventricular Contractile Function. Med. Sci. Sports Exerc. 2019, 51, 1420–1428. [Google Scholar] [CrossRef]
- Lundby, C.; Montero, D.; Joyner, M. Biology of VO(2) max: Looking under the physiology lamp. Acta Physiol. 2017, 220, 218–228. [Google Scholar] [CrossRef]
- Kaminsky, L.A.; Arena, R.; Ellingsen, Ø.; Harber, M.P.; Myers, J.; Ozemek, C.; Ross, R. Cardiorespiratory fitness and cardiovascular disease—The past, present, and future. Prog. Cardiovasc. Dis. 2019, 62, 86–93. [Google Scholar] [CrossRef] [PubMed]
- Kodama, S.; Saito, K.; Tanaka, S.; Maki, M.; Yachi, Y.; Asumi, M.; Sugawara, A.; Totsuka, K.; Shimano, H.; Ohashi, Y.; et al. Cardiorespiratory fitness as a quantitative predictor of all-cause mortality and cardiovascular events in healthy men and women: A meta-analysis. JAMA 2009, 301, 2024–2035. [Google Scholar] [CrossRef] [PubMed]
- Williams, A.; Kamper, S.J.; Wiggers, J.H.; O’Brien, K.M.; Lee, H.; Wolfenden, L.; Yoong, S.L.; Robson, E.; McAuley, J.H.; Hartvigsen, J.; et al. Musculoskeletal conditions may increase the risk of chronic disease: A systematic review and meta-analysis of cohort studies. BMC Med. 2018, 16, 167. [Google Scholar] [CrossRef] [PubMed]
- Fayaz, A.; Ayis, S.; Panesar, S.S.; Langford, R.M.; Donaldson, L.J. Assessing the relationship between chronic pain and cardiovascular disease: A systematic review and meta-analysis. Scand. J. pain 2016, 13, 76–90. [Google Scholar] [CrossRef]
- Imboden, M.T.; Harber, M.P.; Whaley, M.H.; Finch, W.H.; Bishop, D.L.; Fleenor, B.S.; Kaminsky, L.A. The Association between the Change in Directly Measured Cardiorespiratory Fitness across Time and Mortality Risk. Prog. Cardiovasc. Dis. 2019, 62, 157–162. [Google Scholar] [CrossRef]
- Laukkanen, J.A.; Zaccardi, F.; Khan, H.; Kurl, S.; Jae, S.Y.; Rauramaa, R. Long-term Change in Cardiorespiratory Fitness and All-Cause Mortality: A Population-Based Follow-up Study. Mayo Clin. Proc. 2016, 91, 1183–1188. [Google Scholar] [CrossRef]
- Geneen, L.J.; Moore, R.A.; Clarke, C.; Martin, D.; Colvin, L.A.; Smith, B.H. Physical activity and exercise for chronic pain in adults: An overview of Cochrane Reviews. In Cochrane Database of Systematic Reviews; Geneen, L.J., Ed.; John Wiley & Sons, Ltd: Chichester, UK, 2017; Volume 4, p. CD011279. [Google Scholar]
- Rice, D.; Nijs, J.; Kosek, E.; Wideman, T.; Hasenbring, M.I.; Koltyn, K.; Graven-Nielsen, T.; Polli, A. Exercise-Induced Hypoalgesia in Pain-Free and Chronic Pain Populations: State of the Art and Future Directions. J. Pain 2019, 20, 1249–1266. [Google Scholar] [CrossRef]
- Sluka, K.A.; Frey-Law, L.; Hoeger Bement, M. Exercise-induced pain and analgesia? Underlying mechanisms and clinical translation. Pain 2018, 159 (Suppl. S1), S91–S97. [Google Scholar] [CrossRef]
- Nijs, J.; George, S.Z.; Clauw, D.J.; Fernández-de-las-Peñas, C.; Kosek, E.; Ickmans, K.; Fernández-Carnero, J.; Polli, A.; Kapreli, E.; Huysmans, E.; et al. Central sensitisation in chronic pain conditions: Latest discoveries and their potential for precision medicine. Lancet Rheumatol. 2021, 3, e383–e392. [Google Scholar] [CrossRef]
- Mijwel, S.; Backman, M.; Bolam, K.A.; Olofsson, E.; Norrbom, J.; Bergh, J.; Sundberg, C.J.; Wengström, Y.; Rundqvist, H. Highly favorable physiological responses to concurrent resistance and high-intensity interval training during chemotherapy: The OptiTrain breast cancer trial. Breast Cancer Res. Treat. 2018, 169, 93–103. [Google Scholar] [CrossRef]
- van den Berg, R.; Jongbloed, E.M.; de Schepper, E.I.T.; Bierma-Zeinstra, S.M.A.; Koes, B.W.; Luijsterburg, P.A.J. The association between pro-inflammatory biomarkers and nonspecific low back pain: A systematic review. Spine J. 2018, 18, 2140–2151. [Google Scholar] [CrossRef] [PubMed]
- Farrell, S.F.; de Zoete, R.M.J.; Cabot, P.J.; Sterling, M. Systemic inflammatory markers in neck pain: A systematic review with meta-analysis. Eur. J. Pain 2020, 24, 1666–1686. [Google Scholar] [CrossRef] [PubMed]
- DeVon, H.A.; Piano, M.R.; Rosenfeld, A.G.; Hoppensteadt, D.A. The Association of Pain with Protein Inflammatory Biomarkers: A Review of the Literature. Nurs. Res. 2014, 63, 51–62. [Google Scholar] [CrossRef]
- Adams, S.C.; DeLorey, D.S.; Davenport, M.H.; Stickland, M.K.; Fairey, A.S.; North, S.; Szczotka, A.; Courneya, K.S. Effects of high-intensity aerobic interval training on cardiovascular disease risk in testicular cancer survivors: A phase 2 randomized controlled trial. Cancer 2017, 123, 4057–4065. [Google Scholar] [CrossRef] [PubMed]
- Khalafi, M.; Symonds, M.E. The impact of high-intensity interval training on inflammatory markers in metabolic disorders: A meta-analysis. Scand. J. Med. Sci. Sports 2020, 30, 2020–2036. [Google Scholar] [CrossRef] [PubMed]
- Steckling, F.M.; Farinha, J.B.; da Cunha Figueiredo, F.; Dos Santos, D.L.; Bresciani, G.; Kretzmann, N.A.; Stefanello, S.T.; Courtes, A.A.; de Oliveira Beck, M.; Sangoi Cardoso, M.; et al. High-intensity interval training improves inflammatory and adipokine profiles in postmenopausal women with metabolic syndrome. Arch. Physiol. Biochem. 2019, 125, 85–91. [Google Scholar] [CrossRef]
- Nunes, P.R.P.; Martins, F.M.; Souza, A.P.; Carneiro, M.A.S.; Orsatti, C.L.; Michelin, M.A.; Murta, E.F.C.; de Oliveira, E.P.; Orsatti, F.L. Effect of high-intensity interval training on body composition and inflammatory markers in obese postmenopausal women: A randomized controlled trial. Menopause 2019, 26, 256–264. [Google Scholar] [CrossRef]
- Zwetsloot, K.A.; John, C.S.; Lawrence, M.M.; Battista, R.A.; Shanely, R.A. High-intensity interval training induces a modest systemic inflammatory response in active, young men. J. Inflamm. Res. 2014, 7, 9–17. [Google Scholar] [CrossRef]
- Pedersen, B.K. Anti-inflammatory effects of exercise: Role in diabetes and cardiovascular disease. Eur. J. Clin. Investig. 2017, 47, 600–611. [Google Scholar] [CrossRef]
- Shanaki, M.; Khosravi, M.; Khoshdooni-Farahani, A.; Dadashi, A.; Heydari, M.F.; Delfan, M.; Jafary, H.; Gorgani-Firuzjaee, S. High-Intensity Interval Training Reversed High-Fat Diet-Induced M1-Macrophage Polarization in Rat Adipose Tissue via Inhibition of NOTCH Signaling. J. Inflamm. Res. 2020, 13, 165–174. [Google Scholar] [CrossRef]
- Eslami, R.; Parnow, A.; Pairo, Z.; Nikolaidis, P.; Knechtle, B. The effects of two different intensities of aerobic training protocols on pain and serum neuro-biomarkers in women migraineurs: A randomized controlled trail. Eur. J. Appl. Physiol. 2021, 121, 609–620. [Google Scholar] [CrossRef] [PubMed]
- Lamé, I.E.; Peters, M.L.; Vlaeyen, J.W.S.; Kleef, M.v.; Patijn, J. Quality of life in chronic pain is more associated with beliefs about pain, than with pain intensity. Eur. J. Pain 2005, 9, 15–24. [Google Scholar] [CrossRef] [PubMed]
- Monticone, M.; Ferrante, S.; Rocca, B.; Baiardi, P.; Farra, F.D.; Foti, C. Effect of a long-lasting multidisciplinary program on disability and fear-avoidance behaviors in patients with chronic low back pain: Results of a randomized controlled trial. Clin. J. Pain 2013, 29, 929–938. [Google Scholar] [CrossRef] [PubMed]
- Kamper, S.J.; Apeldoorn, A.T.; Chiarotto, A.; Smeets, R.J.E.M.; Ostelo, R.W.J.G.; Guzman, J.; van Tulder, M.W. Multidisciplinary biopsychosocial rehabilitation for chronic low back pain: Cochrane systematic review and meta-analysis. BMJ 2015, 350, h444. [Google Scholar] [CrossRef]
- Veldhuijzen van Zanten, J.J.C.S.; Rouse, P.C.; Hale, E.D.; Ntoumanis, N.; Metsios, G.S.; Duda, J.L.; Kitas, G.D. Perceived Barriers, Facilitators and Benefits for Regular Physical Activity and Exercise in Patients with Rheumatoid Arthritis: A Review of the Literature. Sports Med. 2015, 45, 1401–1412. [Google Scholar] [CrossRef]
- Boutevillain, L.; Dupeyron, A.; Rouch, C.; Richard, E.; Coudeyre, E. Facilitators and barriers to physical activity in people with chronic low back pain: A qualitative study. PLoS ONE 2017, 12, e0179826. [Google Scholar] [CrossRef]
- McPhail, S.M.; Schippers, M.; Marshall, A.L.; Waite, M.; Kuipers, P. Perceived barriers and facilitators to increasing physical activity among people with musculoskeletal disorders: A qualitative investigation to inform intervention development. Clin. Interv. Aging 2014, 9, 2113–2122. [Google Scholar] [CrossRef]
- Wewege, M.A.; Ahn, D.; Yu, J.; Liou, K.; Keech, A. High-Intensity Interval Training for Patients with Cardiovascular Disease-Is It Safe? A Systematic Review. J. Am. Heart Assoc. 2018, 7, e009305. [Google Scholar] [CrossRef]
- Heisz, J.J.; Tejada, M.G.M.; Paolucci, E.M.; Muir, C. Enjoyment for High-Intensity Interval Exercise Increases during the First Six Weeks of Training: Implications for Promoting Exercise Adherence in Sedentary Adults. PLoS ONE 2016, 11, e0168534. [Google Scholar] [CrossRef]
- American Thoracic Society; American College of Chest Physicians. ATS/ACCP Statement on cardiopulmonary exercise testing. Am. J. Respir. Crit. Care Med. 2003, 167, 211–277. [Google Scholar] [CrossRef]


| Author, Year Country | Population Disease (n) Age (Years) Sex (%) Diagnostic Criteria Disease Duration (Years) | Study Design—Duration Intervention(s) and Control Group (n) | Outcome Measured (Instrument) | Results |
|---|---|---|---|---|
| Atan et al., 2020 [15] Turkey | Fibromyalgia (n = 55) Age, 48.7 ± 9.1 y 100% F American College of Rheumatology 2016 diagnostic criteria Duration, 2.5 ± 1.6 y | Pilot ROT—6 weeks Intervention - HIIT (n = 19) - MICT (n = 19) Control Usual care (n = 17) | - Pain Intensity (VAS) - HRQoL (SF-36 PF, PRL, Pain, GH, V, SF, ER, MH, EWB, E/F, HC) - VO2 max (mL/kg/min) | HIIT showed significant differences compared with a control group on pain intensity, VO2 max, and SF-36 PF, PRL, ER, E/F, EWB, GH, and HC (p < 0.05) but no significant difference compared with MCT. |
| Berg et al., 2020 [50] Norway | Chronic SAPS (n = 21) Age, 48.1 ± 12.5 y 48% F/52% M Clinical criteria Duration, 3.5 ± 4.8 y | RCT—8 weeks Intervention HIIT + Home-exercise (n = 13) Control Home-exercise (n = 8) | - Pain intensity (NPA) - Disability (SPADI) | HIIT showed significant intragroup (p < 0.05) and intergroup differences (p < 0.05) compared with a control group in terms of disability but no significant difference in pain intensity. |
| Bressel et al., 2014 [44] United States | Knee OA (n = 18) Age, 64.5 ± 10.2 y 89% F/11% M Clinical and radiological criteria Duration, 6.8 ± 7.4 y | Pre-post study—6 weeks Intervention - HIIT + Balance training (n = 18) Control No intervention (n = 18) | Pain Intensity (VAS) | HIIT showed a significant improvement in pain intensity (p < 0.05). |
| Flehr et al., 2019 [52] Australia | Persistent pain condition (n = 32) Age, 30.2 ± 8 y 100% F N/R Duration, More than 12 months | RCT—8 weeks Intervention HIIT (n = 15) Control Bikram Yoga (n = 17) | - Pain Intensity (BPI) - HRQoL (SF-36 PF, PRL, Pain, GH, V, SF, ER, MH) | No significant difference between HIIT and Bikram Yoga in pain intensity. There was a significant intergroup difference on quality of life (SF-36 PF: p = 0.019; SF-36 MH: p = 0.005), with yoga showing higher improvement (SF-36 PF: M = 80.91; SF-36 MH: M= 63.94). |
| Hanssen et al., 2018 [49] Switzerland | Episodic migraine without aura (n= 36) Age, 36.8 ± 10.3 y 81% F/19% M International classification of headache disorders, 3rd ed. Duration, N/R | RCT—12 weeks Intervention - HIIT (n = 13) - MICT (n = 11) Control Group No intervention (n = 12) | VO2 max (mL/kg/min) | No group × time interaction between the three groups (p = 0.14). |
| Keogh et al., 2018 [45] Australia | Knee OA (n = 17) Age, 62.4 ± 8.3 y 76% F/24% M Diagnosis by an orthopaedic surgeon Duration, 4.7 ± 4.6 y | Pilot RCT—8 weeks Intervention HIIT (n = 9) Control MICT (n = 8) | - Disability (WOMAC, Lequesne Index) | Both interventions demonstrated significant benefits on the WOMAC (HIIT: p = 0.05; MICT: p = 0.006) but without intergroup differences. No patient had significant improvement in the Lequesne index. |
| Sandstad et al., 2015 [51] Norway | RA and JIA (n = 27) Age, 33.0 ± 8.1 y 100% F Diagnosis by a rheumatologist Duration, N/R | Cross-over trial—10 weeks Intervention HIIT (n = 12) Control No intervention (n = 15) | - Pain Intensity (VAS) - Disability (MHAQ) - VO2 max (mL/kg/min) | HIIT had a significant improvement in VO2 max (p < 0.001) but no difference in pain intensity and disability. |
| Sveaas et al., 2014 [49] Norway | axSpA (n = 24) Age, 48.5 ± 12.0 y 50% F/50% M Spondyloarthritis International Society criteria Duration, 24.9 ± 15.8 y | Pilot RCT—12 weeks Intervention HIIT (n = 10) Control Usual care (n = 14) | VO2 max (mL/kg/min) | HIIT had a significantly higher VO2 max at 12 weeks than the control group (p < 0.001) |
| Sveaas et al., 2019 [16] Norway | axSpA (n = 97) Age, 46.2 ± N/R y 53% F/47% M Spondyloarthritis International Society criteria Duration, N/R | RCT—12 weeks Intervention HIIT (n = 48) Control No intervention (n = 49) | - Pain intensity (BASDAI neck/back/hip and peripheral pain) - VO2 max (mL/kg/min) | HIIT significantly improves the neck/back/hips, and peripheral pain intensity, and the VO2 max more than the control group (p < 0.001; p = 0.016; p < 0.001). |
| Thomsen et al., 2019 [53] Norway | PsA (n = 67) Age, 48.0 ± 11.5 y 64% F/36% M Classification of psoriatic arthritis Study group criteria Duration, N/R | RCT—11 weeks Intervention HIIT (n = 32) Control No intervention (n = 35) | - Pain Intensity (VAS) | HIIT showed no clear effect on pain intensity at the end of the intervention and at 9 months of follow-up. |
| Verbrugghe et al., 2018 [47] Belgium | Nonspecific Chronic LBP (n = 20) Age, N/R 55% F/45% M Clinical criteria Duration, N/R | CCT—6 weeks Intervention HIIT (n = 10) Control Usual care (n = 10) | - Pain Intensity (NPRS) - Disability (RMDQ) - HRQoL (SF-36 PF, PRL, ER, E/F, EWB, SF, Pain, GH) - VO2 max (mL/kg/min) | Both groups had a reduction in disability (p < 0.05) with no intergroup difference. HIIT improved significantly HRQoL (SF-36 PRL, ER, SF, and Pain) (p < 0.05) but with no intergroup differences. |
| Verbrugghe et al., 2019 [17] Belgium | Nonspecific Chronic LBP (n = 36) Age, 44.2 ± 9.8 y 68% F/32% M Clinical criteria Duration, 11.1 ± 7.7 y | RCT—12 weeks Intervention HIIT (n = 18) Control MIT (n = 18) | - Pain Intensity (NPRS) - Disability (MODI) - VO2 max (mL/kg/min) | HIIT significantly improved disability and VO2 max more than MIT (p < 0.05). HIIT significantly reduced pain intensity (p < 0.05) but with no significant differences with MIT. |
| Verbrugghe et al., 2020 [48] Belgium | Nonspecific chronic LBP (n = 80) Age, 44.1 ± 9.7 y 58% F/42% M Clinical criteria Duration, 13.4 ± 9.1 y | RCT—12 weeks Intervention - HITCOM (n = 19) - HITSTRE (n = 21) - HITSTAB (n = 20) - HITMOB (n = 20) | - Pain Intensity (NPRS) - Disability (MODI) - VO2 max (mL/kg/min) | All four HIIT groups significantly reduced pain intensity and disability and increased VO2 max (p < 0.05), with no intergroup differences. |
| Trial | Group | Exercise Protocol (Distribution and Exercise Type) | Intensity (Pain Control during Training) | Frequency and Duration | Exercise Testing |
|---|---|---|---|---|---|
| Atan et al., 2020 [15] | HIIT (AerT) + StrT + Stretching | Total exercise duration: 35 min Warmup and cooldown: 5 min stationary cycling. HIIT protocol: 4 × 4 min of high-intensity stationary cycling interval alternating with 3 min cycling recovery periods. Work/rest ratio: [1:0.75] Followed by 10 min full body (shoulder, arm, leg, and hip) StrT, using 1–3-kg weights (1 × 8–10 rep) and 5 min stretching (4–5 × 20–30 s for each muscle group). | Measurement: HRmax (Monitorisation: N/R) Warmup and cooldown: 50% HRmax HIIT: Interval: 80–95% HRmax Active Rest: 70% HRmax StrT: N/R Pain: N/R | 5×/week 6 weeks | Maximal cardiopulmonary test on a cycloergometer at baseline and follow-up. HRmax, VO2 max, BP, workload, MET and duration-of-test were recorded. |
| MICT (AerT) + StrT + Stretching | Total exercise duration: 55 min. Warmup and cooldown: 5 min stationary cycling. MICT protocol: 45 min continuous stationary cycling Followed by 10 min full body (shoulder, arm, leg, and hip) StrT, using 1–3-kg weights (1 × 8–10 rep) and 5 min stretching (4–5 × 20–30 s for each muscle group). | Measurement: HRmax (Monitorisation: N/R) Warmup and cooldown: 50% HRmax MICT: 65–70% HRmax StrT: N/R Pain: N/R | |||
| Usual Care | Recommendations regarding exercise for fibromyalgia. | N/A | |||
| Berg et al., 2020 [50] | HIIT (StrT) + Usual Care | HIIT protocol: 4 × 4 min shoulder abduction-adduction at 2 Hz intervals alternating with 3 min walking rest periods Work/Rest Ratio: [1:0.75] If the patient was able to continue the final interval for one additional minute, the workload was increased by 250 g in the following session. Home-based exercises: Scapular stabilising, rotator cuff, and pain-free ROM exercises. | Measurement: WRmax Interval: 80% WRmax Rest: N/R Pain: When pain exceeds 5/10, session was ended. | 3×/week 8 weeks | Time to exhaustion test during shoulder abduction-adduction. WRmax was recorded. |
| Usual Care | Home-based exercises: Scapular stabilising, rotator cuff, and pain-free ROM exercises. | N/R | |||
| Bressel et al., 2014 [44] | BalanceT + HIIT (AerT) | Balance training: Perturbations with water jets. Followed by: HIIT protocol: (Progressive increase from 1st to 6th week) 3 to 6 × 0.5 to 2.5 min walking (1.3 to 2.1 m/s) on an underwater treadmill interval alternating with 1 to 2.5 min walking (1.3 to 1.8 m/s) rest periods. (depth: xiphoid process) Work/rest ratio: [1:2; 1:1.3; 1:1; 1:1; 1:1; 1:1] | Measurement: RPE (Borg Scale/20) BalanceT: Progressive increase (from 1st to 6th week) from 11 to 18/20. HIIT: Interval: Progressive increase (from 1st to 6th week) from 13 to 19/20. Rest: 10/20. Pain: N/R | 3×/week 6 weeks | N/A |
| Flehr et al., 2019 [52] | HIIT (StrT + AerT) | 45 min functional training incorporating running, throwing, standing from a seated position, placing items overhead, and picking items up. Warmup and demonstration: 15 min. Movement learning: 15 min HIIT protocol: 15 min reproduction of the movement at high intensity. Four formats possible: As fast as possible, 8-exercises Tabata intervallic training followed by AerT, Maximum reps or load in a set time, or as many rounds as possible in 12 min followed by AerT | N/R Interval: N/R Rest: N/R Pain: N/R | 3×/week 8 weeks | N/R |
| Yoga | 90 min Bikram Yoga class (Room at 40 °C and 40% humidity): Deep breathing, 45 to 50 min standing, stretching, and relaxation postures. | Light to moderate (according to ACSM) and sometimes vigorous. Pain: N/R | |||
| Hanssen et al., 2018 [49] | HIIT (AerT) | Warmup: 400 m of light running on a treadmill and 2 skipping exercises HIIT protocol: 4 × 4 min high-intensity running on a treadmill, interval alternating with 3 min running recovery periods. Work/rest ratio: [1:0.75] Cooldown: 400 m of light running and stretching | Measurement: HRmax (HR checked using HR monitor) Interval: 90% to 95% HRmax (±5 bpm) Rest: 70% of HRmax Pain: N/R | 2×/week 12 weeks | Maximal Cardiopulmonary test on a treadmill. Anaerobic lactate-threshold, HRmax, RPE, and VO2 max were recorded. |
| MICT (AerT) | Warmup: 400 m of light running on a treadmill and 2 skipping exercises MICT protocol: 45 min continuous running on a treadmill. Cooldown: 400 m of light running and stretching | Measurement: HRmax (HR checked using HR monitor) MICT: 70% HRmax (± 5 bpm) Pain: N/R | |||
| Maintain their habitual daily physical activity | N/A | N/A | |||
| Keogh et al., 2018 [45] | HIIT (AerT) | Warmup: 7 min stationary cycling, with progressively increasing intensity HIIT protocol: 5 × 45 s high-cadence stationary cycling interval alternating with 90 s low-intensity recovery cycling. Work/Rest Ratio: [1:2] Cooldown: 6–7 min of light to moderate cycling. | HIIT: Interval: 110 rpm with a resistance similar or slightly higher than the rest. Intensity was defined as “an intensity at which you felt it was quite difficult to complete sentences during the exercise”. Rest: ∼70 rpm To avoid pain, progressive increase in initial sessions. | 4×/week 8 weeks | N/R |
| MICT (AerT) | Warmup and cooldown: Light intensity cycling for 3 min and 2 min, respectively. MICT protocol: 20 min continuous cycling. | MICT: 60–80 rpm. Intensity was defined as “An intensity at which you are able to speak in complete sentences during the exercise”. To avoid pain, progressive increase in initial sessions | |||
| Sandstad et al., 2015 [51] | HIIT (AerT) | Warmup: 10 min stationary cycling at moderate intensity HIIT protocol: 4 × 4 min high-intensity stationary cycling interval alternating with 3 min cycling recovery periods. The speed and workload were adjusted continuously. | Measurement: HRmax (HR checked using HR monitor) Warmup: ~70% Interval: 85–95% of HRmax Rest: ~70% of HRmax Pain: N/R | 2×/week 10 weeks | Maximal cardiopulmonary test on a bike. VO2 max and HRmax (defined as the highest HR during the test plus 5 bpm). |
| Maintain daily life activities | N/A | N/A | |||
| Sveaas et al., 2014 and 2019 [16,49] | HIIT (AerT) + StrT + MICT (AerT) | Twice a week, supervised HIIT and StrT: - HIIT protocol: 4 × 4 min walking/running on a treadmill interval alternating with 3 min of active resting. - StrT protocol: 20 min with external load (2–3 × 8–10 rep): Bench press or chest press machine, weighted squat or leg press machine, rowing with weights, triceps and biceps machine, and abdominal bridge. Once a week, individual interval training or MICT: 40 min of either interval training or MICT. | Measurement: HRmax (HR checked using HR monitor) HIIT: Interval: 90–95% HRmax Rest: 70% HRmax MICT intensity: >70% HRmax Pain: Exercises were adapted if pain was ≥ 5/10 | 3×/week 12 weeks | Cardiopulmonary test on a walking treadmill (modified Balke protocol). VO2 max and HRmax were recorded. |
| Asked to not start exercise | N/A | N/A | |||
| Thomsen et al., 2019 [53] | HIIT (AerT) | Warmup: 10 min. HIIT protocol: 4 × 4 min high-intensity stationary cycling interval alternating with a 3 min cycling recovery period. Work/rest ratio: [1:0.75] Supervised twice a week and individually once a week. Participants were instructed in using the HIIT concept by, for example, running, bicycling, or walking uphill. | Measurement: HRmax (HR checked using HR monitor) Interval: 85–95% HRmax Rest: 70% HRmax Pain: N/R | 3×/week 11 weeks | Maximal cardiopulmonary test on a bike. VO2 max and HRmax (defined as the highest HR during the test more 5 bpm). |
| Maintain daily physical activity | N/A | N/A | |||
| Verbrugghe et al., 2018 [47] | HIIT (AerT) + High Intensity StrT | HIIT protocol: -Warmup: 5 min -Followed by HIIT training: 5 × 1 min high-intensity stationary cycling interval alternating with 1 min of rest. Weekly increase of interval duration by 10 s until week 6. Work/rest ratio: [1:1; 1.2:1; 1.3:1; 1.5:1; 1.7:1; 1.8:1] High load whole body StrT training protocol: 3 upper body (pulley biceps curl, pulley chest press, and pulley vertical traction behind the neck) and 3 lower body exercises (leg press, leg extension, and leg curl) with external load: 1 to 2 × 8–12 rep. | Measurement: VO2 max and 1RM (Monitorisation: N/R) Interval: VO2 max workload Rest: N/R StrT: 80% 1RM Pain: N/R | 2×/week 6 weeks | Maximal cardiopulmonary testing (Graded exercise test) on a bike. VO2 max, expiratory volume, respiratory exchange ratio, and HR were recorded A 1RM test was performed for every exercise. |
| Usual Physiotherapy Care | MICT protocol: 50 min continuous cycling, cross-training, and/or treadmill walking. Control motor exercise: Addressing lumbopelvic motor control impairments. Trunk StrT: Unstable posture corrections, plank, and bridge variations | Measurement: HRmax (Monitorisation: N/R) MICT: 60–65% HRmax Pain: N/R | |||
| Verbrugghe et al., 2019 [17] | HIIT (AerT) + High-intensity Global and Core StrT | HIIT protocol: -Warmup: 5 min cycling -HIIT Training: 5 × 1 min high-intensity cycling interval alternating with a 1 min cycling recovery period. Weekly increase of interval duration of 10 s until week 6. Work/rest ratio: [1:1; 1.2:1; 1.3:1; 1.5:1; 1.7:1; 1.8:1] High-intensity StrT: 3 upper body (vertical traction, chest press, arm curl) and 3 lower body exercises (leg curl, leg press, leg extension) executed with external load on machines: 1 × maximum 12 rep Core muscle training: 6 static core exercises [glute bridge, resistance band glute clam, lying diagonal back extension, adapted knee plank, adapted knee side plank, elastic band shoulder retraction with hip hinge): 1 × 10 rep of a 10 s static hold. | Measurement: % VO2 max, %1RM and %MVC (Monitorisation: N/R) HIIT: Interval: 110 rpm at 100% VO2 max workload Rest: 75 rpm at 50% VO2 max workload StrT: 80% 1RM 5% workload increase when the participant was able to perform more than 10 reps on 2 consecutive sessions. Core: Between 17% and 100% MVC of m. transversus abdominis, m. multifidus, m. gluteus. Progressive increase of time and load (body weight bearing, elastic or weights). Pain: N/R | 2×/week 12 weeks | Maximal cardiopulmonary test on a bicycle. VO2 max, Maximal workload, LA, and HR were recorded. Workload was updated, with a complementary cardiopulmonary test, for the last 6 weeks. 1RM testing was performed for every exercise. |
| MICT (AerT) + Moderate intensity Global and Core STrT | MICT protocol: Cycling on a cycle ergometer. - Warmup: 5 min. - MICT: Continuous 14 min cycling at moderate intensity. Duration increased by 100 s every 2 sessions up to 22 min 40 s. Moderate intensity Global StrT: Same exercises as above, but at moderate intensity: 1 × 15 rep. Moderate intensity core training: Same exercises as above but at moderate intensity: 1 × 10 repetitions of a 10 s static hold. | Measurement: % VO2 max, %1RM and %MVC (Monitorisation: N/R) MICT: 90 rpm at 60% VO2 max workload StrT: 60% of 1RM Core training: N/R Pain: N/R | |||
| Verbrugghe et al., 2020 [48] | HIIT (AerT) + Global StrT | HIIT protocol: - Warmup: 5 min cycling - HIIT Training: 5 × 1 min high-intensity cycling interval alternating with a 1 min cycling recovery period. Weekly increase of interval duration, of 10 s, until week 6. Work/rest ratio: [1:1; 1.2:1; 1.3:1; 1.5:1; 1.7:1; 1.8:1] High-intensity StrT: 3 upper body (vertical traction, chest press, arm curl) and 3 lower body exercises (leg curl, leg press, leg extension) executed with external load on machines: 2 × maximum 12 rep | Measurement: % VO2 max and %1RM (Monitorisation: N/R) HIIT: Interval: 110 rpm at 100% VO2 max workload Rest: 75 rpm at 50% VO2 max workload StrT: 80% 1 RM Weight was increased when the participant was able to perform more than 10 reps on 2 consecutive sessions. Pain: N/R | 2×/week 12 weeks | Maximal cardiopulmonary test on a bicycle. VO2 max, expiratory volume, respiratory exchange ratio, and HR were recorded. Parameters were adapted at 6 weeks with another cardiopulmonary test. 1RM testing was performed for every exercise. |
| HIIT (AerT) + Core StrT | HIIT protocol: Same HIIT protocol as above. Core muscle training: 6 static core exercises [glute bridge, resistance band glute clam, lying diagonal back extension, adapted knee plank, adapted knee side plank, elastic band shoulder retraction with hip hinge): 2 × 10 rep of a 10 s static hold. | Measurement: % VO2 max and %MVC (Monitorisation: N/R) HIIT: Interval: 110 rpm at 100% VO2 max workload Rest: 75 rpm at 50% VO2 max workload Core: 40–60% of the MVC of m. transversus abdominis, m. multifidus, m. gluteus. Progressive increase of time and load. Pain: N/R | |||
| HIIT (AerT)+ Global and Core StrT | HIIT protocol: Same HIIT protocol as above. High intensity StrT: Same exercise as above: 1 × maximum 12 rep Core muscle training: Same exercise as above: 1 × 10 rep of a 10 s static hold. | Measurement: % VO2 max, %1RM and %MVC (Monitorisation: N/R) HIIT: Interval: 110 rpm at 100% VO2 max workload Rest: 75 rpm at 50% VO2 max workload StrT: 80% 1 RM Weight was increased when the participant was able to perform more than 10 reps on 2 consecutive sessions. Core: 40–60% of the MVC of m. transversus abdominis, m. multifidus, m. gluteus. Progressive increase in time and load Pain: N/R | |||
| HIIT (AerT)+ Mobility | HIIT protocol: Same HIIT protocol as above. Mobility Training: 6 mobility exercises (hamstrings stretch, gluteus medius stretch, lower back rotation mobilisation, back extension stretch, hip flexor stretch, and mid-back extension mobilisation): Stretches were held on each side 2 × 30 s, and mobilisations were performed 2 × 10 rep. | HIIT: Interval: 110 rpm at 100% VO2 max workload Rest: 75 rpm at 50% VO2 max workload Mobility: N/R Pain: N/R |
| Items | ||||||||||||
|---|---|---|---|---|---|---|---|---|---|---|---|---|
| 1 | 2 | 3 | 4 | 5 | 6 | 7 | 8 | 9 | 10 | 11 | Total | |
| Atan et al., 2020 [15] | 1 | 1 | 1 | 1 | 0 | 0 | 1 | 1 | 1 | 1 | 1 | 8 |
| Berg et al., 2020 [50] | 1 | 1 | 1 | 0 | 0 | 0 | 0 | 1 | 1 | 1 | 1 | 6 |
| Bressel et al., 2014 [44] | 1 | 0 | 0 | 1 | 0 | 0 | 0 | 1 | 1 | 1 | 1 | 5 |
| Flehr et al., 2019 [52] | 1 | 1 | 1 | 1 | 0 | 0 | 1 | 1 | 1 | 1 | 1 | 8 |
| Hanssen et al., 2018 [49] | 1 | 1 | 1 | 1 | 0 | 0 | 1 | 1 | 1 | 1 | 1 | 8 |
| Keogh et al., 2018 [45] | 1 | 1 | 1 | 1 | 0 | 0 | 0 | 1 | 1 | 1 | 1 | 7 |
| Sandstad et al., 2015 [51] | 1 | 1 | 1 | 1 | 0 | 0 | 0 | 1 | 1 | 1 | 1 | 7 |
| Sveas et al., 2014 [16] | 1 | 1 | 1 | 1 | 0 | 0 | 1 | 1 | 1 | 1 | 1 | 8 |
| Sveas et al., 2019 [49] | 1 | 1 | 1 | 1 | 0 | 0 | 1 | 1 | 1 | 1 | 1 | 8 |
| Thomsen et al., 2019 [53] | 1 | 1 | 1 | 1 | 0 | 0 | 1 | 1 | 1 | 1 | 1 | 8 |
| Verbrugghe et al., 2018 [47] | 1 | 0 | 0 | 1 | 0 | 0 | 1 | 1 | 1 | 1 | 1 | 6 |
| Verbrugghe et al., 2019 [17] | 1 | 1 | 1 | 1 | 0 | 0 | 0 | 1 | 1 | 1 | 1 | 7 |
| Verbrugghe et al., 2020 [48] | 1 | 1 | 1 | 1 | 0 | 0 | 0 | 1 | 1 | 1 | 1 | 7 |
| Certainty Assessment | No. of Participants | Effect | Certainty | Importance | |||||||
|---|---|---|---|---|---|---|---|---|---|---|---|
| Outcome (No. of Studies) | Study Design | Risk of Bias | Inconsistency | Indirectness | Imprecision | HIIT | Control | Relative (95% CI) | Absolute (95% CI) | ||
| Pain intensity (7) | RCT | Not serious | Serious | Not serious | Serious | 119 | 120 | - | −0.73 (1.40–−0.06) | Low (+) (+) | Critical |
| VO2 max (6) | RCT | Not serious | Not serious | Not serious | Serious | 112 | 118 | - | 0.69 (0.42–0.97) | Moderate (+) (+) (+) | Critical |
| Disability (4) | RCT | Not serious | Not serious | Not serious | Serious | 35 | 33 | - | −0.34 (−0.92–0.24) | Moderate (+) (+) (+) | Critical |
| Quality of life (4) | RCT | Not serious | Serious | Not serious | Serious | 53 | 44 | - | 0.40 (−0.80–1.60) | Low (+) (+) | Critical |
Publisher’s Note: MDPI stays neutral with regard to jurisdictional claims in published maps and institutional affiliations. |
© 2022 by the authors. Licensee MDPI, Basel, Switzerland. This article is an open access article distributed under the terms and conditions of the Creative Commons Attribution (CC BY) license (https://creativecommons.org/licenses/by/4.0/).
Share and Cite
Cuenca-Martínez, F.; Sempere-Rubio, N.; Varangot-Reille, C.; Fernández-Carnero, J.; Suso-Martí, L.; Alba-Quesada, P.; La Touche, R. Effects of High-Intensity Interval Training (HIIT) on Patients with Musculoskeletal Disorders: A Systematic Review and Meta-Analysis with a Meta-Regression and Mapping Report. Diagnostics 2022, 12, 2532. https://doi.org/10.3390/diagnostics12102532
Cuenca-Martínez F, Sempere-Rubio N, Varangot-Reille C, Fernández-Carnero J, Suso-Martí L, Alba-Quesada P, La Touche R. Effects of High-Intensity Interval Training (HIIT) on Patients with Musculoskeletal Disorders: A Systematic Review and Meta-Analysis with a Meta-Regression and Mapping Report. Diagnostics. 2022; 12(10):2532. https://doi.org/10.3390/diagnostics12102532
Chicago/Turabian StyleCuenca-Martínez, Ferran, Núria Sempere-Rubio, Clovis Varangot-Reille, Josué Fernández-Carnero, Luis Suso-Martí, Patricio Alba-Quesada, and Roy La Touche. 2022. "Effects of High-Intensity Interval Training (HIIT) on Patients with Musculoskeletal Disorders: A Systematic Review and Meta-Analysis with a Meta-Regression and Mapping Report" Diagnostics 12, no. 10: 2532. https://doi.org/10.3390/diagnostics12102532
APA StyleCuenca-Martínez, F., Sempere-Rubio, N., Varangot-Reille, C., Fernández-Carnero, J., Suso-Martí, L., Alba-Quesada, P., & La Touche, R. (2022). Effects of High-Intensity Interval Training (HIIT) on Patients with Musculoskeletal Disorders: A Systematic Review and Meta-Analysis with a Meta-Regression and Mapping Report. Diagnostics, 12(10), 2532. https://doi.org/10.3390/diagnostics12102532