
Screening Clinical Changes for the Diagnosis of Early Knee Osteoarthritis: A Cross-Sectional Observational Study

 ,
,  , ,
, ,  ,
,
Abstract
1. Introduction
2. Materials and Methods
2.1. Study Design
2.2. Participants
2.3. Outcome Measures
2.3.1. Descriptive, Demographic Data and Control Variables
2.3.2. Clinical Tests
Knee Morphology
Flexion Deformity
Leg Circumference
Knee Instability
Joint Proprioception
2.3.3. Motor and Functional Variables
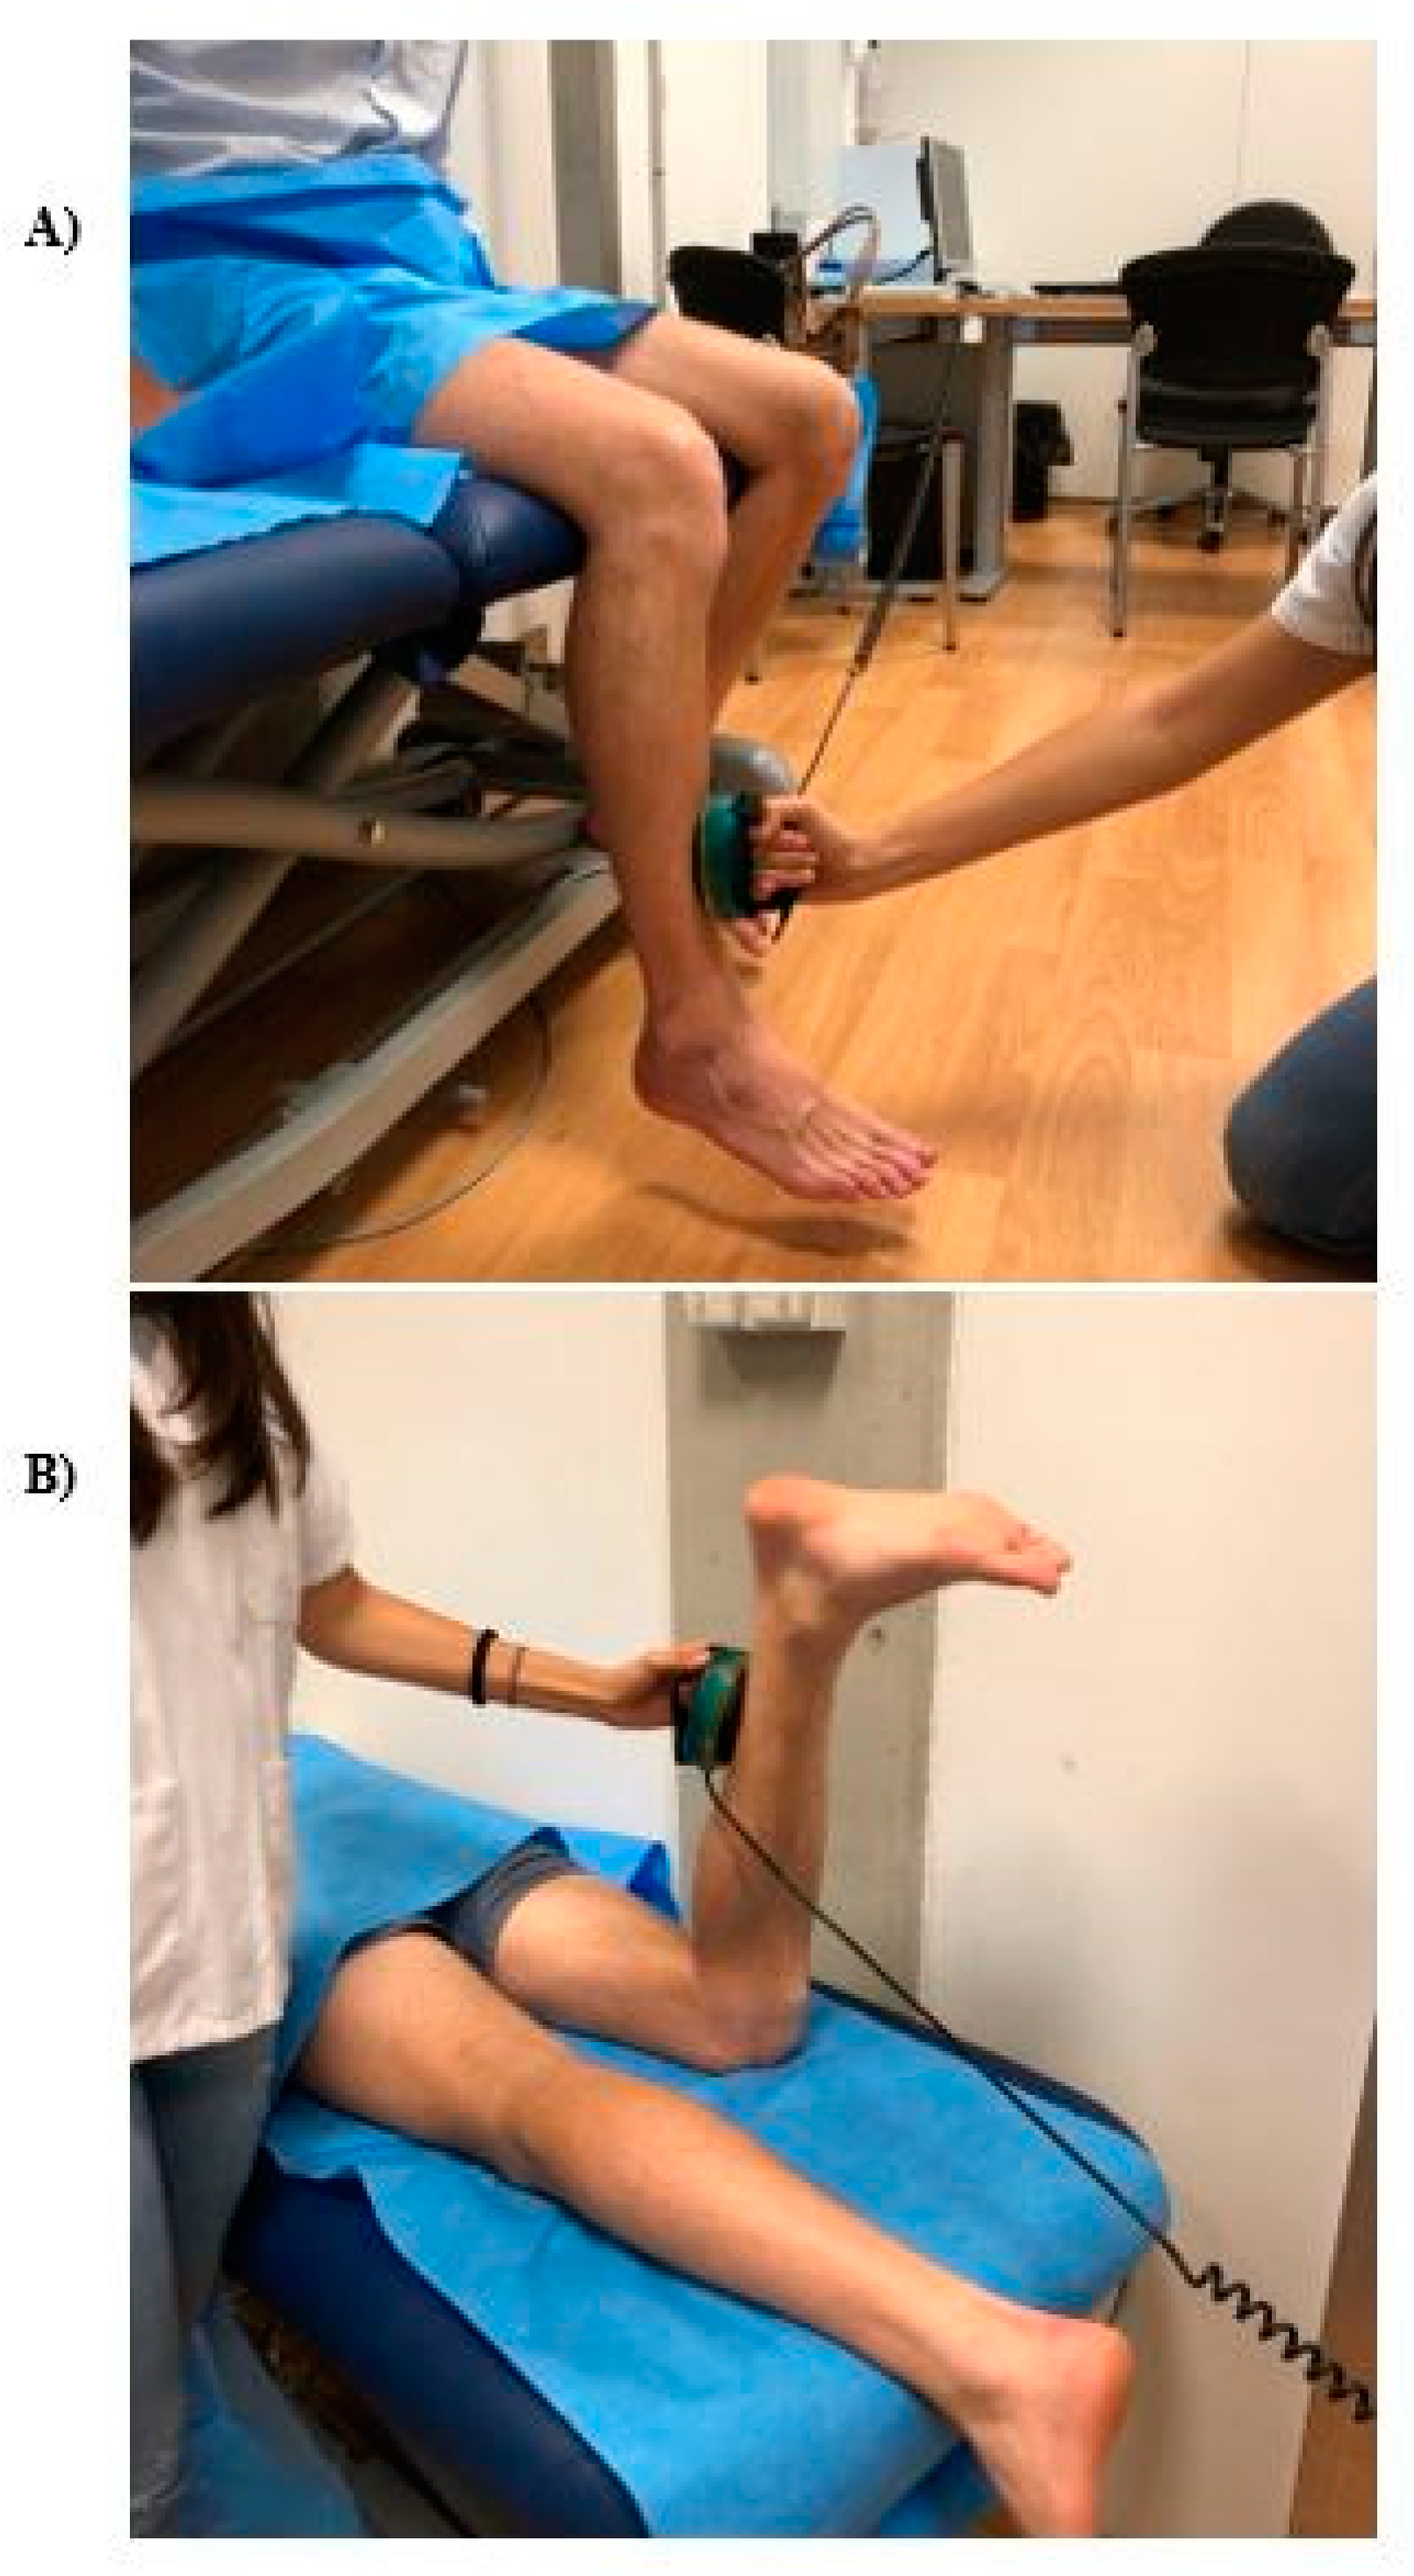
Knee Strength
Knee Range of Motion
Sit-to-Stand
Walking Speed
2.3.4. Pain and Disability Variables
Pain Intensity
Pain Type
Western Ontario and McMaster Universities Osteoarthritis Index (WOMAC)
Knee Injury and Osteoarthritis Outcome Score (KOOS)
2.3.5. Image Variables
Knee Alignment
Leg-Length Inequality (LLI)
2.4. Procedures
2.5. Statistical Analysis
3. Results
3.1. Clinical and Image Variables
3.2. Motor and Functional Variables
3.3. Correlation Analysis
4. Discussion
Limitations
5. Conclusions
Author Contributions
Funding
Institutional Review Board Statement
Informed Consent Statement
Data Availability Statement
Acknowledgments
Conflicts of Interest
References
- Emery, C.A.; Whittaker, J.L.; Mahmoudian, A.; Lohmander, L.S.; Roos, E.M.; Bennell, K.L.; Toomey, C.M.; Reimer, R.A.; Thompson, D.; Ronsky, J.L.; et al. Establishing outcome measures in early knee osteoarthritis. Nat. Rev. Rheumatol. 2019, 15, 438–448. [Google Scholar] [CrossRef] [PubMed]
- Loeser, R.F.; Goldring, S.R.; Scanzello, C.R.; Goldring, M.B. Osteoarthritis: A disease of the joint as an organ. Arthritis Rheum. 2012, 64, 1697–1707. [Google Scholar] [CrossRef] [PubMed]
- Favero, M.; Ramonda, R.; Goldring, M.B.; Goldring, S.R.; Punzi, L. Early knee osteoarthritis. RMD Open 2015, 1, e000062. [Google Scholar] [CrossRef] [PubMed]
- Felson, D.T.; Hodgson, R. Identifying and treating preclinical and early osteoarthritis. Rheum. Dis. Clin. N. Am. 2014, 40, 699–710. [Google Scholar] [CrossRef]
- Neogi, T.; Bowes, M.A.; Niu, J.; De Souza, K.M.; Vincent, G.R.; Goggins, J.; Zhang, Y.; Felson, D.T. Magnetic resonance imaging-based three-dimensional bone shape of the knee predicts onset of knee osteoarthritis: Data from the osteoarthritis initiative. Arthritis Rheum. 2013, 65, 2048–2058. [Google Scholar] [CrossRef] [PubMed]
- Madry, H.; Kon, E.; Condello, V.; Peretti, G.M.; Steinwachs, M.; Seil, R.; Berruto, M.; Engebretsen, L.; Filardo, G.; Angele, P. Early osteoarthritis of the knee. Knee Surg. Sports Traumatol. Arthrosc. 2016, 24, 1753–1762. [Google Scholar] [CrossRef] [PubMed]
- Øiestad, B.E.; Juhl, C.B.; Eitzen, I.; Thorlund, J.B. Knee extensor muscle weakness is a risk factor for development of knee osteoarthritis. A systematic review and meta-analysis. Osteoarthr. Cartil. 2015, 23, 171–177. [Google Scholar] [CrossRef]
- Silverwood, V.; Blagojevic-Bucknall, M.; Jinks, C.; Jordan, J.L.; Protheroe, J.; Jordan, K.P. Current evidence on risk factors for knee osteoarthritis in older adults: A systematic review and meta-analysis. Osteoarthr. Cartil. 2015, 23, 507–515. [Google Scholar] [CrossRef]
- Von Elm, E.; Altman, D.G.; Egger, M.; Pocock, S.J.; Gøtzsche, P.C.; Vandenbroucke, J.P. STROBE Initiative the Strengthening the Reporting of Observational Studies in Epidemiology (STROBE) statement: Guidelines for reporting observational studies. J. Clin. Epidemiol. 2008, 61, 344–349. [Google Scholar] [CrossRef]
- Mahmoudian, A.; Lohmander, L.S.; Jafari, H.; Luyten, F.P. Towards classification criteria for early-stage knee osteoarthritis: A population-based study to enrich for progressors. Semin. Arthritis Rheum. 2021, 51, 285–291. [Google Scholar] [CrossRef]
- Luyten, F.P.; Denti, M.; Filardo, G.; Kon, E.; Engebretsen, L. Definition and classification of early osteoarthritis of the knee. Knee Surg. Sports Traumatol. Arthrosc. 2012, 20, 401–406. [Google Scholar] [CrossRef] [PubMed]
- Zhang, W.; McWilliams, D.F.; Ingham, S.L.; Doherty, S.A.; Muthuri, S.; Muir, K.R.; Doherty, M. Nottingham knee osteoarthritis risk prediction models. Ann. Rheum. Dis. 2011, 70, 1599–1604. [Google Scholar] [CrossRef] [PubMed]
- Deep, K.; Nunag, P.; Willcox, N.; Deakin, A.H.; Picard, F. A Comparison of Three Different Methods of Measurement of Knee Deformity in Osteoarthritis. J. Orthop. Rheumatol. Sports Med. 2016, 1, 107. [Google Scholar] [CrossRef][Green Version]
- Bakar, Y.; Özdemir, Ö.; Sevim, S.; Duygu, E.; Tuğral, A.; Sürmeli, M. Intra-observer and inter-observer reliability of leg circumference measurement among six observers: A single blinded randomized trial. J. Med. Life 2017, 10, 176–181. [Google Scholar] [PubMed]
- Malanga, G.A.; Andrus, S.; Nadler, S.F.; McLean, J. Physical examination of the knee: A review of the original test description and scientific validity of common orthopedic tests. Arch. Phys. Med. Rehabil. 2003, 84, 592–603. [Google Scholar] [CrossRef] [PubMed]
- Lokhande, M.V.; Shetye, J.; Mehta, A.; Deo, M.V. Assessment of Knee Joint Proprioception in Weight Bearing and in Non-Weight Bearing Positions in Normal Subjects. J. Krishna Inst. Med. Sci. Univ. 2013, 2, 94–101. [Google Scholar]
- Ruhdorfer, A.; Wirth, W.; Eckstein, F. Longitudinal Change in Thigh Muscle Strength Prior to and Concurrent with Minimum Clinically Important Worsening or Improvement in Knee Function: Data from the Osteoarthritis Initiative. Arthritis Rheumatol. 2016, 68, 826–836. [Google Scholar] [CrossRef]
- Bohannon, R.W.; Bubela, D.J.; Magasi, S.R.; Gershon, R.C. Relative reliability of three objective tests of limb muscle strength. Isokinet. Exerc. Sci. 2011, 19, 77–81. [Google Scholar] [CrossRef]
- Bhave, A.; Shabtai, L.; Woelber, E.; Apelyan, A.; Paley, D.; Herzenberg, J.E. Muscle strength and knee range of motion after femoral lengthening: 2- to 5-year follow-up. Acta Orthop. 2017, 88, 179–184. [Google Scholar] [CrossRef]
- Paul, S.S.; Canning, C.G. Five-repetition sit-to-stand. J. Physiother. 2014, 60, 168. [Google Scholar] [CrossRef]
- Bohannon, R.W.; Andrews, A.W.; Thomas, M.W. Walking speed: Reference values and correlates for older adults. J. Orthop. Sports Phys. Ther. 1996, 24, 86–90. [Google Scholar] [CrossRef] [PubMed]
- Bohannon, R.W. Comfortable and maximum walking speed of adults aged 20–79 years: Reference values and determinants. Age Ageing 1997, 26, 15–19. [Google Scholar] [CrossRef] [PubMed]
- Bijur, P.E.; Silver, W.; Gallagher, E.J. Reliability of the visual analog scale for measurement of acute pain. Acad. Emerg. Med. 2001, 8, 1153–1157. [Google Scholar] [CrossRef] [PubMed]
- Ostelo, R.W.J.G.; Deyo, R.A.; Stratford, P.; Waddell, G.; Croft, P.; Von Korff, M.; Bouter, L.M.; de Vet, H.C. Interpreting Change Scores for Pain and Functional Status in Low Back Pain. Spine 2008, 33, 90–94. [Google Scholar] [CrossRef]
- Leyland, K.M.; Gates, L.S.; Nevitt, M.; Felson, D.; Bierma-Zeinstra, S.M.; Conaghan, P.G.; Engebretsen, L.; Hochberg, M.; Hunter, D.J.; Jones, G.; et al. Harmonising measures of knee and hip osteoarthritis in population-based cohort studies: An international study. Osteoarthr. Cartil. 2018, 26, 872–879. [Google Scholar] [CrossRef]
- Escobar, A.; Quintana, J.M.; Bilbao, A.; Azkárte, J.; Güenaga, L.I. Validation of the Spanish version of the WOMAC questionaire for patients with hip or knee osteoarthritis. Clin. Rheumatol. 2002, 21, 466–471. [Google Scholar] [CrossRef]
- Vaquero, J.; Longo, U.G.; Forriol, F.; Martinelli, N.; Vethencourt, R.; Denaro, V. Reliability, validity and responsiveness of the Spanish version of the Knee Injury and Osteoarthritis Outcome Score (KOOS) in patients with chondral lesion of the knee. Knee Surg. Sports Traumatol. Arthrosc. 2014, 22, 104–108. [Google Scholar] [CrossRef]
- Mouri, H. Log-normal distribution from a process that is not multiplicative but is additive. Phys. Rev. E 2013, 88, 42124. [Google Scholar] [CrossRef]
- Nixon, R.M.; Wonderling, D.; Grieve, R.D. Non-parametric methods for cost-effectiveness analysis: The central limit theorem and the bootstrap compared. Health Econ. 2010, 19, 316–333. [Google Scholar] [CrossRef]
- Hinkle, D.E.; Wiersma, W.; Jurs, S.G. Applied Statistics for the Behavioral Sciences. Source J. Educ. Stat. 1990, 15, 84–87. [Google Scholar]
- Mahmoudian, A.; Lohmander, L.S.; Mobasheri, A.; Englund, M.; Luyten, F.P. Early-stage symptomatic osteoarthritis of the knee—Time for action. Nat. Rev. Rheumatol. 2021, 17, 621–632. [Google Scholar] [CrossRef] [PubMed]
- Prieto-Alhambra, D.; Judge, A.; Javaid, M.K.; Cooper, C.; Diez-Perez, A.; Arden, N.K. Incidence and risk factors for clinically diagnosed knee, hip and hand osteoarthritis: Influences of age, gender and osteoarthritis affecting other joints. Ann. Rheum. Dis. 2014, 73, 1659–1664. [Google Scholar] [CrossRef] [PubMed]
- Weiss, E. Knee osteoarthritis, body mass index and pain: Data from the osteoarthritis initiative. Rheumatoogy 2014, 53, 2095–2099. [Google Scholar] [CrossRef] [PubMed]
- Neogi, T.; Zhang, Y. Osteoarthritis prevention. Curr. Opin. Rheumatol. 2011, 23, 185–191. [Google Scholar] [CrossRef]
- Hurley, M.; Dickson, K.; Hallett, R.; Grant, R.; Hauari, H.; Walsh, N.; Stansfield, C.; Oliver, S. Exercise interventions and patient beliefs for people with hip, knee or hip and knee osteoarthritis: A mixed methods review. Cochrane Database Syst. Rev. 2018, 4, CD010842. [Google Scholar] [CrossRef]
- Lee, J.; Chang, R.W.; Ehrlich-Jones, L.; Kwoh, C.K.; Nevitt, M.; Semanik, P.A.; Sharma, L.; Sohn, M.W.; Song, J.; Dunlop, D.D. Sedentary behavior and physical function: Objective evidence from the osteoarthritis initiative. Arthritis Care Res. 2015, 67, 366–373. [Google Scholar] [CrossRef]
- Sharma, L. Osteoarthritis year in review 2015: Clinical. Osteoarthr. Cartil. 2016, 24, 36–48. [Google Scholar] [CrossRef]
- White, D.K.; Tudor-Locke, C.; Zhang, Y.; Fielding, R.; Lavalley, M.; Felson, D.T.; Gross, K.D.; Nevitt, M.C.; Lewis, C.E.; Torner, J.; et al. Daily walking and the risk of incident functional limitation in knee osteoarthritis: An observational study. Arthritis Care Res. 2014, 66, 1328–1336. [Google Scholar] [CrossRef]
- Ruhdorfer, A.; Wirth, W.; Hitzl, W.; Nevitt, M.; Eckstein, F. Association of Thigh Muscle Strength with Knee Symptoms and Radiographic Disease Stage of Osteoarthritis: Data from the Osteoarthritis Initiative. Arthritis Care Res. 2014, 66, 1344–1353. [Google Scholar] [CrossRef]
- Runhaar, J.; van Middelkoop, M.; Reijman, M.; Vroegindeweij, D.; Oei, E.H.G.; Bierma-Zeinstra, S.M.A. Malalignment: A possible target for prevention of incident knee osteoarthritis in overweight and obese women. Rheumatology 2014, 53, 1618–1624. [Google Scholar] [CrossRef]
- Marks, P.H.; Donaldson, M.L.C. Inflammatory cytokine profiles associated with chondral damage in the anterior cruciate ligament-deficient knee. Arthrosc.—J. Arthrosc. Relat. Surg. 2005, 21, 1342–1347. [Google Scholar] [CrossRef] [PubMed]
- Keays, S.L.; Bullock-Saxton, J.E.; Newcombe, P.; Keays, A.C. The relationship between knee strength and functional stability before and after anterior cruciate ligament reconstruction. J. Orthop. Res. 2003, 21, 231–237. [Google Scholar] [CrossRef]
- Greif, D.N.; Kouroupis, D.; Murdock, C.J.; Griswold, A.J.; Kaplan, L.D.; Best, T.M.; Correa, D. Infrapatellar Fat Pad/Synovium Complex in Early-Stage Knee Osteoarthritis: Potential New Target and Source of Therapeutic Mesenchymal Stem/Stromal Cells. Front. Bioeng. Biotechnol. 2020, 8, 860. [Google Scholar] [CrossRef] [PubMed]
- Roman-Blas, J.A.; Mendoza-Torres, L.A.; Largo, R.; Herrero-Beaumont, G. Setting up distinctive outcome measures for each osteoarthritis phenotype. Ther. Adv. Musculoskelet. Dis. 2020, 12. [Google Scholar] [CrossRef] [PubMed]


| EOA (n = 54) | HS (n = 43) | p Value | |
|---|---|---|---|
| Age (years) | 51.81 ± 5.65 | 51.05 ± 6.21 | 0.44 |
| BMI (kg/m2) | 27.28 ± 4.08 | 28.01 ± 2.96 | 0.59 |
| KL Grade | 0.67 | ||
| 0 | 19 (35) | 23 (54) | |
| 1 | 35 (65) | 20 (46) | |
| Gender | 0.78 | ||
| Men | 22 (40.8) | 14 (32.5) | |
| Women | 32 (59.2) | 21 (67.5) | |
| Hormonal status | 0.19 | ||
| Pre-menopausal | 12 (37.5) | 14 (66.6) | |
| Post-menopausal | 20 (62.5) | 7 (33.3) | |
| Smoking | 0.55 | ||
| Yes | 9 (16.6) | 4 (9.3) | |
| No | 21 (38.9) | 19 (44.2) | |
| Ex | 24 (44.5) | 20 (46.5) | |
| Alcohol | 0.66 | ||
| Never | 6 (11.1) | 4 (9.3) | |
| Seldom | 14 (25.9) | 12 (27.9) | |
| 1–2 times/month | 13 (24.1) | 11 (25.6) | |
| 1–2 times/week | 17 (31.5) | 13 (30.3) | |
| 1 time per day | 3 (5.5) | 2 (4.6) | |
| More than 1 a day | 1 (1.9) | 1 (2.3) | |
| Previous Injuries Left | 0.35 | ||
| No | 42 (77.3) | 27 (62.8) | |
| Yes | 12 (22.2) | 16 (37.2) | |
| Meniscus | 8 | 3 | |
| Ligament | 0 | 4 | |
| Bone | 0 | 2 | |
| Cartilage | 1 | 2 | |
| Unspecific | 3 | 5 | |
| Previous Injuries Right | 0.47 | ||
| No | 40 (74.1) | 25 (58.2) | |
| Yes | 14 (25.9) | 18 (41.8) | |
| Meniscus | 4 | 7 | |
| Ligament | 5 | 2 | |
| Bone | 1 | 1 | |
| Cartilage | 1 | 2 | |
| Unspecific | 3 | 6 | |
| Knee morphology | 0.89 | ||
| Normal | 52 (96.3) | 43 (100) | |
| Altered | 2 (3.7) | 0 (0) | |
| Occupational risk | 0.68 | ||
| Never | 16 (29.6) | 10 (23.3) | |
| Seldom | 12 (22.2) | 11 (25.6) | |
| 1–2 times/month | 3 (5.6) | 5 (11.6) | |
| 1–2 times/week | 6 (11.1) | 1 (2.3) | |
| 1 a day | 9 (16.7) | 9 (20.9) | |
| Always | 8 (14.8) | 7 (16.3) | |
| Family history | 0.56 | ||
| Yes | 38 (70.4) | 32 (74.4) | |
| No | 16 (29.6) | 11 (25.6) | |
| OA Hand history | 0.25 | ||
| Yes | 11 (20.4) | 6 (14.0) | |
| No | 43 (79.6) | 37 (86.0) | |
| OA Hip history | 0.66 | ||
| Yes | 8 (14.8) | 7 (16.3) | |
| No | 46 (85.2) | 36 (83.7) | |
| Sport | 0.54 | ||
| Yes | 24 (45.5) | 27 (62.8) | |
| No | 30 (55.5) | 16 (37.2) | |
| Education level Primary Secondary College | 9 (16.6) 19 (35.2) 26 (48.2) | 6 (13.9) 15 (34.9) 22 (51.2) | 0.92 |
| Marital status Single Married Divorced Widow | 6 (11.1) 36 (66.7) 10 (18.5) 2 (3.7) | 7 (16.2) 32 (74.4) 2 (4.7) 2 (4.7) | 0.22 |
| EOA (n = 54) | HS (n = 43) | p Value | |
|---|---|---|---|
| Pain | <0.01 | ||
| Yes | 45 (83.3) | 16 (37.2) | |
| No | 9 (16.6) | 27 (62.8) | |
| Pain side | 0.55 | ||
| Left | 7 (15.6) | 3 (18.8) | |
| Right | 14 (31.1) | 4 (25) | |
| Both | 24 (53.3) | 9 (56.2) | |
| NHANES Pain Left | 0.67 | ||
| No pain | 34 (63.0) | 29 (67.5) | |
| A | 10 (18.5) | 9 (20.9) | |
| C | 10 (18.5) | 5 (11.6) | |
| NHANES Pain Right | 0.2 | ||
| No pain | 30 (55.6) | 29 (67.4) | |
| A | 14 (25.9) | 5 (11.6) | |
| C | 10 (18.5) | 9 (20.9) | |
| Crepitus Left | 0.65 | ||
| Yes | 39 (72.2) | 33 (76.7) | |
| No | 15 (27.8) | 10 (23.3) | |
| Crepitus Right | 0.66 | ||
| Yes | 34 (62.9) | 29 (67.4) | |
| No | 20 (37.1) | 14 (32.6) | |
| Instability Left | 0.01 | ||
| Yes | 18 (33.3) | 5 (11.6) | |
| No | 36 (66.6) | 38 (88.4) | |
| Instability Right | 0.05 | ||
| Yes | 26 (48.1) | 12 (27.9) | |
| No | 28 (51.9) | 31 (72.1) | |
| Deformity Left | 0.69 | ||
| Yes | 16 (29.6) | 13 (30.2) | |
| No | 38 (70.4) | 30 (69.8) | |
| Deformity Right | 0.86 | ||
| Yes | 16 (29.6) | 12 (27.9) | |
| No | 38 (70.4) | 31 (72.1) | |
| Knee alignment Left | 0.04 | ||
| Neutral | 6 (11.1) | 11 (25.6) | |
| Varus | 32 (59.3) | 16 (37.2) | |
| Valgus | 16 (29.6) | 16 (37.2) | |
| Knee alignment Right | 0.47 | ||
| Neutral | 7 (12.9) | 5 (11.6) | |
| Varus | 32 (57.4) | 21 (48.8) | |
| Valgus | 15 (27.8) | 17 (39.6) | |
| Leg length inequality | 0.13 | ||
| Yes | 18 (33.3) | 8 (18.6) | |
| No | 36 (66.7) | 35 (81.4) | |
| Leg circumference | 0.32 | ||
| Yes | 42 (77.7) | 34 (79.1) | |
| No | 12 (22.3) | 9 (20.9) | |
| Proprioception Left | 0.88 | ||
| Altered | 44 (81.5) | 32 (74.4) | |
| Normal | 10 (18.5) | 11 (25.6) | |
| Proprioception Right | 0.33 | ||
| Altered | 35 (64.8) | 31 (72.1) | |
| Normal | 19 (35.2) | 12 (27.9) |
| Measures | EOA (n = 54) | HS (n = 43) | Mean Difference (95% CI) | Effect Size (d) |
|---|---|---|---|---|
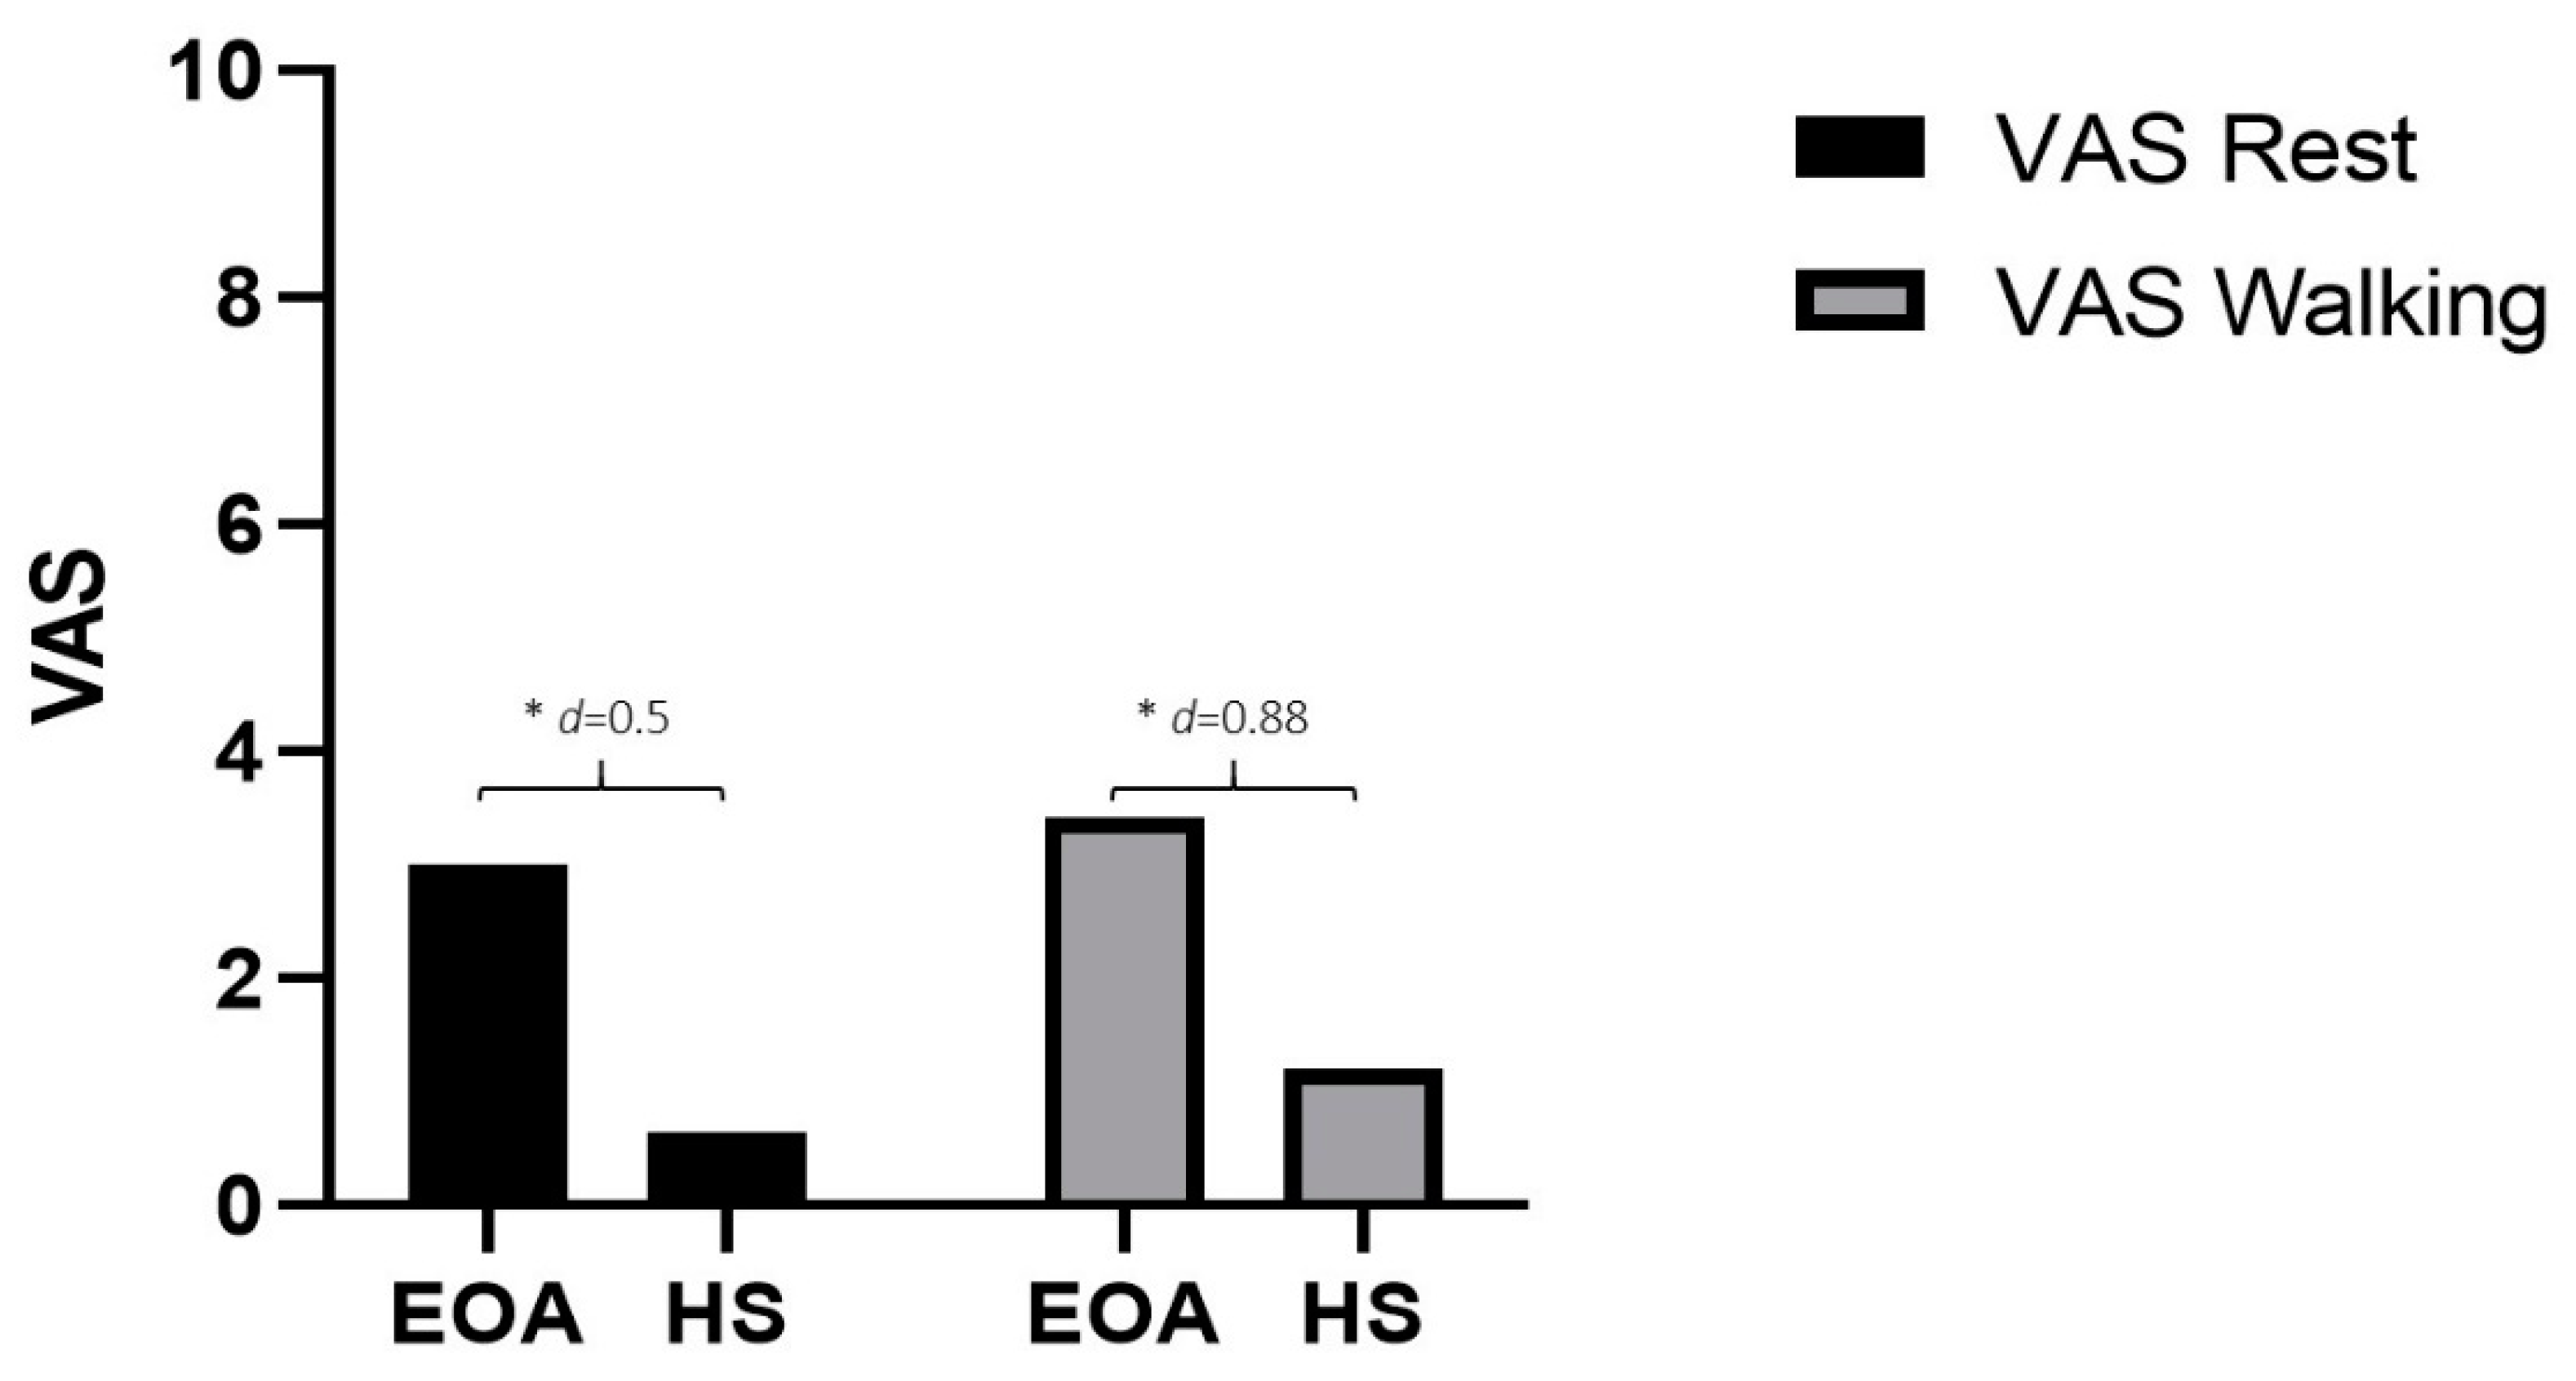
| VAS Rest | 3.0 ± 6.44 | 0.65 ± 1.53 | −2.35 * (−4.35 to −0.35) | 0.5 |
| VAS Walking | 3.42 ± 2.75 | 1.21 ± 2.23 | −2.21 * (−3.24 to −1.18) | 0.88 |
| WOMAC | 0.25 ± 0.13 | 0.12 ± 0.13 | −0.13 ** (−0.19 to −0.7) | 1.01 |
| KOOS | ||||
| Pain | 73.5 ± 13.79 | 89.29 ± 14.56 | 15.79 ** (10.01 to 21.56) | −1.11 |
| Symptoms | 77.87 ± 12.66 | 90.79 ± 12.76 | 12.91 ** (7.73 to 18.1) | −1.01 |
| ADL | 77.7 ± 15.94 | 90.83 ± 10.56 | 13.13 ** (7.47 to 18.79) | −0.97 |
| QQL | 52.63 ± 24.86 | 76.17 ± 23.96 | 23.54 ** (13.58 to 33.49) | −0.96 |
| Strength Left (Kg) | ||||
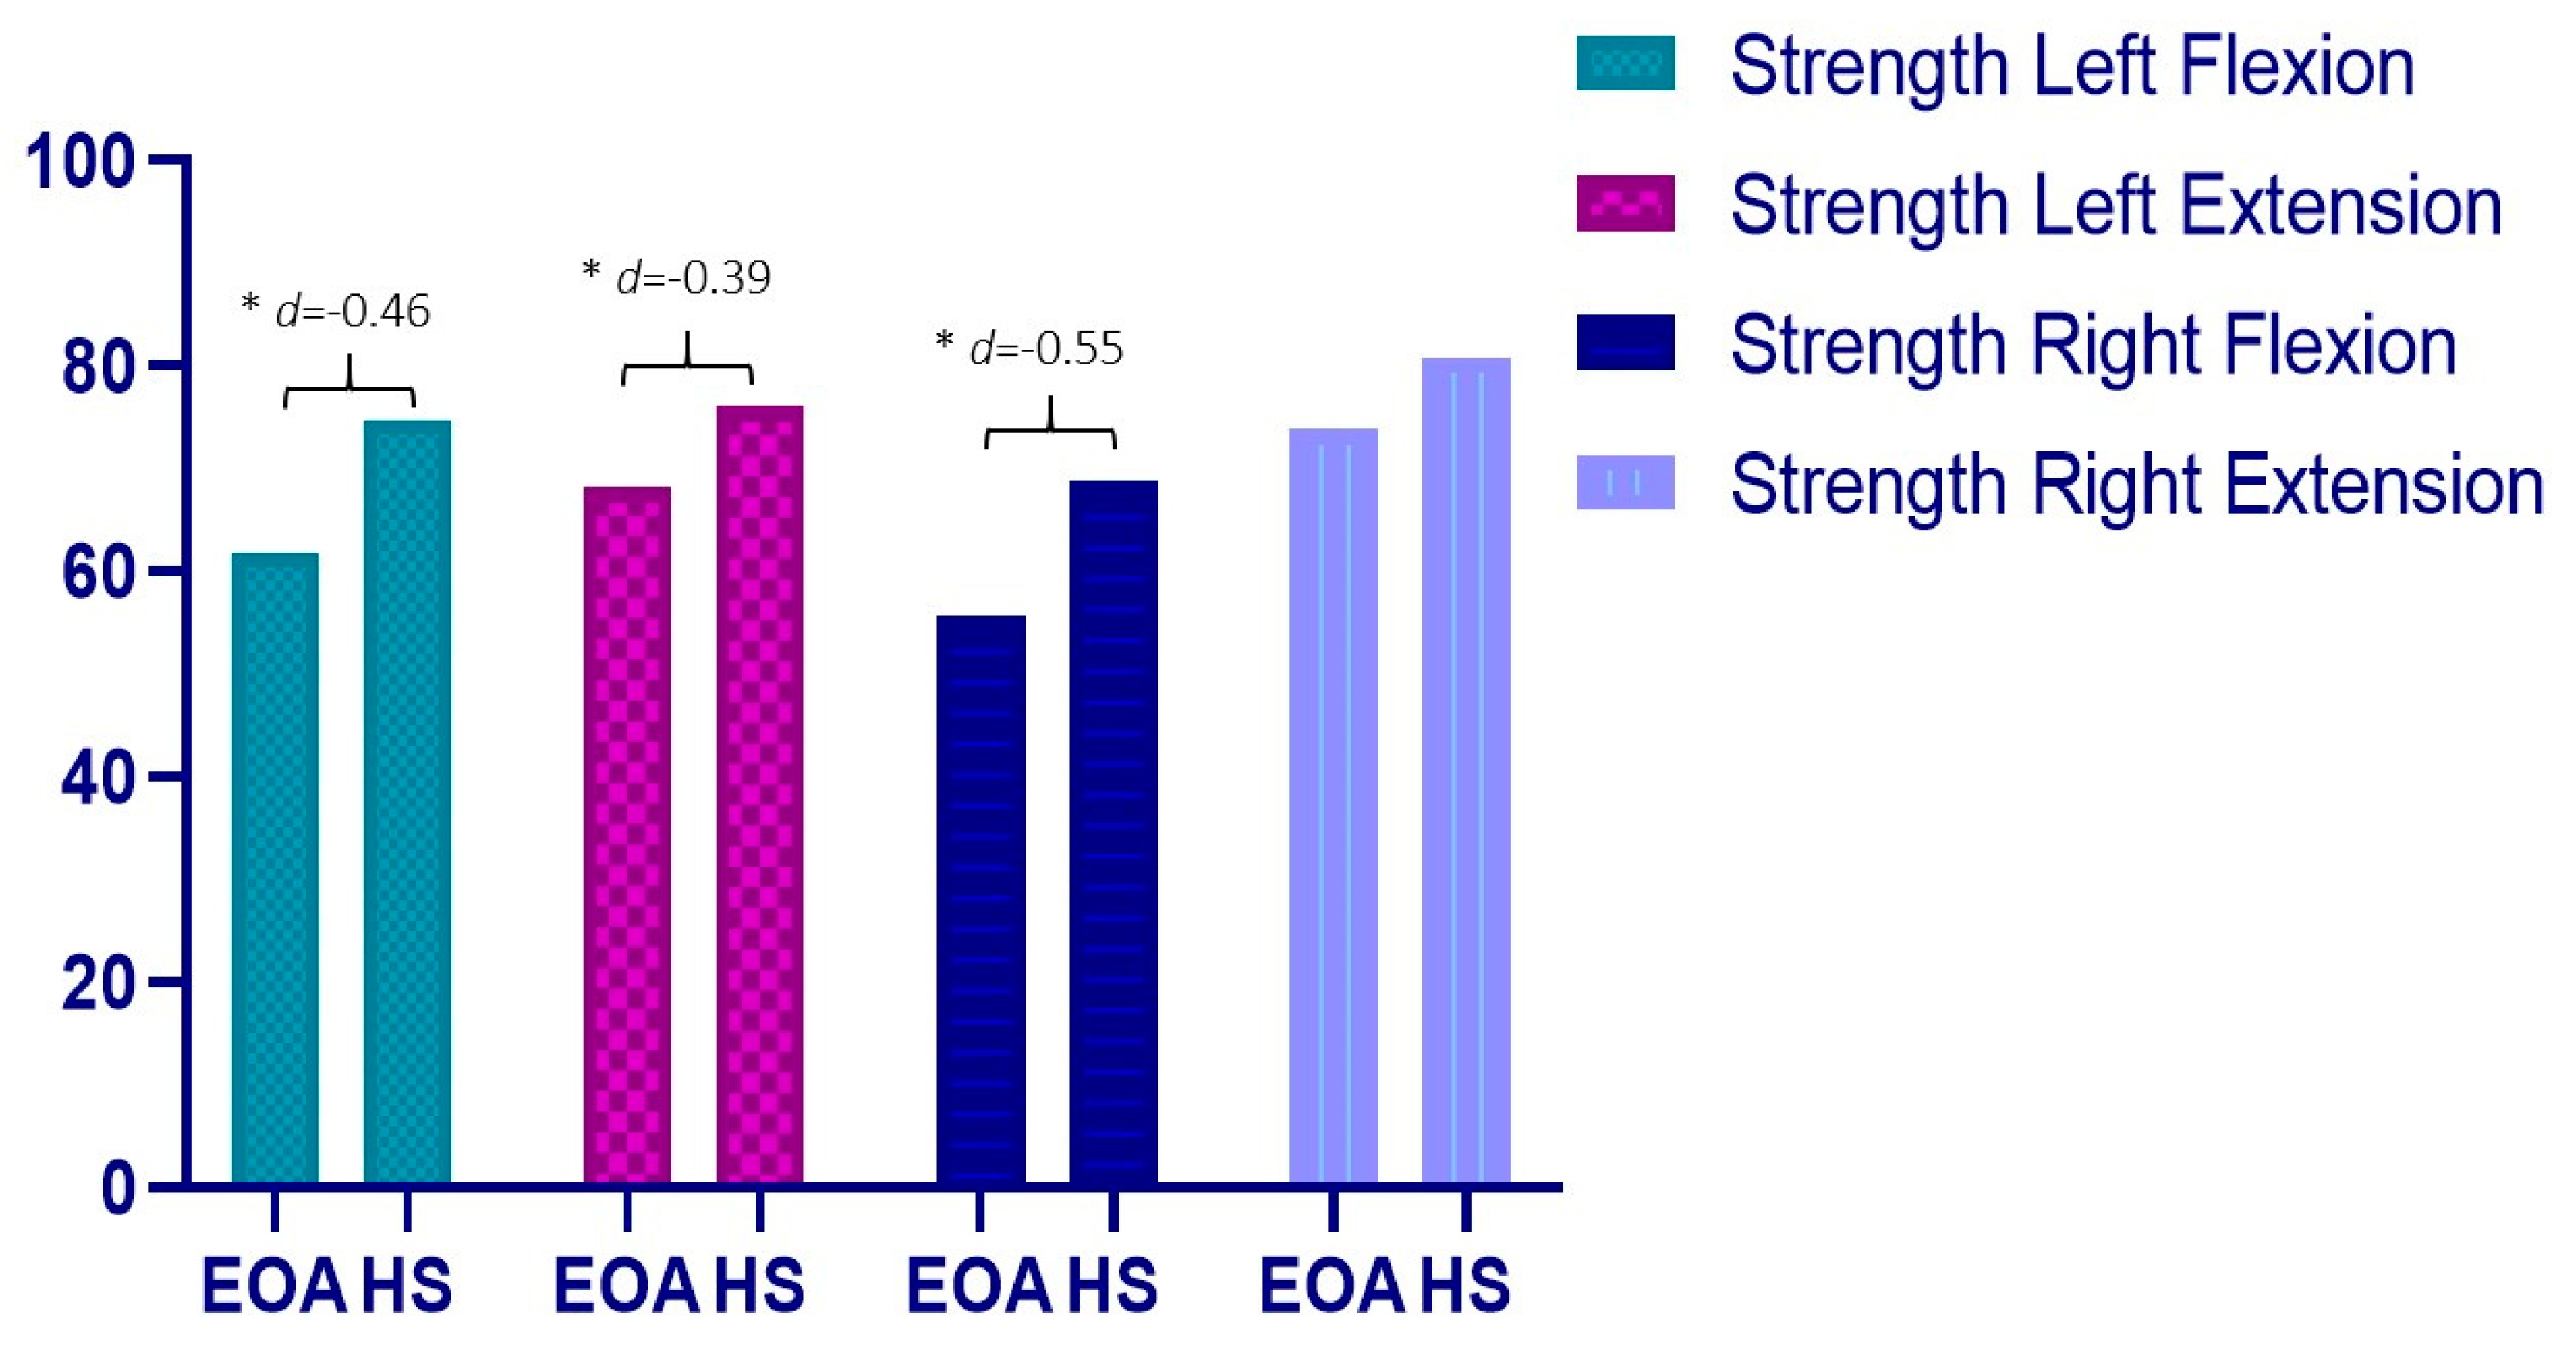
| Flexion | 61.91 ± 21.57 | 74.83 ± 33.00 | 12.92 * (0.45 to 25.39) | −0.46 |
| Extension | 68.24 ± 21.47 | 76.05 ± 17.81 | 7.81 * (1.26 to 16.88) | −0.39 |
| Strength Right (Kg) | ||||
| Flexion | 55.71 ± 16.52 | 68.77 ± 28.85 | 13.06 * (2.59 to 23.52) | −0.55 |
| Extension | 73.89 ± 22.98 | 80.86 ± 22.21 | 6.97 (−3.34 to 17.29) | −0.31 |
| ROM Left Leg (°) | 132.39 ± 9.61 | 132.43 ± 12.75 | 0.04 (−4.91 to 5.00) | −0.01 |
| ROM Right Leg (°) | 132.61 ± 8.11 | 131.84 ± 12.19 | −0.78 (−5.29 to 3.74) | 0.07 |
| Sit to stand (sec) | 13.18 ± 4.27 | 11.26 ± 2.61 | −1.91 * (−3.52 to −0.31) | 0.54 |
| Walking speed (sec) | 3.54 ± 0.89 | 3.36 ± 0.63 | −0.17 (−0.53 to 0.18) | 0.23 |
| Variable | Group | VAS Rest | VAS Walking | Strength Left F | Strength Left E | Strength Right F | Strength Right E | ROM Left | ROM Right | Sit-to-Stand | Walking Speed |
|---|---|---|---|---|---|---|---|---|---|---|---|
| VAS Rest | EOA | 1 | 0.28 * | −0.01 | 0.15 | −0.1 | −0.05 | −0.14 | −0.32 * | 0.02 | 0.04 |
| HS | 1 | 0.69 ** | −0.09 | 0.05 | −0.16 | −0.09 | −0.62 ** | −0.62 * | 0.35* | 0.4 * | |
| VAS Walking | EOA | 0.28 * | 1 | −0.33 * | −0.20 | −0.13 | −0.24 | −0.41 ** | −0.24 | 0.31 * | 0.44 ** |
| HS | 0.69 ** | 1 | −0.13 | −0.22 | −0.22 | −0.13 | −0.28 | −0.24 | 0.14 | 0.32 | |
| BMI | EOA | 0.09 | 0.24 | 0.14 | 0.13 | 0.09 | 0.01 | −0.66 ** | −0.55 ** | 0.11 | 0.32 * |
| HS | 0.01 | −0.03 | 0.27 | 0.28 | 0.25 | −0.18 | −0.31 | −0.34 | 0.26 | 0.05 | |
| WOMAC | EOA | 0.15 | 0.56 ** | −0.12 | −0.05 | 0.11 | −0.15 | −0.17 | −0.27 | 0.27 | 0.19 |
| HS | 0.52 ** | 0.63 ** | −0.24 | −0.17 | −0.27 | 0.06 | −0.08 | −0.09 | 0.25 | 0.59 ** |
Publisher’s Note: MDPI stays neutral with regard to jurisdictional claims in published maps and institutional affiliations. |
© 2022 by the authors. Licensee MDPI, Basel, Switzerland. This article is an open access article distributed under the terms and conditions of the Creative Commons Attribution (CC BY) license (https://creativecommons.org/licenses/by/4.0/).
Share and Cite
Alabajos-Cea, A.; Herrero-Manley, L.; Suso-Martí, L.; Sempere-Rubio, N.; Cuenca-Martínez, F.; Muñoz-Alarcos, V.; Pérez-Barquero, J.A.; Viosca-Herrero, E.; Vázquez-Arce, I. Screening Clinical Changes for the Diagnosis of Early Knee Osteoarthritis: A Cross-Sectional Observational Study. Diagnostics 2022, 12, 2631. https://doi.org/10.3390/diagnostics12112631
Alabajos-Cea A, Herrero-Manley L, Suso-Martí L, Sempere-Rubio N, Cuenca-Martínez F, Muñoz-Alarcos V, Pérez-Barquero JA, Viosca-Herrero E, Vázquez-Arce I. Screening Clinical Changes for the Diagnosis of Early Knee Osteoarthritis: A Cross-Sectional Observational Study. Diagnostics. 2022; 12(11):2631. https://doi.org/10.3390/diagnostics12112631
Chicago/Turabian StyleAlabajos-Cea, Ana, Luz Herrero-Manley, Luis Suso-Martí, Núria Sempere-Rubio, Ferran Cuenca-Martínez, Vicente Muñoz-Alarcos, Juan Alonso Pérez-Barquero, Enrique Viosca-Herrero, and Isabel Vázquez-Arce. 2022. "Screening Clinical Changes for the Diagnosis of Early Knee Osteoarthritis: A Cross-Sectional Observational Study" Diagnostics 12, no. 11: 2631. https://doi.org/10.3390/diagnostics12112631
APA StyleAlabajos-Cea, A., Herrero-Manley, L., Suso-Martí, L., Sempere-Rubio, N., Cuenca-Martínez, F., Muñoz-Alarcos, V., Pérez-Barquero, J. A., Viosca-Herrero, E., & Vázquez-Arce, I. (2022). Screening Clinical Changes for the Diagnosis of Early Knee Osteoarthritis: A Cross-Sectional Observational Study. Diagnostics, 12(11), 2631. https://doi.org/10.3390/diagnostics12112631