
Transfer Learning for the Detection and Diagnosis of Types of Pneumonia including Pneumonia Induced by COVID-19 from Chest X-ray Images

 , , ,
, , ,
Abstract
:1. Introduction
1.1. Problem Statement
1.2. Objectives
1.3. Contributions
1.4. Outline
2. Related Literature
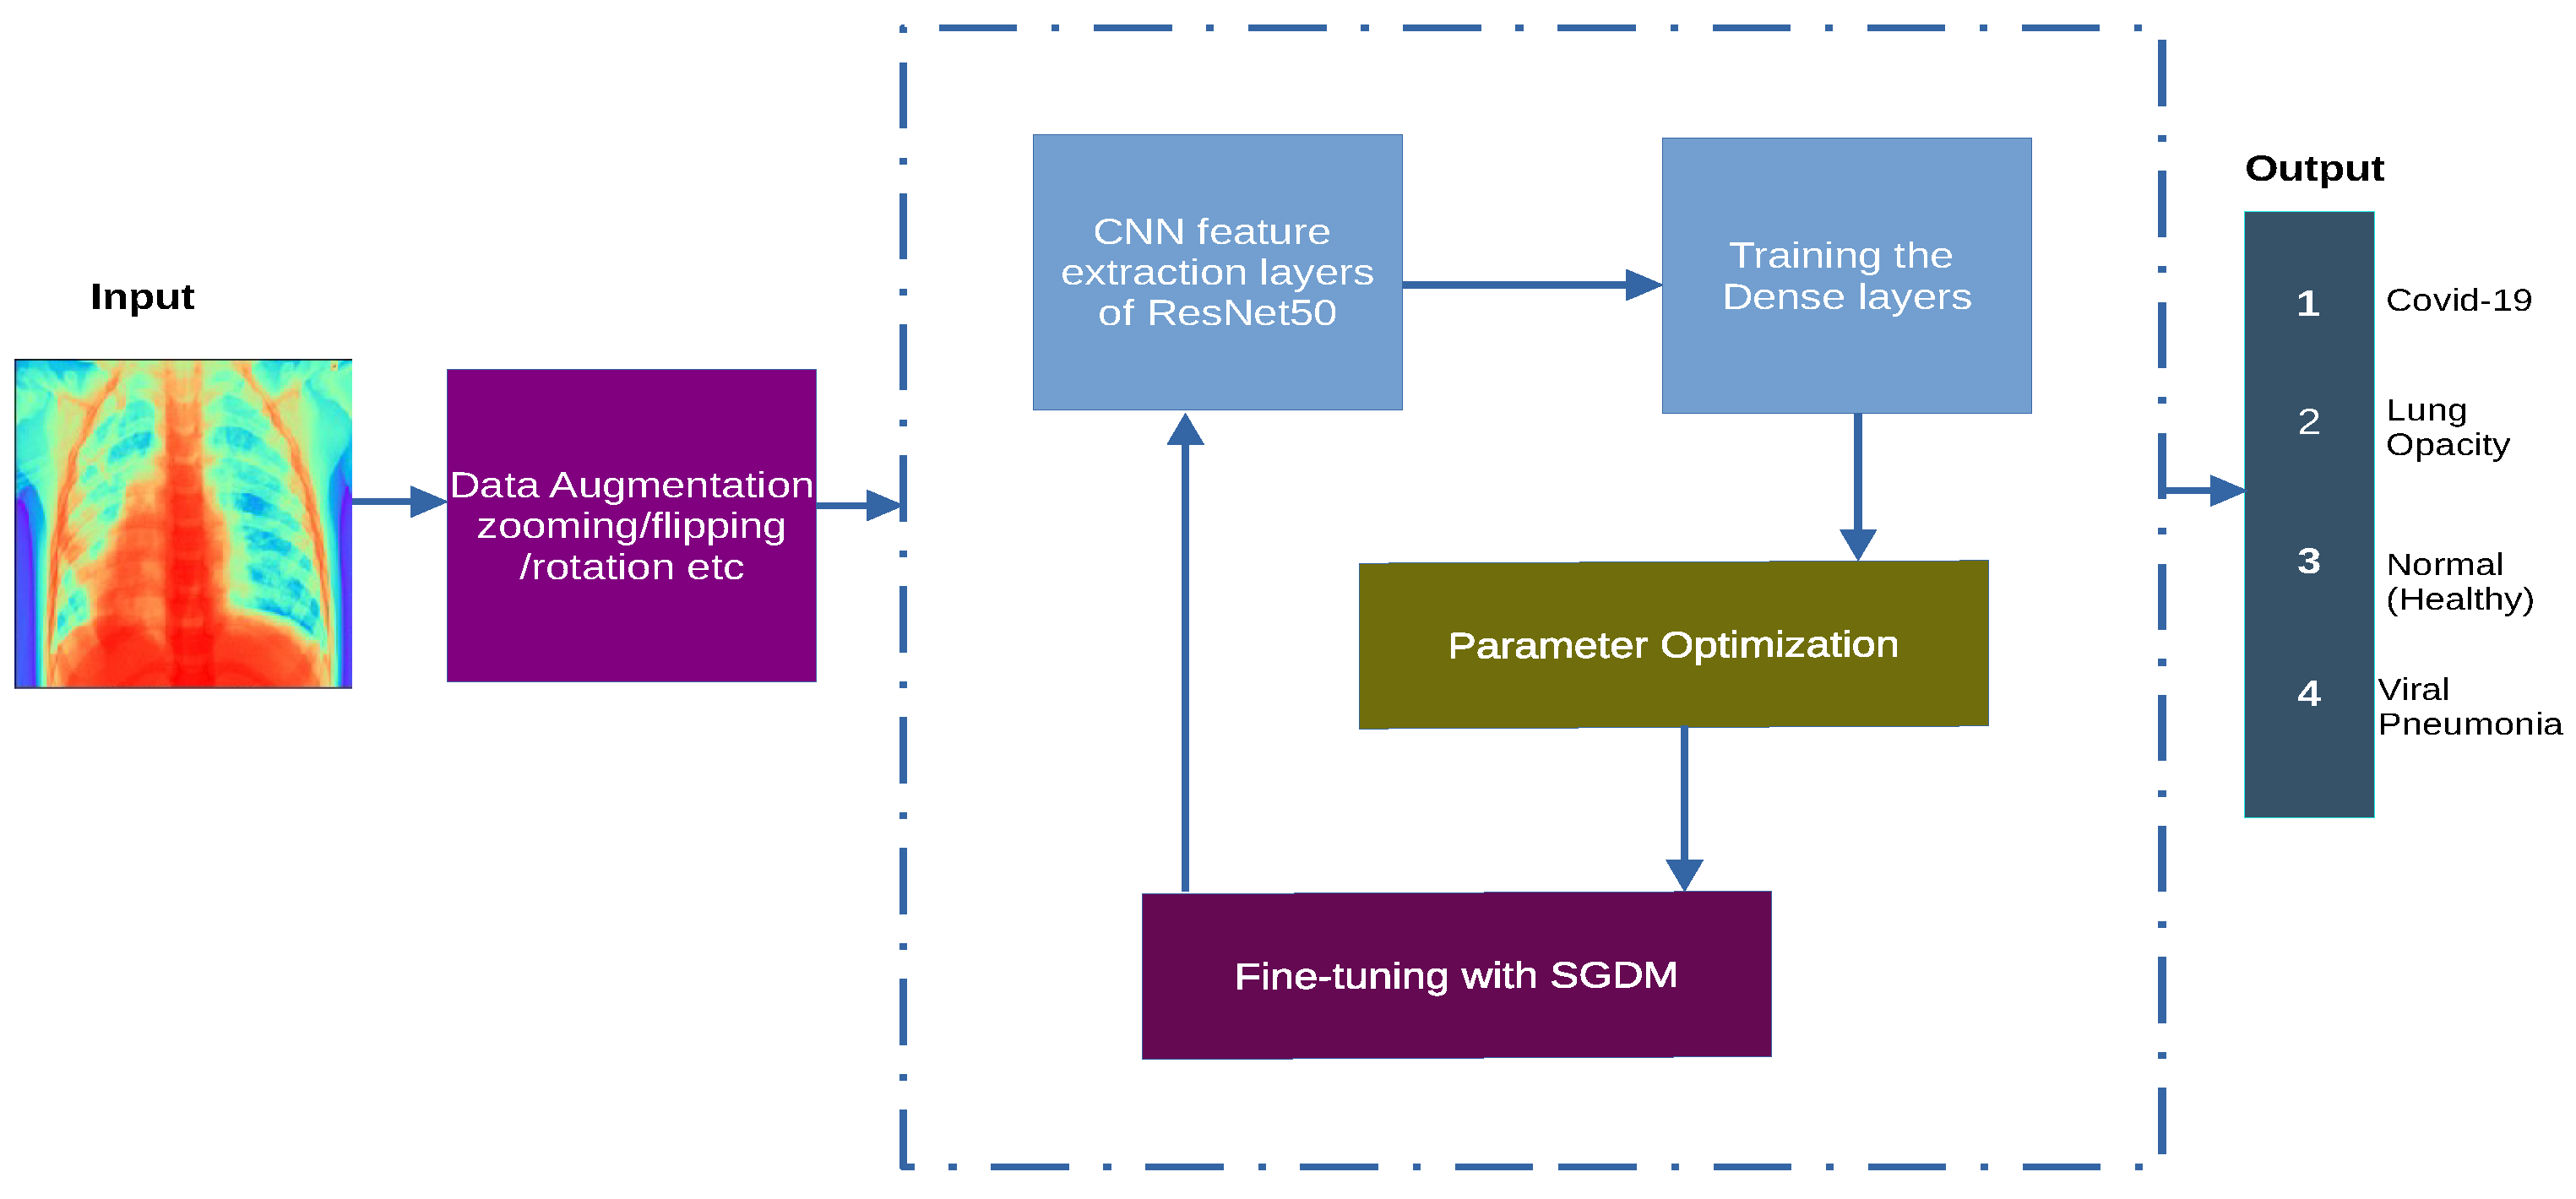
3. Methods
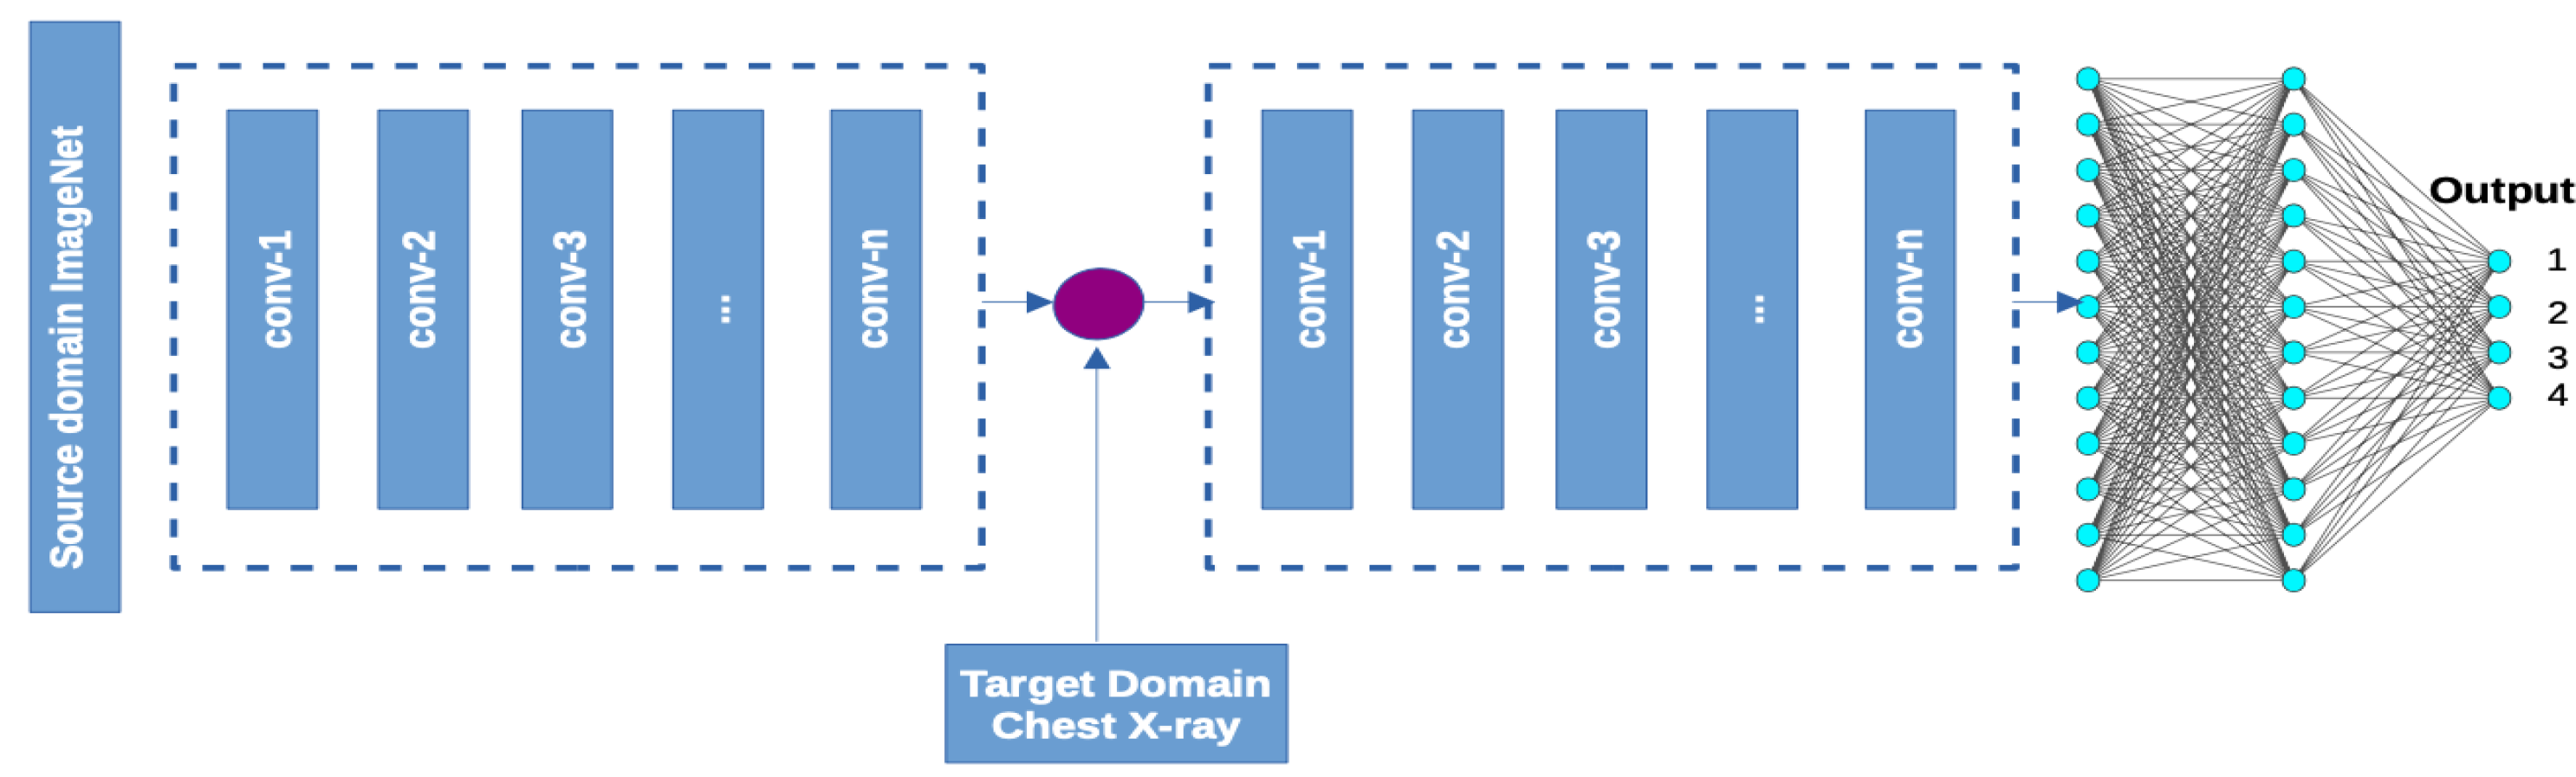
3.1. Transfer Learning
3.2. System Architecture
3.3. System Model and Assumptions
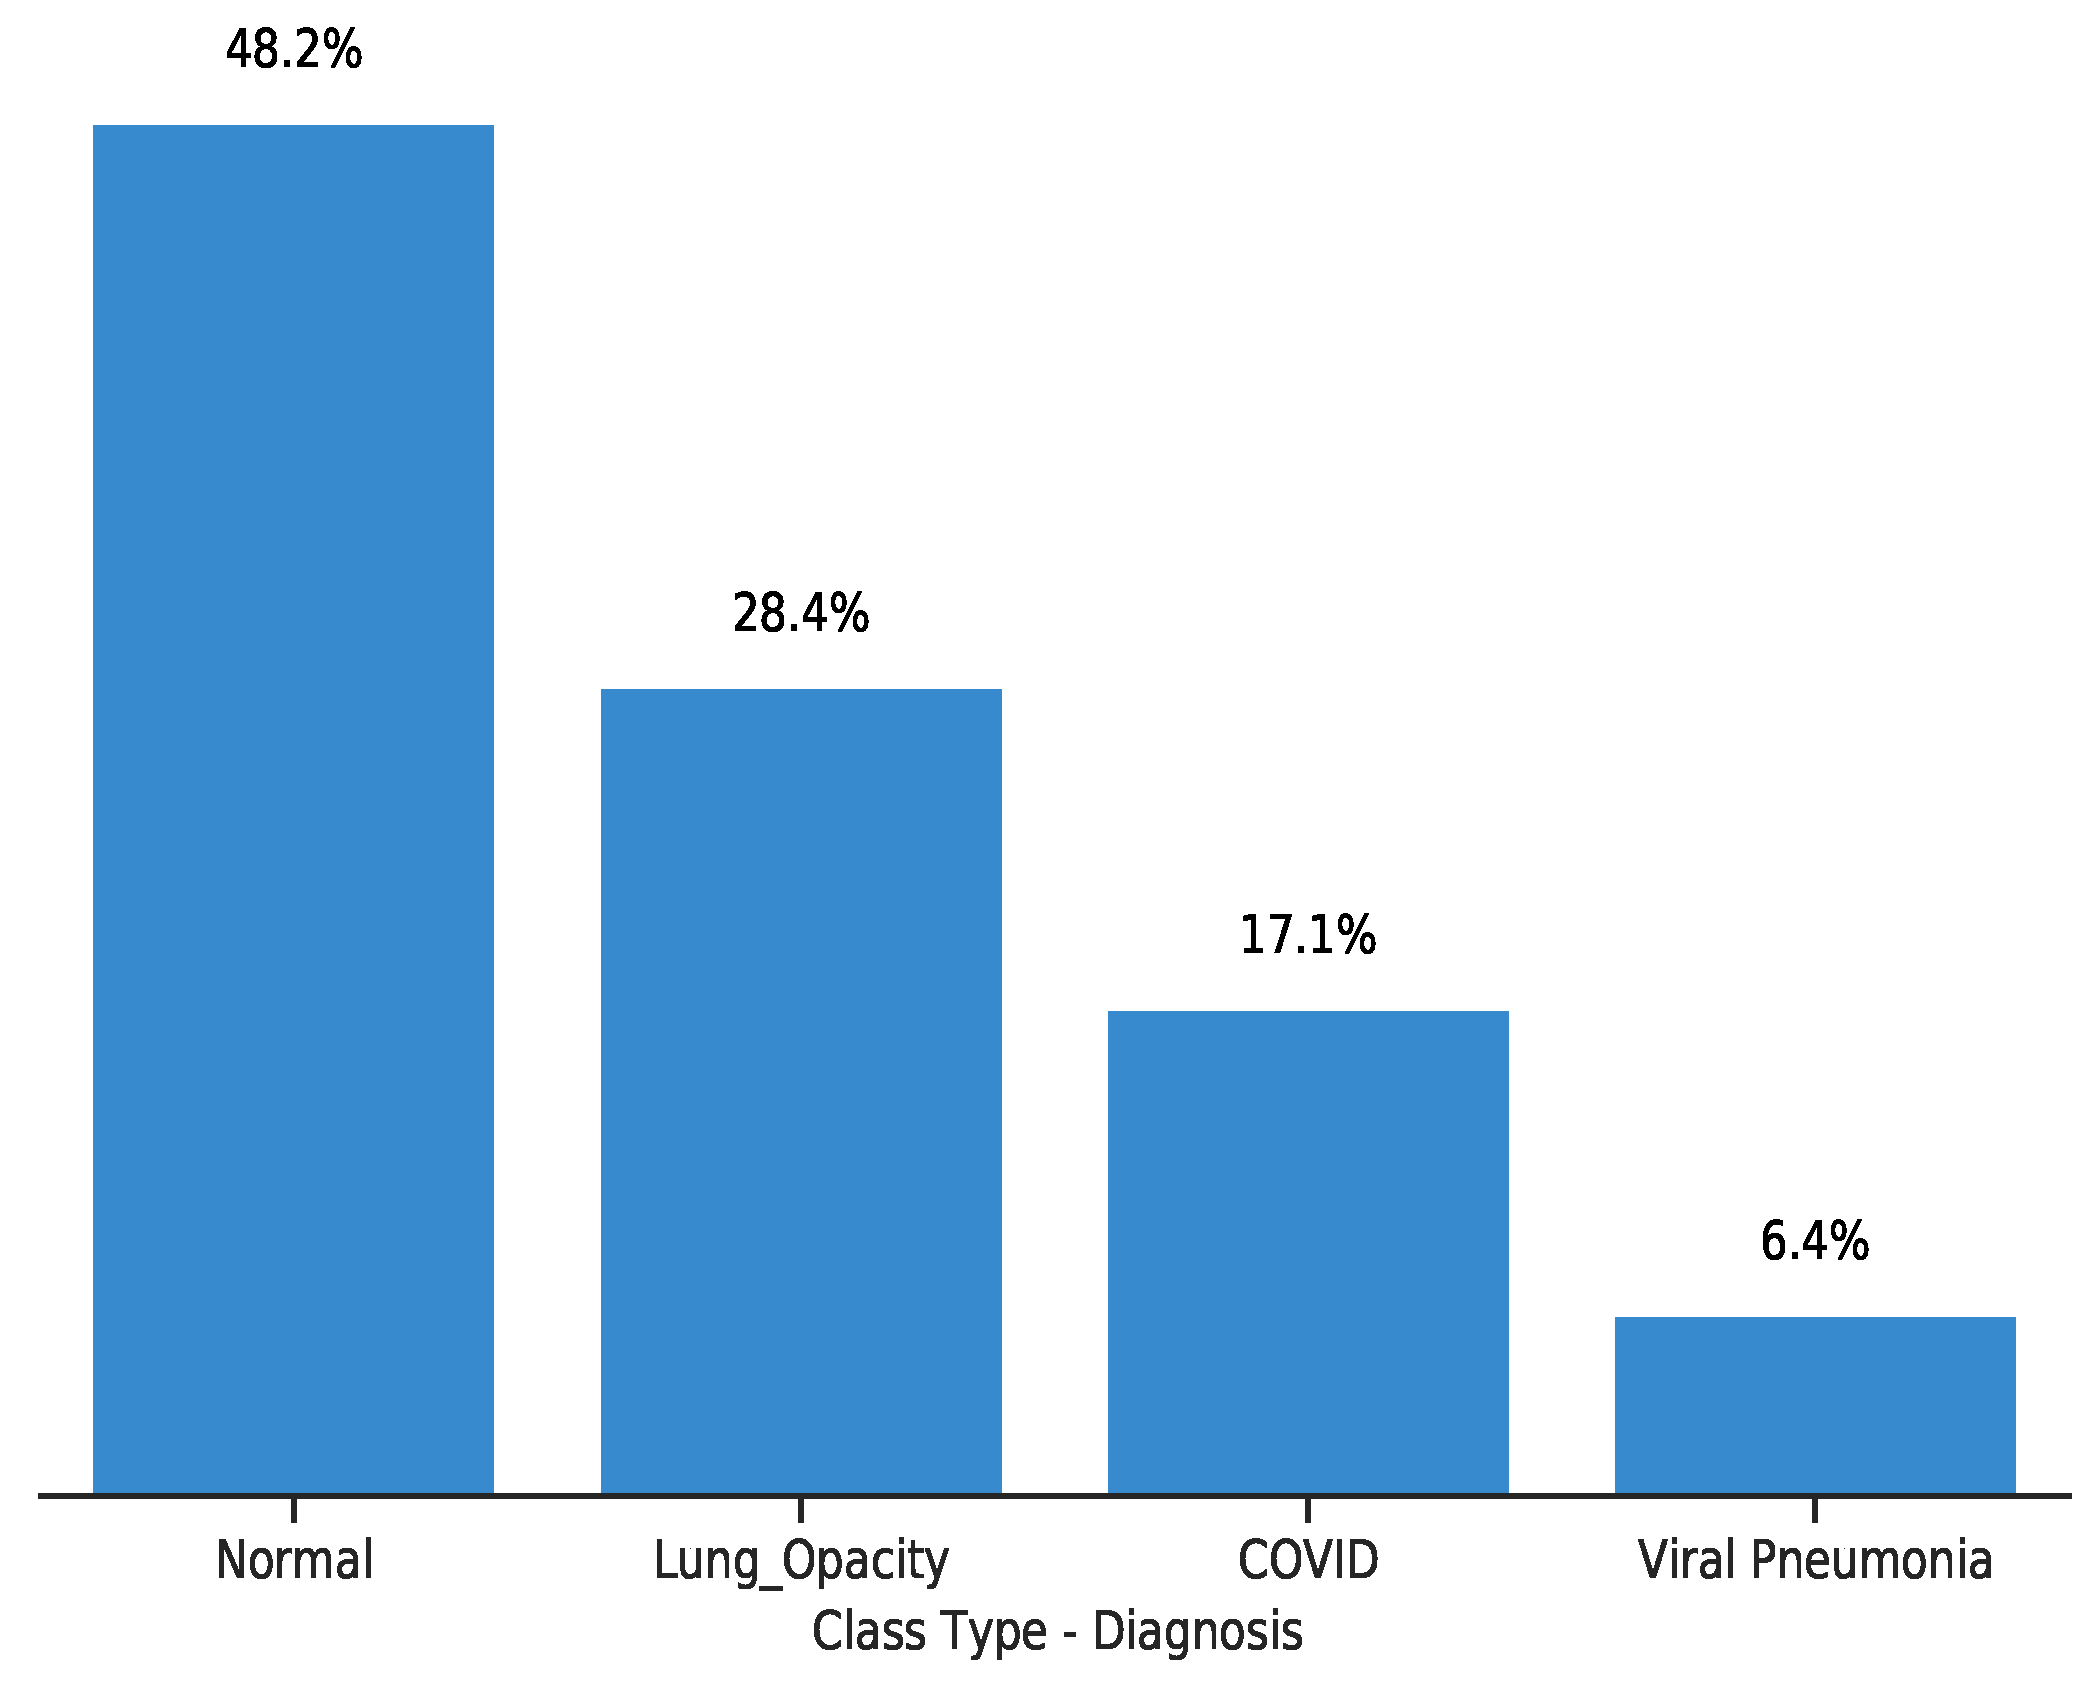
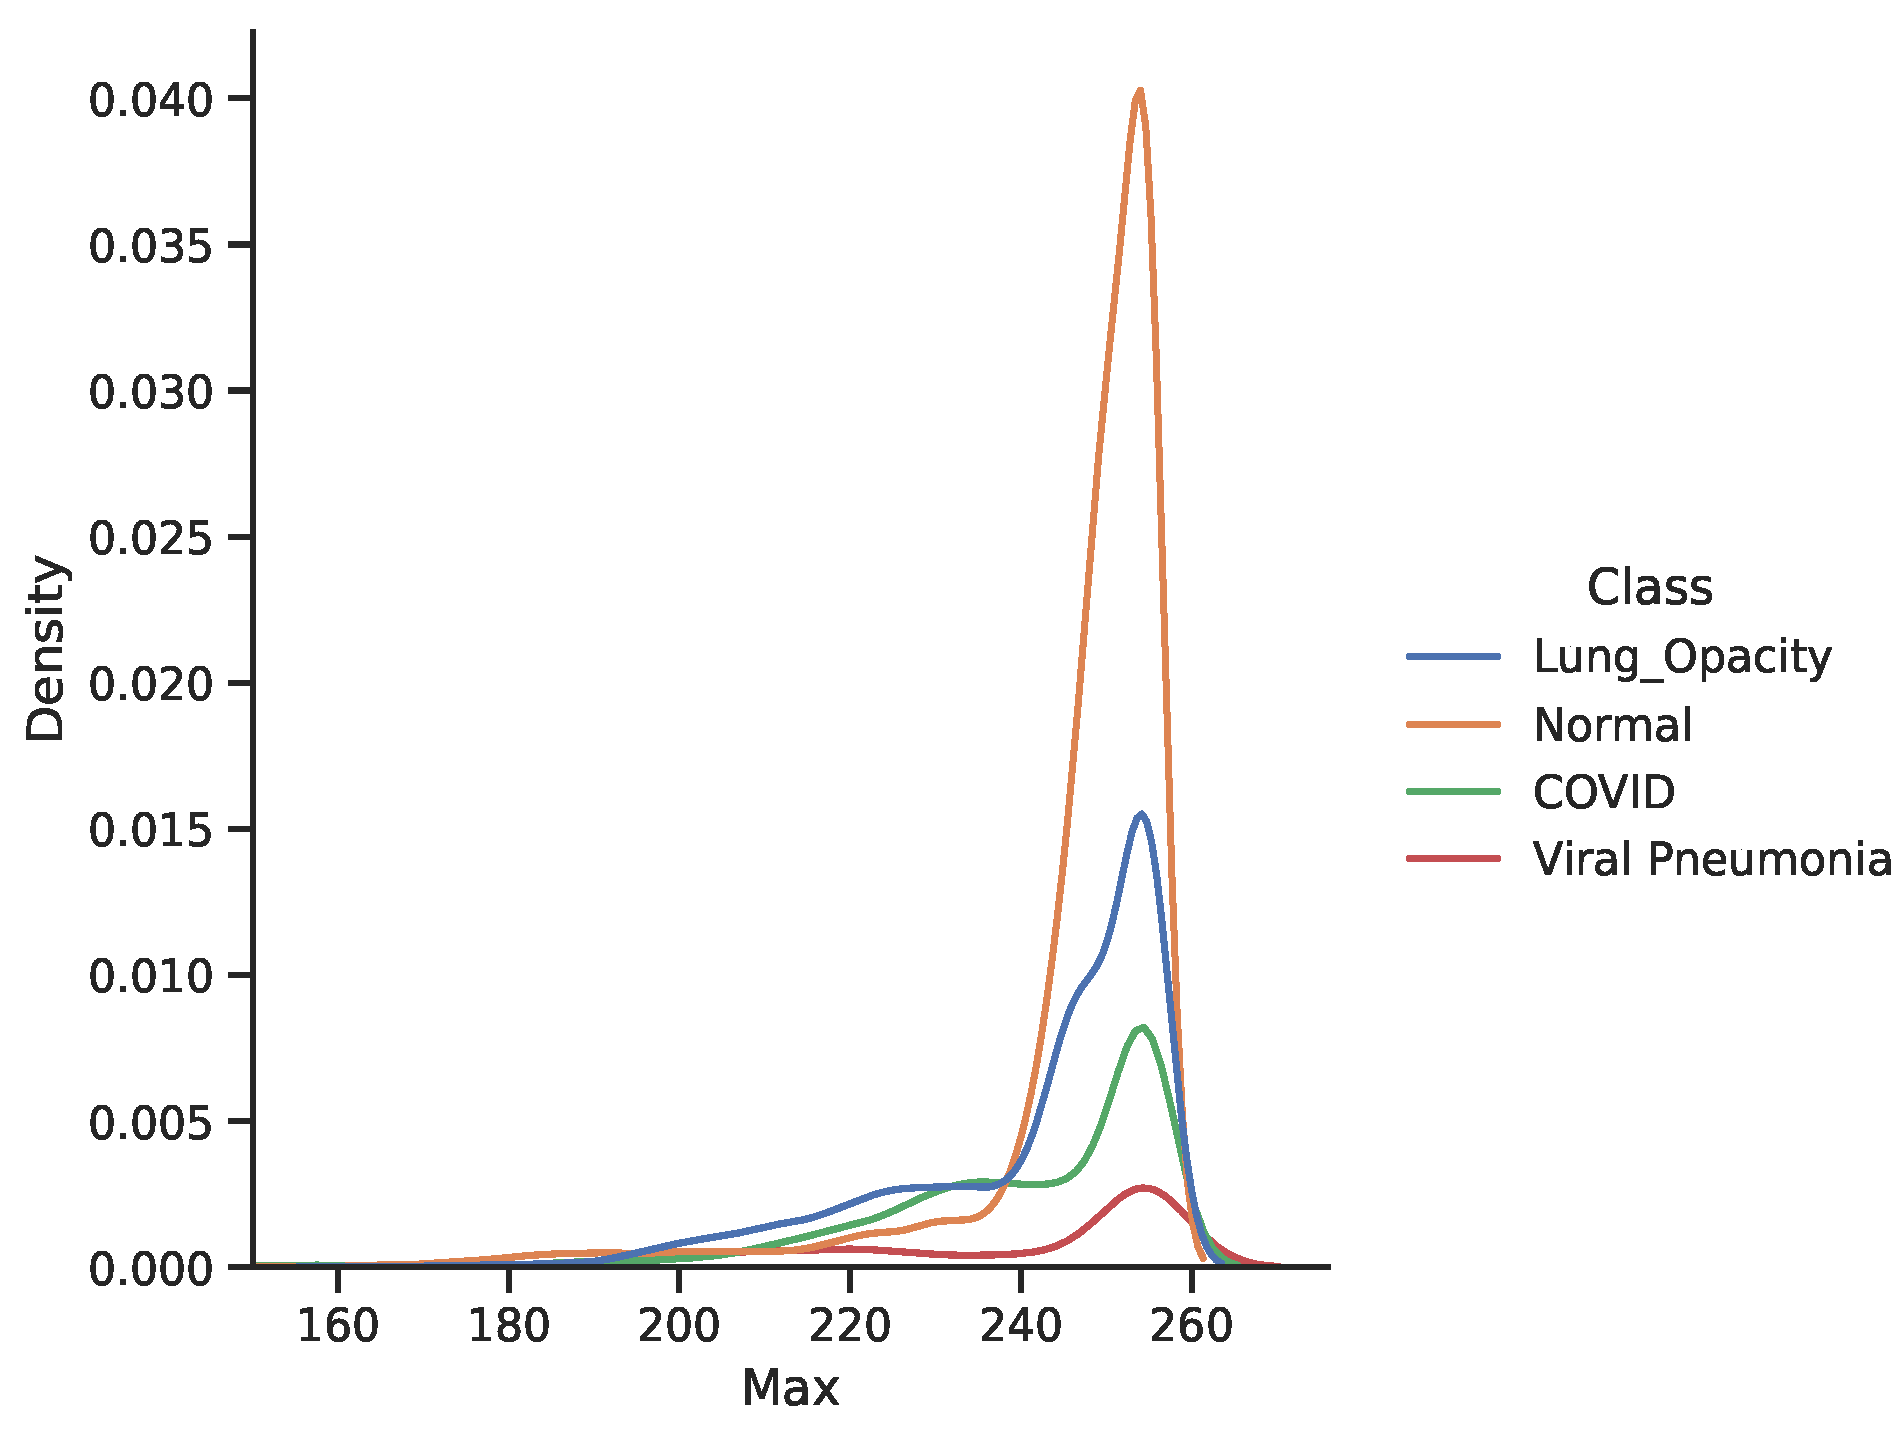
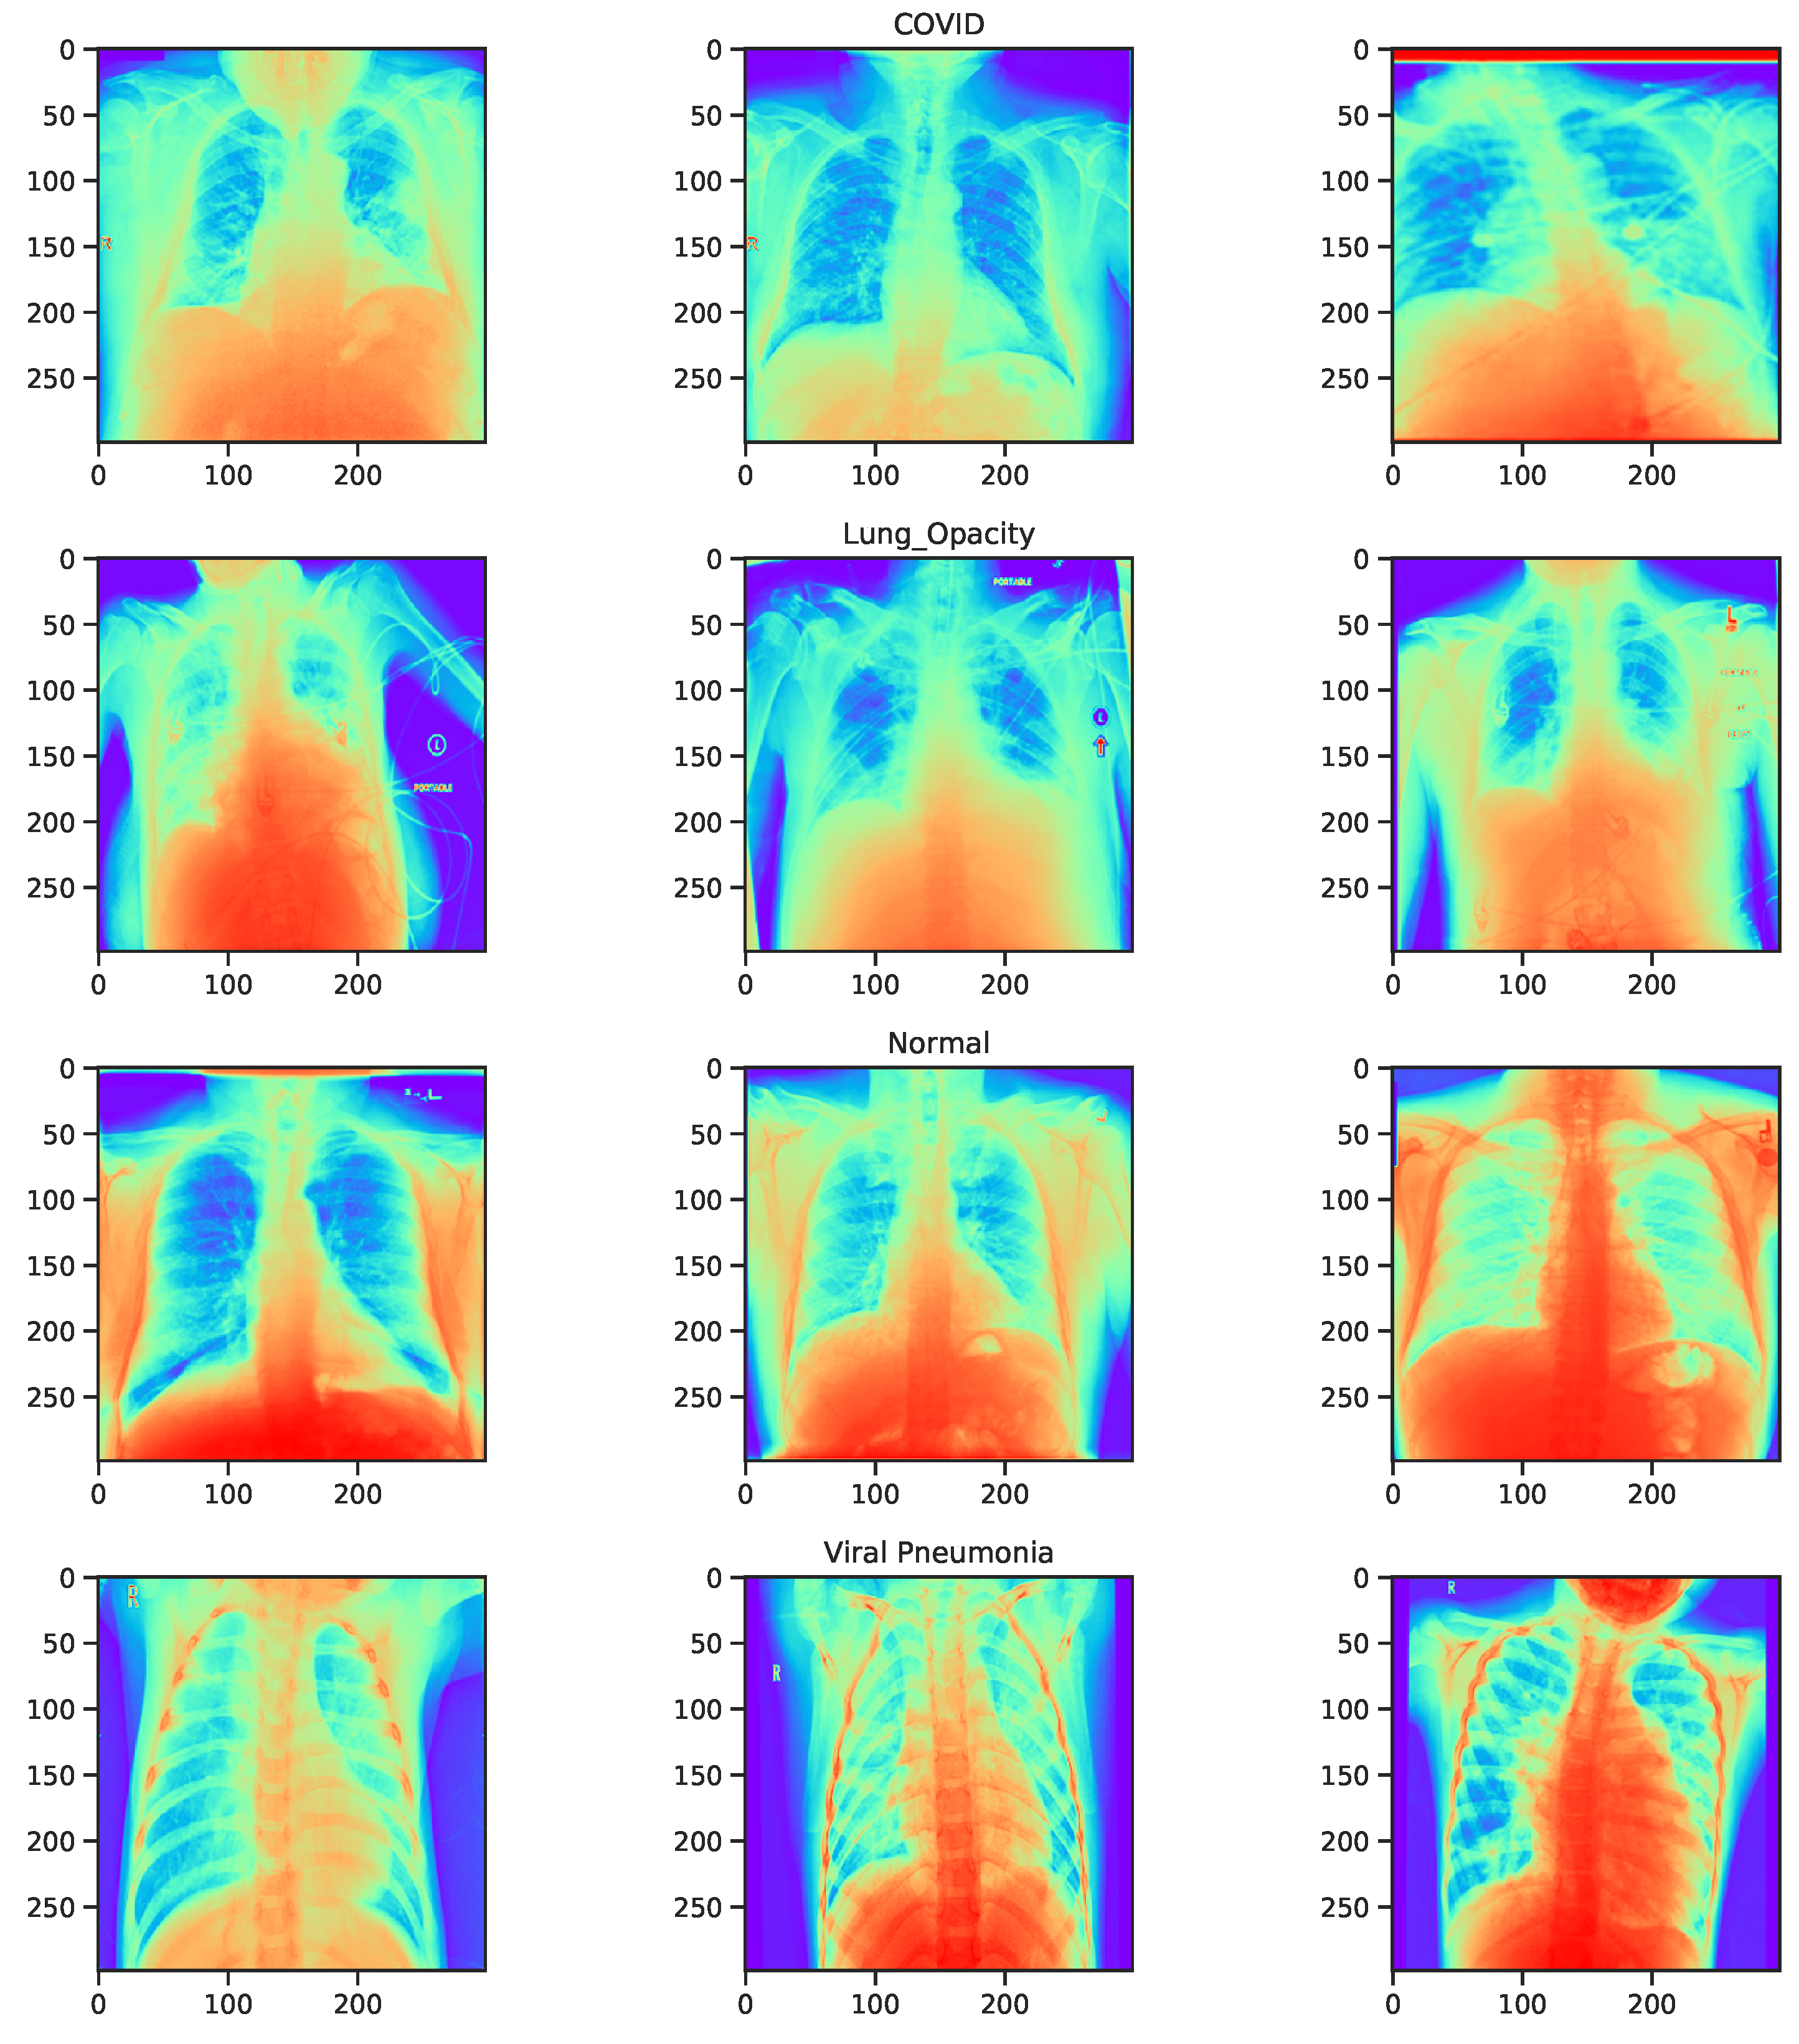
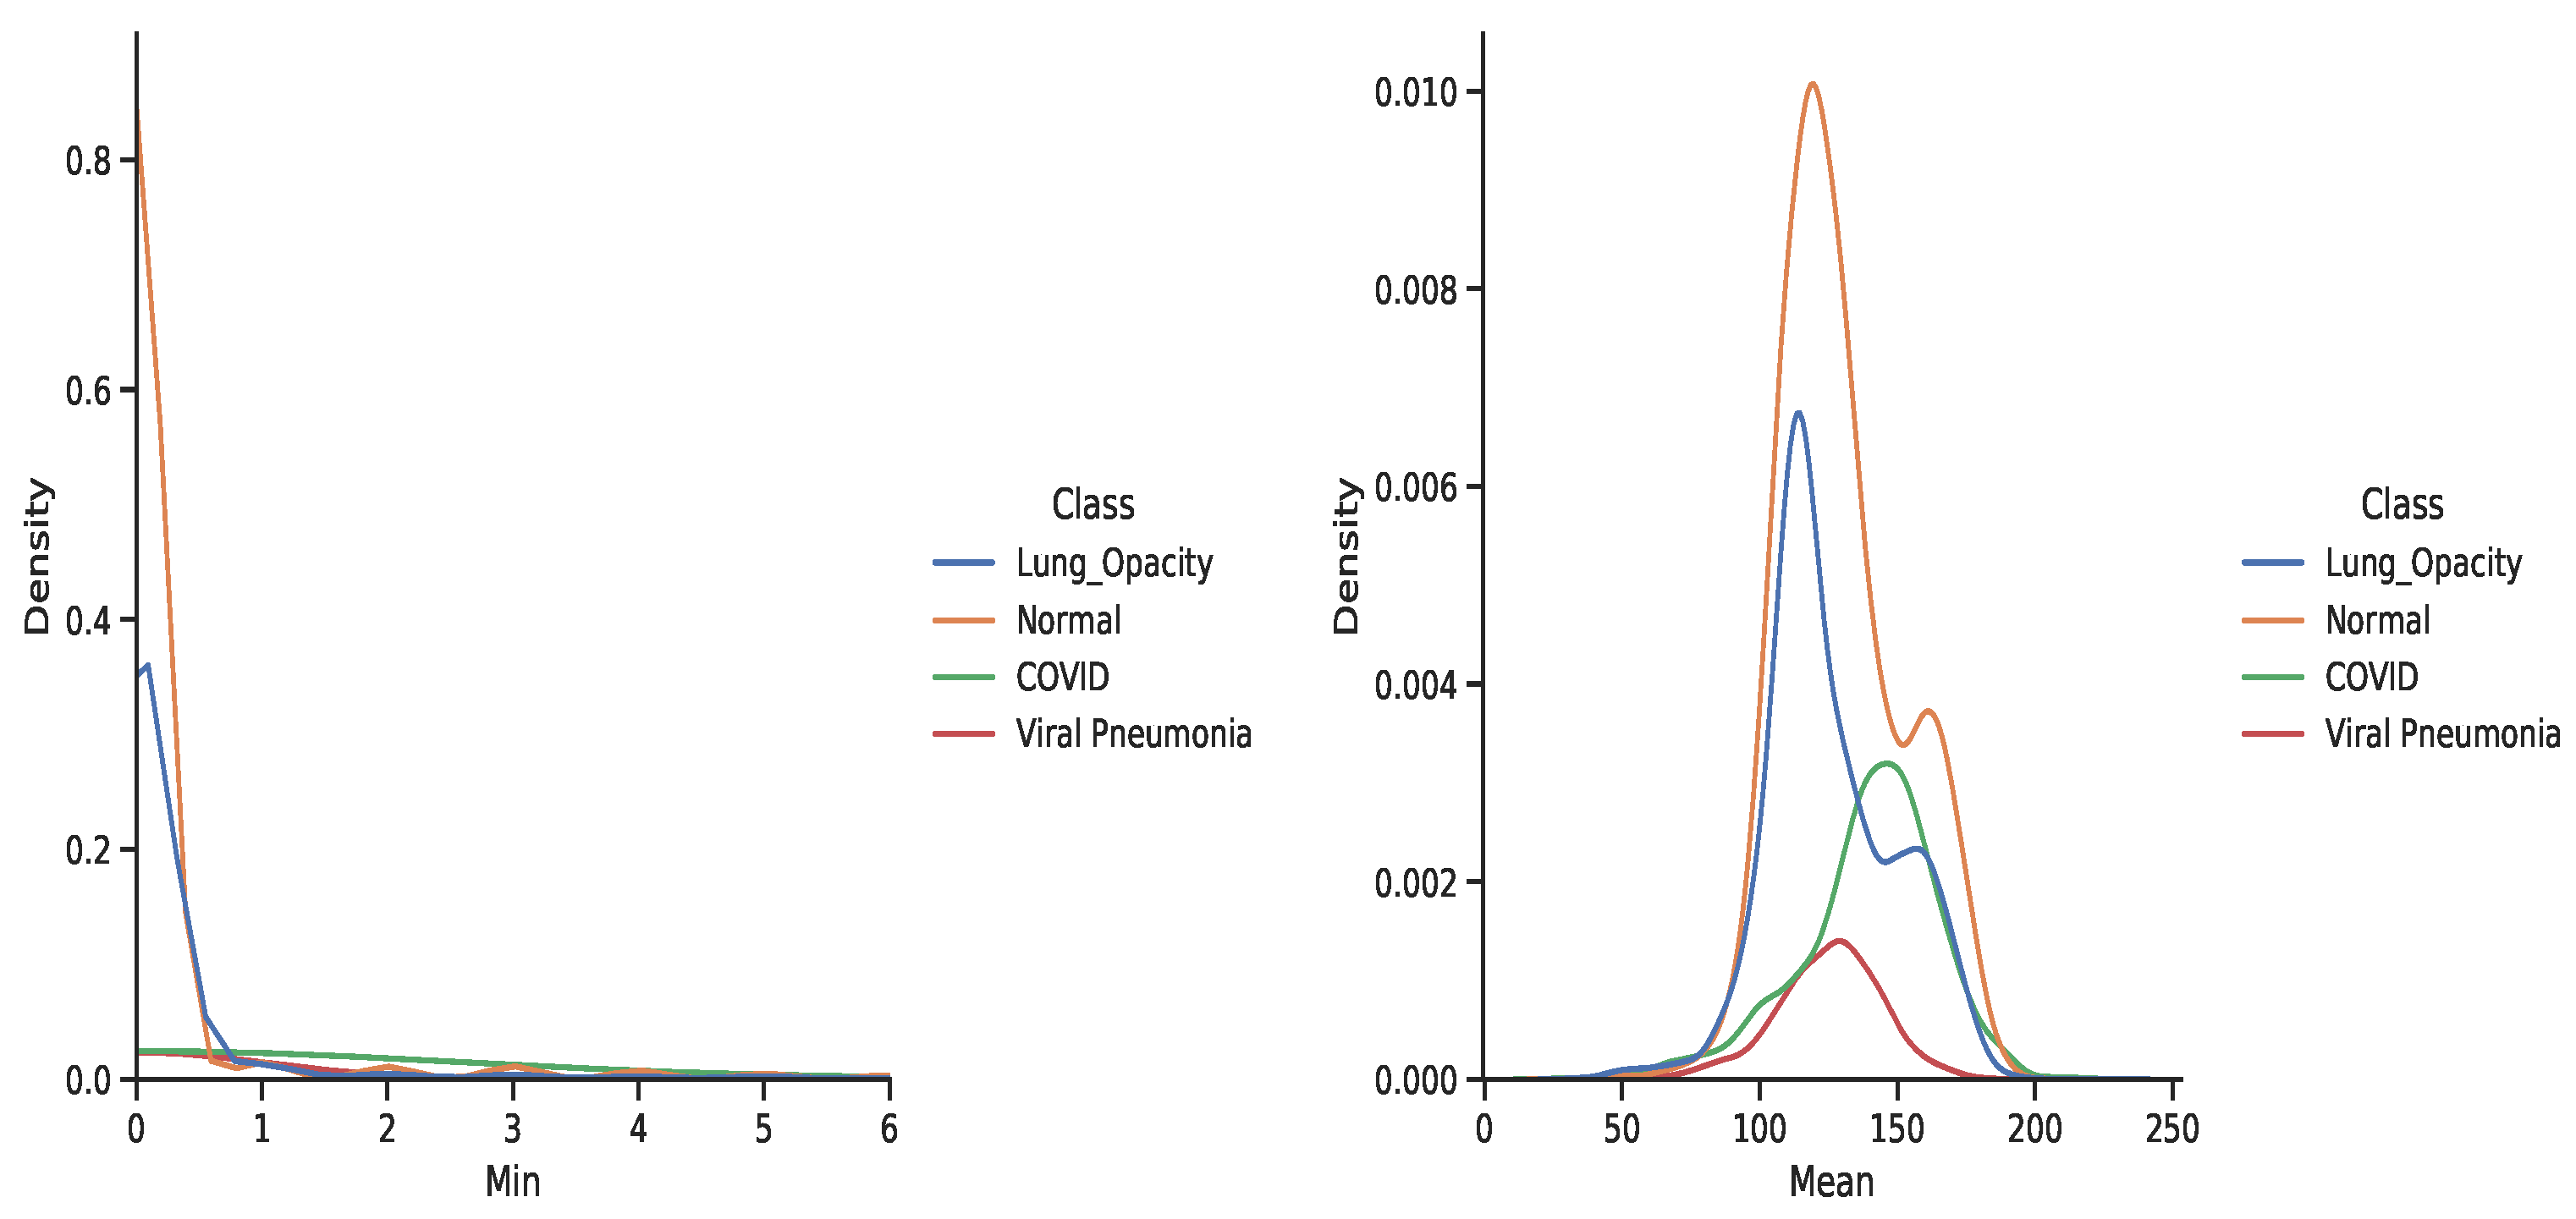
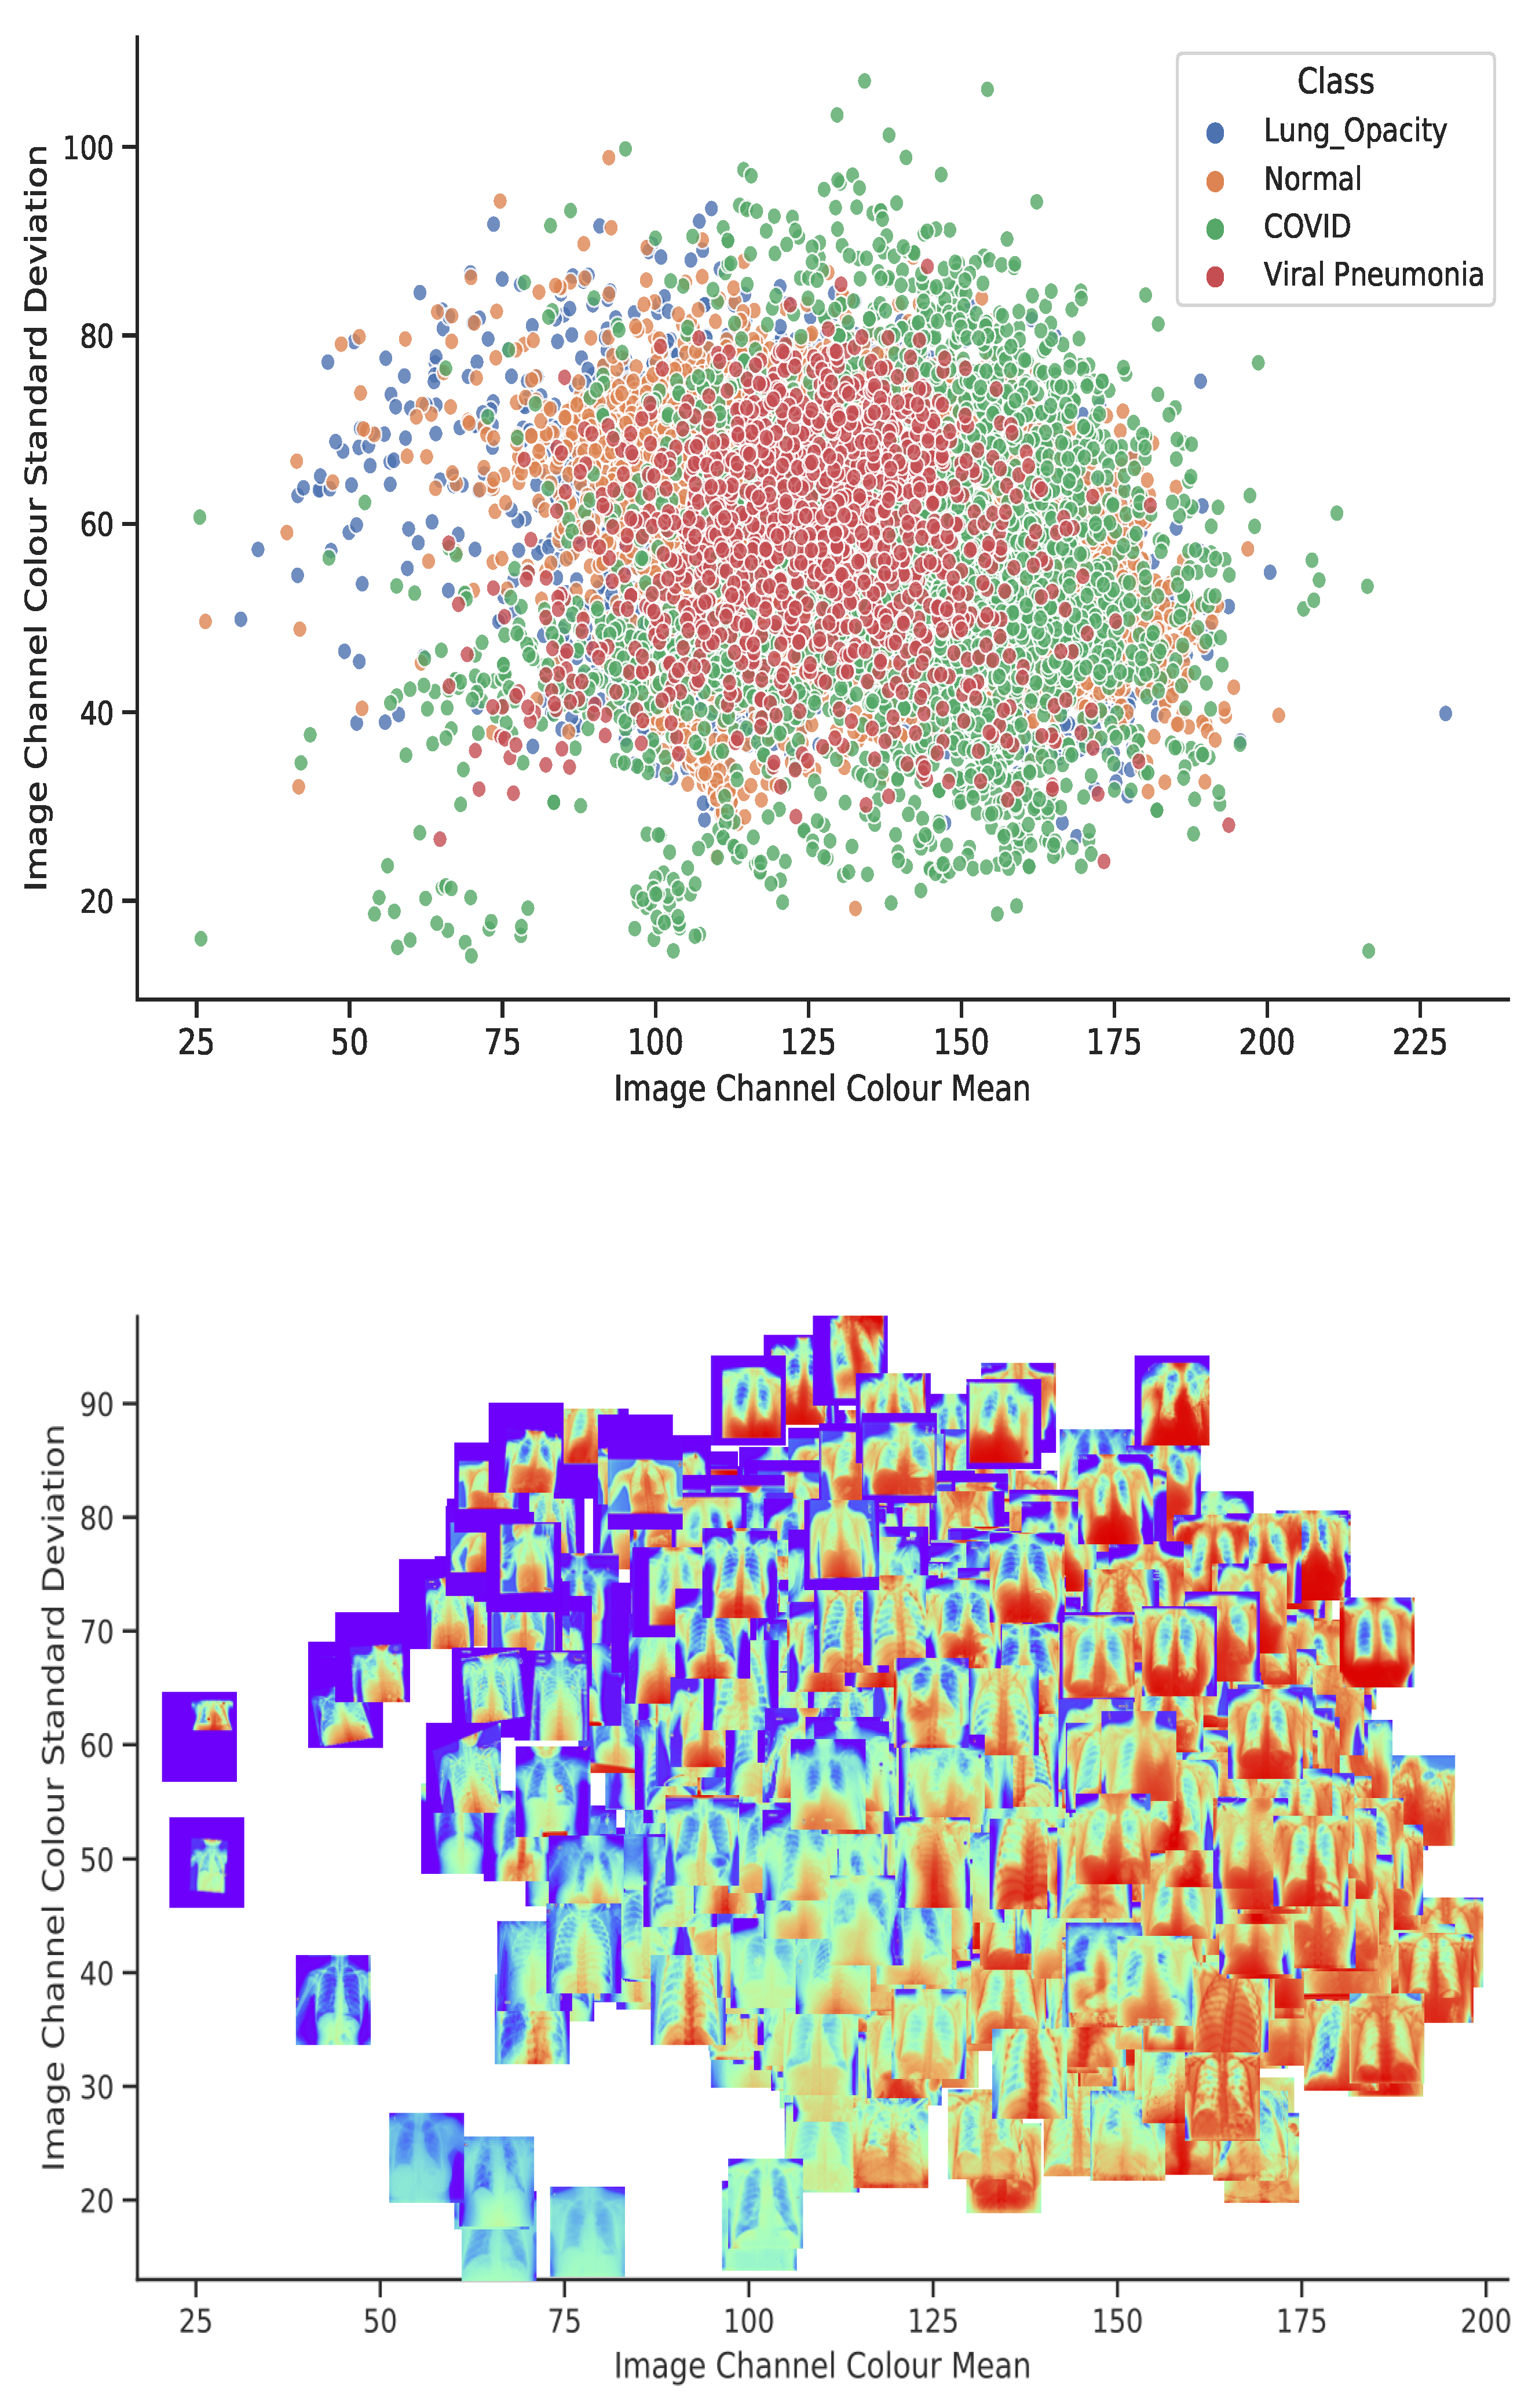
3.4. Dataset
3.5. Learning Setting
3.6. Simulation Environment
3.7. Performance Metrics
- Accuracy (acc): a measure that indicates the proportion of correct predictions to the sum of evaluated samples.where and are the True Positive, False Positive, True Negative and False Negative respectively.
- Sensitivity/ Recall (R)/ True Positive Rate: computes the fraction of positive examples that are correctly classified to the total number of positive examples evaluated.
- Specificity (sp): indicates the fraction of negative examples that are correctly predicted.
- Precision (P): measures the proportion of positive examples correctly predicted to the total number of positive predictions.
- Score: is a measure of the harmonic mean of recall and precision. This is a good measure of performance when the classes are in-balanced.
- False Positive Rate (FPR): is the fraction of negative examples incorrectly classified to the total number of negative samples. It is also regarded as the complement of specificity.
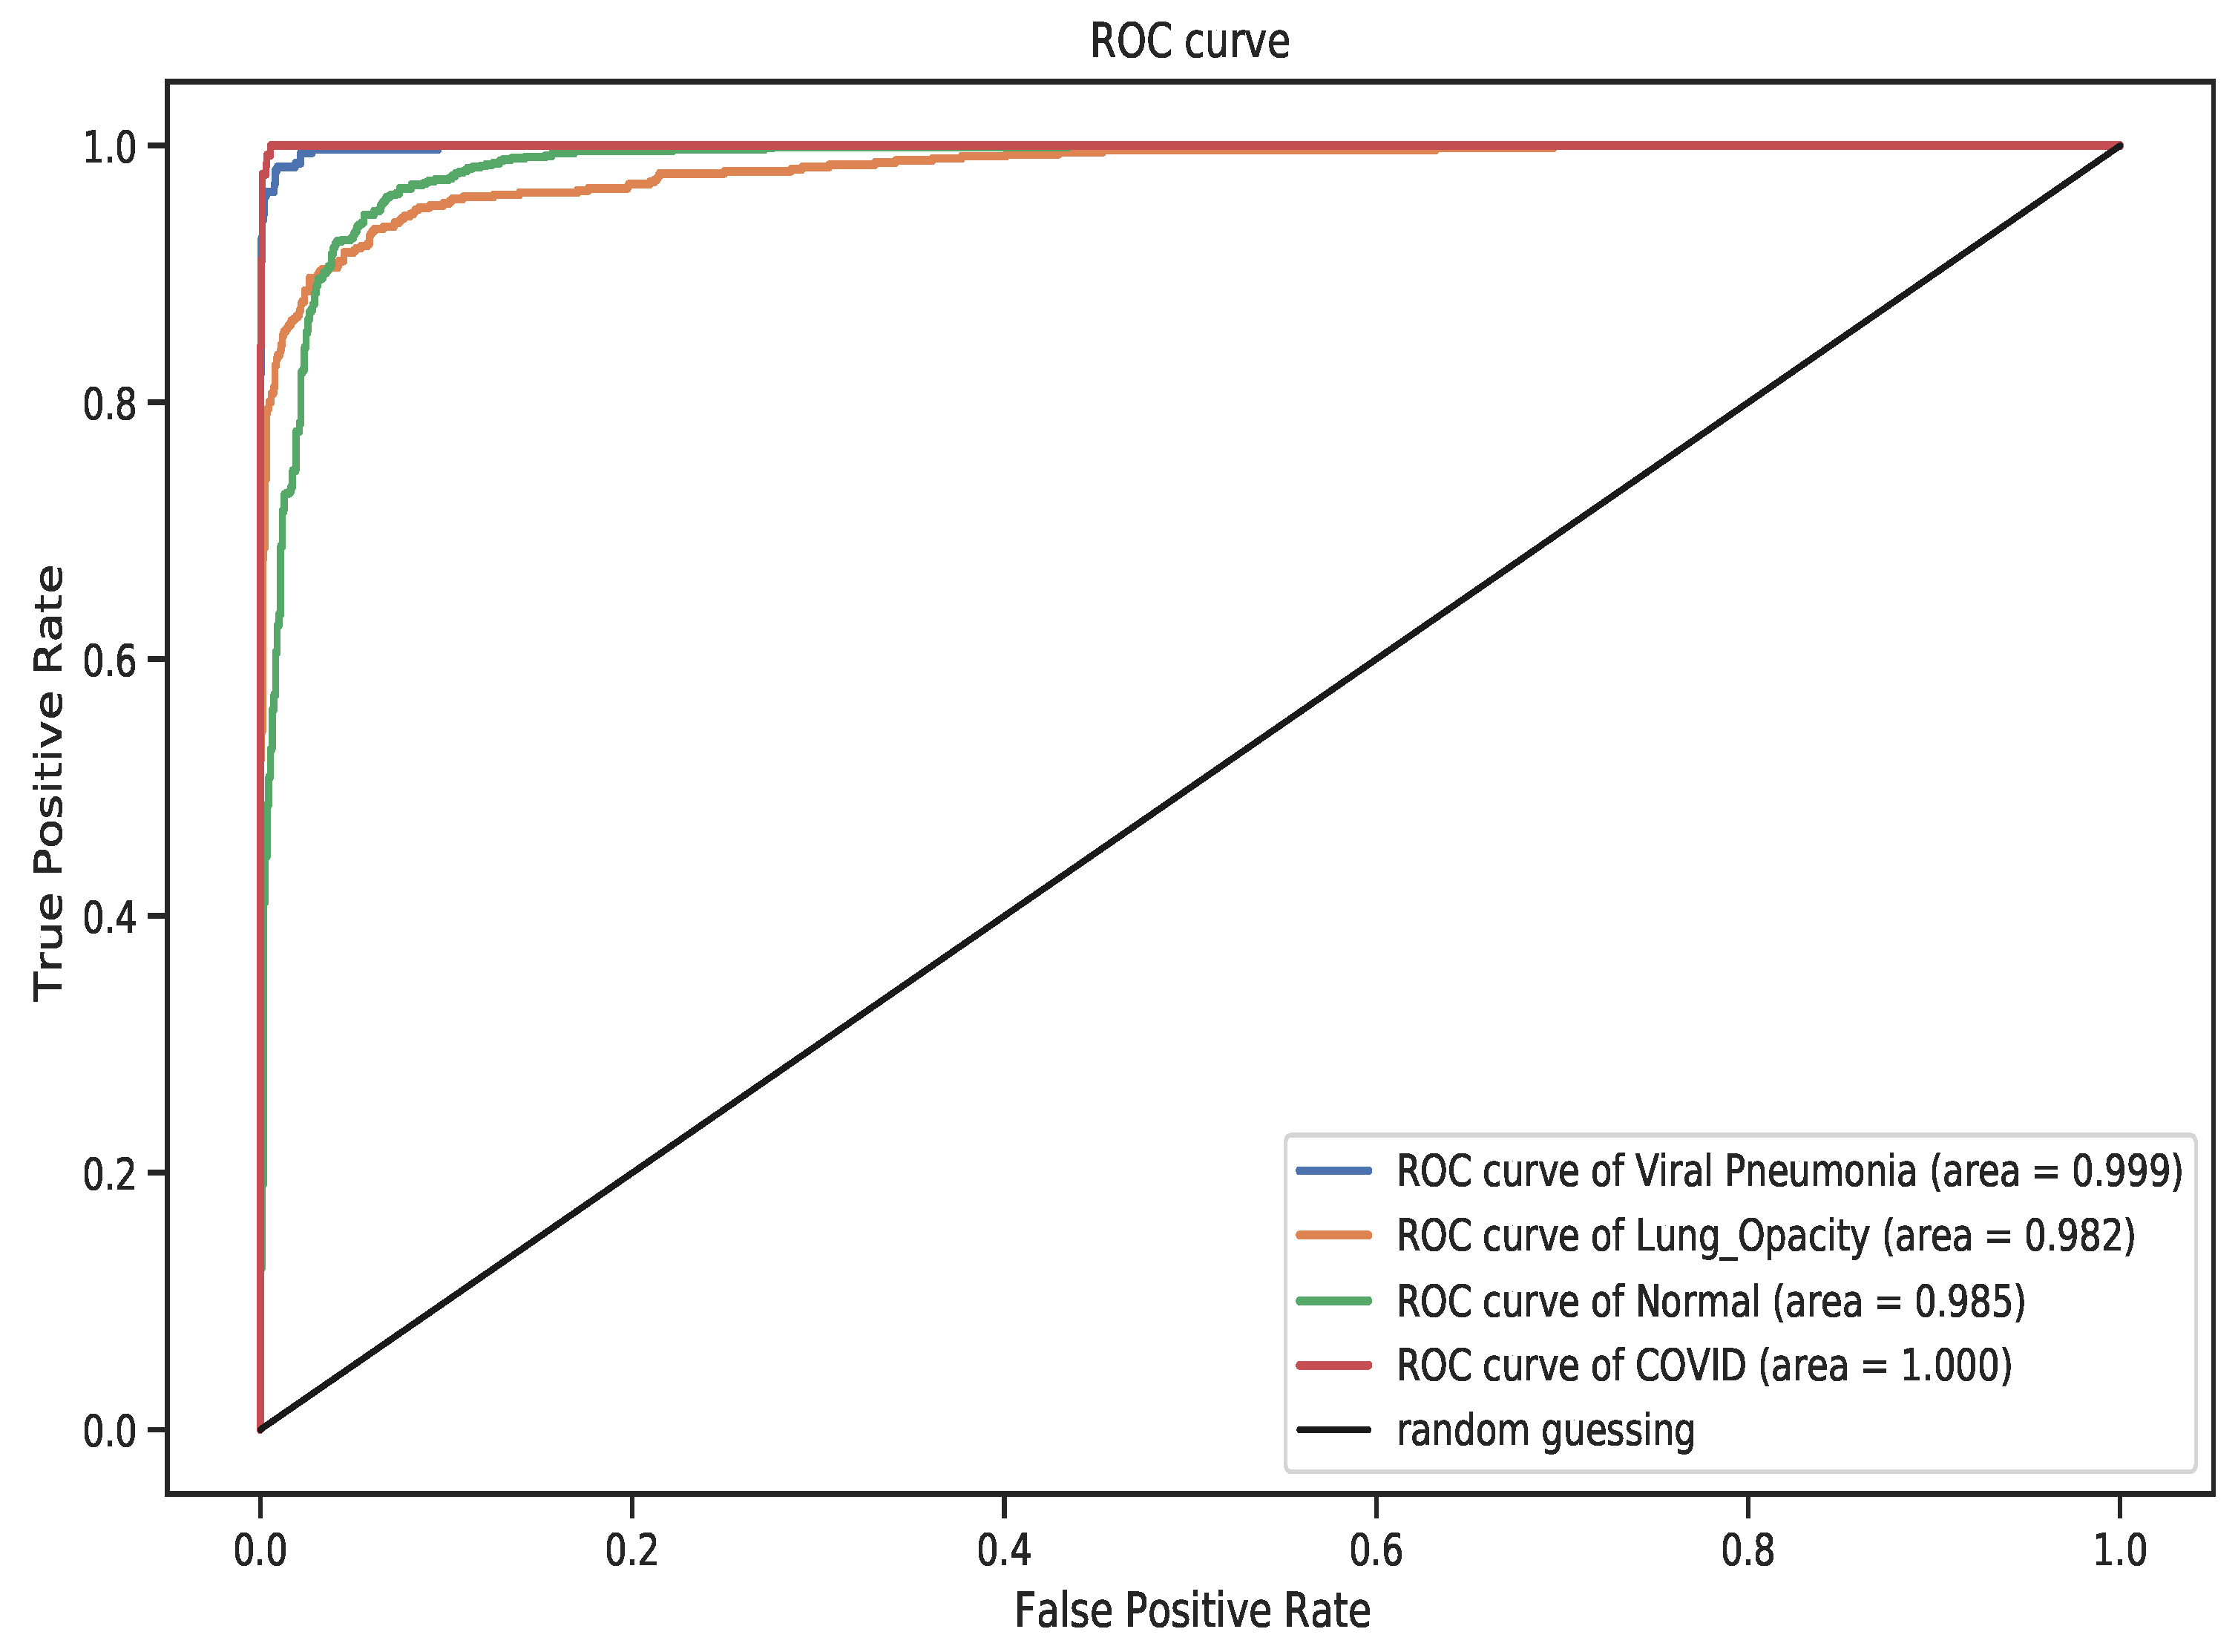
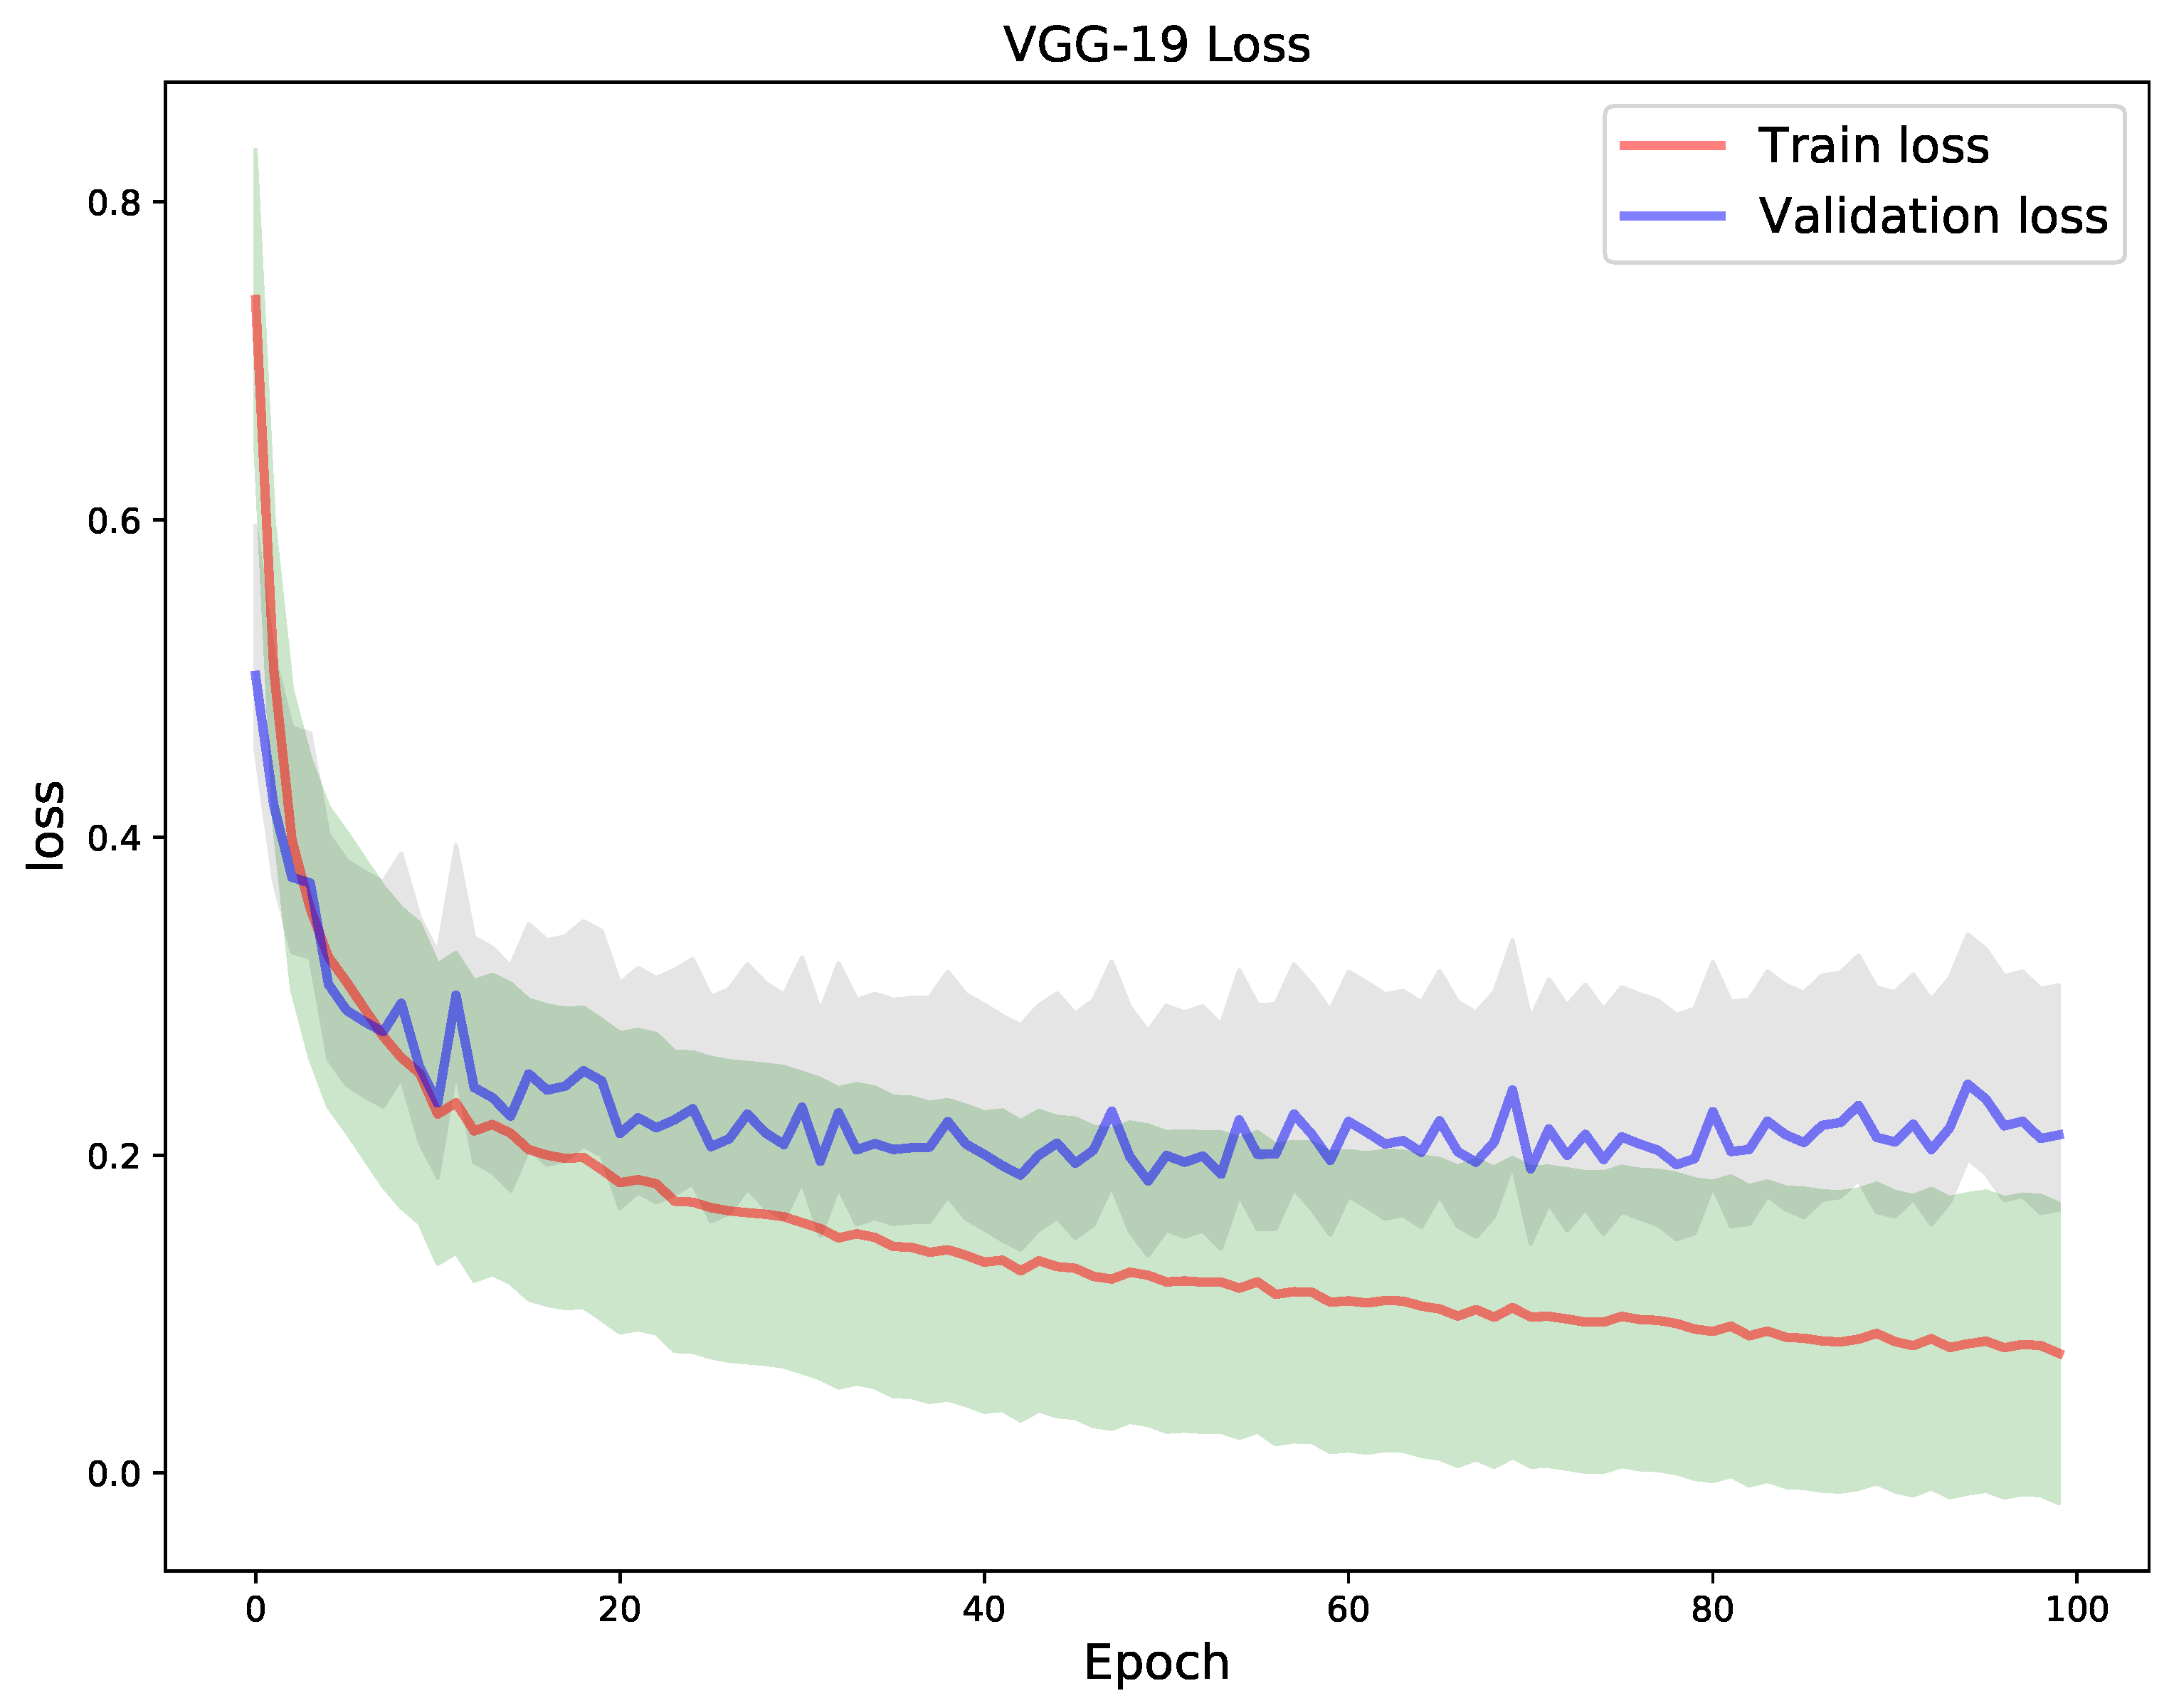
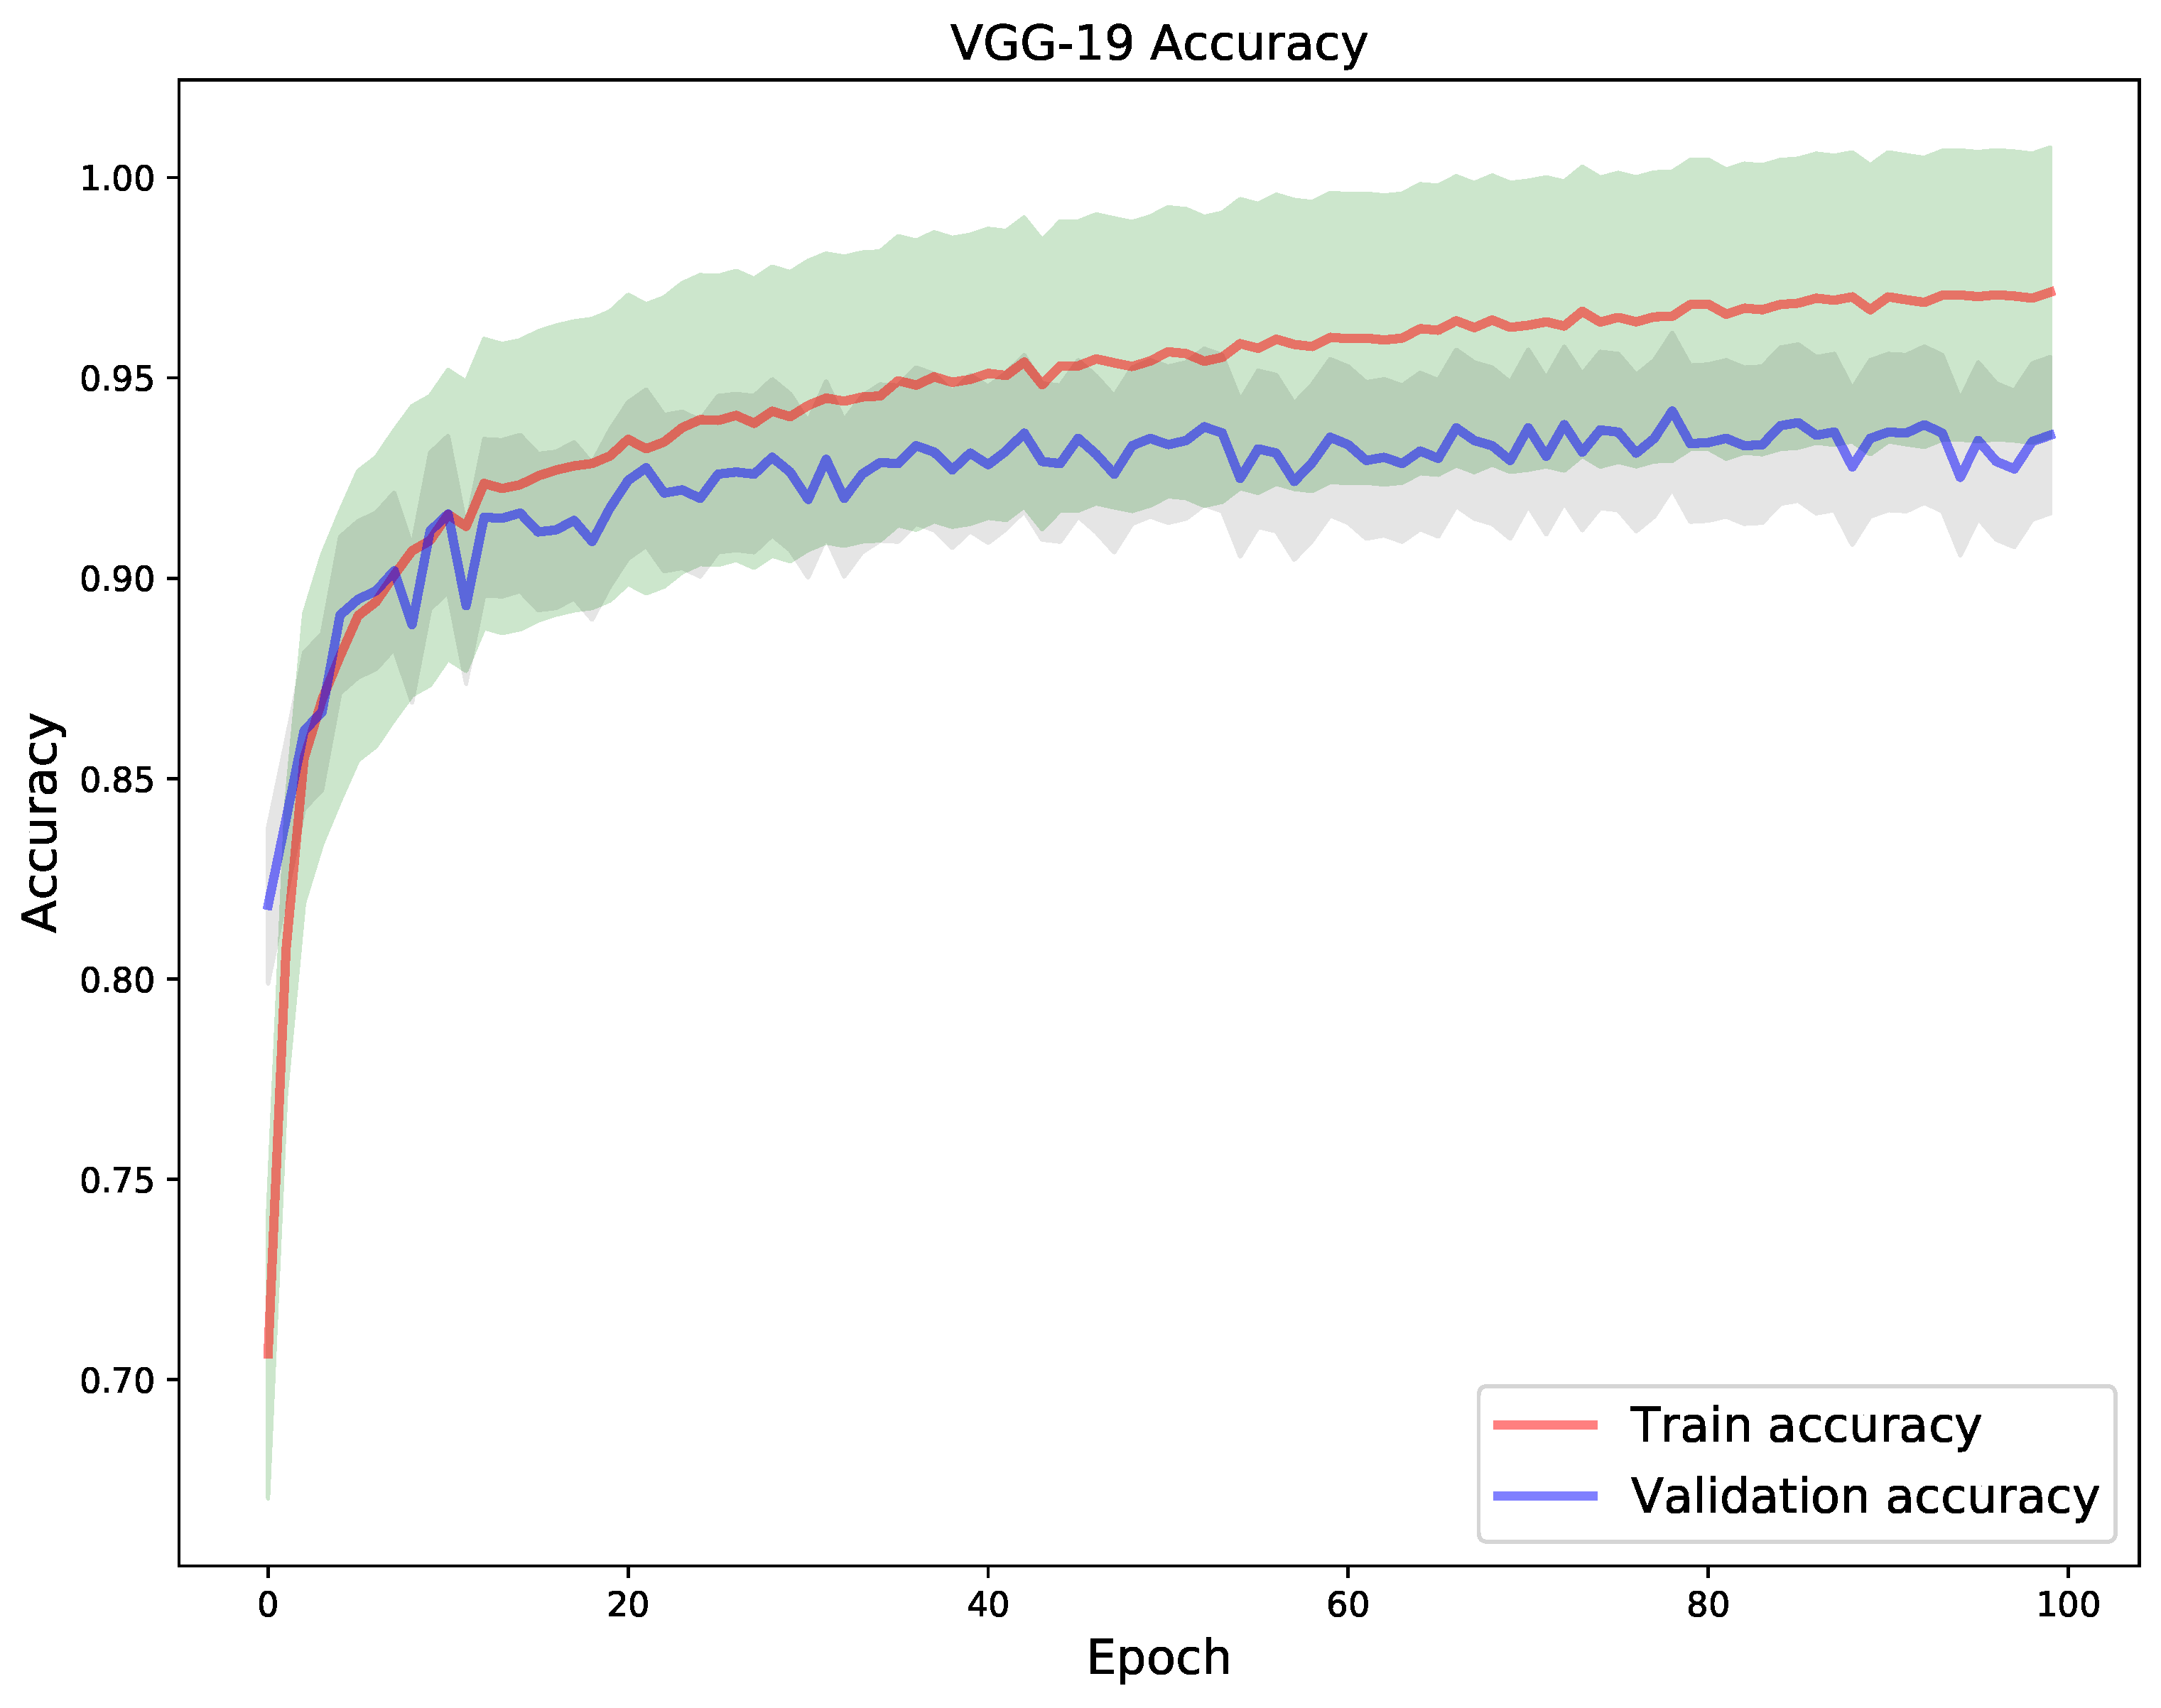
4. Results
5. Discussion
6. Conclusions and Future Directions
Author Contributions
Funding
Institutional Review Board Statement
Informed Consent Statement
Data Availability Statement
Conflicts of Interest
References
- Ciotti, M.; Ciccozzi, M.; Terrinoni, A.; Jiang, W.C.; Wang, C.B.; Bernardini, S. The COVID-19 pandemic. Crit. Rev. Clin. Lab. Sci. 2020, 57, 365–388. [Google Scholar] [CrossRef]
- Chan, J.F.W.; Yuan, S.; Kok, K.H.; To, K.K.W.; Chu, H.; Yang, J.; Xing, F.; Liu, J.; Yip, C.C.Y.; Poon, R.W.S. A familial cluster of pneumonia associated with the 2019 novel coronavirus indicating person-to-person transmission: A study of a family cluster. Lancet 2020, 395, 514–523. [Google Scholar] [CrossRef] [Green Version]
- World Health Organization. Coronavirus Disease 2019 (COVID-19), Situation Report; World Health Organization: Geneva, Switzerland, 2020. [Google Scholar]
- Ahsan, M.; Based, M.; Haider, J.; Kowalski, M. COVID-19 Detection from Chest X-ray Images Using Feature Fusion and Deep Learning. Sensors 2021, 21, 1480. [Google Scholar]
- Ledford, H.; Cyranoski, D.; Van Noorden, R. The UK has approved a COVID vaccine-here’s what scientists now want to know. Nature 2020, 588, 205–206. [Google Scholar] [CrossRef] [PubMed]
- Li, Y.; Tenchov, R.; Smoot, J.; Liu, C.; Watkins, S.; Zhou, Q. A comprehensive review of the global efforts on COVID-19 vaccine development. ACS Cent. Sci. 2021, 7, 512–533. [Google Scholar] [CrossRef]
- Kim, J.H.; Marks, F.; Clemens, J.D. Looking beyond COVID-19 vaccine phase 3 trials. Nat. Med. 2021, 27, 205–211. [Google Scholar] [CrossRef]
- Logunov, D.Y.; Dolzhikova, I.V.; Shcheblyakov, D.V.; Tukhvatulin, A.I.; Zubkova, O.V.; Dzharullaeva, A.S.; Kovyrshina, A.V.; Lubenets, N.L.; Grousova, D.M.; Erokhova, A.S.; et al. Safety and efficacy of an rAd26 and rAd5 vector-based heterologous prime-boost COVID-19 vaccine: An interim analysis of a randomised controlled phase 3 trial in Russia. Lancet 2021, 397, 671–681. [Google Scholar] [CrossRef]
- Chen, Z.; Zhang, L. Meet the Challenges of Mass Vaccination against COVID-19. Explor. Res. Hypothesis Med. 2021, 6, 77–79. [Google Scholar]
- Wang, J.; Peng, Y.; Xu, H.; Cui, Z.; Williams, R.O. The COVID-19 vaccine race: Challenges and opportunities in vaccine formulation. AAPS PharmSciTech 2020, 21, 1–12. [Google Scholar] [CrossRef] [PubMed]
- Forni, G.; Mantovani, A. COVID-19 vaccines: Where we stand and challenges ahead. Cell Death Differ. 2021, 28, 626–639. [Google Scholar] [CrossRef] [PubMed]
- Binnicker, M.J. Challenges and Controversies to Testing for COVID-19. J. Clin. Microbiol. 2020, 58, e01695-20. [Google Scholar] [CrossRef]
- Tavare, A.N.; Braddy, A.; Brill, S.; Jarvis, H.; Sivaramakrishnan, A.; Barnett, J.; Creer, D.D.; Hare, S.S. Managing high clinical suspicion COVID-19 inpatients with negative RT-PCR: A pragmatic and limited role for thoracic CT. Thorax 2020, 75, 537–538. [Google Scholar] [CrossRef] [Green Version]
- Wang, L.; Lin, Z.Q.; Wong, A. Covid-net: A tailored deep convolutional neural network design for detection of covid-19 cases from chest X-ray images. Sci. Rep. 2020, 10, 1–12. [Google Scholar]
- Afzal, A. Molecular diagnostic technologies for COVID-19: Limitations and challenges. J. Adv. Res. 2020, 26, 149–159. [Google Scholar] [CrossRef]
- World Health Organization. Use of Chest Imaging in COVID-19: A Rapid Advice Guide, 11 June 2020; Technical Report; World Health Organization: Geneva, Switzerland, 2020. [Google Scholar]
- Kong, W.; Agarwal, P.P. Chest imaging appearance of COVID-19 infection. Radiol. Cardiothorac. Imaging 2020, 2, e200028. [Google Scholar] [CrossRef] [Green Version]
- Davies, H.; Wathen, C.; Gleeson, F. The risks of radiation exposure related to diagnostic imaging and how to minimise them. Bmj 2011, 342, 589–593. [Google Scholar] [CrossRef]
- Cherian, T.; Mulholland, E.K.; Carlin, J.B.; Ostensen, H.; Amin, R.; Campo, M.d.; Greenberg, D.; Lagos, R.; Lucero, M.; Madhi, S.A. Standardized interpretation of paediatric chest radiographs for the diagnosis of pneumonia in epidemiological studies. Bull. World Health Organ. 2005, 83, 353–359. [Google Scholar] [PubMed]
- Franquet, T. Imaging of pneumonia: Trends and algorithms. Eur. Respir. J. 2001, 18, 196–208. [Google Scholar] [CrossRef] [Green Version]
- Ng, M.Y.; Lee, E.Y.; Yang, J.; Yang, F.; Li, X.; Wang, H.; Lui, M.M.s.; Lo, C.S.Y.; Leung, B.; Khong, P.L. Imaging profile of the COVID-19 infection: Radiologic findings and literature review. Radiol. Cardiothorac. Imaging 2020, 2, e200034. [Google Scholar] [CrossRef] [PubMed] [Green Version]
- Chowdhury, M.E.H.; Rahman, T.; Khandakar, A.; Mazhar, R.; Kadir, M.A.; Mahbub, Z.B.; Islam, K.R.; Khan, M.S.; Iqbal, A.; Emadi, N.A.; et al. Can AI Help in Screening Viral and COVID-19 Pneumonia? IEEE Access 2020, 8, 132665–132676. [Google Scholar] [CrossRef]
- Baltruschat, I.; Nickisch, H.; Grass, M.; Knopp, T.; Saalbach, A. Comparison of Deep Learning Approaches for Multi-Label Chest X-ray Classification; Nature Publishing Group: Berlin, Germany, 2019; Volume 9, pp. 1–10. [Google Scholar]
- Siddiqi, R. Automated pneumonia diagnosis using a customized sequential convolutional neural network. In Proceedings of the 2019 3rd International Conference on Deep Learning Technologies, Xiamen, China, 5–7 July 2019; pp. 64–70. [Google Scholar]
- Ebiele, J.; Ansah-Narh, T.; Djiokap, S.; Proven-Adzri, E.; Atemkeng, M. Conventional Machine Learning based on Feature Engineering for Detecting Pneumonia from Chest X-rays. In Proceedings of the 2020 ACM Conference of the South African Institute of Computer Scientists and Information Technologists, Cape Town, South Africa, 14–16 September 2020; pp. 149–155. [Google Scholar]
- Kikkisetti, S.; Zhu, J.; Shen, B.; Li, H.; Duong, T. Deep-learning convolutional neural networks with transfer learning accurately classify COVID-19 lung infection on portable chest radiographs. PeerJ 2020, 8, e10309. [Google Scholar] [CrossRef] [PubMed]
- Ardabili, S.F.; Mosavi, A.; Ghamisi, P.; Ferdinand, F.; Varkonyi-Koczy, A.R.; Reuter, U.; Rabczuk, T.; Atkinson, P.M. COVID-19 Outbreak Prediction with Machine Learning. Algorithms 2020, 13, 249. [Google Scholar] [CrossRef]
- Pinter, G.; Felde, I.; Mosavi, A.; Ghamisi, P.; Gloaguen, R. COVID-19 Pandemic Prediction for Hungary; A Hybrid Machine Learning Approach. Mathematics 2020, 8, 890. [Google Scholar] [CrossRef]
- Burke, R.M.; Shah, M.P.; Wikswo, M.E.; Barclay, L.; Kambhampati, A.; Marsh, Z.; Cannon, J.L.; Parashar, U.D.; Vinjé, J.; Hall, A.J. The norovirus epidemiologic triad: Predictors of severe outcomes in US norovirus outbreaks, 2009–2016. J. Infect. Dis. 2019, 219, 1364–1372. [Google Scholar] [CrossRef] [PubMed]
- Ahammed, K.; Satu, M.S.; Abedin, M.Z.; Rahaman, M.A.; Islam, S.M.S. Early Detection of Coronavirus Cases Using Chest X-ray Images Employing Machine Learning and Deep Learning Approaches. medRxiv 2020. [Google Scholar] [CrossRef]
- Abbas, A.; Abdelsamea, M.M.; Gaber, M.M. Classification of COVID-19 in chest X-ray images using DeTraC deep convolutional neural network. Appl. Intell. 2021, 51, 854–864. [Google Scholar] [CrossRef]
- Apostolopoulos, I.D.; Mpesiana, T.A. Covid-19: Automatic detection from X-ray images utilizing transfer learning with convolutional neural networks. Phys. Eng. Sci. Med. 2020, 43, 635–640. [Google Scholar] [CrossRef] [Green Version]
- El-Din Hemdan, E.; Shouman, M.A.; Karar, M.E. Covidx-net: A framework of deep learning classifiers to diagnose covid-19 in X-ray images. arXiv 2020, arXiv:2003.11055. [Google Scholar]
- Karar, M.E.; Hemdan, E.E.D.; Shouman, M.A. Cascaded deep learning classifiers for computer-aided diagnosis of COVID-19 and pneumonia diseases in X-ray scans. Complex Intell. Syst. 2021, 7, 235–247. [Google Scholar] [CrossRef]
- Minaee, S.; Kafieh, R.; Sonka, M.; Yazdani, S.; Soufi, G.J. Deep-covid: Predicting covid-19 from chest X-ray images using deep transfer learning. Med. Image Anal. 2020, 65, 101794. [Google Scholar] [CrossRef]
- Heidari, M.; Mirniaharikandehei, S.; Khuzani, A.Z.; Danala, G.; Qiu, Y.; Zheng, B. Improving the performance of CNN to predict the likelihood of COVID-19 using chest X-ray images with preprocessing algorithms. Int. J. Med. Inform. 2020, 144, 104284. [Google Scholar] [CrossRef]
- Khan, A.I.; Shah, J.L.; Bhat, M.M. CoroNet: A deep neural network for detection and diagnosis of COVID-19 from chest X-ray images. Comput. Methods Programs Biomed. 2020, 196, 105581. [Google Scholar] [CrossRef] [PubMed]
- Chandra, T.B.; Verma, K.; Singh, B.K.; Jain, D.; Netam, S.S. Coronavirus disease (COVID-19) detection in Chest X-Ray images using majority voting based classifier ensemble. Expert Syst. Appl. 2021, 165, 113909. [Google Scholar] [CrossRef] [PubMed]
- Ismael, A.M.; Şengür, A. Deep learning approaches for COVID-19 detection based on chest X-ray images. Expert Syst. Appl. 2021, 164, 114054. [Google Scholar] [CrossRef] [PubMed]
- Karthik, R.; Menaka, R.; Hariharan, M. Learning distinctive filters for COVID-19 detection from chest X-ray using shuffled residual CNN. Appl. Soft Comput. 2021, 99, 106744. [Google Scholar] [CrossRef]
- Ohata, E.F.; Bezerra, G.M.; das Chagas, J.V.S.; Neto, A.V.L.; Albuquerque, A.B.; de Albuquerque, V.H.C.; Reboucas Filho, P.P. Automatic detection of COVID-19 infection using chest X-ray images through transfer learning. IEEE/CAA J. Autom. Sin. 2020, 8, 239–248. [Google Scholar] [CrossRef]
- De Moura, J.; García, L.R.; Vidal, P.F.L.; Cruz, M.; López, L.A.; Lopez, E.C.; Novo, J.; Ortega, M. Deep convolutional approaches for the analysis of covid-19 using chest X-ray images from portable devices. IEEE Access 2020, 8, 195594–195607. [Google Scholar] [CrossRef]
- Duran-Lopez, L.; Dominguez-Morales, J.P.; Corral-Jaime, J.; Vicente-Diaz, S.; Linares-Barranco, A. COVID-XNet: A custom deep learning system to diagnose and locate COVID-19 in chest X-ray images. Appl. Sci. 2020, 10, 5683. [Google Scholar] [CrossRef]
- Shorfuzzaman, M.; Hossain, M.S. MetaCOVID: A Siamese neural network framework with contrastive loss for n-shot diagnosis of COVID-19 patients. Pattern Recognit. 2021, 113, 107700. [Google Scholar] [CrossRef]
- Shankar, K.; Perumal, E. A novel hand-crafted with deep learning features based fusion model for COVID-19 diagnosis and classification using chest X-ray images. Complex Intell. Syst. 2020, 7, 1277–1293. [Google Scholar] [CrossRef]
- Ozturk, T.; Talo, M.; Yildirim, E.A.; Baloglu, U.B.; Yildirim, O.; Acharya, U.R. Automated detection of COVID-19 cases using deep neural networks with X-ray images. Comput. Biol. Med. 2020, 121, 103792. [Google Scholar] [CrossRef] [PubMed]
- Sethy, P.K.; Behera, S.K. Detection of coronavirus disease (covid-19) based on deep features. Preprints 2020, 2020030300. [Google Scholar] [CrossRef]
- Keles, A.; Keles, M.B.; Keles, A. COV19-CNNet and COV19-ResNet: Diagnostic inference Engines for early detection of COVID-19. Cogn. Comput. 2021, 6, 1–11. [Google Scholar]
- Narayanan, B.N.; Hardie, R.C.; Krishnaraja, V.; Karam, C.; Davuluru, V.S.P. Transfer-to-transfer learning approach for computer aided detection of COVID-19 in chest radiographs. AI 2020, 1, 539–557. [Google Scholar] [CrossRef]
- Ghoshal, B.; Tucker, A. Estimating uncertainty and interpretability in deep learning for coronavirus (COVID-19) detection. arXiv 2020, arXiv:2003.10769. [Google Scholar]
- Zhang, J.; Xie, Y.; Li, Y.; Shen, C.; Xia, Y. Covid-19 screening on chest X-ray images using deep learning based anomaly detection. arXiv 2020, arXiv:2003.12338. [Google Scholar]
- Karim, M.; Döhmen, T.; Rebholz-Schuhmann, D.; Decker, S.; Cochez, M.; Beyan, O. Deepcovidexplainer: Explainable covid-19 predictions based on chest X-ray images. arXiv 2020, arXiv:2004.04582. [Google Scholar]
- Sitaula, C.; Hossain, M.B. Attention-based VGG-16 model for COVID-19 chest X-ray image classification. Appl. Intell. 2021, 51, 2850–2863. [Google Scholar] [CrossRef]
- Pham, T.D. Classification of COVID-19 chest X-rays with deep learning: New models or fine tuning? Health Inf. Sci. Syst. 2021, 9, 1–11. [Google Scholar] [CrossRef]
- Krizhevsky, A.; Sutskever, I.; Hinton, G.E. Imagenet classification with deep convolutional neural networks. Adv. Neural Inf. Process. Syst. 2012, 25, 1097–1105. [Google Scholar] [CrossRef]
- Simonyan, K.; Zisserman, A. Very deep convolutional networks for large-scale image recognition. arXiv 2014, arXiv:1409.1556. [Google Scholar]
- He, K.; Zhang, X.; Ren, S.; Sun, J. Deep residual learning for image recognition. In Proceedings of the IEEE conference on computer vision and pattern recognition, Las Vegas, NV, USA, 27–30 June 2016; pp. 770–778. [Google Scholar]
- Szegedy, C.; Liu, W.; Jia, Y.; Sermanet, P.; Reed, S.; Anguelov, D.; Erhan, D.; Vanhoucke, V.; Rabinovich, A. Going deeper with convolutions. In Proceedings of the IEEE conference on computer vision and pattern recognition, Boston, MA, USA, 7–12 June 2015; pp. 1–9. [Google Scholar]
- Dosovitskiy, A.; Beyer, L.; Kolesnikov, A.; Weissenborn, D.; Zhai, X.; Unterthiner, T.; Dehghani, M.; Minderer, M.; Heigold, G.; Gelly, S.; et al. An image is worth 16 × 16 words: Transformers for image recognition at scale. arXiv 2020, arXiv:2010.11929. [Google Scholar]
- Hubel, D.H.; Wiesel, T.N. Receptive fields, binocular interaction and functional architecture in the cat’s visual cortex. J. Physiol. 1962, 160, 106–154. [Google Scholar] [CrossRef]
- Marr, D. Representing Visual Information. Available online: https://apps.dtic.mil/sti/citations/ADA055045 (accessed on 5 August 2021).
- Vayá, M.d.l.I.; Saborit, J.M.; Montell, J.A.; Pertusa, A.; Bustos, A.; Cazorla, M.; Galant, J.; Barber, X.; Orozco-Beltrán, D.; García-García, F.; et al. Bimcv covid-19+: A large annotated dataset of rx and ct images from covid-19 patients. arXiv 2020, arXiv:2006.01174. [Google Scholar]
- Cohen, J.P.; Morrison, P.; Dao, L.; Roth, K.; Duong, T.Q.; Ghassemi, M. COVID-19 Image Data Collection: Prospective Predictions Are the Future. arXiv 2020, arXiv:2006.11988. [Google Scholar]
- Haghanifar, A.; Majdabadi, M.M.; Choi, Y.; Deivalakshmi, S.; Ko, S. COVID-CXNet: Detecting COVID-19 in Frontal Chest X-ray Images using Deep Learning. arXiv 2020, arXiv:2006.13807. [Google Scholar]
- Kermany, D.S.; Goldbaum, M.; Cai, W.; Valentim, C.C.; Liang, H.; Baxter, S.L.; McKeown, A.; Yang, G.; Wu, X.; Yan, F. Identifying medical diagnoses and treatable diseases by image-based deep learning. Cell 2018, 172, 1122–1131. [Google Scholar] [CrossRef] [PubMed]
- Wang, N.; Liu, H.; Xu, C. Deep learning for the detection of COVID-19 using transfer learning and model integration. In Proceedings of the 2020 IEEE 10th International Conference on Electronics Information and Emergency Communication (ICEIEC), Beijing, China, 17–19 July 2020; pp. 281–284. [Google Scholar]
- Benbrahim, H.; Hachimi, H.; Amine, A. Deep transfer learning with apache spark to detect covid-19 in chest X-ray images. Rom. J. Inf. Sci. Technol. 2020, 23, S117–S129. [Google Scholar]


| Reference | Number of Images | Classes and Size | Method(s) | Reported Accuracy |
|---|---|---|---|---|
| Khan et al. [37] | 1251 |
| CNN (ConNet) | 89% |
| Ozturk et al. [46] | 1625 |
| Dark CovidNet | 87.02% |
| Apostolopoulos and Mpesiana [32] | 1427 1442 | Dataset (i)
Dataset (ii)
| CNN, MobileNet v2 | 96.78% |
| Wang et al. [10] | 13975 |
| DNN, VGG-19, ResNet-50, CovidNet | 93.3% |
| Sethy and Behera [47] | 381 |
| CNN, ResNet-50 + SVM | 95.35% |
| El-Din Hemdan et al. [33] | 50 |
| D-CNN, VGG-19, DenseNet-201 | 98.0% |
| Keles et al. [48] | 810 |
| CNN, Covid-ResNet, Covid-CNNet | 97.6% |
| Narayanan et al. [49] | 5856 |
| ResNet-50, DenseNet-201, Inception-v3, Xception | 98.0% |
| Ghoshal and Tucker [50] | 5941 |
| CNN, Bayesian ResNet-50 v2 | 89.92% |
| Chowdhury et al. [22] | 3487 |
| DCNN, CheXNet + DenseNet-201 | 99.7% |
| Zhang et al. [51] | 1531 |
| CNN, Classification Grad-CAM | 95.13% AUC |
| Abbas et al. [31] | 195 |
| D-CNN, DeTraC | 95.12% |
| Karim et al. [52] | 16,995 |
| DNN, Deep Covid Explainer | PPV 96.12% |
| Sitaula and Hossain [53] | 1125 1638 | Dataset (i)
Dataset (ii)
| VGG-16, VGG-19 | 87.49% |
| Pham [54] | 1124 | Dataset (i)
Dataset (iii)
| CNN, AlexNet, GoogleNet, SqueezeNet | 99.0% |
| Chandra et al. [38] | 542 80 680 | Dataset (i)
Dataset (ii)
Dataset (iii)
| KNN, ANN, DT, SVM | 93.41% |
| Set | COVID-19 | Normal | Lung Opacity | Viral Pneumonia |
|---|---|---|---|---|
| Train | 2604 | 7339 | 4329 | 969 |
| Validation | 651 | 1834 | 1082 | 242 |
| Test | 361 | 1019 | 601 | 134 |
| Total | 3616 | 10,192 | 6012 | 1345 |
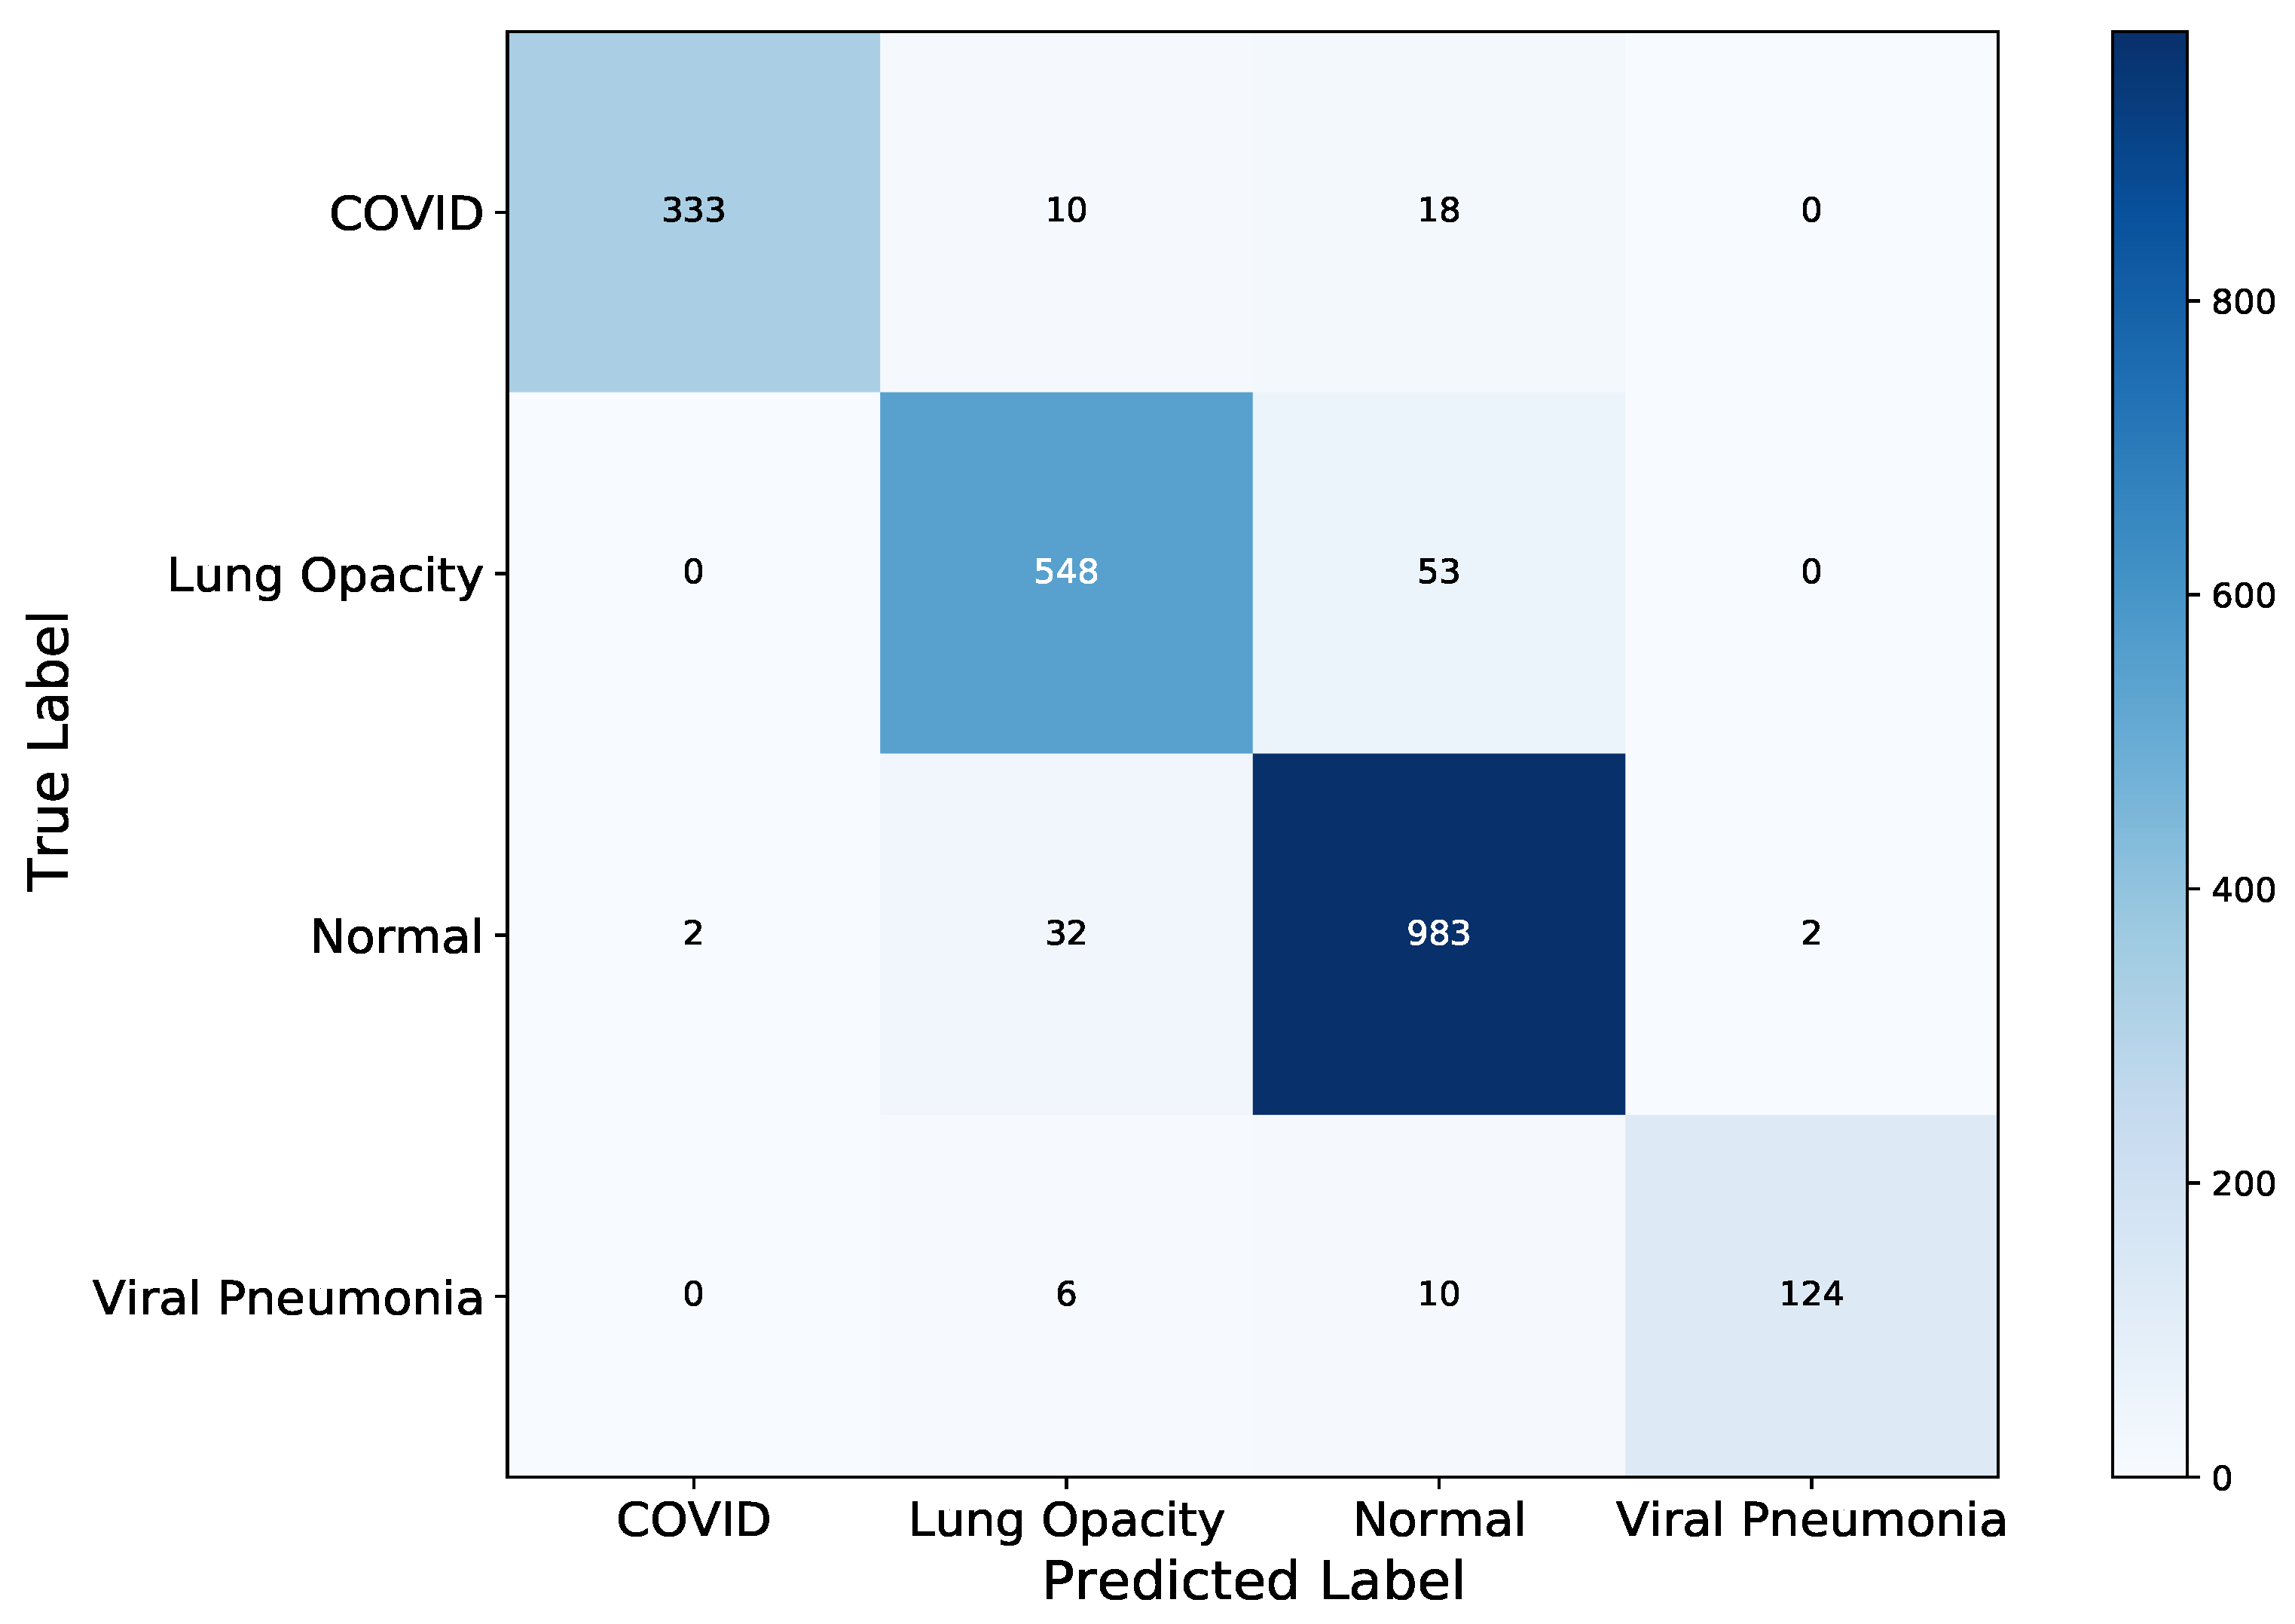
| Model | Correct Classification | Incorrect Classification |
|---|---|---|
| VGG-19 | 1988 | 127 |
| DenseNet-121 | 1972 | 143 |
| ResNet-50 | 1985 | 130 |
Publisher’s Note: MDPI stays neutral with regard to jurisdictional claims in published maps and institutional affiliations. |
© 2021 by the authors. Licensee MDPI, Basel, Switzerland. This article is an open access article distributed under the terms and conditions of the Creative Commons Attribution (CC BY) license (https://creativecommons.org/licenses/by/4.0/).
Share and Cite
Brima, Y.; Atemkeng, M.; Tankio Djiokap, S.; Ebiele, J.; Tchakounté, F. Transfer Learning for the Detection and Diagnosis of Types of Pneumonia including Pneumonia Induced by COVID-19 from Chest X-ray Images. Diagnostics 2021, 11, 1480. https://doi.org/10.3390/diagnostics11081480
Brima Y, Atemkeng M, Tankio Djiokap S, Ebiele J, Tchakounté F. Transfer Learning for the Detection and Diagnosis of Types of Pneumonia including Pneumonia Induced by COVID-19 from Chest X-ray Images. Diagnostics. 2021; 11(8):1480. https://doi.org/10.3390/diagnostics11081480
Chicago/Turabian StyleBrima, Yusuf, Marcellin Atemkeng, Stive Tankio Djiokap, Jaures Ebiele, and Franklin Tchakounté. 2021. "Transfer Learning for the Detection and Diagnosis of Types of Pneumonia including Pneumonia Induced by COVID-19 from Chest X-ray Images" Diagnostics 11, no. 8: 1480. https://doi.org/10.3390/diagnostics11081480
APA StyleBrima, Y., Atemkeng, M., Tankio Djiokap, S., Ebiele, J., & Tchakounté, F. (2021). Transfer Learning for the Detection and Diagnosis of Types of Pneumonia including Pneumonia Induced by COVID-19 from Chest X-ray Images. Diagnostics, 11(8), 1480. https://doi.org/10.3390/diagnostics11081480