
An Automated Microscopic Malaria Parasite Detection System Using Digital Image Analysis


Abstract
1. Introduction
2. Materials and Methods
2.1. Materials
2.1.1. Patient Samples
2.1.2. P. falciparum Culture
2.2. Methods
2.2.1. Microscopic Examination of Malaria
2.2.2. Flow Cytometric Enumeration of Malaria
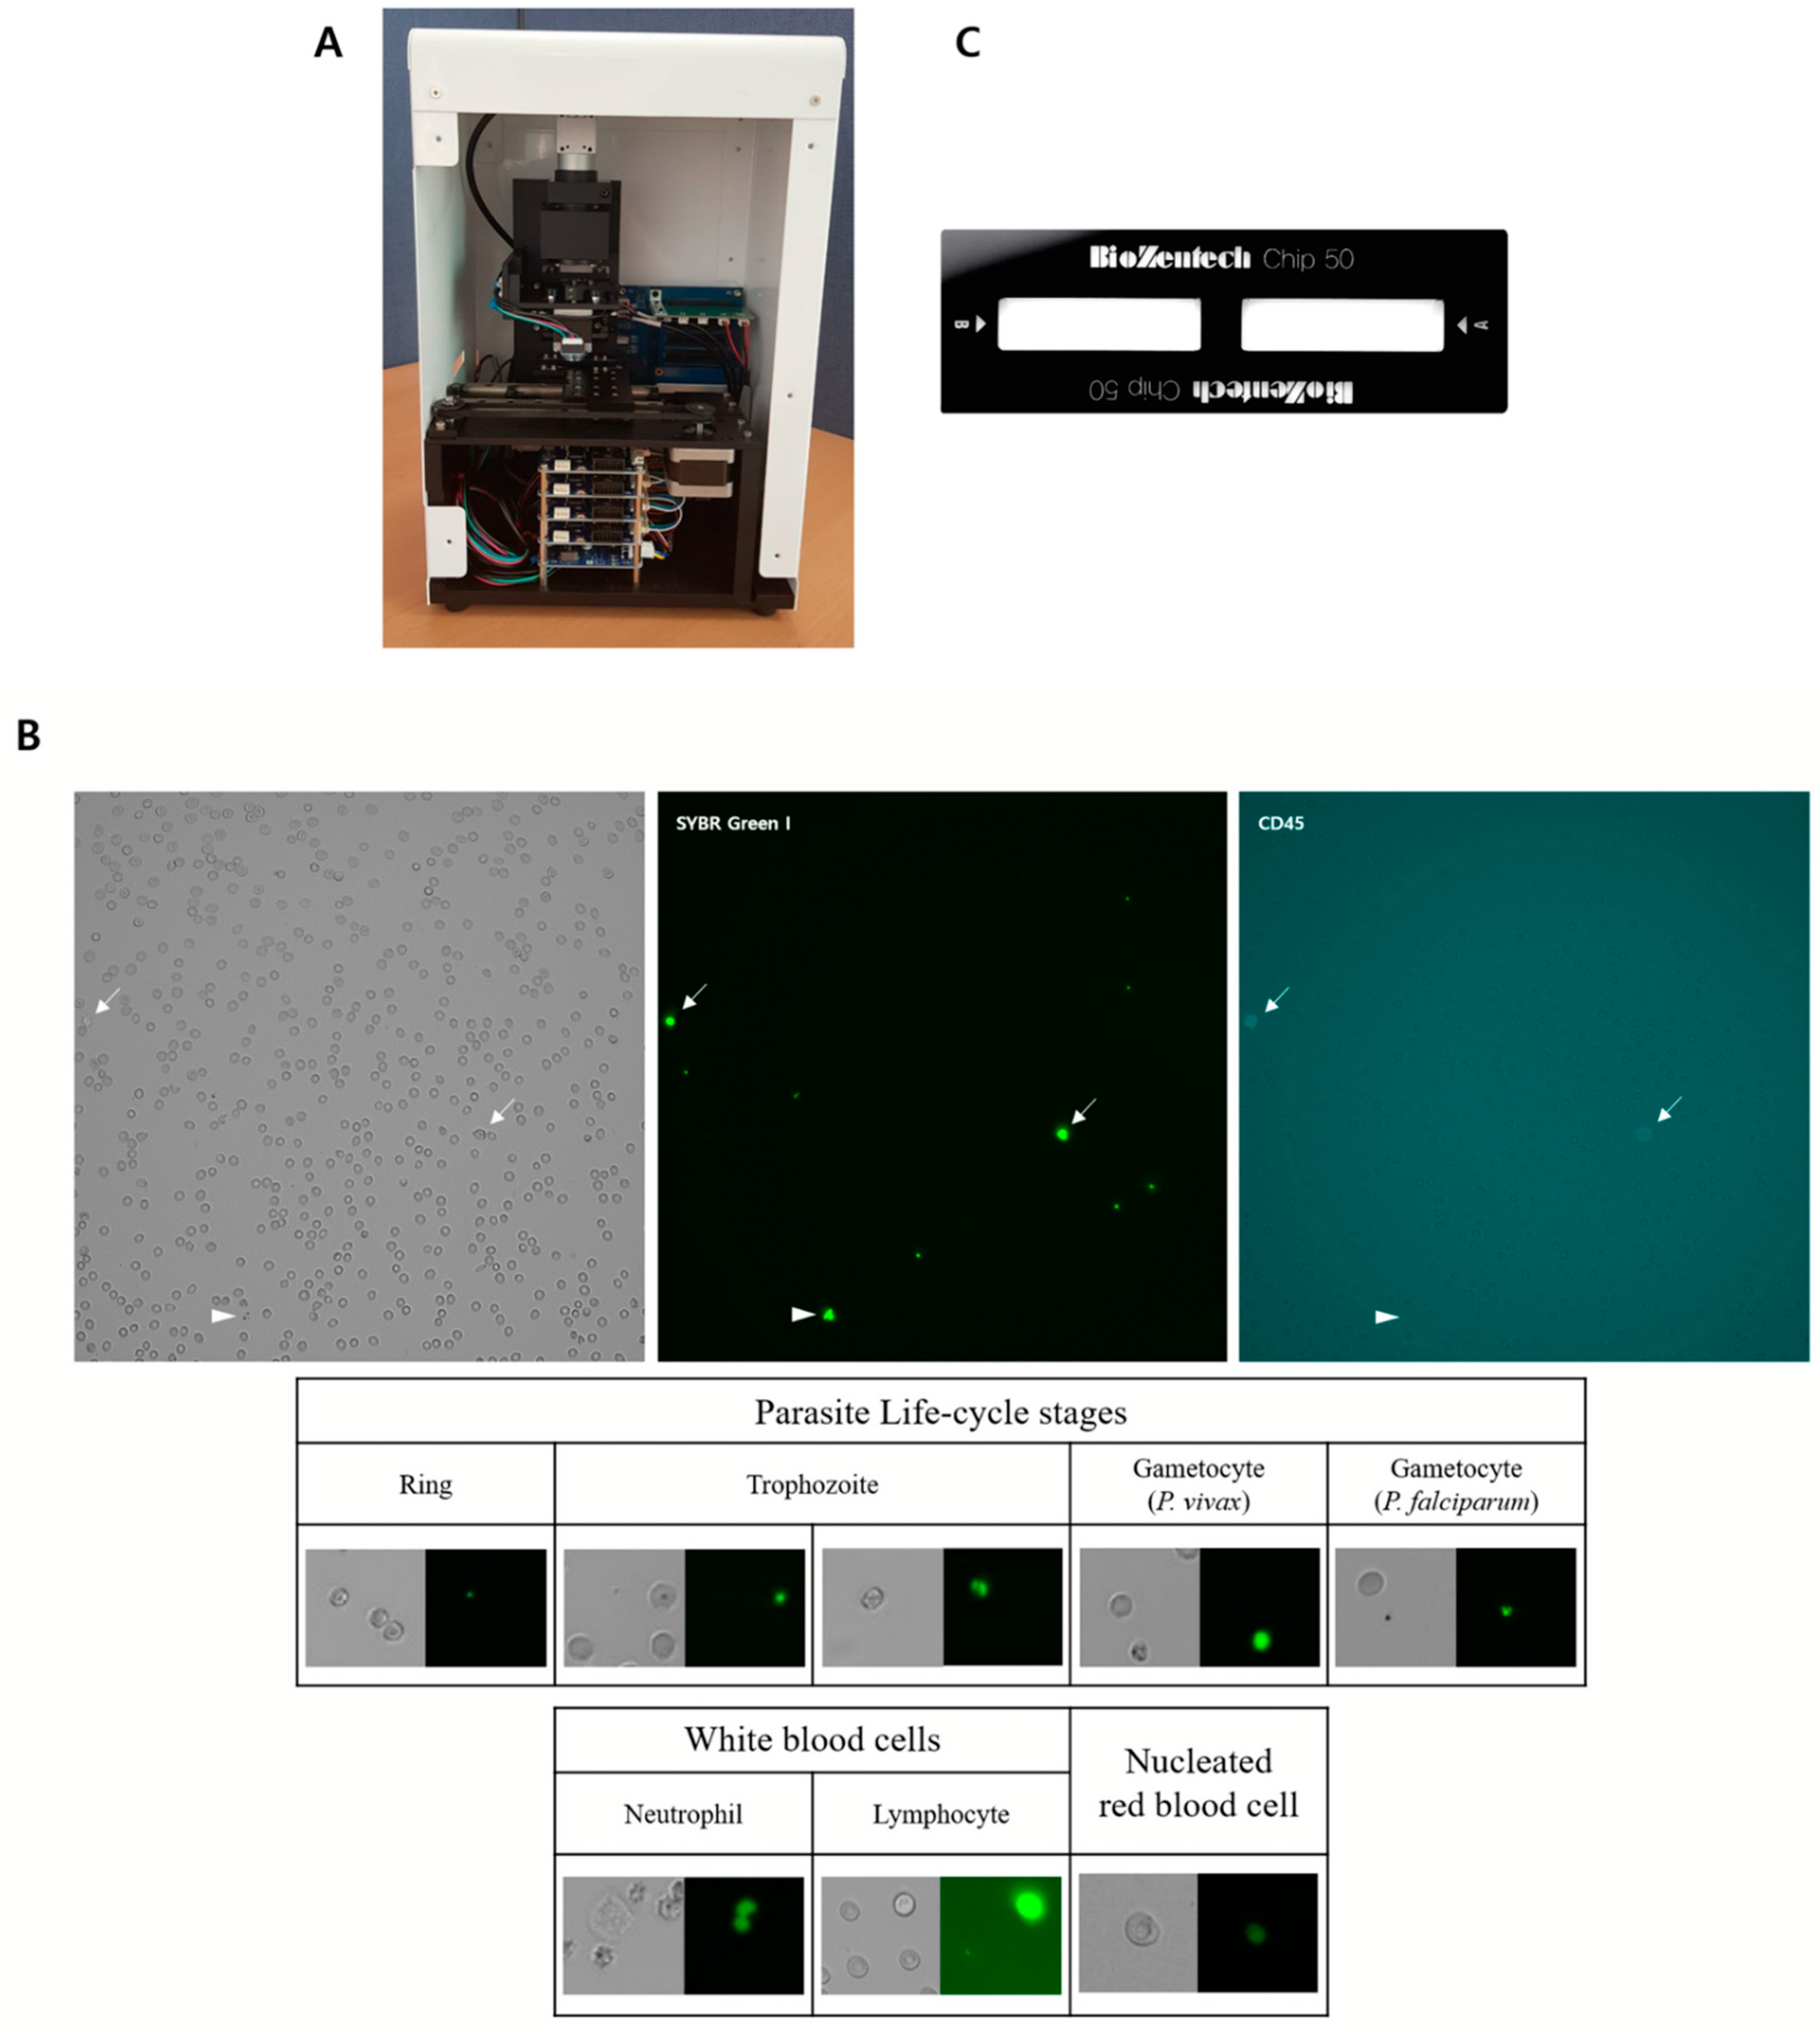
2.2.3. Automated Microscopic Malaria Parasite Detection System
2.2.4. Plastic Chip
2.2.5. Staining Methods for Automated Microscopic Malaria Parasite Detection System
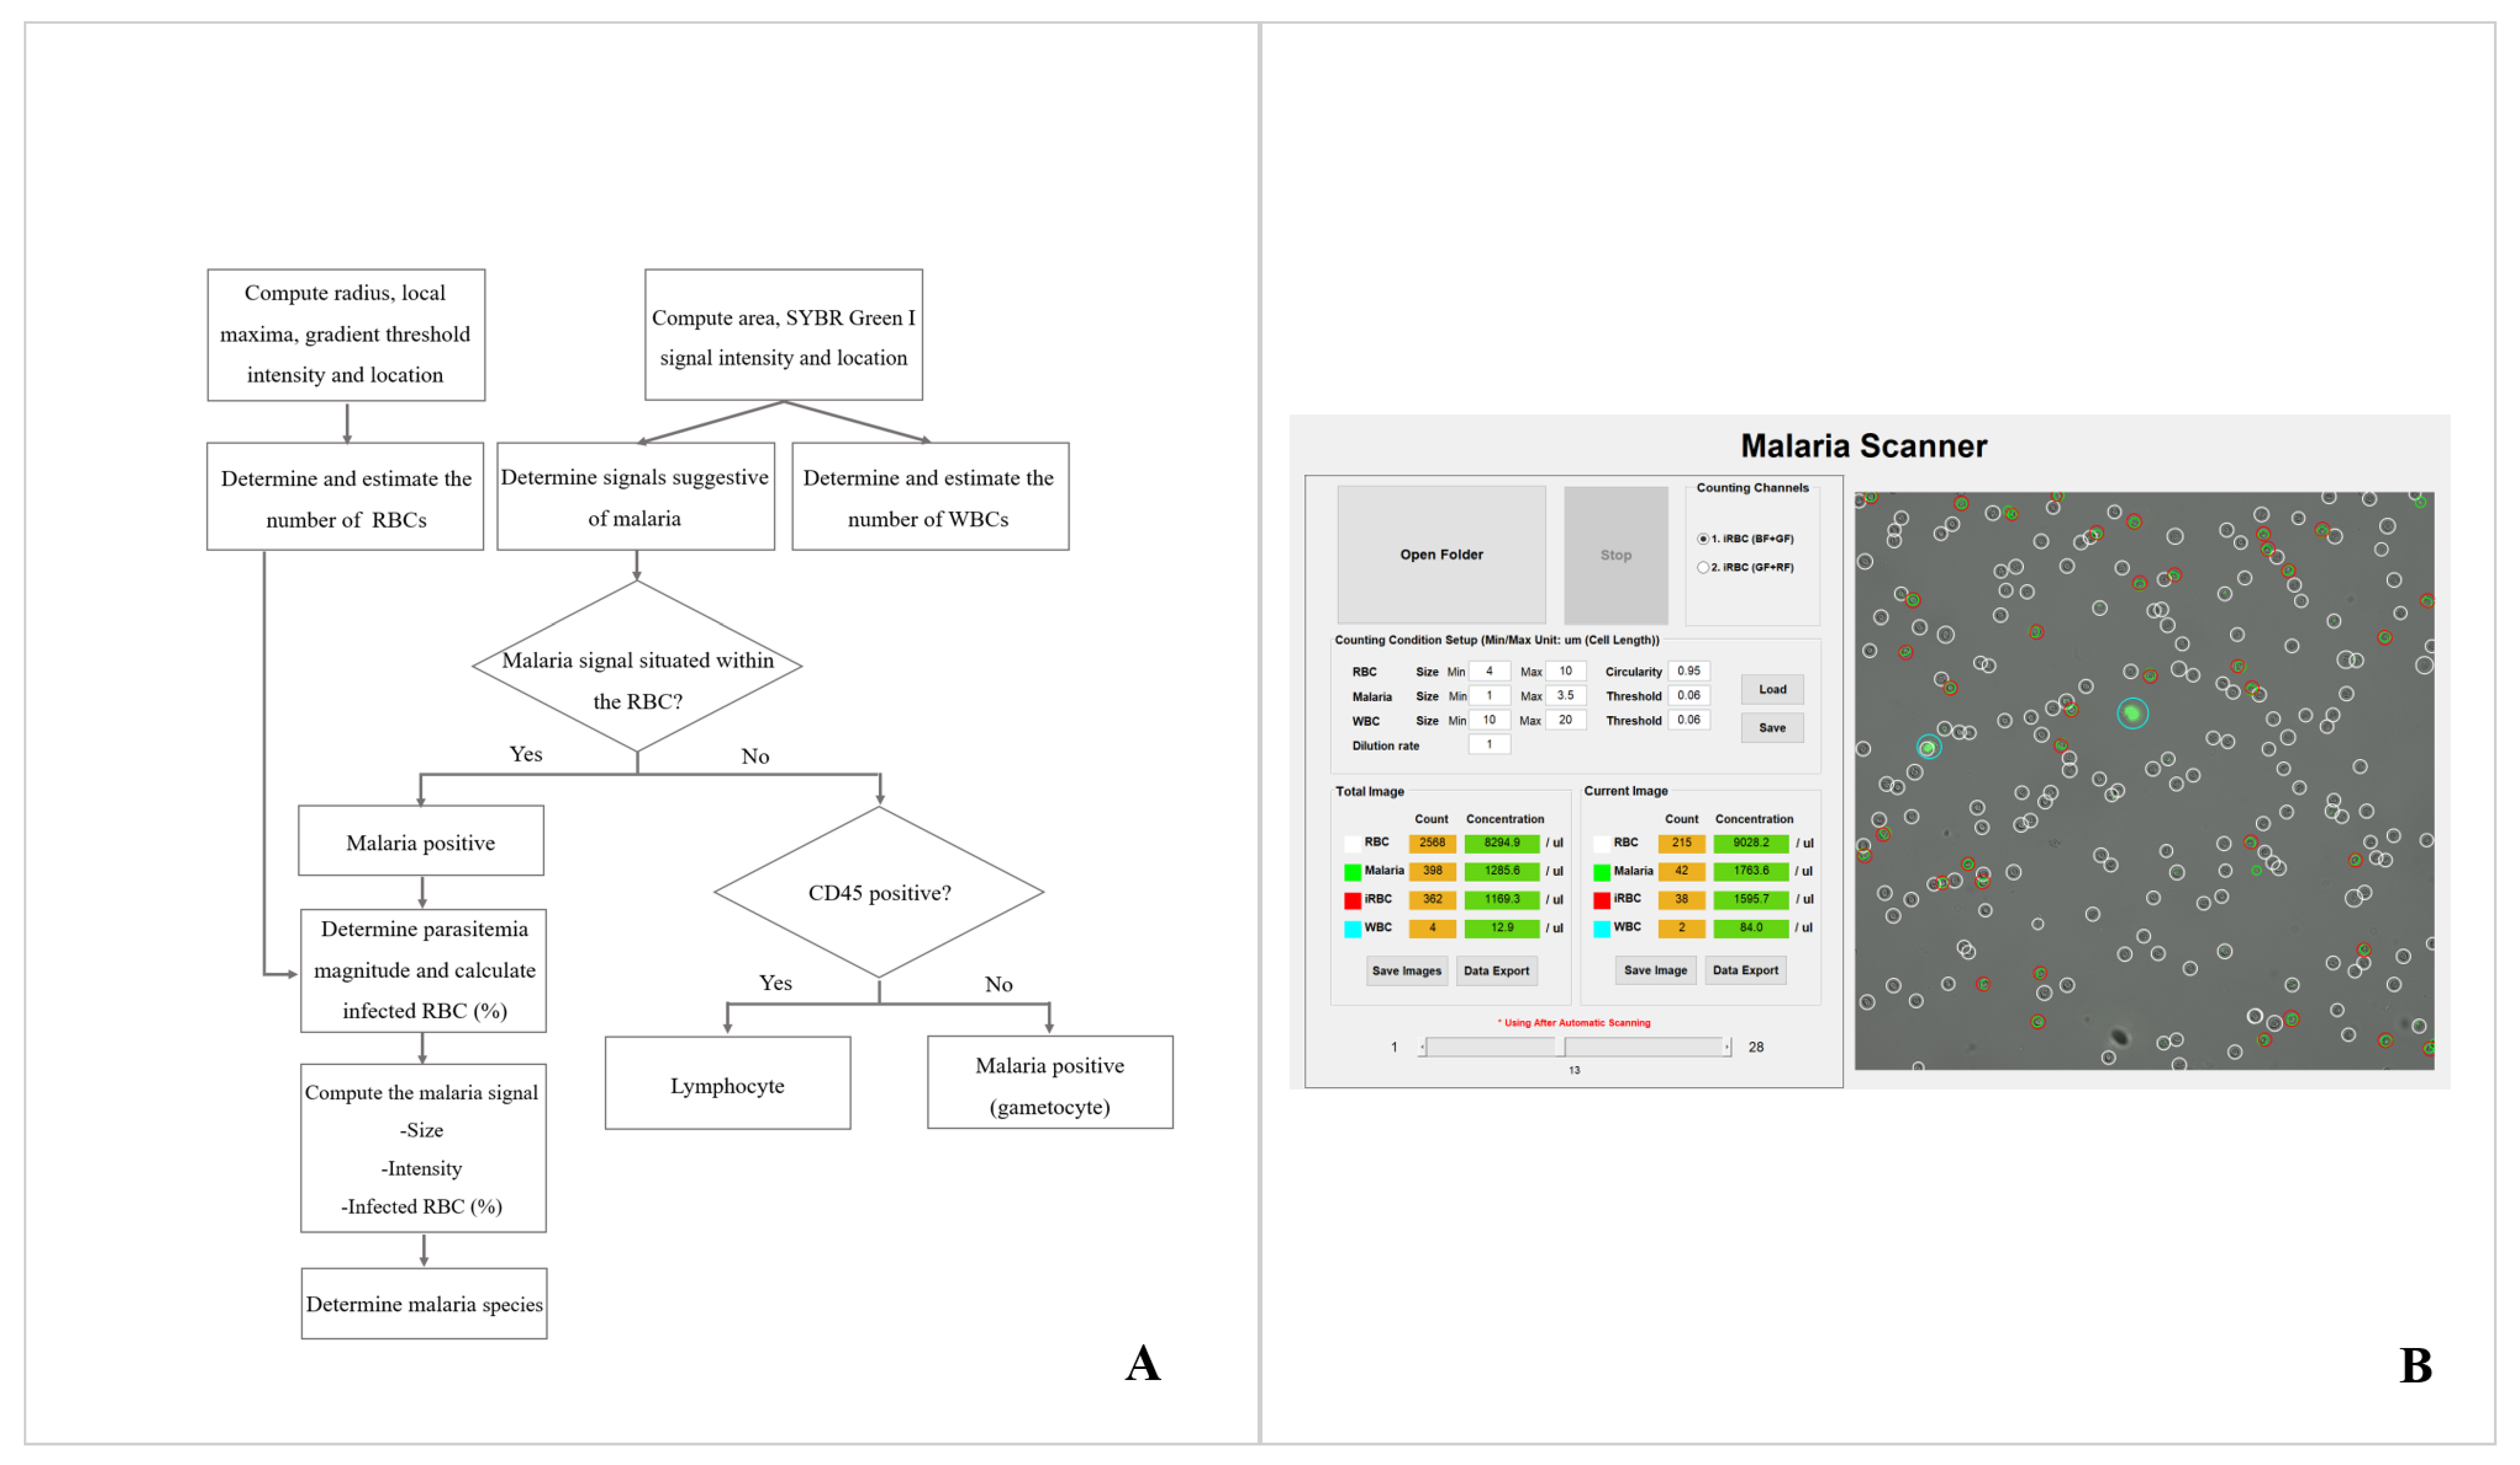
2.2.6. Image Analysis System for Malaria Detection and Parasitemia Determination
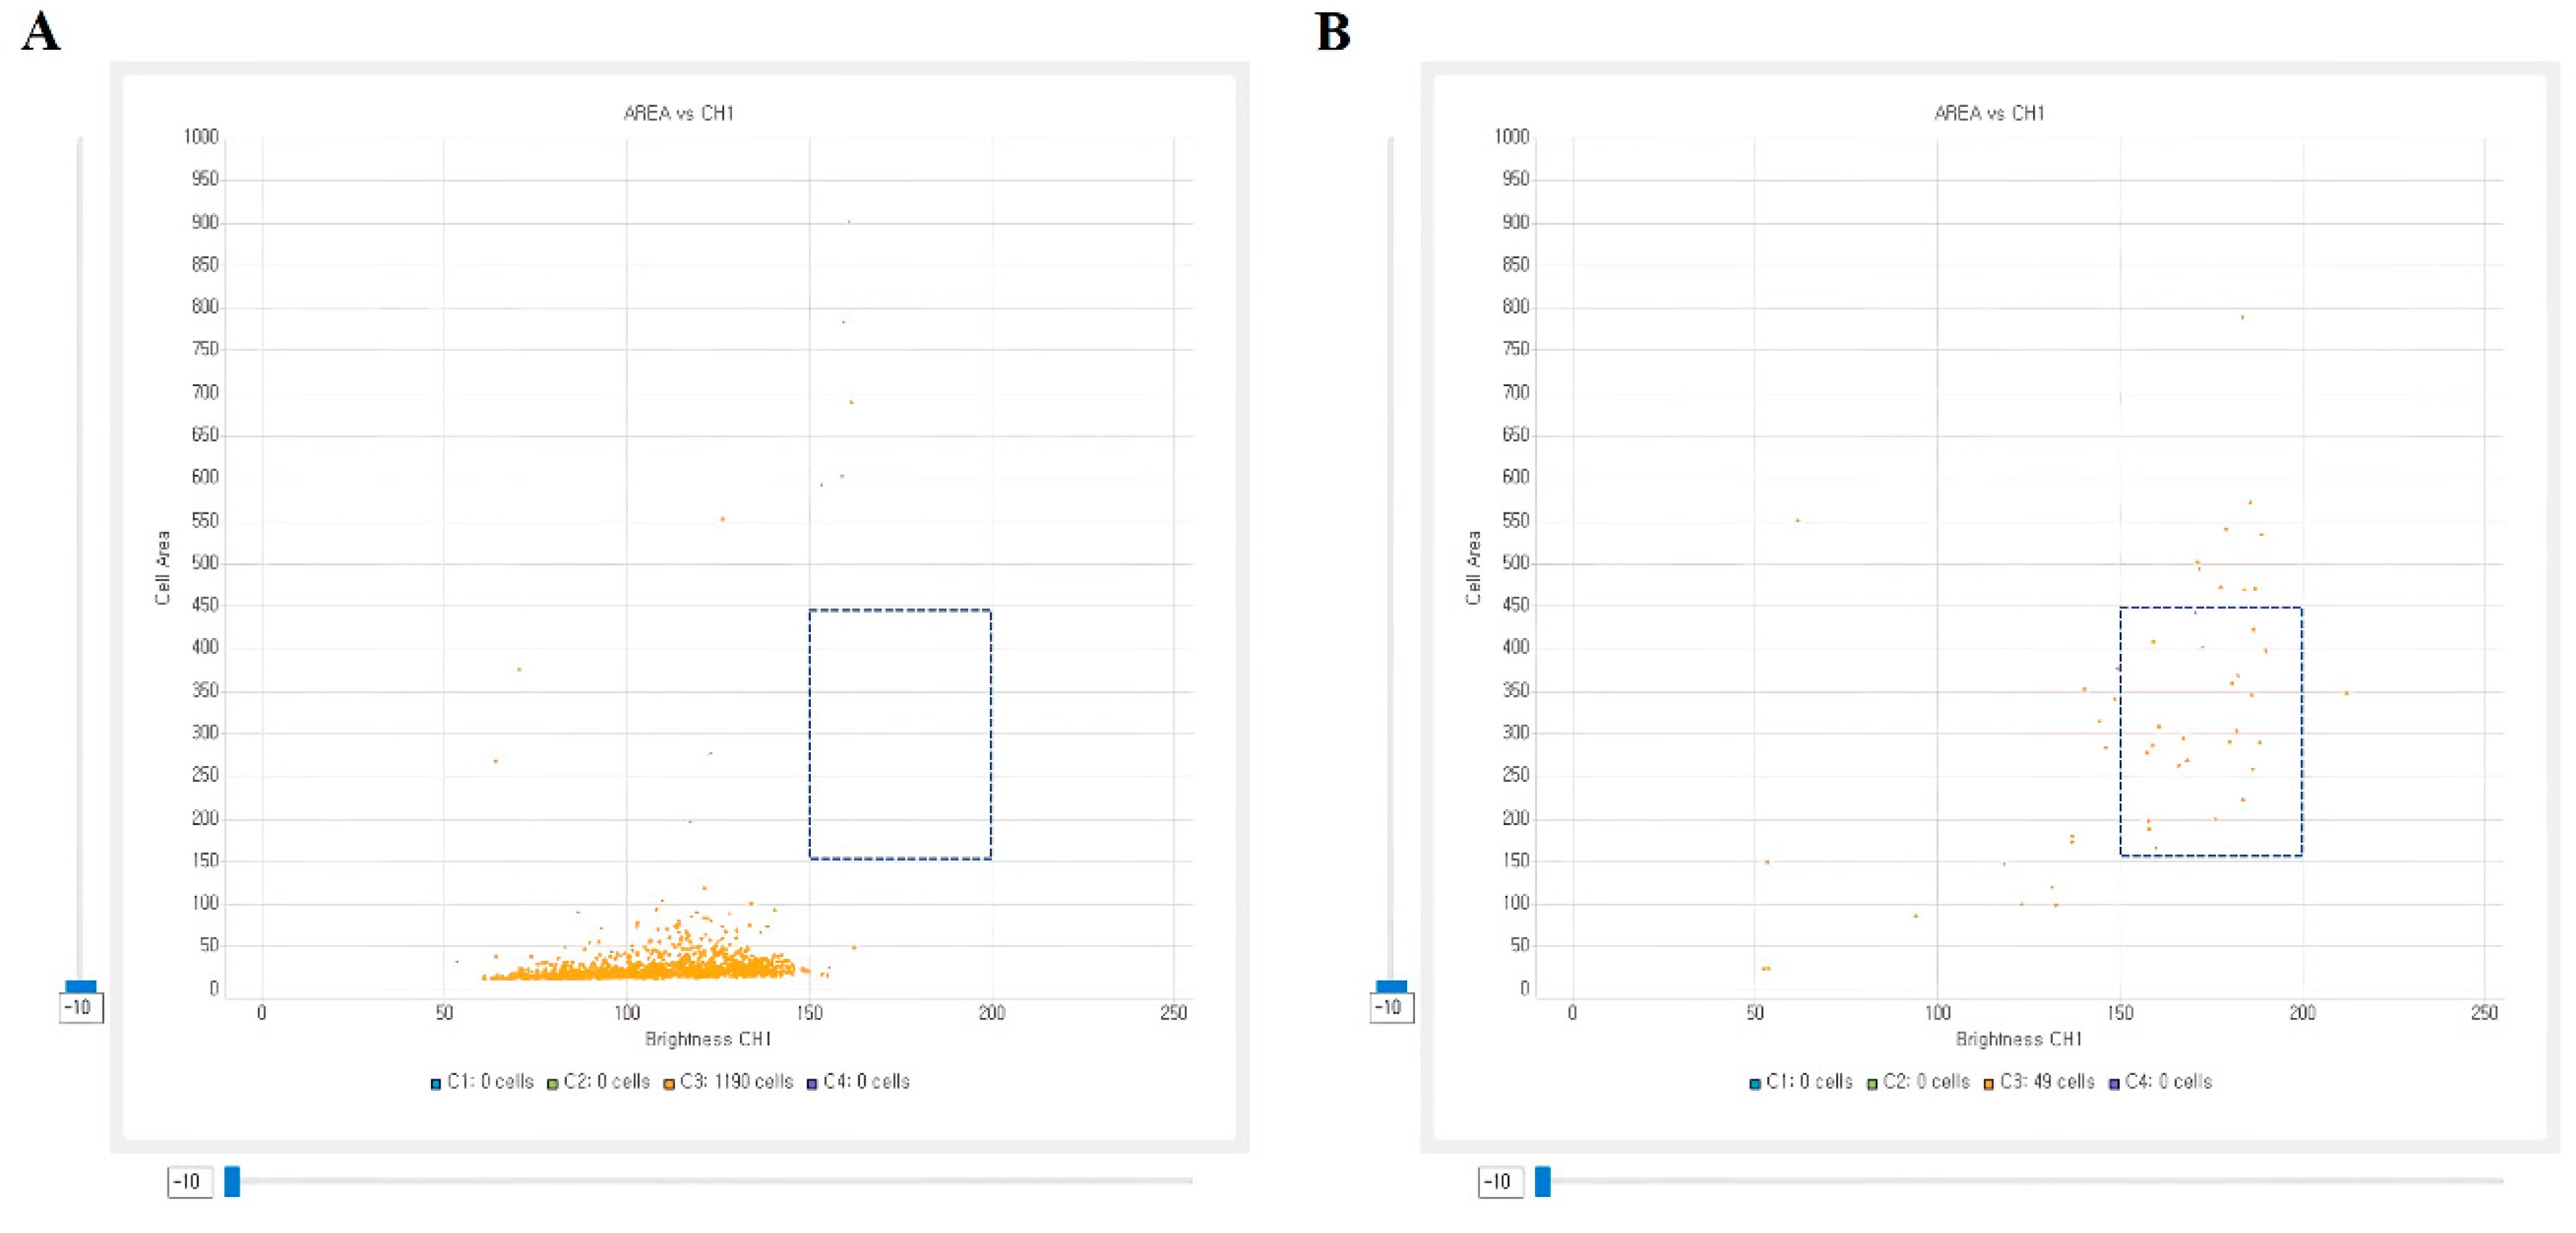
2.2.7. Image Analysis System for Malaria Species Classification
2.2.8. Statistics
3. Results
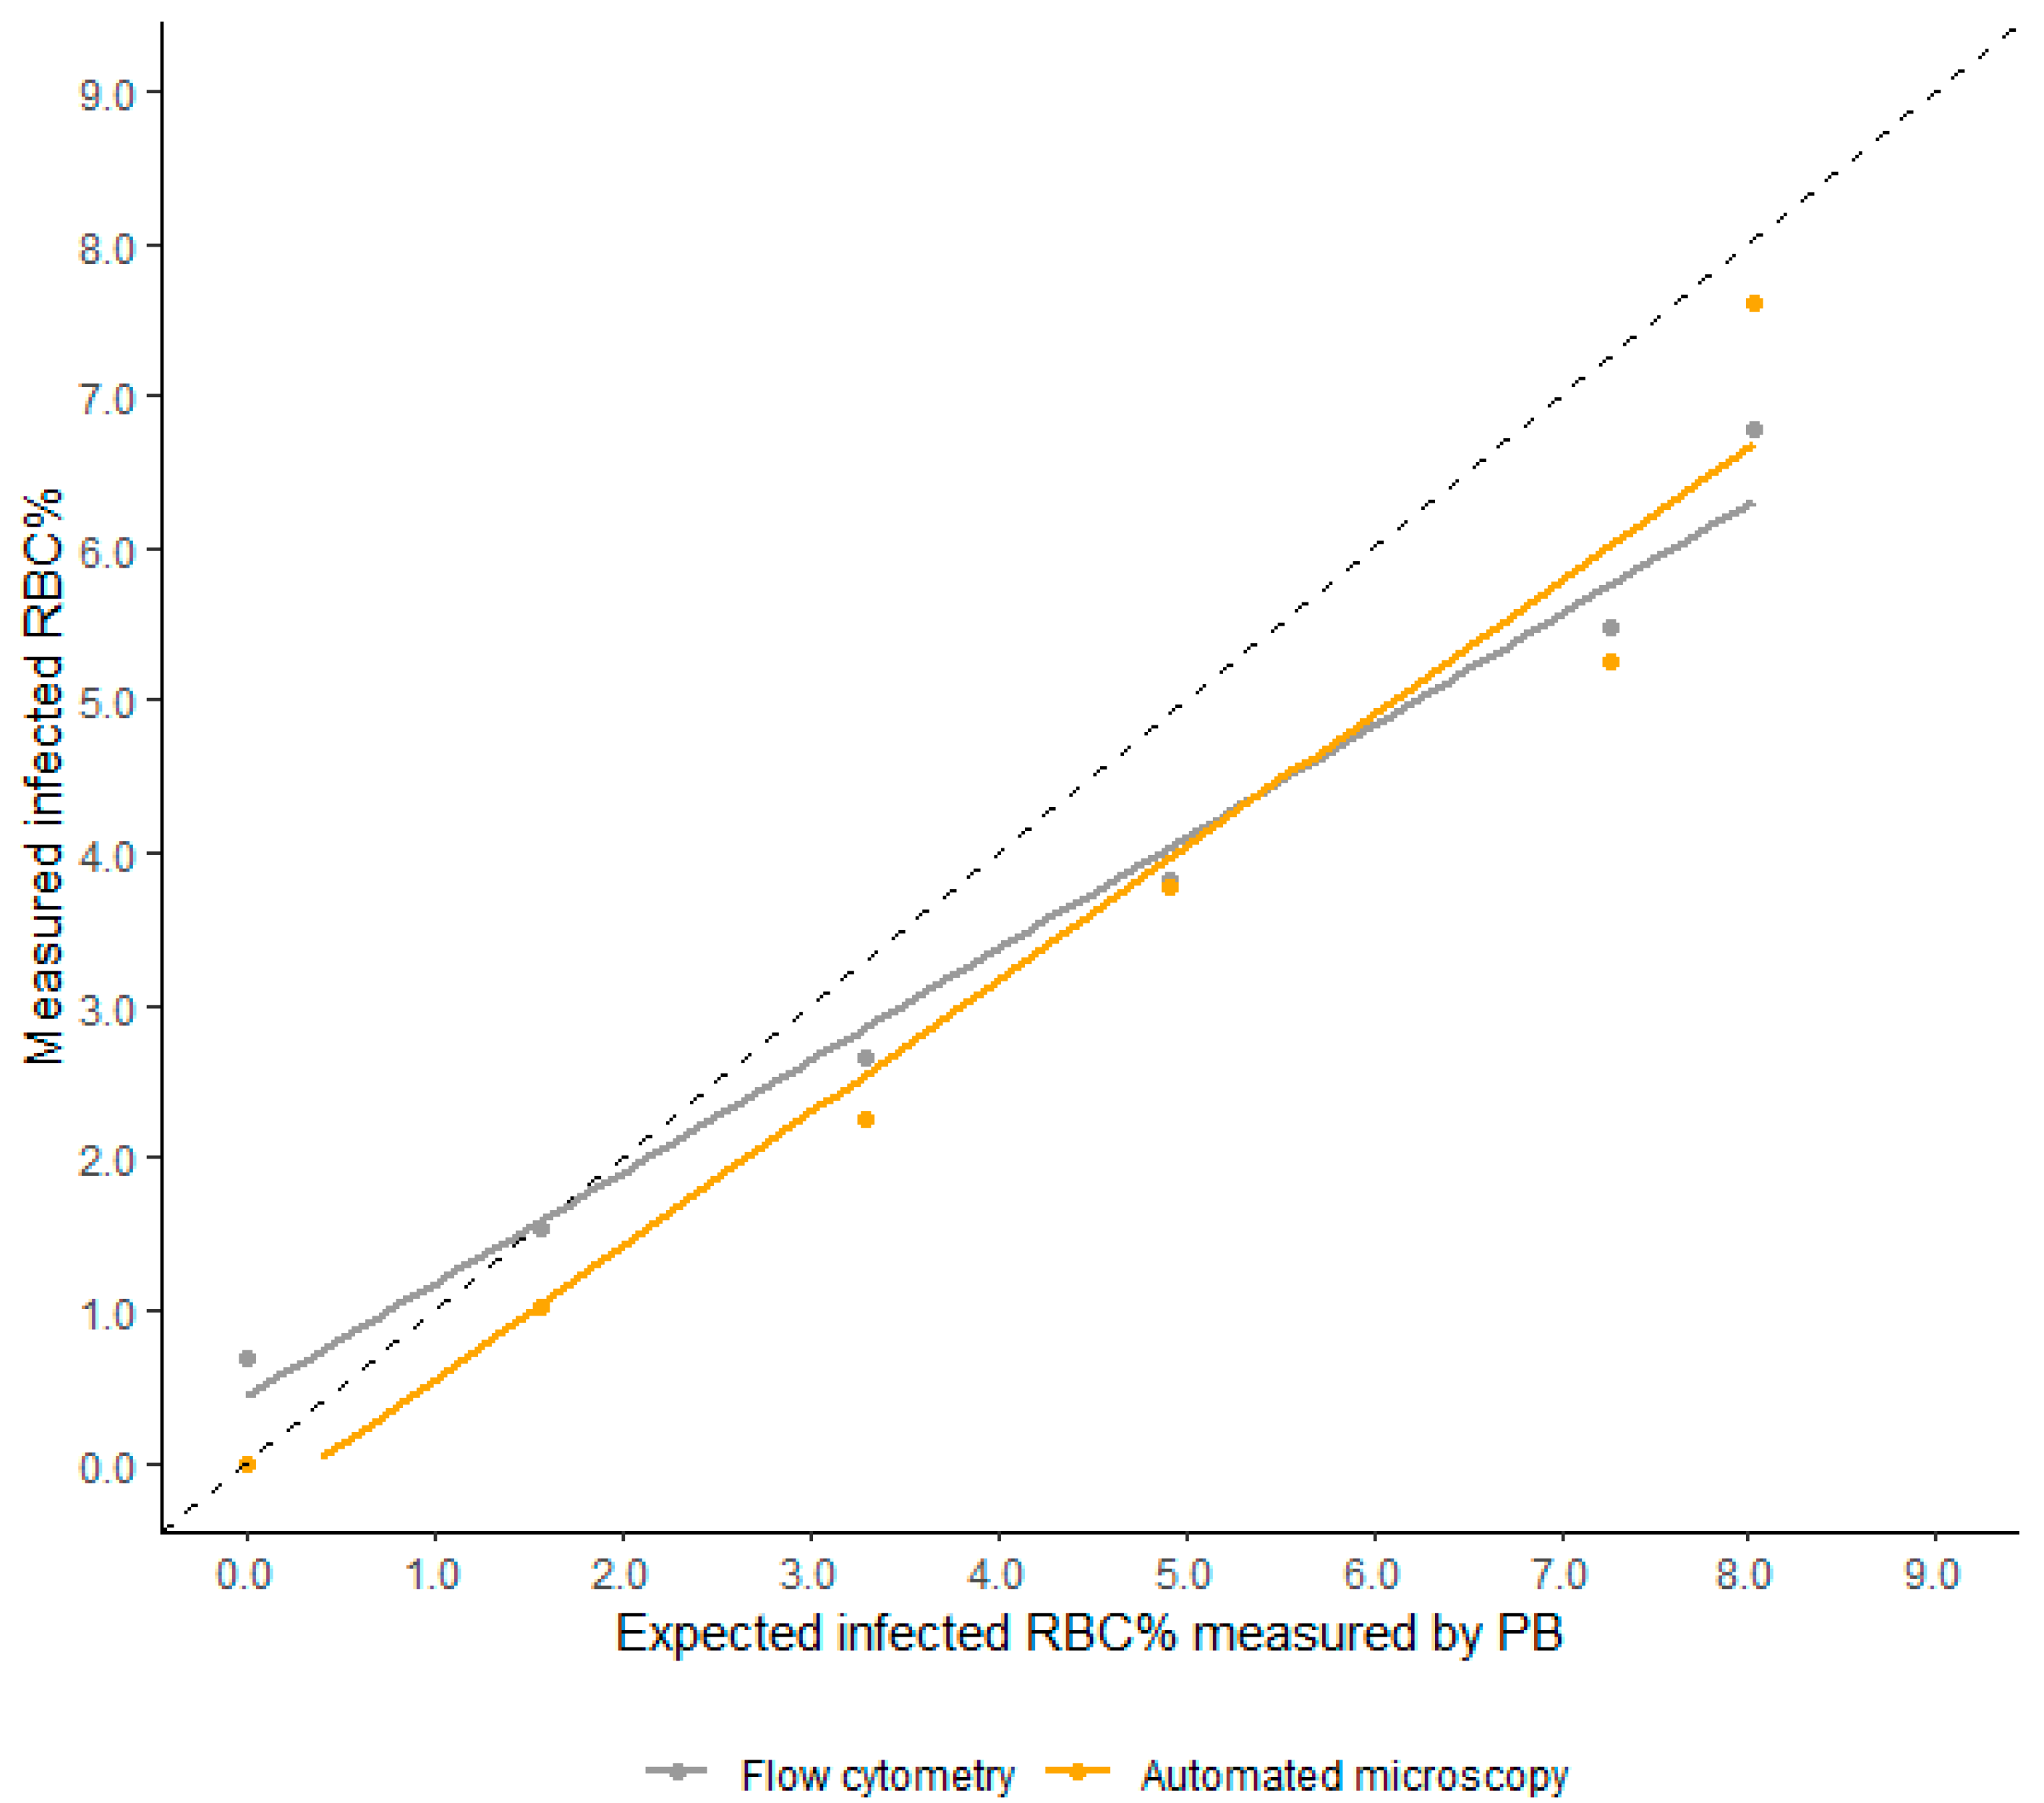
3.1. Linearity
3.2. Precision
3.3. LOD Analysis
3.4. Comparison of Malaria Counting Methods
4. Discussion
5. Conclusions
Author Contributions
Funding
Institutional Review Board Statement
Informed Consent Statement
Data Availability Statement
Conflicts of Interest
References
- World Health Organization. World Malaria Report 2020. Available online: https://www.who.int/publications/i/item/9789240015791 (accessed on 22 December 2020).
- Kiszewski, A.; Johns, B.; Schapira, A.; Delacollette, C.; Crowell, V.; Tan-Torres, T.; Ameneshewa, B.; Teklehaimanot, A.; Nafo-Traore, F. Estimated global resources needed to attain international malaria control goals. Bull. World Health Organ. 2007, 85, 623–630. [Google Scholar] [CrossRef] [PubMed]
- World Health Organization. Malaria Rapid Diagnostic Test Performance: Results of WHO Product Testing of Malaria RDTs: Round 6 (2014–2015); World Health Organization: Geneva, Switzerland, 2015. [Google Scholar]
- Jimenez, A.; Rees-Channer, R.R.; Perera, R.; Gamboa, D.; Chiodini, P.L.; González, I.J.; Mayor, A.; Ding, X.C. Analytical sensitivity of current best-in-class malaria rapid diagnostic tests. Malaria J. 2017, 16, 128. [Google Scholar] [CrossRef] [PubMed]
- Padley, D.; Moody, A.H.; Chiodini, P.L.; Saldanha, J. Use of a rapid, single-round, multiplex PCR to detect malarial parasites and identify the species present. Ann. Trop. Med. Parasitol. 2003, 97, 131–137. [Google Scholar] [CrossRef] [PubMed]
- Roth, J.M.; Korevaar, D.A.; Leeflang, M.M.; Mens, P.F. Molecular malaria diagnostics: A systematic review and meta-analysis. Crit. Rev. Clin. Lab. Sci. 2016, 53, 87–105. [Google Scholar] [CrossRef] [PubMed]
- Griffith, K.S.; Lewis, L.S.; Mali, S.; Parise, M.E. Treatment of malaria in the United States: A systematic review. JAMA 2007, 297, 2264–2277. [Google Scholar] [CrossRef]
- Goncalves, B.P.; Huang, C.Y.; Morrison, R.; Holte, S.; Kabyemela, E.; Prevots, D.R.; Fried, M.; Duffy, P.E. Parasite burden and severity of malaria in Tanzanian children. N. Engl. J. Med. 2014, 370, 1799–1808. [Google Scholar] [CrossRef]
- World Health Organization. Management of Severe Malaria: A Practical Handbook, 3rd ed.; WHO: Geneva, Switzerland, 2012. [Google Scholar]
- Ashley, E.A.; Dhorda, M.; Fairhurst, R.M.; Amaratunga, C.; Lim, P.; Suon, S.; Sreng, S.; Anderson, J.M.; Mao, S.; Sam, B.; et al. Spread of artemisinin resistance in Plasmodium falciparum malaria. N. Engl. J. Med. 2014, 371, 411–423. [Google Scholar] [CrossRef]
- White, N.J. Malaria parasite clearance. Malaria J. 2017, 16, 88. [Google Scholar] [CrossRef]
- World Health Organization. Malaria Microscopy Quality Assurance Manual—Version 2; World Health Organization: Geneva, Switzerland, 2016. [Google Scholar]
- Bailey, J.W.; Williams, J.; Bain, B.J.; Parker-Williams, J.; Chiodini, P.L. Guideline: The laboratory diagnosis of malaria. General Haematology Task Force of the British Committee for Standards in Haematology. Br. J. Haematol. 2013, 163, 573–580. [Google Scholar] [CrossRef]
- Kahama-Maro, J.; D’Acremont, V.; Mtasiwa, D.; Genton, B.; Lengeler, C. Low quality of routine microscopy for malaria at different levels of the health system in Dar es Salaam. Malaria J. 2011, 10, 332. [Google Scholar] [CrossRef]
- Harchut, K.; Standley, C.; Dobson, A.; Klaassen, B.; Rambaud-Althaus, C.; Althaus, F.; Nowak, K. Over-Diagnosis of malaria by microscopy in the Kilombero Valley, Southern Tanzania: An evaluation of the utility and cost-effectiveness of rapid diagnostic tests. Malaria J. 2013, 12, 159. [Google Scholar] [CrossRef]
- World Health Organization. Bench Aids for Malaria Microscopy; WHO: Geneva, Switzerland, 2009. [Google Scholar]
- Tek, F.B.; Dempster, A.G.; Kale, I. Malaria Parasite Detection in Peripheral Blood Images. In Proceedings of the British Machine Vision Conference 2006, Edinburgh, UK, 4–7 September 2006; Chantler, M.J., Trucco, E., Fisher, R.B., Eds.; [Google Scholar]
- Diaz, G.; Gonzalez, F.A.; Romero, E. A semi-automatic method for quantification and classification of erythrocytes infected with malaria parasites in microscopic images. J. Biomed. Inform. 2009, 42, 296–307. [Google Scholar] [CrossRef] [PubMed]
- Kaewkamnerd, S.; Uthaipibull, C.; Intarapanich, A.; Pannarut, M.; Chaotheing, S.; Tongsima, S. An automatic device for detection and classification of malaria parasite species in thick blood film. BMC Bioinform. 2012, 13, S18. [Google Scholar] [CrossRef]
- Frean, J.A. Reliable enumeration of malaria parasites in thick blood films using digital image analysis. Malaria J. 2009, 8, 218. [Google Scholar] [CrossRef] [PubMed]
- Das, D.K.; Ghosh, M.; Pal, M.; Maiti, A.K.; Chakraborty, C. Machine learning approach for automated screening of malaria parasite using light microscopic images. Micron 2013, 45, 97–106. [Google Scholar] [CrossRef]
- Linder, N.; Turkki, R.; Walliander, M.; Martensson, A.; Diwan, V.; Rahtu, E.; Pietikainen, M.; Lundin, M.; Lundin, J. A malaria diagnostic tool based on computer vision screening and visualization of Plasmodium falciparum candidate areas in digitized blood smears. PLoS ONE 2014, 9, e104855. [Google Scholar]
- Purwar, Y.; Shah, S.L.; Clarke, G.; Almugairi, A.; Muehlenbachs, A. Automated and unsupervised detection of malarial parasites in microscopic images. Malaria J. 2011, 10, 364. [Google Scholar] [CrossRef]
- Vink, J.P.; Laubscher, M.; Vlutters, R.; Silamut, K.; Maude, R.J.; Hasan, M.U.; De Haan, G. An automatic vision-based malaria diagnosis system. J. Microsc. 2013, 250, 166–178. [Google Scholar] [CrossRef]
- Delahunt, C.B.; Mehanian, C.; Hu, L.; McGuire, S.K.; Champlin, C.R.; Horning, M.P. Automated microscopy and machine learning for expert-level malaria field diagnosis. In Proceedings of the IEEE Global Humanitarian Technology Conference Seattle, Seattle, WA, USA, 8–11 October 2015. [Google Scholar]
- Eshel, Y.; Houri-Yafin, A.; Benkuzari, H.; Lezmy, N.; Soni, M.; Charles, M.; Solomon, H.; Premji, Z.; Mbithi, C.; Nneka, Z.; et al. Evaluation of the Parasight Platform for Malaria Diagnosis. J. Clin. Microbiol. 2017, 55, 768–775. [Google Scholar] [CrossRef]
- Prescott, W.R.; Jordan, R.G.; Grobusch, M.P.; Chinchilli, V.M.; Kleinschmidt, I.; Borovsky, J.; Plaskow, M.; Torrez, M.; Mico, M.; Schwabe, C. Performance of a malaria microscopy image analysis slide reading device. Malaria J. 2012, 11, 155. [Google Scholar] [CrossRef] [PubMed]
- World Health Organization. Malaria Microscopy Standard Operating Procedure—MM-SOP-09; WHO: Geneva, Switzerland, 2016. [Google Scholar]
- Guy, R.; Liu, P.; Pennefather, P.; Crandall, I. The use of fluorescence enhancement to improve the microscopic diagnosis of falciparum malaria. Malaria J. 2007, 6, 89. [Google Scholar] [CrossRef] [PubMed]
- Amir, A.; Cheong, F.W.; De Silva, J.R.; Lau, Y.L. Diagnostic tools in childhood malaria. Parasites Vectors 2018, 11, 53. [Google Scholar] [CrossRef] [PubMed]
- Fancony, C.; Sebastiao, Y.V.; Pires, J.E.; Gamboa, D.; Nery, S.V. Performance of microscopy and RDTs in the context of a malaria prevalence survey in Angola: A comparison using PCR as the gold standard. Malaria J. 2013, 12, 284. [Google Scholar] [CrossRef] [PubMed]
- Cordray, M.S.; Richards-Kortum, R.R. Emerging nucleic acid-based tests for point-of-care detection of malaria. Am. J. Trop. Med. Hyg. 2012, 87, 223–230. [Google Scholar] [CrossRef] [PubMed]


| Infected RBC (%) | PB Smear | Automated Microscopic Malaria Parasite Detection System | Flow Cytometry | |||
|---|---|---|---|---|---|---|
| Mean ± SD | %CV | Mean ± SD | %CV | Mean ± SD | %CV | |
| 8.03 | 8.03 ± 0.76 | 9.41 | 7.61 ± 0.56 | 7.33 | 6.78 ± 0.47 | 6.98 |
| 7.27 | 7.27 ± 0.82 | 11.34 | 5.25 ± 0.51 | 9.63 | 5.49 ± 0.50 | 9.03 |
| 4.92 | 4.92 ± 1.18 | 23.96 | 3.78 ± 0.54 | 14.32 | 3.83 ± 0.39 | 10.13 |
| 3.29 | 3.29 ± 0.71 | 21.67 | 2.25 ± 0.36 | 16.04 | 2.66 ± 0.35 | 13.20 |
| 1.56 | 1.56 ± 0.58 | 37.07 | 1.02 ± 0.35 | 34.67 | 1.54 ± 0.30 | 19.29 |
| Infected RBC (%) | Thick Smear | Thin Smear | Automated Microscopic Malaria Parasite Detection System | |||
|---|---|---|---|---|---|---|
| Mean ± SD | %CV | Mean ± SD | %CV | Mean ± SD | %CV | |
| 0.21 | 0.21 ± 0.08 | 39.27 | 0.22 ± 0.22 | 104.38 | 0.23 ± 0.09 | 38.85 |
| 0.17 | 0.17 ± 0.06 | 33.47 | 0.13 ± 0.13 | 99.52 | 0.16 ± 0.04 | 28.11 |
| 0.06 | 0.06 ± 0.03 | 55.43 | 0.03 ± 0.07 | 207.87 | 0.08 ± 0.04 | 53.22 |
Publisher’s Note: MDPI stays neutral with regard to jurisdictional claims in published maps and institutional affiliations. |
© 2021 by the authors. Licensee MDPI, Basel, Switzerland. This article is an open access article distributed under the terms and conditions of the Creative Commons Attribution (CC BY) license (http://creativecommons.org/licenses/by/4.0/).
Share and Cite
Yoon, J.; Jang, W.S.; Nam, J.; Mihn, D.-C.; Lim, C.S. An Automated Microscopic Malaria Parasite Detection System Using Digital Image Analysis. Diagnostics 2021, 11, 527. https://doi.org/10.3390/diagnostics11030527
Yoon J, Jang WS, Nam J, Mihn D-C, Lim CS. An Automated Microscopic Malaria Parasite Detection System Using Digital Image Analysis. Diagnostics. 2021; 11(3):527. https://doi.org/10.3390/diagnostics11030527
Chicago/Turabian StyleYoon, Jung, Woong Sik Jang, Jeonghun Nam, Do-CiC Mihn, and Chae Seung Lim. 2021. "An Automated Microscopic Malaria Parasite Detection System Using Digital Image Analysis" Diagnostics 11, no. 3: 527. https://doi.org/10.3390/diagnostics11030527
APA StyleYoon, J., Jang, W. S., Nam, J., Mihn, D.-C., & Lim, C. S. (2021). An Automated Microscopic Malaria Parasite Detection System Using Digital Image Analysis. Diagnostics, 11(3), 527. https://doi.org/10.3390/diagnostics11030527