Abstract
We aimed to investigate the effect of weight status on inflammation-related markers and thyroid function tests in overweight and obese pediatric patients. Children and adolescents diagnosed between January 2017 and January 2019 with overweight or obesity were included in the study. Neutrophil-to-lymphocyte ratio (NLR), platelet-to lymphocyte ratio (PLR) and systemic immune-inflammation index (SII) were calculated for the groups defined according to Body Mass Index (BMI)-for-age z-score: overweight (≥1 BMI-for-age z-score), obese (≥2 BMI-for-age z-score) and severely obese (≥3 BMI-for-age z-score). Severely obese patients had significantly higher value of white blood cells (WBC) counts (median = 7.92) compared with overweight patients (7.37, p = 0.014). Absolute lymphocyte count was significantly associated with obesity degree in children (Spearman’s Rho coefficient ρ = 0.228. p = 0.035), whereas absolute polymorphonuclear neutrophils (PMNCs) count was significantly higher in severely obese adolescents than overweight adolescents (overweight: 4.04 vs. severely obese: 5.3 (p = 0.029)). In 8.19% of patients an elevated thyroid-stimulating hormone (TSH) level was found, and 3.36% of patients had a low level of free thyroxine with an elevated level of TSH. Total absolute WBC count may be a reliable inflammation-related marker in obese pediatric patients without metabolic syndrome, but needs to be validated in the context of all possible covariates. Subclinical and overt hypothyroidism may develop from an early age in overweight or obese patients.
1. Introduction
Obesity is associated with increased mortality in adulthood [1] and the risk of cardiometabolic multimorbidity (defined as the presence of at least two out of type 2 diabetes, coronary heart disease, and stroke) rises from twice in overweight to 15 times in severely obese individuals (WHO class II and III obesity, where WHO = World Health Organization) [2]. Consensus upon definition of cardiometabolic risk (CMR) in children has not been reached [3,4,5], but adiposity, lipid profile, glycaemia, insulin level and blood pressure are common elements of the CMR cluster across studies and higher degrees of obesity are associated to an increase in metabolic risk [6,7]. Longitudinal studies showed that obesity in childhood—defined as BMI-for-age (where BMI = body mass index) and sex above the 95th percentile (International Obesity Task Force (IOTF) references)—increases the CMR in adulthood [8], mainly via inflammation and oxidative stress [9].
In the American pediatric population, based on CDC (Centers for Disease Control and Prevention) thresholds, a new definition for obesity has been recently proposed: class I obesity (≥95th percentile to <120% of the 95th percentile), class II obesity (≥120% to <140% of the 95th percentile or BMI ≥ 35), and class III obesity (≥140% of the 95th percentile or BMI ≥ 40). Following these criteria, the prevalence of severe obesity in American children (≥120% of the 95th percentile) has increased between 1999–2014 from 4% to 6.3% [10].
World Health Organization (WHO) growth charts from 2007 state a threshold of ≥ +1 BMI-for-age z-score for overweight, ≥ +2 BMI-for-age z-score for obese and ≥ +3 BMI-for-age z-score relative to the median for severe obesity [11]. Cole et al. proposed cutoffs for overweight and obesity using country-specific centile curves corresponding to BMI at the age of 18 (IOTF BMI cutoff values) [12].
According to the WHO European Childhood Obesity Surveillance Initiative (COSI), which included data from 21 European countries, 1 in 4 obese children are severely obese based on WHO and IOTF criteria. During the first three COSI rounds of data collection (2007–2013), the prevalence of severe obesity among 4274 school-aged Romanian children was 2.2% [13].
Systemic subclinical inflammation plays a central role in the onset of obesity-driven comorbidities in children and adults [14,15,16]. Novel biomarkers for subclinical inflammation in obesity are tested as cardiovascular risk assessment tools [17,18]. The neutrophil-to-lymphocyte ratio (NLR) and platelet-to lymphocyte ratio (PLR) derived from complete blood cell counts are associated with changes in BMI status in adults [19] and children [20,21]. Neutrophil-to-lymphocyte ratio is emerging as a biomarker for subclinical atherosclerosis in adults and is associated with visceral adiposity excess and pro-inflammatory cytokines release [22]. An increased NLR was found in adults with a high risk of type 2 diabetes (i.e., low insulin sensitivity) [23]. No differences in the NLR were observed in patients with differentiated thyroid cancer and those with benign thyroid nodules [24], but higher values were associated with tumor size, invasion and metastasis [25]. Neutrophil-to-lymphocyte ratio showed elevated values among patients with Hashimoto’s thyroiditis [26,27], but the results regarding the associations with anti-thyroglobulin (TG) antibodies or anti-thyroid peroxidase (TPO) antibodies, thyroid-stimulating hormone (TSH), and free thyroxine (fT4) are still conflicting [26,28,29].
The mechanism of inflammation in obesity implies early recruitment of neutrophils followed by infiltration of macrophages [30], this latter step requiring lymphocyte (mainly CD8+ subtype) activation [16]. Accordingly, peripheral neutrophils and lymphocytes counts increase with BMI [31]. Thus, NLR may be a more sensitive indicator of inflammation than differential cell counts, and several studies confirmed that NLR is more increased in obese youth than in normal-weight patients [20,21]. A significant trend of increasing NLR with progressive BMI group in the pediatric population was reported (from a mean value of 1.44 (±1.96 × SD: 1.38–1.49) in normal-weight children to a mean value of 1.74 (±1.96 × SD: 1.64–1.83) in obese children) [32].
Although platelets’ role is primarily associated with hemostasis and thrombosis, these non-nucleated cells have a wide range of functions involving inflammation, immune responses and host defense against pathogens [33,34]. Release of pro-inflammatory chemokines and cytokines from platelet alpha (α) granules and platelet interaction with leukocytes triggers adaptive immune response via dendritic cell maturation and natural killer cells followed by monocyte/macrophage activation, which further affect B and T cell responses [35,36]. Among complex relationships between activated platelets with leukocytes, circulating platelet-neutrophil complexes may be necessary for neutrophil recruitment in inflammatory processes [37]. On the other hand, lymphocytes influence platelet aggregation and secretion [38].
Systemic immune-inflammation index (SII)—defined as a product of peripheral platelet and neutrophil counts divided to lymphocyte counts—and PLR—defined as peripheral platelets and absolute lymphocyte count ratio—were positively associated with BMI in children with morbid obesity (> WHO 99th percentile), and young patients (mean age of 33 ± 7 years) with BMI ≥ 45 kg/m2, respectively [39,40].
The above evidence legitimates the use of PLR, NLR and SII as inflammatory markers of subclinical obesity-induced inflammation. Age-specific reference values for these ratios have been proposed [41,42].
Subclinical hypothyroidism (SHT) (or isolated hyper-thyrotropinemia)—defined as a mild elevation of serum TSH concentration and a normal peripheral thyroid hormones concentration—has a prevalence of 1.7% in the pediatric population [43] and is more common in obese pediatric patients than in normal-weight patients (24.3% vs. 12.8%, p = 0.002) [44]. Thyroidal and non-thyroidal diseases may induce SHT, among which the most common are Hashimoto’s disease and isolated non-autoimmune hyper-thyrotropinemia, the latter being more prevalent in obese children [45,46]. In adults, NLR is more increased in patients with malignancy than in patients with benign thyroid nodules and is associated with a higher degree of thyroid function loss [47,48].
The objectives of the present study were:
- (i)
- to investigate the effect of weight status defined according to WHO criteria on measures of laboratory tests performed in pediatric patients (as routine evaluation according to the national guideline);
- (ii)
- to evaluate the effect of weight status on inflammation-related markers in pediatric patients; and
- (iii)
- to explore the relationships between the inflammation-related markers and thyroid profile in the overweight or obese pediatric patients.
2. Materials and Methods
A cross-sectional study design with retrospective data collection was conducted between January 2017 and January 2019 in two medical services from Cluj-Napoca, namely the Children’s Emergency Hospital and the Ambulatory Unit of Infectious Disease Hospital. Medical records of children aged from 2 to 18 years old diagnosed with overweight or obesity (ICD diagnosis code—E 66.0 or E 66.9) were retrieved for data collection.
We excluded patients with missing data regarding the anthropometric measures, neutrophils or lymphocyte counts. We also excluded patients with syndromic obesity, those who did not meet the WHO criteria for overweight and obesity, data from the second visit of the same patient and patients with acute or chronic known inflammatory diseases (i.e., juvenile arthritis, thyroiditis with hypo- or hyperthyroidism) and infectious disease (acute upper or lower respiratory tract diseases, urinary infections or gastroenteritis, etc.). Patients with leukocytosis, human C-reactive protein serum concentration (CRP) ≥10 mg/dL, positive pharyngeal exudate, positive urine test, or positive stool culture were also excluded.
Height and weight were measured once by stadiometer and mechanical beam scale to ± 0.1 cm and ± 0.1 kg, respectively, after a minimum 8-h fasting period. We collected data for the following characteristics: anthropometric measures (weight and height), inflammation-related markers such as total absolute white-blood cells count (WBC), absolute polymorphonuclear neutrophils count (PMNCs), lymphocytes, absolute peripheral platelets counts, human C-reactive protein (hCRP), liver enzymes: alanine aminotransferase (ALT), aspartate aminotransferase (AST), alkaline phosphatase, gamma-glutamyl transferase (GGT), uric acid, fasting blood glucose and lipid panel (triglycerides, high-density lipoprotein-cholesterol (HDL-c), measures of thyroid function (thyroid-stimulating hormone level (TSH), free thyroxine level (fT4), anti-thyroid peroxidase antibody level (anti-TPO)), fasting blood insulin and morning cortisol levels.
The ancillary laboratory blood tests evaluated in the study are part of the routine evaluation for obesity-related comorbidities in obese children in the Romanian Ministry of Health guideline from 2011 [49].
Blood parameters measurements were performed according to standard guidelines for each technique. Differentiated blood cell count was performed via cytometry, impedance, and colorimetry. Biochemical parameters were measured via spectrophotometry, and hormonal measurements were performed on chemiluminescence. NLR was calculated as a ratio between absolute PMNCs and lymphocyte counts. SII was calculated based on PMNCs, absolute lymphocytes (L) and peripheral platelets (P) counts as PMNCs×L/P. PLR was calculated as the ratio between peripheral platelets (P) and absolute lymphocyte counts.
Blood samples were evaluated in the clinical laboratories of each center. As the normal ranges of blood parameters were slightly different between the two laboratories, each value was interpreted as “normal”, “high”, “low”, “lower border”, or “upper border”. For the “border” categories, we included data with values within ± 0.5 units caliper. The results, expressed as dichotomous variables (i.e., above or under the threshold) were analyzed accordingly, as categorical variables.
WHO guidelines (WHO Child Growth Standards for children aged 0–60 months and the WHO Reference 2007 for the older children and adolescents) were used for defining weight status: overweight, obesity, and severe obesity. AnthroPLus application v1.0.4 was used to compute the z-scores for BMI-for-age. We grouped patients as overweight (≥1 BMI-for-age z-score), obese (≥2 BMI-for-age—z-score), or severely obese (≥3 BMI-for-age z-score), respectively. Age was expressed in months both for analysis and BMI-for-age z-score computation.
The age classes were defined according to the MESH term in MEDLINE for Pediatric obesity: childhood—between 2 years (24 months) and 11 years and 11 months (143 months)—and adolescence—between 12 years (144 months) and 17 years and 11 months (215 months).
Median values of cell subtypes’ absolute counts were graphically represented according to the following age groups: 2–<6 years, 6–<10 years, 10–<13 years, 13–<15 years, 15–<18 years. These groups follow worldwide hematology reference ranges in pediatrics [50,51] and had been previously reported in studies on Romanian children [52].
Statistical Analysis
Statistical analysis was performed using Statistica program (Version 13.5, StatSoft, OK, USA). Qualitative nominal variables were reported as absolute and relative frequencies (expressed as %).
Quantitative variables with deviations from Gaussian distribution were presented as median with interquartile interval (IQR: 25–75 percentile) and range values (minimum to maximum values). The arithmetic mean and standard deviation (SD) were used as descriptive measures for quantitative variables that followed Gaussian distribution. The Kolmogorov-Smirnov test was used to investigate if distributions of studied variables followed the Normal Probability Law.
Spearman’s rank correlation coefficient (ρ) was used to evaluate the monotonic correlations between quantitative variables while Pearson’s correlation coefficient (r) was used to assess linear correlations. Chi-Squared or Fisher’s Exact tests were used to test the bivariate associations between qualitative variables.
For identifying significant differences in distributions of biochemical, hormonal, and inflammation-related characteristics between two independent samples, we used Student t-test for independent samples or Mann-Whitney U Test, while for three independent samples, one-way ANOVA or Kruskal-Wallis test were used. In the case of significant differences for multiple groups, we performed the post-hoc analysis with Tukey-HSD test or Dunn’s test.
All statistical tests used in data analysis were two-sided tests, a significant result being achieved if p-value < 0.05.
Graphical representations were designed in R statistical software (version 4.03., R Foundation for Statistical Computing, Vienna, Austria).
3. Results
3.1. Description of the Children and Adolescents Sample
One hundred and seventy-six patients aged from 2 to 18 years were eligible for the study. Thirty-four children were excluded due to missing data regarding neutrophil and lymphocyte counts, a sample size of 142 being included in the analysis. Differences in BMI-for-age z-score and laboratory measurements (as routine evaluation in obese children) of all the patients included in the study according to weight status, gender, and age are summarized in Table 1. There were significant differences in the means of BMI z-scores between children and adolescents (Student t-test, p = 0.008), with higher mean values of BMI z-scores in children (2.82 ± 1.00 versus 2.33 ± 0.83). The significant differences in BMI z-scores were also related to gender (Student t-test, p = 0.045) with higher mean values in boys (2.79 ± 1.03 versus 2.47 ± 0.80).

Table 1.
BMI-for-age z-score, biochemical and hormonal measurements by weight status, gender and age.
Glycemic levels were physiological in all patients (minimum to maximum value: 66 mg/dL–104 mg/dL) and only four patients (3.65%) had both increased ALT and AST levels, with a maximum value of 138 UI/L and 75 UI/L, respectively.
As far as lipid profile is concerned, hypertriglyceridemia was found in 15 (10.56%) patients, among whom 14 had low or low-border HDL-cholesterol levels. A total of 76 patients (53.52%) had low-border levels of HDL-cholesterol (range values: 36–59 mg/dL) and 17 (11.97%) had low HDL-cholesterol levels (below 36 mg/dL). High uric acid levels were found in 17 (26.56%) patients. No cortisol secretion impairment was present in our patients and hyperinsulinemia was found in only seven (4.9%) patients.
Post-hoc analysis showed that HDL-cholesterol mean values were significantly higher in overweight as compared to obese (Tukey’s HSD test, p = 0.025) and severely obese (Tukey’s HSD test, p = 0.007) children. In addition, there was a negative significant monotonic relationship between HDL-cholesterol and age in the whole sample (Spearman’s Rho coefficient, ρ = −0.28, p = 0.003).
3.2. Distribution of Inflammation-Related Markers Values and Measures of Thyroid Function Amongst Overweight and Obese Children and Adolescents
Differences of inflammation-related marker values (hCRP, total WBC and subtypes (lymphocytes and PMNCs) absolute counts, peripheral platelet count, along with NLR, PLR and SII)) and measures of thyroid function according to weight status, age, and gender groups, are presented in Table 2.
Table 2.
Inflammation-related markers and thyroid function measures by weight status, age and gender.
There was a significant difference in distributions of absolute lymphocyte counts and WBC counts between weight groups (Kruskal-Wallis, p = 0.040 for lymphocyte and p = 0.022 for WBC). Post-hoc analysis showed that severely obese patients had significantly higher value of WBC counts compared with overweight patients (Dunn’s test, adjusted p = 0.014). When stratified by age group, a significant relationship between WBC counts and weight status was found in adolescents (Kruskal-Wallis, p = 0.027) and children (Kruskal-Wallis, p = 0.024).
When we explored the association between WBC and BMI-for-age z-scores stratified by age groups (Figure 1), we found a significant positive correlation in children (Spearman’s Rho coefficient ρ = 0.293, p = 0.006), while for adolescents a positive correlation was found with a tendency toward significance (Spearman’s Rho coefficient ρ = 0.23, p = 0.081).
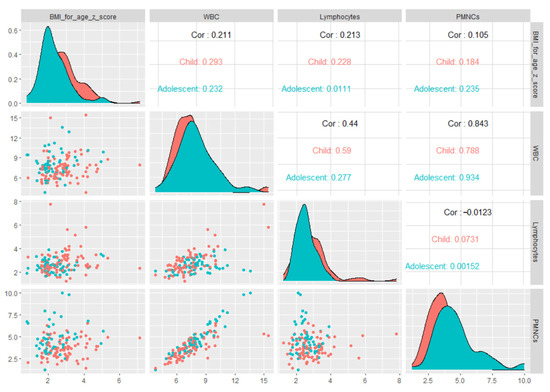
Figure 1.
Matrix of scatter plots of correlations between BMI-for-age z-scores and inflammation-related markers stratified by age groups.
The post-test analysis performed to identify differences in WBC subtype counts highlighted that severely obese patients had significantly higher values of absolute lymphocyte count than overweight patients (severely: 2.70 (IQR: 2.23–2.89) vs. overweight: 2.47 (IQR: 2.16–2.81), Dunn’s test, adjusted p = 0.022). When stratified by age group, the relationship between peripheral white cell subtypes counts and weight status had a tendency toward statistical signification for children (Kruskal-Wallis, p = 0.056) and it was not significant for adolescents (Kruskal-Wallis, p = 0.849). When stratified by age groups, it was only in children that absolute lymphocyte count was significantly correlated to BMI-for-age z-score (Spearman’s Rho coefficient ρ = 0.228, p = 0.035). We found no significant difference in distributions of PMNC values and peripheral platelet count between the three weight groups (p > 0.05; see Table 2). In adolescents, absolute PMNC count distributions were significantly different between overweight and severely obese patients (overweight: 4.04 (IQR: 3.33–4.71) vs. severely: 5.3 (IQR: 4.68–5.6), Dunn’s test, adjusted, p = 0.029) while for the children subgroup we did not find a significant difference in absolute PMNC count distribution by weight status (Kruskal-Wallis, p = 0.258).
The white blood cell (WBC, lymphocytes, PMNCS) values stratified by different age groups are also described in Figure 2.
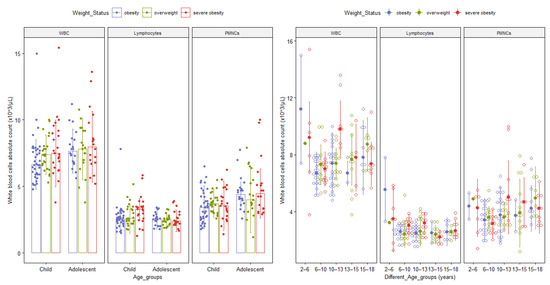
Figure 2.
Bar and Dot plots with median and interquartile range of differential white cell subgroups by age group and obesity class. The upper bound of each age group is not included in the range. Abbreviations: WBC = total absolute white blood cells count; PMNCs = absolute polymorphonuclear neutrophils absolute counts.
We found no significant differences in mean values of NLR, SII and PLR between the three weight groups (one-way ANOVA, p > 0.05; Table 2). When we performed the stratified analysis by age groups, NLR, SII and PLR mean values were not significantly different between the three weight subgroups, neither for children, nor for adolescents (Kruskal-Wallis test, p > 0.05). In addition, when we explored the association between these biomarkers and BMI-for-age z-scores, we found no significant correlation between NLR and SII with BMI-for-age z-score (Spearman’s Rho coefficient, ρ = −0.06, p = 0.45), whereas PLR was significantly correlated with BMI-for-age z-score (Spearman’s Rho coefficient, ρ = −0.17, p = 0.03). In the whole sample, the NLR and SII values increased with age (Spearman’s Rho coefficient, ρ = 0.34, p < 0.0001, and ρ = 0.24, p = 0.003, respectively) with significantly different NLR mean values among adolescents as compared to children (Student-t test, p < 0.001).
No significant differences in mean values of NLR, PLR and SII were observed between boys and girls (Student-t test, p > 0.05; Table 2).
We found no significant differences in mean values of fT4 by weight status neither in children (one-way ANOVA, p = 0.452, mean ± SD for overweight = 0.99 ± 0.16, mean ± SD for obese = 0.96 ± 0.18, mean ±SD for severe obese = 1.02 ± 0.21), nor in adolescents (one-way ANOVA, p = 0.221, mean ± SD for overweight = 0.96 ± 0.19, mean ± SD for obese = 0.90 ± 0.12, mean ± SD for severe obese = 0.99 ± 0.09). We found a low positive correlation between fT4 level and BMI-for-age z-score (Pearson’s correlation coefficient, r = 0.18, p = 0.046). No significant correlation with age was found (Spearman’s Rho coefficient ρ = −0.12, p = 0.192). A tendency toward statistical significance was noticed for difference in TSH mean values by weight status in children (one-way ANOVA, p = 0.074, mean ± SD for overweight = 2.58 ± 1.27, mean ± SD for obese = 3.80 ± 2.17, mean ± SD for severe obese = 3.09 ± 1.39), but not for adolescents (one-way ANOVA, p = 0.774, mean ± SD for overweight = 2.87 ± 1.38, mean ± SD for obese = 2.673 ± 1.40, mean ± SD for severe obese = 2.50 ± 1.51).
When we interpreted anti-TPO, TSH and fT4 blood levels according to laboratory normal reference limits (as “normal”, “low”, “high” and “upper limit”), we found no significant association with weight status (Fisher’s-Exact test, p > 0.05). In 10 (8.19%) patients an elevated TSH as a unique change was found and only four (3.36%) patients had a low level of fT4 and an elevated level of TSH. Positive thyroid antibodies were found in three patients.
3.3. Correlations between Inflammation-Related Markers and Thyroid Function Measures
We found a significant positive correlation between absolute peripheral platelets count and fT4 value when the whole sample was evaluated (Spearman’s Rho coefficient, ρ = 0.29, p = 0.001; Table 3). A positive correlation between absolute WBC count and fT4 level with a tendency to statistical significance was also found, whereas when the correlation between WBC subtypes and fT4 was considered, we found a significant positive correlation with absolute lymphocyte count with a tendency to significance (Table 3).
Table 3.
Spearman correlation matrix between inflammation-related markers and thyroid function measures.
4. Discussion
No considerable differences in NLR, SII and PLR with different weight status were found in our study. The main cell subtype counts that changed were lymphocyte and polymorphonuclear neutrophils. The absolute white blood cells count varied in close relation to different age groups according to weight status. In addition, absolute WBC and PMNC counts showed higher values with advancing age group in overweight pediatric patients (see Figure 1). Considering that the severely obese subgroup consisted mainly of children and that peripheral lymphocyte count—significantly higher than in the overweight subgroup (as shown in Table 2)—increased in an age-independent manner, we might assume that their increase occurs earlier in severe obesity than in obesity and overweight subgroup. Our results are partially consistent with those previously reported on an American pediatric population [53].
Contrarily, the polymorphonuclear neutrophils count changes later in life in both severely obese pediatric patients and patients with a lower degree of obesity (see Table 2). Similar variations of differential white blood cell count in normal-weight healthy pediatric patients have been acknowledged in other studies and reference values have already been proposed (i.e., in early childhood polymorphonuclear neutrophils count is the lowest and lymphocyte count is the highest and they change in an opposite direction with time) [54,55,56,57].
Macrophages M2 are the most abundant innate immune cells activated in obesity [58], but recent studies showed that neutrophil activation also mediates subclinical inflammation in obesity mainly via elastase and myeloperoxidase secretion [59,60]. In both children and adults, neutrophil count was associated with obesity degree, even in the absence of metabolic syndrome [61,62].
We found a significant positive monotonic relation of WBC counts with BMI-for-age z-score in children and a positive correlation with a tendency toward significance in adolescents. Similar trends in WBC count elevation with age have been reported in healthy European adolescents with a higher increase rate in overweight adolescents [54]. Our findings on differences in WBC count between weight groups agree with reported results of higher WBC count levels in obese than overweight or overweight than normal weight pediatric patients [21,63]. WBC count in obese adults and adolescents was shown to be closely related to leptin concentration, a hormone secreted by adipose cells: leptin serum concentration is associated to WBC counts [64,65,66]. In vivo experiments on murine models revealed that myeloid proliferation is enhanced by high leptin concentration in obesity [67,68].
Our results regarding differential peripheral white blood cell counts indicate an age-independent degree of dynamic relation with obesity that may be further investigated in prospective studies including pediatric patients. The accessibility of complete blood count in pediatrics and the need for markers for evaluating the risk of obesity-driven complications is an incentive to search for new methods which may serve this scope. White blood cell count may provide support for the clinical use of markers in childhood obesity.
Early age onset of overweight is associated with a higher risk of morbidity of coronary heart disease than late-onset overweight [69] and childhood obesity is associated with a higher prevalence of cardiovascular risk factors during adulthood [70]. More than half of our patients had low-border level or low HDL-cholesterol level—a known cardiovascular risk factor in adults and a component of metabolic syndrome in children [71] —leading to a significant difference between weight groups (Table 1). Subclinical inflammation is the linking mechanism of obesity with metabolic syndrome and elevated WBC count is a biomarker of inflammation in obese adults [72,73] and pediatric patients [74,75] with metabolic syndrome. However, inconsistent results were reported regarding association of NLR with the severity of metabolic syndrome and risk of type 2 diabetes mellitus in adults [73,76,77]. Fasting glycaemia and fasting insulinemia in obese children were not significantly associated with the degree of obesity or the risk of progression to type 2 diabetes [78,79,80]. In this sense, performing OGTT (oral glucose tolerance test) or proinsulin levels and proinsulin/insulin ratio were more significant for the assessment of metabolic impairment [78,79,80].
One possible cause for children with severe obesity included in our study having slightly lower values of fasting glucose compared to those with overweight/moderate obesity (Table 1) could be an imbalance between insulin resistance and insulin sensitivity, with fasting hyperinsulinemia and episodes of reactive, functional hypoglycemia. In addition, evidence has also shown that some obese children have episodes of nocturnal hypoglycemia, while others have episodes of hyperglycemia without any obvious cause, more likely to be associated with altered secretion of other hormones/polypeptides involved in glycemic control [81,82].
Regarding the measures of thyroid function, we found no significant relation with inflammation-related markers (see Table 3). However, we observed significant correlations between fT4 level and absolute WBC and peripheral platelet counts (Table 3). Interpretation of changes in fT4 level should carefully consider the possibility of inter-assay interferences known to affect TSH, fT4 and fT3 levels when measured on immunoassay platforms [83]. To avoid misinterpretation, only concordant changes were taken into consideration (i.e., low/lower normal limit TSH level with normal/high fT4 level—overt or subclinical hypothyroidism) in our analysis. Another common pitfall is the overlooking the adaptive changes during inflammatory moderate to severe acute or chronic illness—the “non-thyroidal illness” [84]. In 8.19% of patients, we found changes suggestive of subclinical hypothyroidism and 3.36% patients had changes of overt hypothyroidism. Similarly, a higher prevalence of elevated TSH level than positive antibody dysfunction was reported in the literature [46]. A possible explanation may be the obesity related TSH elevation in the former and primary thyroid disease in the latter [46,85]. The TSH serum levels in overweight and obese children and adolescents showed a significant reduction with the decrease of BMI (from 5.4 ± 1.4 to 4.9 ± 1.5 mU/L, p < 0.0001) without significant changes in serum level of fT4 (p = 0.210) and a tendency to a significant increase in NLR (p = 0.08) [86]. In obesity, subclinical inflammation leads to tissue resistance to TSH followed by a high blood level of this hormone. This mechanism can be explained by the role of inflammatory cytokines upon the iodide uptake activity of thyroid cells [87,88], leptin inhibition of TSH-induced function [89] or induced thyroid autoimmunity via T-regulatory cell function [90,91].
The present results with respect to thyroid dysfunction in relation to the subclinical inflammation in childhood obesity provide support for prospective studies that may elucidate whether it plays a causative or consequential role.
Study Limitations and Further Studies
As our subgroups were not comparable for age, we adjusted the analysis by performing stratified analysis. However, some limitations of our study should be acknowledged. The main limitation is related to the design of the experiment. The retrospective collection of data does not assure that all eligible patients are evaluated since missing data in medical records cannot be prevented. The absence of normal controls is another drawback of our study that emerged from the retrospective collection of data. Inclusion of children in medical studies is still challenging and, in the absence of electronic health records to capture medical visits for routine check-ups and access to healthy controls, their inclusion in our study was not possible. In the prospective study currently conducted by our team with a focus on new inflammatory markers in childhood obesity we overcome this problem by including a control group in the analysis. Furthermore, a retrospective collection of data does not allow to control for covariates that could be related to observed changes in the reported blood measurements. Cigarette smoking status (passive or active), ethnicity, low-birth weight, medication use within 24 h, and organic pollutants may considerably influence the results of this analysis [92,93,94]. The control of covariates could be achieved by epidemiological longitudinal populational studies. Puberty status also may be important as it is known that normal ranges of WBC increase until puberty and decrease in post-pubertal patients [54]. All the above-mentioned limitations could be eliminated in a prospective longitudinal study. The inclusion of eligible participants from two different healthcare units is also a limitation of our study. To withdraw this limitation, we reported some quantitative measurements as qualitative data according to each laboratory reference for -age and -gender. The limited number of investigated patients along with the absence of a control group limit the generalizability of the reported results.
The WBC, as a routine laboratory measurement, could be used as an inflammation related marker in paediatric obesity that could be useful in identification of changes prior to the onset of metabolic syndrome. Identification of the cut-off point will bring the evidence into clinical daily practice but the determination of the cut-off values must be done in populational studies with an appropriate inclusion of participants in terms of stages of obesity, stratified by age (children vs. adolescents) and gender, in the presence of healthy controls.
Nonetheless, a real advantage of studying blood cell parameters in children is that potential comorbidities that may influence them may be more easily ruled out than in adults (i.e., neoplasms, diabetes, and cardiovascular disease). Therefore, the identification of a marker-based on routine blood cell parameters able to characterize the obesity status in children and adolescents is of interest.
5. Conclusions
Total absolute white-blood cells count (WBC) proved to be a reliable inflammation-related marker in pediatric obesity prior to the onset of metabolic syndrome, but this result needs to be validated in the context of all possible covariates. The changes in absolute lymphocyte and polymorphonuclear neutrophils counts with age may influence absolute WBC count’s role in reflecting subclinical inflammation.
Laboratory changes suggestive of subclinical and overt hypothyroidism indicate an obesity-driven thyroid dysfunction, possibly inflammation-mediated.
Author Contributions
Conceptualization, I.Ț., N.R., and S.D.B.; methodology, I.Ț., C.L., and V.C.; validation, N.R., M.I. and S.D.B.; formal analysis, I.Ț. and M.I.; investigation, I.Ț., N.R., C.L., and V.C.; writing—original draft preparation, I.Ț. and M.I.; writing—review and editing, S.D.B.; visualization, I.Ț. and M.I.; supervision, S.D.B.; funding acquisition, I.Ț. All authors have read and agreed to the published version of the manuscript.
Funding
This research was partially funded by the Doctoral School of the Iuliu Hațieganu University of Medicine and Pharmacy, Cluj-Napoca, Romania, grant number PCD 1680/27/19.01.2018.
Institutional Review Board Statement
Ethical approval was obtained from the “Iuliu Hațieganu” University of Medicine and Pharmacy Ethics Committee (approval no. 179/30.05.2019) and from the Ethics Committee of the Children’s Emergency Hospital Cluj-Napoca (approval no. 71/20.06.2019). The study was conducted according to the guidelines of the Declaration of Helsinki.
Informed Consent Statement
Patient consent was waived because the data were collected retrospectively, the study is observational and imply no risk to participants and the study is not possible to be conducted without the waiver.
Data Availability Statement
The raw data presented in this study are part of a PhD study can be obtained upon reasonable request addressed to Ioana Țaranu (taranu.ioana@umfcluj.ro).
Conflicts of Interest
The authors declare no conflict of interest.
References
- De Gonzalez, A.B.; Hartge, P.; Cerhan, J.R.; Flint, A.J.; Hannan, L.; MacInnis, R.J.; Moore, S.C.; Tobias, G.S.; Anton-Culver, H.; Freeman, L.B.; et al. Body-Mass Index and Mortality among 1.46 Million White Adults. N. Engl. J. Med. 2010, 363, 2211–2219. [Google Scholar] [CrossRef]
- Kivimäki, M.; Kuosma, E.; Ferrie, J.E.; Luukkonen, R.; Nyberg, S.T.; Alfredsson, L.; Batty, G.D.; Brunner, E.J.; Fransson, E.; Goldberg, M.; et al. Overweight, obesity, and risk of cardiometabolic multimorbidity: Pooled analysis of individual-level data for 120 813 adults from 16 cohort studies from the USA and Europe. Lancet Public Health 2017, 2, e277–e285. [Google Scholar] [CrossRef]
- Sovio, U.; Skow, Á.; Falconer, C.; Park, M.H.; Viner, R.M.; Kinra, S. Improving Prediction Algorithms for Cardiometabolic Risk in Children and Adolescents. J. Obes. 2013, 2013, 1–6. [Google Scholar] [CrossRef]
- Eisenmann, J.C. On the use of a continuous metabolic syndrome score in pediatric research. Cardiovasc. Diabetol. 2008, 7, 17. [Google Scholar] [CrossRef] [PubMed]
- Kamel, M.; Smith, B.T.; Wahi, G.; Carsley, S.; Birken, C.S.; Anderson, L.N. Continuous cardiometabolic risk score definitions in early childhood: A scoping review. Obes. Rev. 2018, 19, 1688–1699. [Google Scholar] [CrossRef]
- Zabarsky, G.; Beek, C.; Hagman, E.; Pierpont, B.; Caprio, S.; Weiss, R. Impact of Severe Obesity on Cardiovascular Risk Factors in Youth. J. Pediatr. 2018, 192, 105–114. [Google Scholar] [CrossRef] [PubMed]
- Kit, B.K.; Kuklina, E.; Carroll, M.D.; Ostchega, Y.; Freedman, D.S.; Ogden, C.L. Prevalence of and Trends in Dyslipidemia and Blood Pressure Among US Children and Adolescents, 1999–2012. JAMA Pediatr. 2015, 169, 272–279. [Google Scholar] [CrossRef] [PubMed]
- Reilly, J.J.; Kelly, J.J. Long-term impact of overweight and obesity in childhood and adolescence on morbidity and premature mortality in adulthood: Systematic review. Int. J. Obes. 2010, 35, 891–898. [Google Scholar] [CrossRef]
- Freedman, D.S.; Mei, Z.; Srinivasan, S.R.; Berenson, G.S.; Dietz, W.H. Cardiovascular Risk Factors and Excess Adiposity Among Overweight Children and Adolescents: The Bogalusa Heart Study. J. Pediatr. 2007, 150, 12–17.e2. [Google Scholar] [CrossRef] [PubMed]
- Skinner, A.C.; Perrin, E.M.; Skelton, J.A. Prevalence of obesity and severe obesity in US children, 1999–2014. Obesity 2016, 24, 1116–1123. [Google Scholar] [CrossRef]
- De Onis, M.; Onyango, A.W.; Borghi, E.; Siyam, A.; Nishida, C.; Siekmann, J. Development of a WHO growth reference for school-aged children and adolescents. Bull. World Health Organ. 2007, 85, 660–667. [Google Scholar] [CrossRef] [PubMed]
- Cole, T.J.; Lobstein, T. Extended international (IOTF) body mass index cut-offs for thinness, overweight and obesity. Pediatr. Obes. 2012, 7, 284–294. [Google Scholar] [CrossRef] [PubMed]
- Spinelli, A.; Buoncristiano, M.; Kovacs, V.A.; Yngve, A.; Spiroski, I.; Obreja, G.; Starc, G.; Pérez, N.; Rito, A.I.; Kunešová, M.; et al. Prevalence of Severe Obesity among Primary School Children in 21 European Countries. Obes. Facts 2019, 12, 244–258. [Google Scholar] [CrossRef]
- Chatzigeorgiou, A.; Karalis, K.P.; Bornstein, S.R.; Chavakis, T. Lymphocytes in obesity-related adipose tissue inflammation. Diabetologia 2012, 55, 2583–2592. [Google Scholar] [CrossRef]
- Güngör, N.K. Overweight and Obesity in Children and Adolescents. J. Clin. Res. Pediatr. Endocrinol. 2014, 6, 129–143. [Google Scholar] [CrossRef]
- Nishimura, S.; Manabe, I.; Nagasaki, M.; Eto, K.; Yamashita, H.; Ohsugi, M.; Otsu, M.; Hara, K.; Ueki, K.; Sugiura, S.; et al. CD8+ effector T cells contribute to macrophage recruitment and adipose tissue inflammation in obesity. Nat. Med. 2009, 15, 914–920. [Google Scholar] [CrossRef] [PubMed]
- DeBoer, M.D. Obesity, systemic inflammation, and increased risk for cardiovascular disease and diabetes among adolescents: A need for screening tools to target interventions. Nutrition 2013, 29, 379–386. [Google Scholar] [CrossRef]
- Bonacina, F.; Moregola, A.; Porte, R.; Baragetti, A.; Bonavita, E.; Salatin, A.; Grigore, L.; Pellegatta, F.; Molgora, M.; Sironi, M.; et al. Pentraxin 3 deficiency protects from the metabolic inflammation associated to diet-induced obesity. Cardiovasc. Res. 2019, 115, 1861–1872. [Google Scholar] [CrossRef]
- Furuncuoğlu, Y.; Tulgar, S.; Dogan, A.N.; Cakar, S.; Tulgar, Y.K.; Cakiroglu, B. How obesity affects the neutrophil/lymphocyte and platelet/lymphocyte ratio, systemic immune-inflammatory index and platelet indices: A retrospective study. Eur. Rev. Med. Pharmacol. Sci. 2016, 20, 1300–1306. [Google Scholar] [PubMed]
- Aydın, M.; Aydin, M.; Yilmaz, A.; Donma, M.M.; Tulubas, F.; Demirkol, M.; Erdogan, M.; Gurel, A. Neutrophil lymphocyte ratio in obese adolescents. North. Clin. Istanb. 2015, 2, 87–91. [Google Scholar] [CrossRef] [PubMed][Green Version]
- Mărginean, C.O.; Meliţ, L.E.; Ghiga, D.V.; Mărginean, M.O. Early Inflammatory Status Related to Pediatric Obesity. Front. Pediatr. 2019, 7, 241. [Google Scholar] [CrossRef] [PubMed]
- Suárez-Cuenca, J.A.; Ruíz-Hernández, A.S.; Mendoza-Castañeda, A.A.; Domínguez-Pérez, G.A.; Hernández-Patricio, A.; Vera-Gómez, E.; De La Peña-Sosa, G.; Banderas-Lares, D.Z.; Montoya-Ramírez, J.; Blas-Azotla, R.; et al. Neutrophil-to-lymphocyte ratio and its relation with pro-inflammatory mediators, visceral adiposity and carotid intima-media thickness in population with obesity. Eur. J. Clin. Investig. 2019, 49, e13085. [Google Scholar] [CrossRef]
- Lee, C.-T.C.; Harris, S.B.; Retnakaran, R.; Gerstein, H.C.; Perkins, B.A.; Zinman, B.; Hanley, A.J. White blood cell subtypes, insulin resistance and β-cell dysfunction in high-risk individuals—The PROMISE cohort. Clin. Endocrinol. 2014, 81, 536–541. [Google Scholar] [CrossRef]
- Liu, J.-F.; Ba, L.; Lv, H.; Lv, D.; Du, H.L.D.L.J.-T.; Jing, X.-M.; Yang, N.-J.; Wang, S.-X.; Li, C.; Li, X.-X. Association between neutrophil-to-lymphocyte ratio and differentiated thyroid cancer: A meta-analysis. Sci. Rep. 2016, 6, 38551. [Google Scholar] [CrossRef]
- Feng, J.; Wang, Y.; Shan, G.; Gao, L. Clinical and prognostic value of neutrophil-lymphocyte ratio for patients with thyroid cancer: A meta-analysis. Medicine 2020, 99, e19686. [Google Scholar] [CrossRef]
- Onalan, E.; Aslan, M. Could neutrophil to lymphocyte ratio be a marker in Hashimotos thyroiditis? J. Pak. Med. Assoc. 2020, 70, 1381–1383. [Google Scholar] [CrossRef] [PubMed]
- Aktas, G.; Sit, M.; Dikbas, O.; Erkol, H.; Altinordu, R.; Erkus, E.; Savli, H. Elevated neutrophil-to-lymphocyte ratio in the diagnosis of Hashimoto’s thyroiditis. Rev. Assoc. Méd. Bras. 2017, 63, 1065–1068. [Google Scholar] [CrossRef] [PubMed]
- Arpacı, D.; Gürol, G.; Ergenc, H.; Yazar, H.; Tocoglu, A.; Çiftci, I.; Tamer, A. A Controversial New Approach to Address Hematological Parameters in Hashimoto’s Thyroiditis. Clin. Lab. 2016, 62, 1225–1231. [Google Scholar] [CrossRef] [PubMed]
- Bilge, M.; Yesilova, A.; Adas, M.; Helvaci, A. Neutrophil- and Platelet- to Lymphocyte Ratio in Patients with Euthyroid Hashimoto’s Thyroiditis. Exp. Clin. Endocrinol. Diabetes 2018, 127, 545–549. [Google Scholar] [CrossRef] [PubMed]
- Lolmède, K.; Duffaut, C.; Zakaroff-Girard, A.; Bouloumié, A. Immune cells in adipose tissue: Key players in metabolic disorders. Diabetes Metab. 2011, 37, 283–290. [Google Scholar] [CrossRef]
- Dixon, J.B.; Brien, P.E.O. Obesity and the White Blood Cell Count: Changes with Sustained Weight Loss. Obes. Surg. 2006, 16, 251–257. [Google Scholar] [CrossRef] [PubMed]
- Azab, B.; Camacho-Rivera, M.; Taioli, E. Average Values and Racial Differences of Neutrophil Lymphocyte Ratio among a Nationally Representative Sample of United States Subjects. PLoS ONE 2014, 9, e112361. [Google Scholar] [CrossRef] [PubMed]
- Sut, C.; Tariket, S.; Aubron, C.; Aloui, C.; Hamzeh-Cognasse, H.; Berthelot, P.; Laradi, S.; Greinacher, A.; Garraud, O.; Cognasse, F. The Non-Hemostatic Aspects of Transfused Platelets. Front. Med. 2018, 5, 42. [Google Scholar] [CrossRef]
- Kim, S.-J.; Davis, R.P.; Jenne, C.N. Platelets as Modulators of Inflammation. Semin. Thromb. Hemost. 2017, 44, 091–101. [Google Scholar] [CrossRef] [PubMed]
- Katz, I.R.; Hoffmann, M.K.; Zucker, M.B.; Bell, M.K.; Thorbecke, G.J. A platelet-derived immunoregulatory serum factor with T cell affinity. J. Immunol. 1985, 134, 3199–3203. [Google Scholar]
- Cognasse, F.; Laradi, S.; Berthelot, P.; Bourlet, T.; Marotte, H.; Mismetti, P.; Garraud, O.; Hamzeh-Cognasse, H. Platelet Inflammatory Response to Stress. Front. Immunol. 2019, 10, 1478. [Google Scholar] [CrossRef] [PubMed]
- Page, C.; Pitchford, S. Neutrophil and platelet complexes and their relevance to neutrophil recruitment and activation. Int. Immunopharmacol. 2013, 17, 1176–1184. [Google Scholar] [CrossRef]
- Li, N. Platelet-lymphocyte cross-talk. J. Leukoc. Biol. 2008, 83, 1069–1078. [Google Scholar] [CrossRef]
- Donma, M.M.; Donma, O. Evaluation of Systemic Immune-Inflammation Index in Obese Children. Int. J. Med. Health Sci. 2018, 12, 362–365. [Google Scholar] [CrossRef]
- Erdal, E.; Inanir, M. Platelet-to-lymphocyte ratio (PLR) and Plateletcrit (PCT) in young patients with morbid obesity. Rev. Assoc. Méd. Bras. 2019, 65, 1182–1187. [Google Scholar] [CrossRef]
- Fest, J.; Ruiter, R.; Ikram, M.A.; Voortman, T.; Van Eijck, C.H.J.; Stricker, B.H. Reference values for white blood-cell-based inflammatory markers in the Rotterdam Study: A population-based prospective cohort study. Sci. Rep. 2018, 8, 1–7. [Google Scholar] [CrossRef]
- Forget, P.; Khalifa, C.; Defour, J.-P.; Latinne, D.; Van Pel, M.-C.; De Kock, M. What is the normal value of the neutrophil-to-lymphocyte ratio? BMC Res. Notes 2017, 10, 1–4. [Google Scholar] [CrossRef]
- Wu, T.; Flowers, J.W.; Tudiver, F.; Wilson, J.L.; Punyasavatsut, N. Subclinical thyroid disorders and cognitive performance among adolescents in the United States. BMC Pediatr. 2006, 6, 12. [Google Scholar] [CrossRef] [PubMed]
- Jin, H.Y. Prevalence of subclinical hypothyroidism in obese children or adolescents and association between thyroid hormone and the components of metabolic syndrome. J. Paediatr. Child. Health 2018, 54, 975–980. [Google Scholar] [CrossRef] [PubMed]
- Lee, Y.J.; Jung, S.Y.; Jung, H.W.; Kim, S.Y.; Lee, Y.A.; Lee, S.Y.; Shin, C.H.; Yang, S.W. Unfavorable Course of Subclinical Hypothyroidism in Children with Hashimoto’s Thyroiditis Compared to Those with Isolated Non-Autoimmune Hyperthyrotropinemia. J. Korean Med. Sci. 2017, 32, 124–129. [Google Scholar] [CrossRef]
- Bhowmick, S.K.; Dasari, G.; Levens, K.L.; Rettig, K.R. The prevalence of elevated serum thyroid-stimulating hormone in childhood/adolescent obesity and of autoimmune thyroid diseases in a subgroup. J. Natl. Med. Assoc. 2007, 99, 773–776. [Google Scholar]
- Önalan, E.; Dönder, E. Neutrophil and platelet to lymphocyte ratio in patients with hypothyroid Hashimoto’s thyroiditis. Acta BioMed. Atenei Parm. 2020, 91, 310–314. [Google Scholar] [CrossRef]
- Kocer, D.; Karakukcu, C.; Karaman, H.; Gokay, F.; Bayram, F. May the Neutrophil/Lymphocyte Ratio Be a Predictor in the Differentiation of Different Thyroid Disorders? Asian Pac. J. Cancer Prev. 2015, 16, 3875–3879. [Google Scholar] [CrossRef] [PubMed]
- Dumitru, M.; Nanu, M. Protocol de Diagnostic şi Tratament în Obezitatea la Copil; Oscar Print: Bucharest, Romania, 2011; pp. 1–24. Available online: https://insmc.ro/uploads/files/Protocol_de_diagnostic_in_obezitate.pdf (accessed on 4 November 2020). (In Romanian)
- Kliegman, R.M.; St. Geme, J. Nelson Textbook of Pediatrics, 21st ed.; Elsevier: Philadelphia, PA, USA, 2019; pp. e67–e11t. [Google Scholar]
- York Teaching Hospital. Laboratory Medicine: Haematology. 2020. Available online: https://www.yorkhospitals.nhs.uk/our-services/a-z-of-services/laboratory-medicine1/haematology-/ (accessed on 10 November 2020).
- Chirita-Emandi, A.; Barbu, C.G.; Cinteza, E.E.; Chesaru, B.I.; Gafencu, M.; Mocanu, V.; Pascanu, I.M.; Tatar, S.A.; Balgradean, M.; Dobre, M.; et al. Overweight and Underweight Prevalence Trends in Children from Romania—Pooled Analysis of Cross-Sectional Studies between 2006 and 2015. Obes. Facts 2016, 9, 206–220. [Google Scholar] [CrossRef] [PubMed]
- Skinner, A.C.; Steiner, M.J.; Henderson, F.W.; Perrin, E.M. Multiple Markers of Inflammation and Weight Status: Cross-sectional Analyses Throughout Childhood. Pediatrics 2010, 125, e801–e809. [Google Scholar] [CrossRef]
- Pérez-De-Heredia, F.; HELENA Study Group; Gómez-Martínez, S.; Díaz, L.-E.; Veses, A.M.; Nova, E.; Wärnberg, J.; Huybrechts, I.; Vyncke, K.; Androutsos, O.; et al. Influence of sex, age, pubertal maturation and body mass index on circulating white blood cell counts in healthy European adolescents—The HELENA study. Eur. J. Nucl. Med. Mol. Imaging 2015, 174, 999–1014. [Google Scholar] [CrossRef]
- Nah, E.-H.; Kim, S.; Cho, S.; Cho, H.-I. Complete Blood Count Reference Intervals and Patterns of Changes Across Pediatric, Adult, and Geriatric Ages in Korea. Ann. Lab. Med. 2018, 38, 503–511. [Google Scholar] [CrossRef]
- Cheng, C.K.-W.; Chan, J.; Cembrowski, G.S.; Van Assendelft, O.W. Complete Blood Count Reference Interval Diagrams Derived from NHANES III: Stratification by Age, Sex, and Race. Lab. Hematol. 2004, 10, 42–53. [Google Scholar] [CrossRef]
- Timová, S.; Leonardi, G.S.; Hrubá, F.; Lochman, I.; Lochmanová, A.; Erdei, E.; Jazwiec-Kanyion, B.; Niciu, E.M.; Steerenberg, P.A.; Van Loveren, H. Immune system parameters in children of Central and Eastern Europe: The CESAR study. Cent. Eur. J. Public Health 2004, 12, 119–125. [Google Scholar] [PubMed]
- McLaughlin, T.; Ackerman, S.E.; Shen, L.; Engleman, E. Role of innate and adaptive immunity in obesity-associated metabolic disease. J. Clin. Investig. 2017, 127, 5–13. [Google Scholar] [CrossRef] [PubMed]
- Rensen, S.S.; Slaats, Y.; Nijhuis, J.; Jans, A.; Bieghs, V.; Driessen, A.; Malle, E.; Greve, J.W.; Buurman, W.A. Increased Hepatic Myeloperoxidase Activity in Obese Subjects with Nonalcoholic Steatohepatitis. Am. J. Pathol. 2009, 175, 1473–1482. [Google Scholar] [CrossRef] [PubMed]
- Talukdar, S.; Bandyopadhyay, G.; Li, D.; Xu, J.; McNelis, J.; Lu, M.; Li, P.; Yan, Q.; Zhu, Y.; Ofrecio, J.; et al. Neutrophils mediate insulin resistance in mice fed a high-fat diet through secreted elastase. Nat. Med. 2012, 18, 1407–1412. [Google Scholar] [CrossRef]
- Nascimento, H.; Rocha, S.; Rêgo, C.; Mansilha, H.F.; Quintanilha, A.; Santos-Silva, A.; Belo, L. Leukocyte Count versus C-Reactive Protein Levels in Obese Portuguese Patients Aged 6-12 Years Old. Open Biochem. J. 2010, 4, 72–76. [Google Scholar] [CrossRef][Green Version]
- Sait, S.; Alqassas, M.; Othman, S.; Shihon, S.B.; Alqalayta, L.; Alqusair, S. Obesity Correlates with Neutrophilia. Hematol. Transfus. Int. J. 2016, 3, 1–4. [Google Scholar] [CrossRef]
- Zaldivar, F.; McMurray, R.G.; Nemet, D.; Galassetti, P.R.; Mills, P.J.; Cooper, D.M. Body fat and circulating leukocytes in children. Int. J. Obes. 2006, 30, 906–911. [Google Scholar] [CrossRef]
- Veronelli, A.; Laneri, M.; Ranieri, R.; Koprivec, D.; Vardaro, D.; Paganelli, M.; Folli, F.; Pontiroli, A.E. White blood cells in obesity and diabetes: Effects of weight loss and normalization of glucose metabolism. Diabetes Care 2004, 27, 2501–2502. [Google Scholar] [CrossRef] [PubMed]
- Zarrati, M.; Aboutaleb, N.; Cheshmazar, E.; Shoormasti, R.S.; Razmpoosh, E.; Nasirinezhad, F. The association of obesity and serum leptin levels with complete blood count and some serum biochemical parameters in Iranian overweight and obese in-dividuals. Med. J. Islam. Repub. Iran 2019, 33, 72. [Google Scholar] [CrossRef] [PubMed]
- Hirose, H.; Saito, I.; Kawai, T.; Nakamura, K.; Maruyama, H.; Saruta, T. Serum leptin level: Possible association with haematopoiesis in adolescents, independent of body mass index and serum insulin. Clin. Sci. 1998, 94, 633–636. [Google Scholar] [CrossRef] [PubMed]
- Carmo, L.S.D.; Rogero, M.M.; Paredes-Gamero, E.J.; Nogueira-Pedro, A.; Xavier, J.G.; Cortez, M.; Borges, M.C.; Fujii, T.M.; Borelli, P.; Fock, R.A. A high-fat diet increases interleukin-3 and granulocyte colony-stimulating factor production by bone marrow cells and triggers bone marrow hyperplasia and neutrophilia in wistar rats. Exp. Biol. Med. 2013, 238, 375–384. [Google Scholar] [CrossRef]
- Laharrague, P.; Oppert, J.-M.; Brousset, P.; Charlet, J.-P.; Campfield, A.; Fontanilles, A.-M.; Guy-Grand, B.; Corberand, J.X.; Penicaud, L.; Casteilla, L. High concentration of leptin stimulates myeloid differentiation from human bone marrow CD34+ progenitors: Potential involvement in leukocytosis of obese subjects. Int. J. Obes. 2000, 24, 1212–1216. [Google Scholar] [CrossRef]
- Must, A.; Jacques, P.F.; Dallal, G.E.; Bajema, C.J.; Dietz, W.H. Long-Term Morbidity and Mortality of Overweight Adolescents: A follow-up of the Harvard Growth Study of 1922 to 1935. N. Engl. J. Med. 1992, 327, 1350–1355. [Google Scholar] [CrossRef]
- Skinner, A.C.; Perrin, E.M.; Moss, L.A.; Skelton, J.A. Cardiometabolic Risks and Severity of Obesity in Children and Young Adults. N. Engl. J. Med. 2015, 373, 1307–1317. [Google Scholar] [CrossRef]
- Ahrens, W.; Iacoviello, L.; Lissner, L.; Veidebaum, T.; Pohlabeln, H.; Pigeot, I.; Moreno, L.A.; Marild, S.; Molnar, D.; Siani, A.; et al. Metabolic syndrome in young children: Definitions and results of the IDEFICS study. Int. J. Obes. 2014, 38, S4–S14. [Google Scholar] [CrossRef]
- Tsai, J.C.-R.; Sheu, S.-H.; Chiu, H.-C.; Chung, F.-M.; Chang, D.-M.; Chen, M.-P.; Shin, S.-J.; Lee, Y.-J. Association of peripheral total and differential leukocyte counts with metabolic syndrome and risk of ischemic cardiovascular diseases in patients with type 2 diabetes mellitus. Diabetes Metabol. Res. Rev. 2007, 23, 111–118. [Google Scholar] [CrossRef]
- Bahadir, A.; Baltaci, D.; Turker, Y.; Iliev, D.; Ozturk, S.; Deler, M.H.; Sariguzel, Y.C. Is the neutrophil-to-lymphocyte ratio indicative of inflammatory state in patients with obesity and metabolic syndrome? Anatol. J. Cardiol. 2015, 15, 816–822. [Google Scholar] [CrossRef]
- De Ferranti, S.D.; Gauvreau, K.; Ludwig, D.S.; Newburger, J.W.; Rifai, N. Inflammation and Changes in Metabolic Syndrome Abnormalities in US Adolescents: Findings from the 1988–1994 and 1999–2000 National Health and Nutrition Examination Surveys. Clin. Chem. 2006, 52, 1325–1330. [Google Scholar] [CrossRef]
- Kelishadi, R.; Hashemipour, M.; Ashtijou, P.; Mirmoghtadaee, P.; Poursafa, P.; Khavarian, N.; Ghatrehsamani, S. Association of cell blood counts and cardiometabolic risk factors among young obese children. Saudi Med. J. 2010, 31, 406–412. [Google Scholar] [PubMed]
- Yilmaz, H.; Ucan, B.; Sayki, M.; Unsal, I.; Sahin, M.; Ozbek, M.; Delibasi, T. Usefulness of the neutrophil-to-lymphocyte ratio to prediction of type 2 diabetes mellitus in morbid obesity. Diabetes Metab. Syndr. Clin. Res. Rev. 2015, 9, 299–304. [Google Scholar] [CrossRef] [PubMed]
- Buyukkaya, E.; Karakaş, M.F.; Karakaş, E.; Akçay, A.B.; Tanboga, I.H.; Kurt, M.; Sen, N. Correlation of Neutrophil to Lymphocyte Ratio With the Presence and Severity of Metabolic Syndrome. Clin. Appl. Thromb. 2014, 20, 159–163. [Google Scholar] [CrossRef] [PubMed]
- Holst-Schumacher, I.; Nuñez-Rivas, H.; Monge-Rojas, R.; Barrantes-Santamaría, M. Insulin Resistance and Impaired Glucose Tolerance in Overweight and Obese Costa Rican Schoolchildren. Food Nutr. Bull. 2008, 29, 123–131. [Google Scholar] [CrossRef]
- Sinha, R.; Fisch, G.; Teague, B.; Tamborlane, W.V.; Banyas, B.; Allen, K.; Savoye, M.; Rieger, V.; Taksali, S.; Barbetta, G.; et al. Prevalence of Impaired Glucose Tolerance among Children and Adolescents with Marked Obesity. N. Engl. J. Med. 2002, 346, 802–810. [Google Scholar] [CrossRef]
- Von Berghes, C.; Brabant, G.; Biebermann, H.; Krude, H.; Wiegand, S. Proinsulin and the proinsulin/insulin ratio in overweight and obese children and adolescents: Relation to clinical parameters, insulin resistance, and impaired glucose regulation. Pediatr. Diabetes 2011, 12, 242–249. [Google Scholar] [CrossRef] [PubMed]
- Zou, C.-C.; Liang, L.; Hong, F.; Zhao, Z.-Y. Glucose metabolism disorder in obese children assessed by continuous glucose monitoring system. World J. Pediatr. 2008, 4, 26–30. [Google Scholar] [CrossRef]
- Odeleye, O.E.; De Courten, M.; Pettitt, D.J.; Ravussin, E. Fasting Hyperinsulinemia Is a Predictor of Increased Body Weight Gain and Obesity in Pima Indian Children. Diabetes 1997, 46, 1341–1345. [Google Scholar] [CrossRef]
- Favresse, J.; Burlacu, M.-C.; Maiter, D.; Gruson, D. Interferences with Thyroid Function Immunoassays: Clinical Implications and Detection Algorithm. Endocr. Rev. 2018, 39, 830–850. [Google Scholar] [CrossRef]
- Koulouri, O.; Moran, C.; Halsall, D.; Chatterjee, K.; Gurnell, M. Pitfalls in the measurement and interpretation of thyroid function tests. Best Pract. Res. Clin. Endocrinol. Metab. 2013, 27, 745–762. [Google Scholar] [CrossRef] [PubMed]
- Răcătăianu, N.; Leach, N.V.; Bolboacă, S.D.; Soran, M.L.; Opriş, O.; Dronca, E.; Valea, A.; Ghervan, C. Interplay between metabolic and thyroid parameters in obese pubertal children. Does visceral adipose tissue make the first move? Acta Clin. Belg. 2021, 76, 40–48. [Google Scholar] [CrossRef]
- Licenziati, M.R.; Valerio, G.; Vetrani, I.; De Maria, G.; Liotta, F.; Radetti, G. Altered Thyroid Function and Structure in Children and Adolescents Who Are Overweight and Obese: Reversal After Weight Loss. J. Clin. Endocrinol. Metab. 2019, 104, 2757–2765. [Google Scholar] [CrossRef]
- Longhi, S.; Radetti, G. Thyroid Function and Obesity. J. Clin. Res. Pediatr. Endocrinol. 2012, 4, 40–44. [Google Scholar] [CrossRef]
- Ajjan, A.; Watson, P.F.; Findlay, C.; Metcalfe, R.A.; Crisp, M.; Ludgate, M.; Weetman, A.P. The sodium iodide symporter gene and its regulation by cytokines found in autoimmunity. J. Endocrinol. 1998, 158, 351–358. [Google Scholar] [CrossRef] [PubMed]
- Isozaki, O.; Tsushima, T.; Nozoe, Y.; Miyakawa, M.; Takano, K. Leptin regulation of the thyroids: Negative regulation on thyroid hormone levels in euthyroid subjects and inhibitory effects on iodide uptake and Na+/I- symporter mRNA expression in rat FRTL-5 cells. Endocr. J. 2004, 51, 415–423. [Google Scholar] [CrossRef] [PubMed][Green Version]
- Amouzegar, A.; Kazemian, E.; Abdi, H.; Gharibzadeh, S.; Tohidi, M.; Azizi, F. Abdominal Obesity Phenotypes and Incidence of Thyroid Autoimmunity: A 9-Year Follow-up. Endocr. Res. 2020, 45, 202–209. [Google Scholar] [CrossRef]
- Procaccini, C.; Carbone, F.; Galgani, M.; La Rocca, C.; De Rosa, V.; Cassano, S.; Matarese, G. Obesity and susceptibility to autoimmune diseases. Expert Rev. Clin. Immunol. 2011, 7, 287–294. [Google Scholar] [CrossRef]
- Sattar, N.; McConnachie, A.; O’Reilly, D.; Upton, M.N.; Greer, I.A.; Smith, G.D.; Watt, G. Inverse Association Between Birth Weight and C-Reactive Protein Concentrations in the MIDSPAN Family Study. Arter. Thromb. Vasc. Biol. 2004, 24, 583–587. [Google Scholar] [CrossRef] [PubMed]
- Trevisanuto, D.; Doglioni, N.; Altinier, S.; Zaninotto, M.; Plebani, M.; Zanardo, V. High-Sensitivity C-Reactive Protein in Umbilical Cord of Small-for-Gestational-Age Neonates. Neonatology 2006, 91, 186–189. [Google Scholar] [CrossRef]
- Oulhote, Y.; Shamim, Z.; Kielsen, K.; Weihe, P.; Grandjean, P.; Ryder, L.; Heilmann, C. Children’s white blood cell counts in relation to developmental exposures to methylmercury and persistent organic pollutants. Reprod. Toxicol. 2017, 68, 207–214. [Google Scholar] [CrossRef] [PubMed]
Publisher’s Note: MDPI stays neutral with regard to jurisdictional claims in published maps and institutional affiliations. |
© 2021 by the authors. Licensee MDPI, Basel, Switzerland. This article is an open access article distributed under the terms and conditions of the Creative Commons Attribution (CC BY) license (http://creativecommons.org/licenses/by/4.0/).