
An Algorithm for Individual Dosage in Cadmium–Zinc–Telluride SPECT-Gated Radionuclide Angiography


Abstract
:1. Introduction
2. Materials and Methods
2.1. Population
2.2. Image Acquisition and Processing
2.3. Optimum Target Count Rate Identification and Equation Selection
2.4. Subgroup Analyses
2.5. Statistical Analyses
3. Results
3.1. Population
3.2. Test of Patient Tailored Algorithm
3.3. Subgroup Analyses
4. Discussion
5. Conclusions
Author Contributions
Funding
Institutional Review Board Statement
Informed Consent Statement
Data Availability Statement
Conflicts of Interest
References
- Carver, J.R.; Shapiro, C.L.; Ng, A.; Jacobs, L.; Schwartz, C.; Virgo, K.S.; Hagerty, K.L.; Somerfield, M.R.; Vaughn, D.J. American society of clinical oncology clinical evidence review on the ongoing care of adult cancer survivors: Cardiac and pulmonary late effects. J. Clin. Oncol. 2007, 25, 3991–4008. [Google Scholar] [CrossRef] [Green Version]
- Curigliano, G.; Cardinale, D.; Suter, T.; Plataniotis, G.; De Azambuja, E.; Sandri, M.T.; Criscitiello, C.; Goldhirsch, A.; Cipolla, C.; Roila, F. Cardiovascular toxicity induced by chemotherapy, targeted agents and radiotherapy: ESMO clinical practice guidelines. Ann. Oncol. 2012, 23 (Suppl. 7), 155–166. [Google Scholar] [CrossRef] [PubMed]
- Yeh, E.T.; Bickford, C.L. Cardiovascular complications of cancer therapy: Incidence, pathogenesis, diagnosis, and management. J. Am. Coll Cardiol. 2009, 53, 2231–2247. [Google Scholar] [CrossRef] [Green Version]
- Zamorano, J.L.; Lancellotti, P.; Rodriguez Muñoz, D.; Aboyans, V.; Asteggiano, R.; Galderisi, M.; Habib, G.; Lenihan, D.J.; Lip, G.Y.H.; Lyon, A.R.; et al. 2016 ESC Position Paper on cancer treatments and cardiovascular toxicity developed under the auspices of the ESC Committee for Practice Guidelines. Eur. Heart J. 2016, 37, 2768–2801. [Google Scholar] [CrossRef] [PubMed]
- Plana, J.C.; Galderisi, M.; Barac, A.; Ewer, M.S.; Ky, B.; Scherrer-Crosbie, M.; Ganame, J.; Sebag, I.A.; Agler, D.A.; Badano, L.; et al. Expert consensus for multimodality imaging evaluation of adult patients during and after cancer therapy: A report from the American Society of Echocardiography and the European Association of Cardiovascular Imaging. Eur. Heart J. Cardiovasc. Imaging 2014, 15, 1063–1093. [Google Scholar] [CrossRef]
- Foley, T.A.; Mankad, S.V.; Anavekar, N.S.; Bonnichsen, C.R.; Morris, M.F.; Morris, T.D.; Araoz, P. Measuring left ventricular ejection fraction-techniques and potential pitfalls. Eur. Cardiol. 2012, 8, 108–114. [Google Scholar] [CrossRef]
- Hesse, B.; Lindhardt, T.B.; Acampa, W.; Anagnostopoulos, C.; Ballinger, J.; Bax, J.J.; Edenbrandt, L.; Flotats, A.; Germano, G.; Stopar, T.G.; et al. EANM/ESC guidelines for radionuclide imaging of cardiac function. Eur. J. Nucl. Med. Mol. Imaging 2008, 35, 857. [Google Scholar] [CrossRef] [PubMed] [Green Version]
- Jensen, M.M.; Schmidt, U.; Huang, C.; Zerahn, B. Gated tomographic radionuclide angiography using cadmium-zinc-telluride detector gamma camera; Comparison to traditional gamma cameras. J. Nucl. Cardiol. 2014, 21, 384–396. [Google Scholar] [CrossRef]
- Duvall, W.L.; Guma-Demers, K.A.; George, T.; Henzlova, M.J. Radiation reduction and faster acquisition times with SPECT gated blood pool scans using a high-efficiency cardiac SPECT camera. J. Nucl. Cardiol. 2016, 23, 1128–1138. [Google Scholar] [CrossRef] [PubMed]
- Jensen, M.M.; Haase, C.; Zerahn, B. Interstudy repeatability of left and right ventricular volume estimations by serial-gated tomographic radionuclide angiographies using a cadmium-zinc-telluride detector gamma camera. Clin. Physiol. Funct. Imaging 2015, 35, 418–424. [Google Scholar] [CrossRef]
- Van Dijk, J.D.; Jager, P.L.; Ottervanger, J.P.; Slump, C.H.; de Boer, J.; Oostdijk, A.H.J.; Van Dalen, J.A. Minimizing patient-specific tracer dose in myocardial perfusion imaging using CZT SPECT. J. Nucl. Med. Technol. 2015, 43, 36–40. [Google Scholar] [CrossRef] [Green Version]
- Van Dijk, J.D.; Jager, P.L.; Mouden, M.; Slump, C.H.; Ottervanger, J.P.; de Boer, J.; Oostdijk, A.H.J.; van Dalen, J.A. Development and validation of a patient-tailored dose regime in myocardial perfusion imaging using CZT-SPECT. J. Nucl. Cardiol. 2014, 21, 1158–1167. [Google Scholar] [CrossRef] [PubMed]
- Acampa, W.; Buechel, R.R.; Gimelli, A. Low dose in nuclear cardiology: State of the art in the era of new cadmium-zinc-telluride cameras. Eur. Heart J. Cardiovasc. Imaging 2016, 17, 591–595. [Google Scholar] [CrossRef] [PubMed] [Green Version]
- Gimelli, A.; Achenbach, S.; Buechel, R.R.; Edvardsen, T.; Francone, M.; Gaemperli, O.; Hacker, M.; Hyafil, F.; Kaufmann, P.A.; Lancellotti, P.; et al. Strategies for radiation dose reduction in nuclear cardiology and cardiac computed tomography imaging: A report from the European Association of Cardiovascular Imaging (EACVI), the Cardiovascular Committee of European Association of Nuclear Medicine (EANM), and the European Society of Cardiovascular Radiology (ESCR). Eur. Heart J. 2018, 39, 286–296. [Google Scholar]
- Duvall, W.L.; Croft, L.B.; Godiwala, T.; Ginsberg, E.; George, T.; Henzlova, M.J. Reduced isotope dose with rapid SPECT MPI imaging: Initial experience with a CZT SPECT camera. J. Nucl. Cardiol. 2010, 17, 1009–1014. [Google Scholar] [CrossRef]
- van Dijk, J.D.; Jager, P.L.; Ottervanger, J.P.; de Boer, J.; Oostdijk, A.H.J.; Engbers, E.M.; Slump, C.H.; Knollema, S.; Van Dalen, J.A. Development and validation of a patient-tailored dose regime in myocardial perfusion imaging using conventional SPECT. J. Nucl. Cardiol. 2016, 23, 134–142. [Google Scholar] [CrossRef] [PubMed] [Green Version]
- Ramon, A.J.; Yang, Y.; Pretorius, P.H.; Johnson, K.L.; King, M.A.; Wernick, M.N. Personalized Models for Injected Activity Levels in SPECT Myocardial Perfusion Imaging. IEEE Trans. Med. Imaging 2019, 176, 139–148. [Google Scholar] [CrossRef]
- Glynn, R.B.; Narveson, L.G.; Hung, J.C.; Gibbons, R.J. Adjustment to radionuclide angiogram dose based upon patient’s physical parameters. J. Nucl. Med. Technol. 1994, 22, 17–20. [Google Scholar]
- Rydberg, J.; Andersen, J.; Haarmark, C.; Zerahn, B. The influence of anthropometric and basic circulatory variables on count rate in cadmium-zinc-telluride SPECT gated radionuclide angiography. J. Nucl. Cardiol. 2018, 26, 1974–1980. [Google Scholar] [CrossRef] [PubMed]
- Huang, C.; Ismail, A.; Kristensen, B.; Zerahn, B. Evaluation of individualized dosage planning when performing Cadmium-Zinc-Telluride SPECT camera gated tomographic radionuclide angiography (abstract). In Proceedings of the Annual Congress of the European Association of Nuclear Medicine, Düsseldorf, Germany, 13–17 October 2018; p. S734. [Google Scholar]
- Van Dijk, J.D. Dose-optimization in nuclear cardiac imaging, time for the next step? (editorial). J. Nucl. Cardiol. 2019, 26, 1981–1983. [Google Scholar] [CrossRef] [PubMed]
- Danish Department of Health. Referenceniveauer—Nuklearmedicinske Undersøgelser. 2016. Available online: https://www.sst.dk/-/media/Udgivelser/2016/Vejledning---Referenceniveauer-Nuklearmedicinske-Unders%C3%B8gelser.ashx?la=da&hash=F86A8F4D1841698CCC642048CCA4FF84979103D3 (accessed on 3 December 2021).
- Ostensen, H.; Ingolfsdottir, G.; Munro, L.; Diagrammes, A.L.; Conway, M.; Walters, F. Basics of Radiation Protection for Everyday Use. How to achieve ALARA: Working Tips and Guidelines. 2004. 83p. Available online: http://www.who.int/iris/handle/10665/42973#sthash.IoEW70Vr.dpuf (accessed on 3 December 2021).
- Nguyen, T.Q.; Rydberg, J.; Zerahn, B.; Kristensen, B. The effect of dose reduction on left ventricular volumes and ejection fraction assessed by cadmium-zinc-telluride SPECT gamma camera gated tomographic radionuclide angiography (abstract). Eur. J. Nucl. Med. Mol. Imaging 2016, 43, S170. [Google Scholar]
- Hansen, M.N.; Kristensen, B.; Haarmark, C.; Zerahn, B. The effect of tissue attenuation on count rate in Cadmium-Zinc-Telluride SPECT gated radionuclide angiography (abstract). In Proceedings of the Abstracts for All Posters, 63rd Nordic Congress of Radiology & 24th Nordic Congress of Radiography, Copenhagen, Denmark, 22–24 May 2019; pp. 52–53. [Google Scholar]


| Target Count Rate (cps) | 1.0 | 1.5 | 1.7 | 2.0 | 2.7 | Total |
|---|---|---|---|---|---|---|
| Equations used | 1 and 2 | 1 and 2 | 1 and 2 | 1 and 2 | 1 | |
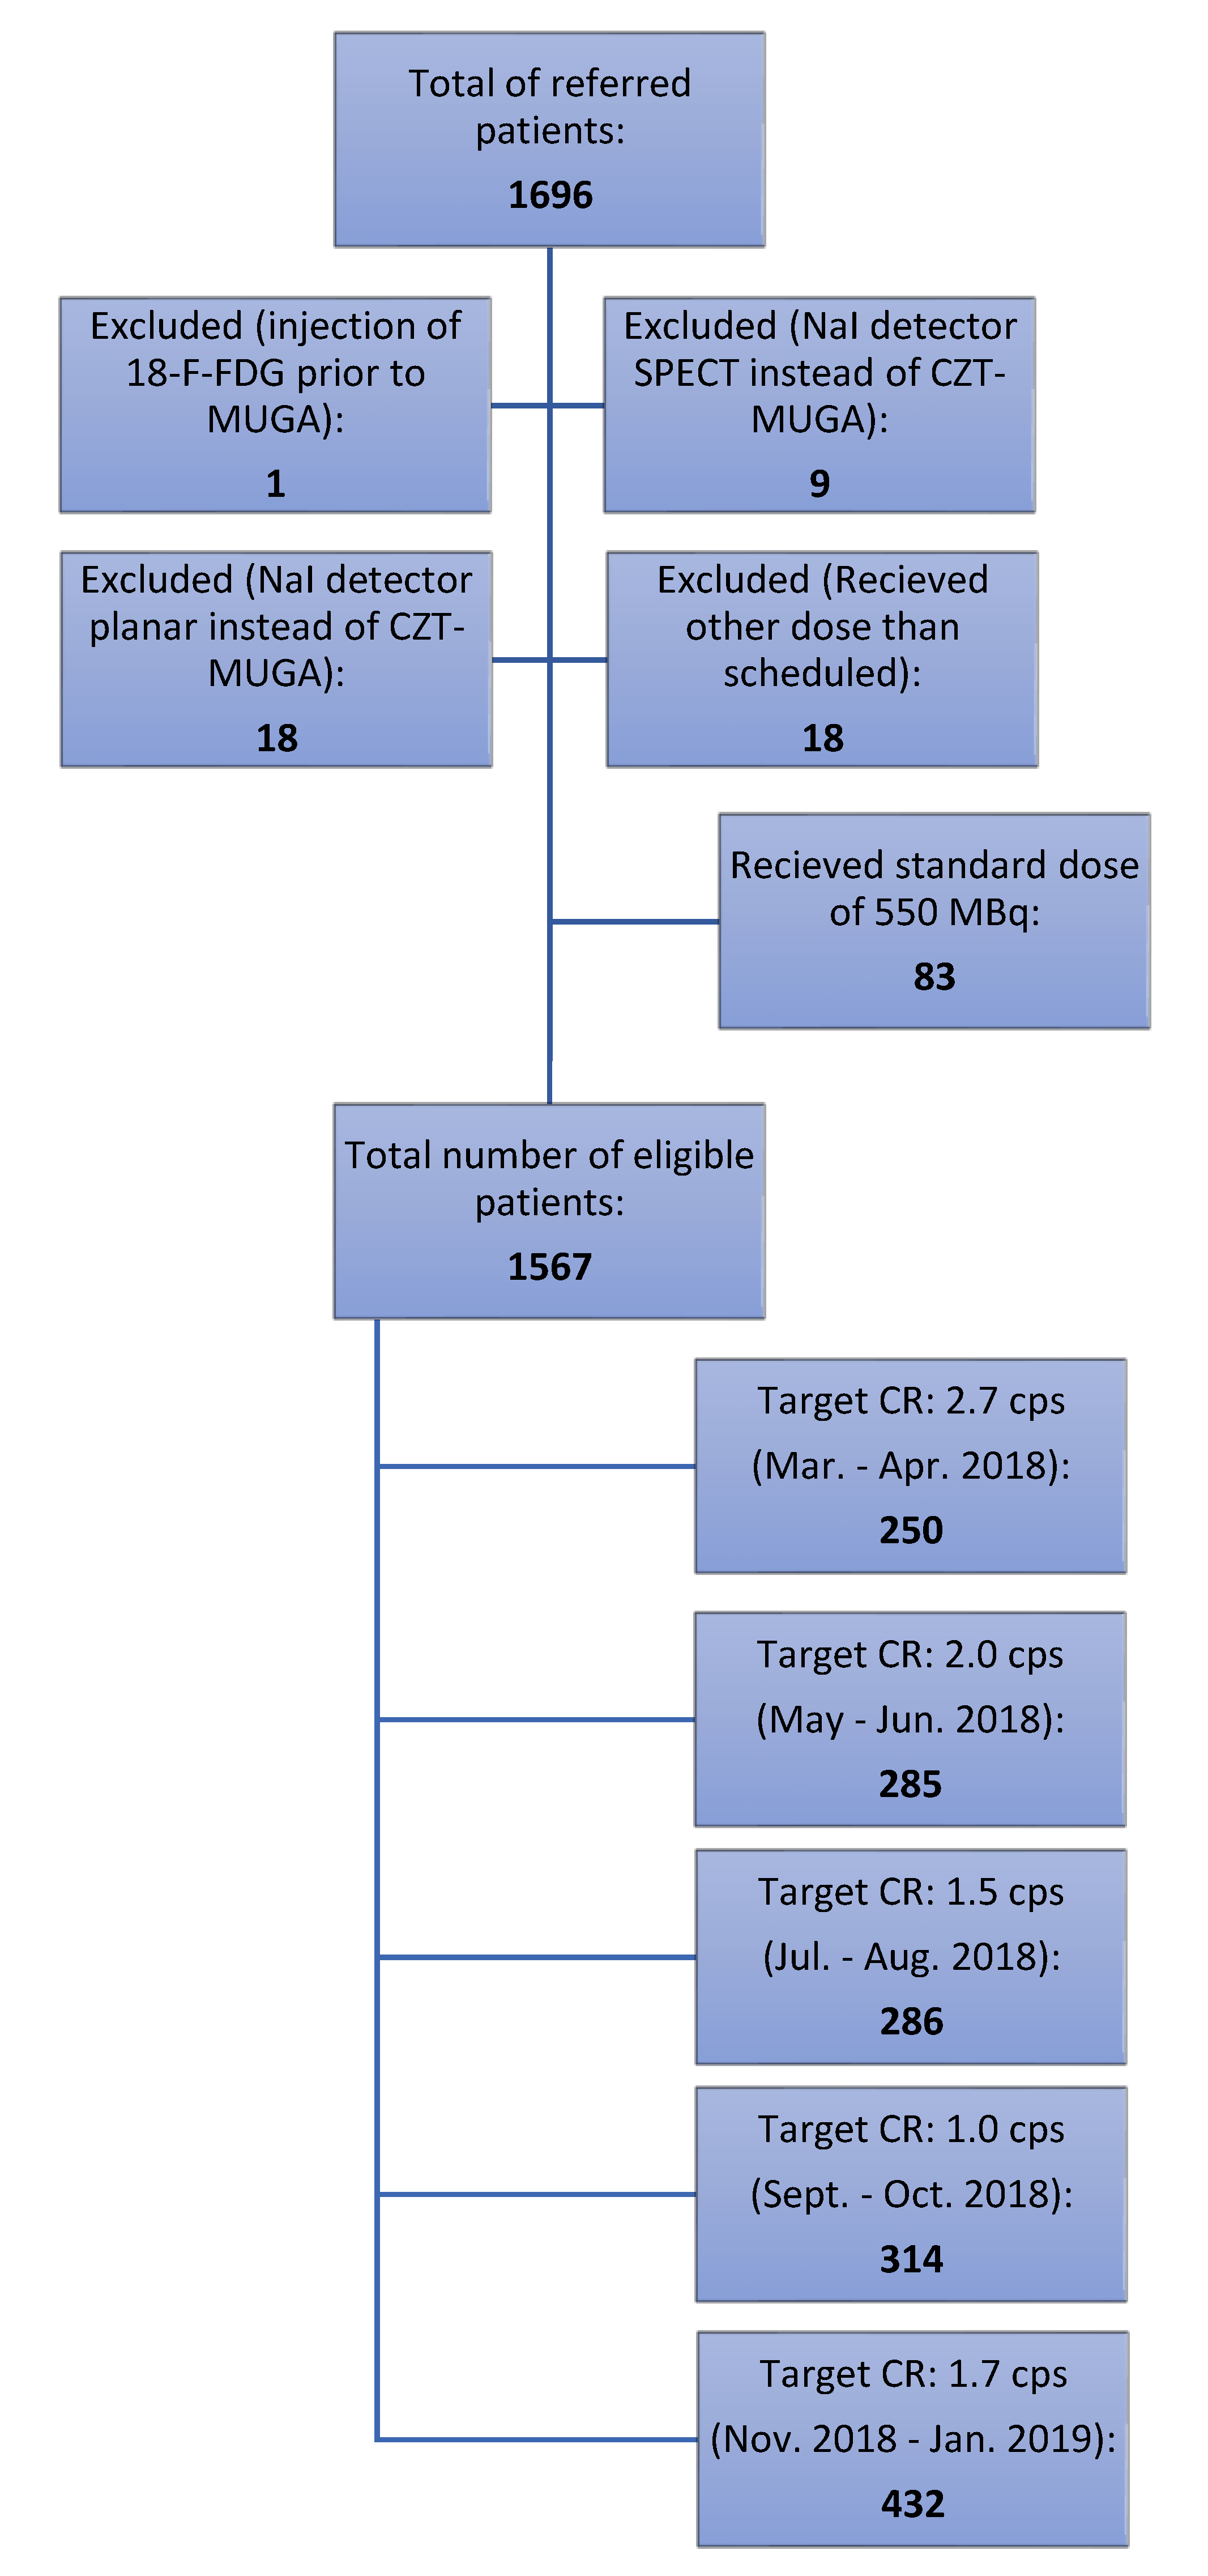
| Patients referred for ERNA | 328 | 303 | 444 | 323 | 298 | 1696 |
| Injection of FDG prior to ERNA | 0 | 0 | 0 | 0 | 1 | 1 |
| NaI SPECT | 4 | 0 | 2 | 2 | 1 | 9 |
| NaI planar | 4 | 6 | 5 | 3 | 0 | 18 * |
| Dose other than scheduled | 2 | 5 | 3 | 3 | 5 | 18 ** |
| 550 MBq due to missing data on height and weight | 4 | 6 | 2 | 30 | 41 | 83 |
| Received scheduled dose and CZT ERNA | 314 | 286 | 432 | 285 | 250 | 1567 |
| Minimum dose of 150 MBq | 0 | 15 | 0 | 1 | 19 | 35 |
| Minimum dose of 100 MBq | 36 | 0 | 0 | 0 | 0 | 36 |
| Target Count Rate Group | 1.0 | 1.5 | 1.7 | 2.0 | 2.7 | Standard Dose (550 MBq) | All | |||||||||||||||
|---|---|---|---|---|---|---|---|---|---|---|---|---|---|---|---|---|---|---|---|---|---|---|
| Time Period | Sep–Oct 2018 | Jul–Aug 2018 | Nov 2018–Jan 2019 | May–Jun 2018 | Mar–Apr 2018 | Mar 2018–Jan 2019 | Mar 2018–Jan 2019 | |||||||||||||||
| n (Female/%) * | 314 | 215 | 68.5% | 286 | 190 | 66.4% | 432 | 301 | 69.7% | 285 | 187 | 65.6% | 250 | 163 | 65.2% | 83 | 54 | 65.1% | 1650 | 1110 | 67.3% | |
| Row | Variable | Mean | SD | SEE | Mean | SD | SEE | Mean | SD | SEE | Mean | SD | SEE | Mean | SD | SEE | Mean | SD | SEE | Mean | SD | SEE |
| 1 | Age (years) * | 59.6 | 15.1 | 0.9 | 61.0 | 14.5 | 0.9 | 61.0 | 14.2 | 0.9 | 60.6 | 14.8 | 0.9 | 61.4 | 13.9 | 0.9 | 61.2 | 14.3 | 1.6 | 60.7 | 14.5 | 0.4 |
| 2 | Height (cm) * | 168.9 | 8.9 | 0.5 | 169.2 | 8.6 | 0.5 | 168.5 | 8.7 | 0.4 | 169.5 | 8.6 | 0.5 | 169.2 | 8.9 | 0.6 | 170.0 | 9.2 | 1.0 | 169.0 | 8.8 | 0.2 |
| 3 | Weight (cm) * | 74.8 | 16.0 | 0.9 | 74.7 | 16.8 | 1.0 | 73.5 | 14.9 | 0.7 | 75.7 | 16.6 | 1.0 | 75.1 | 17.2 | 1.1 | 74.3 | 14.9 | 1.6 | 74.6 | 16.1 | 0.4 |
| 4 | Heart rate (s−1) * | 73.2 | 13.5 | 0.8 | 73.3 | 14.0 | 0.8 | 73.9 | 13.1 | 0.8 | 73.4 | 13.1 | 0.8 | 72.9 | 12.4 | 0.8 | 71.9 | 12.9 | 1.4 | 73.3 | 13.4 | 0.3 |
| 5 | Systolic blood pressure (mmHg) * | 124.4 | 18.2 | 1.0 | 124.5 | 18.2 | 1.1 | 126.0 | 18.2 | 0.9 | 123.7 | 18.3 | 1.1 | 124.9 | 17.7 | 1.1 | 125.9 | 16.9 | 1.9 | 124.9 | 18.1 | 0.4 |
| 6 | Diastolic blood pressure (mmHg) * | 73.8 | 10.4 | 0.6 | 74.0 | 9.6 | 0.6 | 75.6 | 10.3 | 0.5 | 73.7 | 10.4 | 0.6 | 74.2 | 10.6 | 0.7 | 75.0 | 9.2 | 1.0 | 74.4 | 10.3 | 0.3 |
| 7 | End diastolic volume (mL) ** | 88.2 | 25.9 | 1.5 | 90.3 | 25.2 | 1.5 | 88.8 | 26.1 | 1.3 | 92.0 | 25.1 | 1.5 | 93.1 | 25.7 | 1.6 | 96.5 | 28.3 | 3.1 | 90.6 | 25.8 | 0.6 |
| 8 | End systolic volume (mL) ** | 30.9 | 17.4 | 1.0 | 32.0 | 15.9 | 0.9 | 32.5 | 16.8 | 0.8 | 34.2 | 15.5 | 0.9 | 34.9 | 17.8 | 1.1 | 33.9 | 18.9 | 2.1 | 32.8 | 16.8 | 0.4 |
| 9 | LVEF (%) ** | 66.5 | 11.8 | 0.7 | 65.8 | 10.7 | 0.6 | 64.8 | 11.4 | 0.6 | 63.9 | 10.9 | 0.6 | 64.0 | 11.5 | 0.7 | 66.9 | 12.8 | 1.4 | 65.1 | 11.4 | 0.3 |
| 10 | Target dose (MBq) | 182.6 | 91.2 | 5.0 | 249.4 | 103.2 | 6.1 | 258.1 | 93.0 | 4.5 | 309.8 | 107.0 | 6.3 | 371.4 | 140.0 | 8.8 | 536.2 | 24.9 | 2.7 | 282.3 | 132.1 | 3.3 |
| 11 | Dose adjusted for time of injection (MBq) | 182.4 | 91.0 | 5.1 | 250.2 | 105.2 | 6.2 | 257.9 | 93.5 | 4.5 | 308.7 | 107.0 | 6.3 | 370.8 | 139.4 | 8.8 | 532.7 | 32.0 | 3.5 | 281.9 | 132.0 | 3.3 |
| 12 | Predicted count rate adjusted for time of injection (s−1) | 1.20 | 0.26 | 0.01 | 1.68 | 0.24 | 0.01 | 1.78 | 0.23 | 0.01 | 2.07 | 0.26 | 0.02 | 2.49 | 0.49 | 0.03 | 4.00 | 1.01 | 0.11 | 1.92 | 0.72 | 0.02 |
| 13 | Measured count rate (s−1) | 1.20 | 0.33 | 0.02 | 1.64 | 0.39 | 0.02 | 1.84 | 0.42 | 0.02 | 2.13 | 0.41 | 0.02 | 2.60 | 0.68 | 0.04 | 4.01 | 1.16 | 0.13 | 1.96 | 0.82 | 0.02 |
| 14 | Need for more than two analyses | 27 | 8.6% | 22 | 7.7% | 21 | 4.9% | 8 | 2.8% | 9 | 3.6% | 2 | 2.4% | 89 | 5.4% | |||||||
Publisher’s Note: MDPI stays neutral with regard to jurisdictional claims in published maps and institutional affiliations. |
© 2021 by the authors. Licensee MDPI, Basel, Switzerland. This article is an open access article distributed under the terms and conditions of the Creative Commons Attribution (CC BY) license (https://creativecommons.org/licenses/by/4.0/).
Share and Cite
Hansen, M.N.; Haarmark, C.; Kristensen, B.; Zerahn, B. An Algorithm for Individual Dosage in Cadmium–Zinc–Telluride SPECT-Gated Radionuclide Angiography. Diagnostics 2021, 11, 2268. https://doi.org/10.3390/diagnostics11122268
Hansen MN, Haarmark C, Kristensen B, Zerahn B. An Algorithm for Individual Dosage in Cadmium–Zinc–Telluride SPECT-Gated Radionuclide Angiography. Diagnostics. 2021; 11(12):2268. https://doi.org/10.3390/diagnostics11122268
Chicago/Turabian StyleHansen, Maria Normand, Christian Haarmark, Bent Kristensen, and Bo Zerahn. 2021. "An Algorithm for Individual Dosage in Cadmium–Zinc–Telluride SPECT-Gated Radionuclide Angiography" Diagnostics 11, no. 12: 2268. https://doi.org/10.3390/diagnostics11122268
APA StyleHansen, M. N., Haarmark, C., Kristensen, B., & Zerahn, B. (2021). An Algorithm for Individual Dosage in Cadmium–Zinc–Telluride SPECT-Gated Radionuclide Angiography. Diagnostics, 11(12), 2268. https://doi.org/10.3390/diagnostics11122268