Abstract
Positron emission tomography (PET) imaging with 18F-fluorodeoxyglucose (FDG) represents a method of detecting and characterizing arterial wall inflammation, with potential applications in the early assessment of vascular disorders such as atherosclerosis. By portraying early-stage molecular changes, FDG-PET findings have previously been shown to correlate with atherosclerosis progression. In addition, recent studies have suggested that microcalcification revealed by 18F-sodium fluoride (NaF) may be more sensitive at detecting atherogenic changes compared to FDG-PET. In this review, we summarize the roles of FDG and NaF in the assessment of atherosclerosis and discuss the role of global assessment in quantification of the vascular disease burden. Furthermore, we will review the emerging applications of FDG-PET in various vascular disorders, including pulmonary embolism, as well as inflammatory and infectious vascular diseases.
Keywords:
atherosclerosis; 18F-sodium fluoride; NaF; 18F-fluorodeoxyglucose; FDG; PET; calcification; vasculitis; thrombosis; IgG4-RD 1. Introduction
Atherosclerosis is the leading cause of cardiovascular diseases (CVDs) [1]. Globally, 31% of all deaths in 2016 were caused by CVD, of which 85% were due to heart attacks or strokes [2]. Atherosclerotic changes of the vasculature can be detected through different imaging techniques and can be divided into two main categories centering either on the degree of stenosis or on plaque composition. Previously, the clinical focus has been on measuring the degree of the stenosis and the subsequent physiological effect. To assess the cardiac physiology, radionuclide ventriculography, often referred to as a MUGA (multiple-gated acquisition) scan, where a gamma camera following an injection of radioactively labeled red blood cells is used to measure the left ventricular ejection fraction (LVEF). Echocardiography is another technique that uses sound waves to produce images of the heart and, also, allows for the assessment of LVEF. Myocardial perfusion scintigraphy has traditionally used single-photon emission computed tomography (SPECT), but more recently, positron emission tomography (PET) is also increasingly used in the diagnosis of ischemic chest pain and for the evaluation of known coronary artery disease (CAD).
In contrast to these techniques, imaging modalities able to characterize plaque causing lumen stenosis have been the main focus the last decade due to increased knowledge of the pathogenesis of the atherosclerotic process. At present, it is well-known that narrowing of the arterial lumen by atherosclerotic plaques or macrocalcifications is incapable of predicting plaque rupture and, consequently, thrombosis in the affected vessels [3,4,5]. Computed tomography (CT) permits the detection and characterization of macrocalcification in atherosclerosis [6]. Cardiac CT has been demonstrated to have utility in assessing early atherosclerotic changes, including signs of inflammation, in addition to plaque burden and degree of plaque calcification [7,8,9]. The macroscopic calcification evident on CT may, however, not be a reliable predictor for future cardiovascular events. Heavily calcified plaques are associated with a more stable disease and are less vulnerable to rupture and, consequently, thrombosis in the affected vessels [10,11]. Atherosclerosis is a chronic, systemic disease with inflammation as the dynamic trigger for progression [1,12,13]. Vulnerable or high-risk plaques are characterized by a necrotic core, the infiltration of macrophages, increased network of vasa vasorum, and microcalcification [11,14]. Since plaques can rupture without any preceding clinical symptoms, changes in their morphology over time are difficult to predict; evaluating patients’ overall vulnerability rather than the individual plaques could be of greater value for risk assessments and treatment decisions [15,16]. Thus, imaging techniques that can evaluate cellular processes preceding plaque rupture and allow for a global assessment of the disease burden for the patient at the early stages will be critical for the prevention of further disease progression and subsequent clinical complications. 18F-fluorodeoxyglucose (FDG) is taken up by metabolically active cells in the plaques conjectured to be inflammatory macrophages [3,17,18], while 18F-sodium fluoride (NaF) is deposited at the sites of microcalcification due to physicochemical exchange of the 18F- ion with the hydroxyl group in hydroxyapatite [19,20,21,22]. Hence, fused PET/CT with FDG and NaF can visualize atherosclerotic disease on a molecular scale earlier in the disease progression when changes may still be reversible (Table 1 and Table 2).

Table 1.
Studies on the Role of FDG in atherosclerosis.
Table 2.
Studies on the role of NaF in atherosclerosis.
2. Atherosclerosis
2.1. Role of FDG in Atherosclerosis
Atherosclerosis, or atherosclerotic cardiovascular disease, is a chronic condition characterized by arterial stiffening due to the buildup of cholesterol plaques on vessel walls [65]. Endothelial cell dysfunction is believed to underlie the pathogenesis of atherosclerosis. In brief, hypertension and hyperlipidemia contribute to the upregulation of endothelial cell adhesion molecules [66]. The resultant recruitment of inflammatory cells propagates the inflammatory cascade, including platelet activation, deposition of lipid plaques, smooth muscle proliferation, and, ultimately, vessel micro- and macrocalcifications [13]. Progressive enlargement of these plaques throughout the body leads to a spectrum of debilitating cardiovascular conditions, including peripheral artery disease, ischemic stroke, coronary artery disease, and acute myocardial infarctions [67]. These conditions represent a major cause of morbidity and mortality both in the Unites States and worldwide [68,69,70]. Therefore, effective strategies to identify atherosclerotic disease early in the disease pathogenesis, as well as to quantify the extent of disease burden, are alluring.
Conventional imaging modalities, including ultrasonography, CT, and MRI angiography, are widely used clinically to visualize large symptomatic plaques but are limited in their ability to assess the early stages of atherosclerosis [71,72]. In contrast, molecular imaging offers a tantalizing opportunity to examine the pathological hallmarks of atherosclerotic disease at the microscopic level [73]. As discussed previously, FDG demonstrates remarkable sensitivity and specificity for inflammatory lesions (Figure 1). Further, FDG was postulated to be effective in the identification of the inflammatory precursor lesions that precede calcific atherosclerotic disease. Yun et al. first examined vascular FDG uptake in 137 patients who underwent FDG-PET scanning [23]. They observed that over half of the subjects demonstrated vascular FDG uptake, with a greater prevalence among older individuals. Further studies demonstrated that vascular inflammation as assessed by FDG was associated with proinflammatory molecular and cellular markers of atherosclerosis [24,25,26].
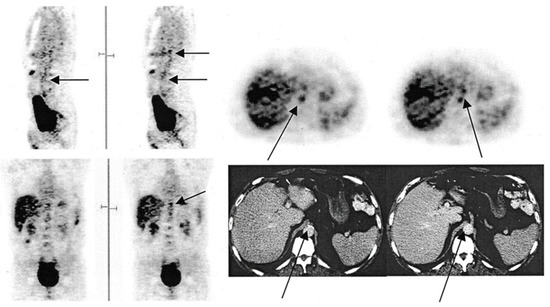
Figure 1.
FDG-PET images illustrating the foci of FDG uptake along the aorta. In the sagittal view, the arrow in the left image indicates the abdominal aorta, while the top arrow on the right points to the budding superior mesenteric artery. In the transverse view, the bottom and top arrows indicate the abdominal aorta and budding superior mesenteric artery, respectively. In the coronal view, the arrow points to the budding mesenteric artery. In the CT image, the left arrow points to calcification along the abdominal aorta, while the right indicates to the budding superior mesenteric artery (from Yun et al. [23] with permission).
It is becoming apparent, however, that the association between FDG uptake and risk factors associated with disease progression may be less straightforward than originally postulated. Yun et al. demonstrated in a later study of 156 patients that intravascular FDG uptake was significantly related to age and high cholesterol but not other cardiovascular risk factors, including cigarette use, diabetes mellitus, hypertension, and obesity [27]. Other researchers have demonstrated similar results using a variety of protocols and parameters to further characterize the clinical impact of arterial FDG uptake [3,28,29,30,40,41,42,74,75]. While the results of these studies are challenging to compare directly, in general, FDG uptake demonstrates a clear association with age but only a vague relationship with other risk factors [31,32]. For example, Pasha et al. measured the tissue-to-background ratio and weighted-average mean standardized uptake value to examine 76 patients who underwent FDG-PET/CT imaging and found that patients with cardiovascular risk factors had increased FDG uptake in the aorta but not in the peripheral (i.e., femoral and iliac) arteries [30]. Due to this variability, careful interpretation and clinical correlation should be applied to focal vascular FDG uptake.
Moreover, FDG has been found to demonstrate a low specificity for the future development of calcifications [33,34,35,36,76]. The uptake of FDG by endothelial cells and smooth muscle cells increases in hyperinflammatory states such as cancer, thereby potentially obfuscating the localization and quantification of FDG uptake due to atherogenic activity [5]. Meanwhile, stable disease, which may present with substantial plaque burdens but minimal or variable inflammation, similarly obscure the FDG-PET findings, what Meirelles et al. described as the “waxing and waning” effect [37]. That is, while focal FDG uptake is frequently observed in atherosclerotic disease, it has not been clearly associated with the structural manifestations of atherosclerosis identifiable by CT. Interestingly, arterial macrocalcification detected by CT has been shown to regress in angina patients over a 2-year period, suggesting that structural changes associated with atherosclerosis may also not be stable for measurements over time [43]. While further longitudinal studies should be performed to corroborate the results, the variability of FDG uptake during atherosclerosis progression further challenges the temporal use of FDG-PET/CT.
Numerous studies have investigated the relationship between FDG uptake within vulnerable plaques and the risk for future cardiovascular outcomes [31,77,78]. For example, the FDG uptake at plaques found in carotid arteries was found to be higher in patients who experienced early recurrent strokes [79]. An association between high FDG uptake and plaques with high-risk morphological features has been confirmed histologically as well [80]. Despite the apparent positive results, however, there remains significant challenges to using FDG-PET to study atherosclerotic plaques. First are the technical challenges intrinsic to FDG-PET, such as low specificity and resolution; the accurate measurement of FDG uptake in plaques can be hampered by high physiological myocardial FDG uptake, small diameter of the arteries, and cardiac motion [5,81]. A decreasing myocardial FDG uptake requires prior adherence to a high-fat, low-carbohydrate diet, which can be hard to follow for patients [82,83]. Furthermore, the absence of FDG uptake in the plaque may not always indicate a truly negative result, as it could be due to the insensitivity of PET to detect small foci of the FDG uptake [84].
Another argument against the use of FDG-PET for studying atherosclerotic plaques is the limited clinical significance of the vulnerable plaque; it is well-known that plaques can rupture without any preceding or warning symptoms, the morphology of plaques detected by imaging modalities can vary over periods of time, and plaque lesions that rupture are often previously characterized as non-culprits. Furthermore, only a small number of vulnerable plaque ruptures cause actual symptomatic events. Therefore, FDG-PET should not be limited in its scope to examining specific plaques. Rather, it should be used for deriving atherosclerotic burdens measured from FDG uptakes in broader anatomical structures and vessels [74].
The last general limitation of FDG that must be mentioned is its inability to elucidate the precise cellular mechanism of disease progression and its relationship with organs of high intrinsic glucose uptake. Despite this, FDG-PET has been used to rationalize the mechanistic relationship between CVD and neuropsychiatric conditions through bone marrow and spleen involvement [85,86]. For instance, it has been found that a high FDG uptake in the amygdala correlates with CVD events, arterial inflammation, and FDG uptake in the bone marrow and spleen, which was taken to rationalize that stress may lead to CVD events through the increased production of inflammatory cells from the hematopoietic stem cell niche [38]. However, the main metabolic activity of the bone marrow that accounts for a high FDG uptake is the production of red blood cells, which varies widely among subjects of different ages, rather than the generation of inflammatory cells [87,88,89]. Similarly, FDG uptake in the spleen is known to differ based on the clinical context [90]. Therefore, only relying on FDG-PET to draw specific cellular mechanisms and causal relationships between CVD and organs of high natural FDG uptake should be avoided.
In the current state of research, the prognostic value and implementation of FDG-PET for the assessment of the atherosclerotic risk remain to be further tested. There has been no clear association between the FDG uptake and CT calcium burden, nor a prospective study in noncancerous patients that correlates an increased FDG uptake with adverse cardiovascular outcomes [91]. The CAMONA (Cardio-vascular Molecular Calcification Assessed by 18F-NaF PET/CT) study involving 50 patients with angina pectoris and 89 healthy controls, for instance, revealed no significant correlation of FDG uptake in the thoracic aorta and 10-year Framingham Risk Score (FRS) [34]. Additionally, the variability in the protocols and reporting outcomes further confounded the implementation of FDG-PET. A review of 49 articles using FDG-PET to evaluate atherosclerosis inflammation revealed 53 different acquisition protocols and 46 methods of quantify the tracer uptake. Standardization and harmonization of the method, therefore, remains an essential step to be taken before using FDG-PET in clinical practice [92].
2.2. Role of NaF in Atherosclerosis
Over the past decade, increasing attention has turned toward NaF-PET/CT to detect vascular microcalcifications. Unlike FDG, NaF is not taken up by metabolically active tissues such as the myocardium, which allows NaF-PET to have a greater sensitivity and less background uptake than FDG for the assessment of CVDs [76]. In their methodological piece, Irkle et al. demonstrated that NaF has demonstrated a sensitivity for calcification in the vascular tissue, thereby lending itself well to atherosclerotic disease [93]. Research using vascular NaF-PET/CT has demonstrated that coronary; pulmonary; and peripheral (i.e., aorta, carotid, iliac, and femoral) artery NaF uptake is significantly correlated with a number of cardiovascular risk factors, including age, BMI, diabetes, hypertension, hyperlipidemia, and cardiovascular events; however, it is not associated with smoking and is variably associated with sex [41,44,45,46].
Evidence points toward NaF uptake as a significant clinical metric for atherosclerosis (Figure 2). Kwiecinski at al. and Kitagawa et al. both found that focal coronary NaF uptake on the index scans significantly correlates with the incidence of myocardial infarction [47,48]. As such, findings on NaF-PET/CT may therefore serve as a tool to assess the future risk of atherosclerosis complications. Other studies by Rojulpote et al. and Patil et al. have correlated the NaF uptake of vital and laboratory values such as blood pressure and the triglycerides-to-high-density lipoprotein ratio, respectively [49,50]. In addition, NaF uptake has been associated with widely used clinical scores for cardiovascular disease burden, including the Framingham Risk Score, atherosclerotic cardiovascular disease (ASCVD) risk scores calculated by the Pooled Cohort Equation, and CHADS2/CHADS2-VASc [34,51,52,53,54].
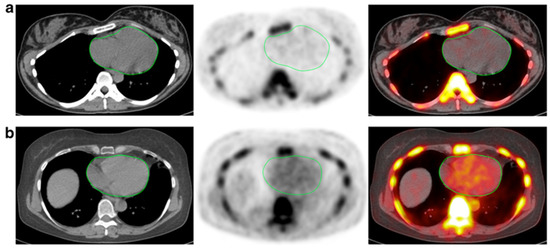
Figure 2.
CT, NaF-PET, and fused NaF-PET/CT images of clinically normal (a) 25- and (b) 61-year -old subjects’ hearts. Green line delineates the region of interest around the heart analyzed to calculate the global cardiac calcification scores, which are 12,492.44 (a) and 18,424.70 (b). Despite the relatively increased NaF uptake in the PET scan of the subject’s heart (b), there is no visible calcification in the corresponding CT scan. The disparity between two modalities alludes to CT-visible macrocalcification as end-stage disease process, while NaF uptake may reflect early pathological, molecular changes (from Raynor et al. [94] with permission).
It is clear that molecular imaging will play a major role in atherosclerotic imaging in future clinical practice (Figure 3). Recent evidence has pointed toward NaF as a more useful clinical tool than FDG in the evaluation of atherosclerotic disease, particularly for a high plaque burden. In an examination of 19 multiple myeloma patients who underwent NaF- and FDG-PET/CT scans, Li et al. found that increased NaF uptake was associated with increased plaque density, while the inverse was true for FDG [55]. With regard to the pathological development of atherosclerotic plaques, a number of studies have observed that vascular NaF uptake is greater in high-risk lesions than stable plaques in the carotid and coronary arteries [14,56,57]. In addition, Ishiwata et al. recorded the initial arterial NaF uptake in the abdominal aorta and common iliac arteries and then tracked the atherosclerotic disease progression using CT. They observed that, on index scans, NaF uptake was greater in noncalcified than calcified lesions, perhaps reflecting active plaque deposition; however, the initial NaF findings did not correlate with the disease burden determined by CT alone during follow-up at 1 to 2 years [55,58].
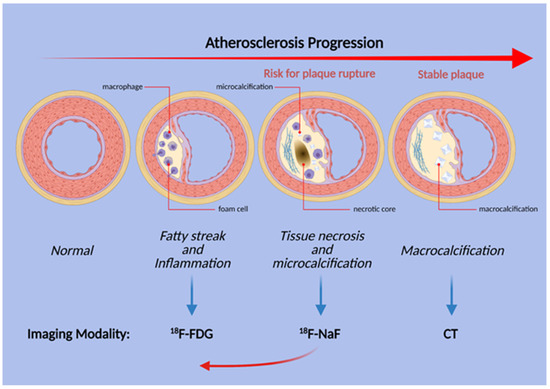
Figure 3.
Schematic illustration of the stages of atherosclerosis in the coronary arteries. Uptake of both FDG and NaF is evident before the structural changes are visible, but inflammation and FDG uptake does not necessarily precede microcalcification. Thus, NaF uptake may be present earlier than previously thought (red arrow).
Regardless, there exists a paucity of longitudinal, prospective research utilizing repeat NaF-PET scanning to examine the development and progression of NaF-avid lesions and vessel wall calcifications [95]. There currently has not been any human studies establishing a clear link between arterial NaF uptake by macrocalcification and the subsequent transformation into CT-detectable macrocalcification; the clearest association with early NaF uptake and corresponding coronary macrocalcification was demonstrated using an Ossabaw miniature swine model for metabolic syndrome [19]. Therefore, the development of well-powered, prognostic studies conducted with longitudinal design remains necessary to fill this void and confirm the potential of NaF-PET for the clinical assessment of atherosclerosis [91].
Another parameter that should be examined with caution in PET research design is the use of the target-to-blood pool ratio (TBR), which is derived by dividing the raw standard uptake value (SUV) to the venous blood pool SUV [25]. This derivation attempts to calibrate for the assumed background tracer activity in the blood but currently remains a controversial and even unreliable method. For instance, no clear biological rationale is offered for its use. Furthermore, TBR calculations can introduce large variability to the data, since the venous blood pool SUV is often minimal and affected by wide-ranging factors such as the venous blood flow rate, blood cell uptake, and individual differences in FDG clearance [96]. Blomberg et al. highlighted the unreliability of the TBR method when the authors found that the TBR values calculated at 1, 2, and 3 h after tracer administration were inconsistent [39].
2.3. Alavi-Carlsen Calcification Score (ACCS)
In lieu of the TBR method, global assessment of the major vessels, called the Alavi-Carlsen Calcification Score (ACCS), may offer significant advantages for using PET imaging to study diffuse CVD activity [97]. The Alavi-Carlsen Calcification Score method of global assessment contrasts with the focal approach, which is limited to specific sites such as atherosclerotic plaques in the coronary arteries [81]. A limitation of measuring the focal uptake in such small vessels arises from the insufficient resolution of most PET scanners, which has the potential to underestimate the associated radiotracer uptake [59,98]. Evaluating the major vessels could overcome this limitation, considering that calcification in the thoracic aorta is shown to strongly correlate with the coronary artery score [99,100].
As such, the ACCS global assessment examines atherosclerosis in its appropriate context as a diffuse, systemic disease that exerts differential effects in various parts of the affected arteries [97,101]. The score is derived from measuring the total tracer uptake in structures such as the entire body, major vessels, or specific organs such as the heart in the form of average SUV over a broad segment of the body. It allows for the measurement of the atherosclerotic burden in the early stages of the disease progression, unlike the method of measuring plaque uptakes that occur in later phases. The regions of interest (ROIs) can easily be defined based on gross structures seen in CT or the cardiac silhouette in 3D. Since the score is measured based on clearly defined and delineated anatomical boundaries, it is less subject to human bias and variations in measurements, even allowing for artificial intelligence (AI)-based approaches with a reproducibility of 100% [91].
The ACCS global assessment approach has been employed to demonstrate that patients with multiple myeloma have a higher uptake of NaF in the thoracic aorta and whole heart, as measured by the target-to-background ratio (TBR) compared to a matched control group [60]. Similarly, the CVD risk factors, such as total cholesterol in patients with type 2 diabetes mellitus, have been shown to be associated with increased NaF uptake when measured as the global TBR in the femoral arteries [61]. A retrospective analysis of 86 healthy controls and 50 patients with persistent chest pain revealed using the ACCS approach of NaF uptake in the whole heart as measured by the mean standardized uptake value (SUVmean) was higher in patients compared to the control subjects and could be employed to retrospectively predict the patient status [62]. Overall, these studies demonstrate the suitability and potential of quantifying disease risk through global assessment, of which the latter has now become an attractive option that is quick and easy to perform, especially using artificial intelligence-based processing [63,64,97,101].
2.4. Other PET Tracers in Atherosclerosis
The most used radiotracer in PET imaging is FDG, which has well-studied roles in atherosclerosis imaging. However, FDG has several limitations. FDG accumulates in all cells that metabolize glucose, and a high physiologic myocardial uptake obscures the uptake due to the presence of macrophages in atherosclerotic plaques. 68Ga-DOTATATE is a tracer that was originally intended for the improved detection of somatostatin receptor 2 (SSRT2)-positive neuroendocrine tumors. SSTR2 is also expressed on plaque macrophages; hence, it has the potential to visualize vulnerable plaques. Tarkin et al. [102] tested the efficacy of 68Ga-DOTATATE compared to FDG in 42 patients with atherosclerosis, and 68Ga-DOTATATE was shown to differentiate culprit lesions from non-culprit lesions better than images obtained by FDG. In addition, its degree of uptake correlates with the Framingham cardiovascular risk score.
Translocator protein (TSPO) ligands expressed on the macrophage in the process of plaque formation can be targeted by the C-PK11195 tracer. In an animal model, Laitinen et al. [103] demonstrated that tracer uptake was higher in inflamed than in noninflamed plaques but that other healthy structures of the artery wall also had prominent uptake, limiting its potential utility.
The expression of C-X-C motif chemokine receptor 4 (CXCR4) and its endogenous ligands and C-X-C motif chemokine 12 (CXCL12) can be found in cardiac myocytes and fibroblasts [104]. According to Hu et al., there is an upregulation of CXCR4/CXCL12 in response to hypoxia in myocardial infarction, which, in turn, initiates the process of recruitment of cardioprotective cells to protect the myocardium from reperfusion damage [105]. Recently, several studies have demonstrated promising results of the possibility of using CXCR4-directed 68Ga-Pentixafor PET/CT imaging to evaluate atherosclerotic plaque lesions [106,107,108]. These prompt further studies to compare CXCR4-directed 68Ga-Pentixafor PET/CT imaging with imaging using FDG. Kircher et al. conducted a retrospective study to compare the performance between CXCR4-directed 68Ga-Pentixafor PET/CT and FDG-PET/CT in detecting the atherosclerotic lesion, showing that the former was able to visualize more plaque lesions than the latter. Apart from macrophages, CXCR4 could be expressed in thrombocytes, T cells, and smooth muscle cells, representing 68Ga-Pentixafor might be able to detect early-stage lesions without the setting of marked inflammation [109]. As discussed in an earlier section, FDG uptake is only associated significantly with age. A study conducted by Weiberg et al. successfully established that CXCR4-directed 68Ga-Pentixafor uptake has a marked association with different cardiovascular risk factors, including age, arterial hypertension, and history of smoking [110]. The ability of 68Ga-Pentixafor to detect lesions earlier and its association with cardiovascular risk factors make it a promising alternative for FDG imaging.
3. Thrombotic Disorders
3.1. FDG-PET in Pulmonary Embolism
Pulmonary embolism (PE) is the obstruction of the pulmonary artery and/or its branches by occlusive materials such as thrombus or tumor samples that could lead to sudden death by infarction if left untreated. The clinical symptoms of PE such as dyspnea and chest pain are often non-sensitive and nonspecific, making objective testing such as the D-dimer test or CT pulmonary angiography crucial for its diagnosis and subsequential therapy [111]. While noninvasive imaging modalities such as CT angiography remain as the gold standard, the evaluation PE is unlikely to be replaced by FDG-PET; there have been reports of FDG-PET in allowing clinicians to identify PE in the setting of oncological practices where FDG is routinely used (Figure 4). In fact, there have been numerous case reports of incidentally detecting PE as lesions with a focal FDG uptake using FDG-PET/CT [112,113,114,115,116]. Although the exact physiological mechanism remains unclear, it is hypothesized that the increased presence of inflammatory cells such as neutrophils at the site of embolism is responsible for the FDG uptake [117,118].
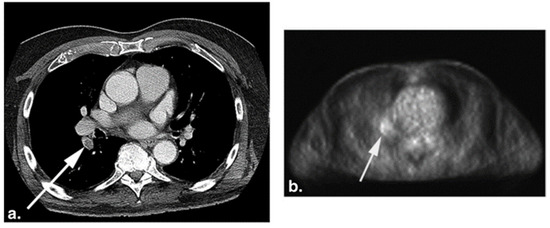
Figure 4.
CT (a) and the corresponding FDG-PET (b) images of a 75-year-old woman with a history of melanoma. The white arrows point to pulmonary embolism (PE) present in the right lower lobe segmental artery. Increased FDG uptake (b) is seen at the location of PE on the PET image (from Flavell et al. [119] with permission).
A retrospective study of thirteen patients with coincidental acute PE who underwent FDG-PET as a part of oncological treatment revealed that regions of acute pulmonary embolism have greater FDG activity compared to vessels without thrombi, with the shapes of the uptakes being focal or curvilinear. Specifically, the mean SUV of acute PE was 1.65 ± 0.61, while vessels with no thrombus was 1.15 ± 0.38, with a p-value of 0.009. An increased FDG uptake represented as a focal or curvilinear abnormality in the PET scans corresponded to the contrast-enhanced CT abnormality identified as PE [117]. Another retrospective study performed by Flavell et al. examining 59 FDG-PET/CT studies of patients with incidental PE similarly demonstrated that there was an increased focal FDG uptake within the pulmonary artery involved in or next to the PE compared to normal arteries. Furthermore, three of the cases with identified pulmonary infarct exhibited associated FDG avidity. Interestingly, one of the studies revealed that increased FDG uptake in the right ventricular wall was associated with saddle PE and bowing of the interventricular septum [119].
The current literature supports that FDG-PET may be used to differentiate a pulmonary embolism from other diseases of the pulmonary artery, such as pulmonary artery sarcoma. Pulmonary artery sarcoma is a rare malignancy rising from the mesenchymal cells of the pulmonary artery, often mimicking PE in clinical presentation and imaging [120]. A study of three patients with pulmonary artery sarcoma and ten patients with proximal PE demonstrated that the mean SUVmax of pulmonary artery sarcoma lesions (7.63 ± 2.21) was significantly higher than that of PE (2.31 ± 0.41), with a p-value of 0.011 [118]. A retrospective study by Lee et al. with eighteen subjects similarly found that the SUVmax of the malignant pulmonary artery lesions (10.2 ± 10.8) was significantly higher than that associated with PE (1.7 ± 0.3, p < 0.001) [121]. A literature review determined that a FDG SUVmax cutoff value of 3.3 had the sensitivity, specificity, and accuracy of 98.4%, 96.8%, and 97.8%, respectively, for discriminating malignant pulmonary artery lesions [122]. Regardless, further studies on the use of FDG-PET with a larger study cohort remains necessary to fully understand and establish its potential for detecting and diagnosing PE.
3.2. FDG-PET in Deep Vein Thrombosis and Venous Thromboembolism
Deep vein thrombosis (DVT) is the formation of thrombus in a deep vein, such as the femoral vein; prompt diagnosis and treatment are crucial to avoid venous thromboembolism (VTE), which is a deadly complication of DVT followed by PE. The risk factors for thrombosis are delineated by Virchow’s triad, which refers to a state of hypercoagulability, endothelial vessel injury, and venous stasis [123]. Ultrasonography (US) is the primary method of detecting DVT; incompressibility of a venous vessel with a US probe is considered diagnostic of DVT [124]. While US have many advantages, such as the lack of radiation exposure and accessibility, they heavily rely on interpreter and operators’ experiences, and obtaining quality US images can be stymied by the patient’s state of health, such as obesity and edema [125].
Several articles have reported the use and advantage of FDG-PET for the identification of DVT. Hara et al. demonstrated using a murine stasis-induced DVT model with which FDG-PET/CT could identify DVT by detecting neutrophil-dependent inflammation of the thrombus. The same study also retrospectively examined 19 DVT patients and found that FDG uptake in the vein with DVT as measured by SUVmax and TBR was significantly greater compared to that of the matched control patients and that the FDG signal within DVT decreased over time [126]. In another study of twelve symptomatic patients with DVT by Rondina et al., the SUVmax values of the thrombosed vein regions were found to be significantly greater than that of the contralateral leg without thrombosis. The SUVmax threshold of greater than or equal to 1.645 was 87.5% sensitive and 100% specific for DVT. Furthermore, the SUVmax of the thrombosed vein regions decreased over time, suggesting that the metabolic activity of a vein with thrombosis can be quantitatively correlated to the time since the onset of DVT symptoms [125]. Hess et al. showed that, in fifteen patients with suspected DVT and/or PE, FDG-PET/CT accurately detected DVT in all patients, while the results for PE were unclear, with only two out of six patients demonstrating FDG avidity [127]. Zhu et al. found an association between lower leg venous FDG uptake and the risk of developing VTE in a retrospective study with 10 patients [128].
In contrast to the positive studies, Le Roux et al. concluded that FDG-PET/CT may not be accurate enough for the diagnosis of VTE. This study of 100 patients found low sensitivities of FDG-PET/CT for both PE and VTE (3% and 31%, respectively). Although FDG uptakes in regions with DVT were significantly higher compared to the corresponding contralateral vessels, the authors could not find any SUVmax threshold significant to being used as a diagnostic cutoff [129]. Additionally of interest, studies employing FDG-PET/CT to distinguish venous thrombosis from other types of thrombosis, such as those of tumor or septic origin, reported no significant FDG uptakes in simple venous thrombosis [130,131]. Further studies investigating and differentiating the use of FDG-PET in a wide range of thrombi with the appropriate time points and controls could help clarify and consolidate the results of the various studies.
Overall, the advantages of FDG-PET in detecting DVT include the examination of anatomical locations not easily accessible by US, comprehensive whole-body image acquisition, and the quantification of FDG uptake to deduce the timeline of the thrombus [132]. While it is unlikely that FDG-PET will replace US in diagnosing DVT, FDG-PET may serve key roles in detecting PE or DVT in oncological patients who often undergo FDG-PET imaging as a part of their routine care. Cancer patients have a higher risk of developing DVT, and a retrospective investigation of 131 cancer patients with a history of DVT or PE, who underwent FDG-PET/CT imaging, revealed abnormal FDG venous uptakes in 26 (19.8%) patients, with the most common site of thrombosis being the inferior vena cava [133]. Employing FDG-PET/CT to detect DVT early in oncology patients may significantly improve the therapeutic outcomes and significantly decrease the comorbidities of cancer.
4. FDG beyond CVDs
4.1. FDG-PET in Large Vessel Vasculitis
Large vessel vasculitis (LVV), which includes Takayasu arteritis (TA) and giant cell arteritis (GCA), affects large vessels such as the aorta and its branches, causing chronic granulomatous inflammation. TA commonly affects women between the ages of 15 and 30 years, while GCA is more common after 50 years of age [134]. Although temporal artery biopsy is the gold standard for the diagnosis of GCA, imaging has played an increasing role in the diagnosis of both types of LVV [135]. Modalities such as ultrasounds, CT, magnetic resonance imaging (MRI), and PET/CT have been proposed to assist in the evaluation of vasculitis. Compared to anatomic modalities, PET/CT has the advantage of portraying molecular changes before morphological ones become manifest. Increased glycolytic activity by the macrophages and lymphocytes present in the arterial wall in the LVV results in an increased FDG uptake [136]. Unlike the patchy FDG uptake resulting from atherosclerosis, LVV causes a mural FDG uptake that is smooth and circumferential [137].
Several recent studies have proposed that FDG-PET/CT has a role in the diagnosis and monitoring of GCA [137,138,139,140,141]. In this disease, the symmetric involvement of the subclavian arteries and aorta often demonstrate increased FDG activity (Figure 5) [142]. A study by Sammel et al. considered 64 cases of suspected GCA and compared the imaging obtained within 72 h of starting glucocorticoids with the results of the temporal artery biopsy [139]. The sensitivity of FDG-PET/CT in the diagnosis of GCA was determined to be 92%, while the specificity was 85%. The importance of FDG-PET/CT in instances of suspected GCA with a negative temporal artery biopsy was evaluated in a study by Hay et al., who showed a large vessel uptake of FDG in 22 out of 63 such cases [140]. FDG-PET/CT has also been found to have a potential role in the diagnosis of TA, in which involvement of the left subclavian artery and bilateral carotid arteries is more common [135,143]. A prospective evaluation of 30 TA patients found that FDG could portray local inflammation and vascular remodeling [144]. A meta-analysis that included 191 TA patients across seven studies determined that FDG-PET had a pooled sensitivity of 87% and a pooled specificity of 73% [145].
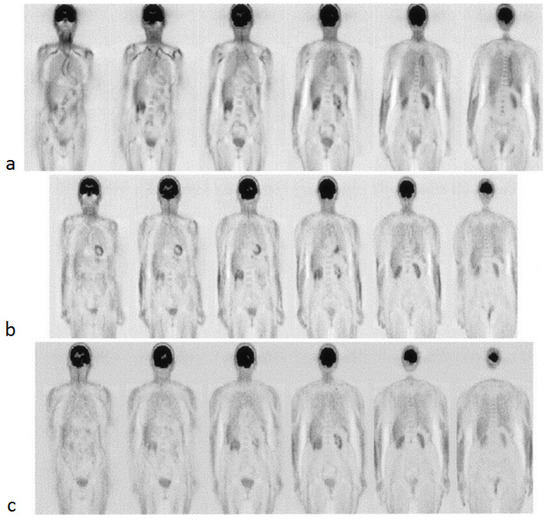
Figure 5.
FDG-PET images of a 78-year-old woman with giant cell arteritis at the baseline (a), 3 months of therapy (b), and 6 months of therapy (c). High-tracer uptake is initially present and visible in the thoracic aorta and subclavian arteries, as evident in the first two images from the left (a), which progressively decreased after treatment with steroids (from Blockmans et al. [142] with permission).
Polymyalgia rheumatica (PMR) is a rare disease found exclusively in adults over the age of 50 and characterized clinically by morning stiffness and aching at the shoulders, hip girdle, torso, and neck. It is a disease that involves the proximal articular and periarticular structures (bursae and tendons) and can be associated with giant cell arteritis (GCA). The occurrence of PMR is approximately 50% in patients with GCA [146]. Henckaerts et al. examined the FDG uptake in 99 patients who underwent FDG-PET scanning. They observed 67% sensitivity and 87.5% specificity by using FDG-PET in diagnosing the affected patients with a high clinical suspicion of PMR, and the diagnostic accuracy improves before commencement of the glucocorticoid treatment [147]. FDG-PET studies have revealed a characteristic FDG uptake by the bursitis in particular joints, mainly glenohumeral; sternoclavicular; spinous processes; greater trochanters; and, to a lesser extent, in the wrists, elbows, and acromioclavicular joints [148]. A meta-analysis of 636 patients across nine studies found that FDG uptake at certain joints such as hips, ischial tuberosities, shoulders, and sternoclavicular yield a higher positive likelihood ratio of PMR [149].
In addition to the diagnosis of LVV, FDG-PET/CT may have a role in prognostication and evaluating the response to treatment. Glucocorticoids are often the first-line treatment for LVV, along with methotrexate, cyclophosphamide, and tocilizumab also available as therapeutic options. A retrospective study of 12 GCA patients treated with glucocorticoid and tocilizumab revealed that complete remission in all subjects was accompanied by a significant decrease in the FDG SUVmean [150]. In a study of 56 LVV patients, Grayson et al. observed that a higher vascular FDG uptake in patients in clinical remission was associated with eventual clinical relapse [151]. Similarly, a higher total lesion glycolysis was detected in patients with complicated progress compared to patients with favorable progress in 17 cases of confirmed LVV [152]. Muratore et al. followed 93 patients with LVV for a median of 31 months and discovered that the baseline FDG uptake was associated with a greater risk of aortic dilatation [153]. Based on these results, PET/CT has a promising role in the diagnosis and monitoring of LVV disease activity over time, with the potential to assess the outcomes and influence the management. Due to the systemic nature of vasculitis, total body imaging may offer greater sensitivity and specificity for these pathologies [154]. As sensitive imaging modalities play a growing role in assessing LVV, longitudinal prospective studies are necessary to validate and standardize assessments with FDG-PET/CT.
4.2. FDG-PET in Vascular Diseases of Infectious Etiology
Although less common, other disorders affecting the cardiovascular system may benefit from the unique perspective offered by PET/CT imaging. As a sensitive indicator of inflammation and infection, FDG may play a role in the diagnosis and monitoring of infectious aortitis [155,156,157]. Murakami et al. found that the maximum SUV (SUVmax) was higher in all cases of infected aortic aneurysms compared to noninfected cases in a total of 11 patients [157]. Additionally, FDG uptake has been observed to normalize after the successful treatment of infectious aortitis before the response was visible on CT [156]. Other types of infections, such as vascular prosthetic graft infection (VPGI), can also be visualized by FDG-PET/CT. A meta-analysis of 286 cases of VPGI across 10 studies found that FDG-PET or FDG-PET/CT had a pooled sensitivity of 96% and a pooled specificity of 74% [158]. Incidentally, intramural hematomas, aortic dissection, arterial pseudoaneurysms, and endoleaks after endovascular aneurysm repair can be visualized by FDG-PET/CT [137]. These rare conditions and incidental findings should be taken into consideration in the interpretation of PET/CT images, and suspected vascular infection may benefit from imaging with FDG-PET/CT in cases that are difficult to diagnose.
One of the minor criteria in the Duke criteria for infective endocarditis is a mycotic aneurysm, which is a relatively rare infected aortic aneurysm with an extremely high mortality rate; therefore, it is crucial to diagnose it early. As described earlier, increased FDG uptake is noted in inflammatory lesions. This suggests that FDG-PET might have an advantage in diagnosing mycotic aneurysms. Murakami et al. demonstrated the possibility of utilizing FDG-PET/CT in the diagnosis of mycotic aneurysms [157]. A few case reports have shown that the sensitivity of FDG-PET/CT in detecting mycotic aneurysms is higher compared to transesophageal echocardiography and CT [159,160,161]. Apart from diagnosing mycotic aneurysms, FDG-PET/CT could be used to assess the effectiveness of antibiotic therapy. In the study of Morimoto et al., there was a decreased FDG uptake in follow-up FDG PET/CT scans of patients who received antibiotics therapy [161].
4.3. FDG-PET in Vascular Diseases of Immunoglobulin G4-Related Disease (IgG4-RD)
Immunoglobulin G4-related disease (IgG4-RD) is an immune-mediated fibroinflammatory disease that can involve multiple organ systems [162,163]. The disease is characterized by IgG4-expressing plasma cell organ infiltration, obliterative phlebitis, and storiform fibrosis. IgG4-RD may affect the vascular system of large-to-medium-sized vessel walls and coronary arteries [164,165,166]. IgG4-related aortitis and/or periaortitis are commonly located in the infrarenal abdominal aorta and iliac arteries [164]. The disease is usually responsive to immunosuppressants but can have severe effects if left untreated, and early recognition of the disease is crucial [167]. Diffuse circumferential thickening and homogenous increased FDG uptake of the walls with or without aortic dilatation is typically seen on FDG-PET/CT. There may sometimes also be focal stenosis with hypermetabolic pseudotumor [168,169]. In a study by Zhang et al., all patients diagnosed with IgG4-RD were found to have hypermetabolic lesion(s) on FDG-PET/CT, and 97.1% (34/35) of these patients showed multiorgan involvement. As many as 25/35 (71.4%) patients had more organ involvement detected by FDG-PET/CT than by conventional evaluations, including a physical examination, ultrasonography, and CT [169]. Another study by Huang et al. with 12 patients assessed the utility of FDG-PET/CT in guiding biopsies for difficult sites, such as the coronary arteries, for the diagnoses of IgG4-RD, in addition to evaluating the disease response and recurrence [166]. Several studies reported an emerging role of FDG-PET/CT for assessing organ involvement, monitoring the therapeutic response, and guiding the interventional treatment of IgG4-RD [169,170,171].
5. Conclusions
The role of PET in vascular disorders continues to grow as its utility in diagnosis and disease monitoring is validated in a variety of inflammatory and infectious conditions. Vascular inflammation as portrayed by FDG, which may play a limited role in assessing atherosclerosis, can also be used in diverse vascular diseases, including thrombotic disorders and vasculitis. NaF, on the other hand, has emerged as a highly sensitive and specific marker of vascular microcalcification in both the major vessels, such as the aorta, and in the coronary arteries. NaF-PET/CT stands promising for the early global assessment of atherosclerosis; however, future prospective and longitudinal studies designed to establish a clear link between NaF uptake and visible macrocalcification remain warranted. Finally, continuous investigation of the use and mechanism of FDG-PET in vascular disorders has the potential to not only complement traditional imaging modalities but also enhance patientcare by allowing prompt diagnosis and treatment.
Author Contributions
P.F.H.-C., A.A. and M.-E.R. conceptualized the manuscript; W.Y.R., P.S.U.P., A.J.B. and M.-E.R. wrote the original manuscript; Y.S., T.J.W., S.J.N. and H.C.L. constructed and received permission for the figures; and T.J.W., S.J.N., H.C.L., P.F.H.-C., A.A. and M.-E.R. revised and edited the manuscript. All authors have read and agreed to the published version of the manuscript.
Funding
This research received no external funding.
Institutional Review Board Statement
Not applicable.
Informed Consent Statement
Not applicable.
Acknowledgments
Figure 3 was generated using www.biorender.com (accessed on 24 September 2021).
Conflicts of Interest
The authors declare no conflict of interest.
References
- Libby, P.; Buring, J.E.; Badimon, L.; Hansson, G.K.; Deanfield, J.; Bittencourt, M.S.; Tokgozoglu, L.; Lewis, E.F. Atherosclerosis. Nat. Rev. Dis. Primers 2019, 5, 56. [Google Scholar] [CrossRef] [PubMed]
- Van Hooser, J.C.; Rouse, K.L.; Meyer, M.L.; Siegler, A.M.; Fruehauf, B.M.; Ballance, E.H.; Solberg, S.M.; Dibble, M.J.; Lutfiyya, M.N. Knowledge of heart attack and stroke symptoms among US Native American Adults: A cross-sectional population-based study analyzing a multi-year BRFSS database. BMC Public Health 2020, 20, 1–10. [Google Scholar] [CrossRef]
- Mayer, M.; Borja, A.J.; Hancin, E.C.; Auslander, T.; Revheim, M.-E.; Moghbel, M.C.; Werner, T.J.; Alavi, A.; Rajapakse, C.S. Imaging Atherosclerosis by PET, With Emphasis on the Role of FDG and NaF as Potential Biomarkers for This Disorder. Front. Physiol. 2020, 11, 511391. [Google Scholar] [CrossRef]
- Paydary, K.; Revheim, M.E.; Emamzadehfard, S.; Gholami, S.; Pourhassan, S.; Werner, T.J.; Hoilund-Carlsen, P.F.; Alavi, A. Quantitative thoracic aorta calcification assessment by (18)F-NaF PET/CT and its correlation with atherosclerotic cardiovascular disorders and increasing age. Eur. Radiol. 2020, 31, 785–794. [Google Scholar] [CrossRef] [PubMed]
- Moghbel, M.; Al-Zaghal, A.; Werner, T.J.; Constantinescu, C.M.; Høilund-Carlsen, P.F.; Alavi, A. The Role of PET in Evaluating Atherosclerosis: A Critical Review. Semin. Nucl. Med. 2018, 48, 488–497. [Google Scholar] [CrossRef] [PubMed]
- Agatston, A.S.; Janowitz, F.W.R.; Hildner, F.J.; Zusmer, N.R.; Viamonte, M., Jr.; Detrano, R. Quantification of coronary artery calcium using ultrafast computed tomography. J. Am. Coll. Cardiol. 1990, 15, 827–832. [Google Scholar] [CrossRef]
- Bergström, G.; Persson, M.; Adiels, M.; Björnson, E.; Bonander, C.; Ahlström, H.; Alfredsson, J.; Angerås, O.; Berglund, G.; Blomberg, A.; et al. Prevalence of Subclinical Coronary Artery Atherosclerosis in the General Population. Circulation 2021, 144, 916–929. [Google Scholar] [CrossRef]
- Oikonomou, E.; Marwan, M.; Desai, M.Y.; Mancio, J.; Alashi, A.; Centeno, E.H.; Thomas, S.; Herdman, L.; Kotanidis, C.; E Thomas, K.; et al. Non-invasive detection of coronary inflammation using computed tomography and prediction of residual cardiovascular risk (the CRISP CT study): A post-hoc analysis of prospective outcome data. Lancet 2018, 392, 929–939. [Google Scholar] [CrossRef]
- Giusca, S.; Schütz, M.; Kronbach, F.; Wolf, D.; Nunninger, P.; Korosoglou, G. Coronary Computer Tomography Angiography in 2021—Acquisition Protocols, Tips and Tricks and Heading beyond the Possible. Diagnostics 2021, 11, 1072. [Google Scholar] [CrossRef]
- Nakahara, T.; Narula, J.; Strauss, H.W. Molecular Imaging of Vulnerable Plaque. Semin. Nucl. Med. 2018, 48, 291–298. [Google Scholar] [CrossRef]
- Nakahara, T.; Dweck, M.R.; Narula, N.; Pisapia, D.; Narula, J.; Strauss, H.W. Coronary Artery Calcification: From Mechanism to Molecular Imaging. JACC Cardiovasc. Imaging 2017, 10, 582–593. [Google Scholar] [CrossRef] [PubMed]
- Libby, P.; Hansson, G.K. From Focal Lipid Storage to Systemic Inflammation. J. Am. Coll. Cardiol. 2019, 74, 1594–1607. [Google Scholar] [CrossRef] [PubMed]
- Libby, P. Inflammation in atherosclerosis. Nature 2002, 420, 868–874. [Google Scholar] [CrossRef]
- Joshi, N.V.; Vesey, A.T.; Williams, M.C.; Shah, A.S.V.; A Calvert, P.; Craighead, F.H.M.; Yeoh, S.E.; Wallace, W.; Salter, D.; Fletcher, A.M.; et al. 18F-fluoride positron emission tomography for identification of ruptured and high-risk coronary atherosclerotic plaques: A prospective clinical trial. Lancet 2014, 383, 705–713. [Google Scholar] [CrossRef]
- Arbab-Zadeh, A.; Fuster, V. The myth of the “vulnerable plaque”: Transitioning from a focus on individual lesions to atherosclerotic disease burden for coronary artery disease risk assessment. J. Am. Coll. Cardiol. 2015, 65, 846–855. [Google Scholar] [CrossRef] [PubMed]
- Stefanadis, C.; Antoniou, C.; Tsiachris, D.; Pietri, P. Coronary Atherosclerotic Vulnerable Plaque: Current Perspectives. J. Am. Hear. Assoc. 2017, 6, e005543. [Google Scholar] [CrossRef]
- Chowdhury, M.; Tarkin, J.; Evans, N.; Le, E.; Warburton, L.; Hayes, P.; Rudd, J.; A Coughlin, P. 18F-FDG Uptake on PET/CT in Symptomatic versus Asymptomatic Carotid Disease: A Meta-Analysis. Eur J Vasc Endovasc Surg 2018, 56, 172–179. [Google Scholar] [CrossRef]
- Skagen, K.; Johnsrud, K.; Evensen, K.; Scott, H.; Krohg-Sørensen, K.; Reier-Nilsen, F.; Revheim, M.-E.; Fjeld, J.G.; Skjelland, M.; Russell, D. Carotid Plaque Inflammation Assessed with 18F-FDG PET/CT is Higher in Symptomatic Compared with Asymptomatic Patients. Int. J. Stroke 2015, 10, 730–736. [Google Scholar] [CrossRef]
- McKenney-Drake, M.L.; Territo, P.R.; Salavati, A.; Houshmand, S.; Persohn, S.; Liang, Y.; Alloosh, M.; Moe, S.M.; Weaver, C.M.; Alavi, A.; et al. 18F-NaF PET Imaging of Early Coronary Artery Calcification. JACC Cardiovasc. Imaging 2016, 9, 627–628. [Google Scholar] [CrossRef]
- Nakahara, T.; Narula, J.; Strauss, H.W. NaF uptake in unstable plaque: What does fluoride uptake mean? Eur. J. Nucl. Med. Mol. Imaging 2018, 45, 2250–2252. [Google Scholar] [CrossRef]
- Grant, F.D.; Fahey, F.H.; Packard, A.B.; Davis, R.T.; Alavi, A.; Treves, S.T. Skeletal PET with 18F-Fluoride: Applying New Technology to an Old Tracer. J. Nucl. Med. 2008, 49, 68–78. [Google Scholar] [CrossRef]
- Park, P.; Raynor, W.; Sun, Y.; Werner, T.; Rajapakse, C.; Alavi, A. 18F-Sodium Fluoride PET as a Diagnostic Modality for Metabolic, Autoimmune, and Osteogenic Bone Disorders: Cellular Mechanisms and Clinical Applications. Int. J. Mol. Sci. 2021, 22, 6504. [Google Scholar] [CrossRef] [PubMed]
- Yun, M.; Yeh, D.; Araujo, L.I.; Jang, S.; Newberg, A.; Alavi, A. F-18 FDG uptake in the large arteries: A new observation. Clin. Nucl. Med. 2001, 26, 314–319. [Google Scholar] [CrossRef]
- van der Valk, F.M.; Verweij, S.L.; Zwinderman, K.A.; Strang, A.C.; Kaiser, Y.; Marquering, H.A.; Nederveen, A.J.; Stroes, E.S.; Verberne, H.J.; Rudd, J.H. Thresholds for Arterial Wall Inflammation Quantified by (18)F-FDG PET Imaging: Implications for Vascular Interventional Studies. JACC Cardiovasc. Imaging 2016, 9, 1198–1207. [Google Scholar] [CrossRef] [PubMed]
- Tawakol, A.; Migrino, R.Q.; Bashian, G.G.; Bedri, S.; Vermylen, D.; Cury, R.C.; Yates, D.; LaMuraglia, G.M.; Furie, K.; Houser, S.; et al. In Vivo 18F-Fluorodeoxyglucose Positron Emission Tomography Imaging Provides a Noninvasive Measure of Carotid Plaque Inflammation in Patients. J. Am. Coll. Cardiol. 2006, 48, 1818–1824. [Google Scholar] [CrossRef]
- Myers, K.S.; Rudd, J.H.; Hailman, E.P.; Bolognese, J.A.; Burke, J.; Pinto, C.A.; Klimas, M.; Hargreaves, R.; Dansky, H.M.; Fayad, Z.A. Correlation Between Arterial FDG Uptake and Biomarkers in Peripheral Artery Disease. JACC Cardiovasc. Imaging 2012, 5, 38–45. [Google Scholar] [CrossRef]
- Yun, M.; Jang, S.; Cucchiara, A.; Newberg, A.B.; Alavi, A. 18F FDG uptake in the large arteries: A correlation study with the atherogenic risk factors. Semin. Nucl. Med. 2002, 32, 70–76. [Google Scholar] [CrossRef] [PubMed]
- Bural, G.G.; Torigian, D.A.; Chamroonrat, W.; Houseni, M.; Chen, W.; Basu, S.; Kumar, R.; Alavi, A. FDG-PET is an effective imaging modality to detect and quantify age-related atherosclerosis in large arteries. Eur. J. Nucl. Med. Mol. Imaging 2008, 35, 562–569. [Google Scholar] [CrossRef]
- Strobl, F.F.; Rominger, A.; Wolpers, S.; Rist, C.; Bamberg, F.; Thierfelder, K.M.; Nikolaou, K.; Uebleis, C.; Hacker, M.; Reiser, M.F.; et al. Impact of cardiovascular risk factors on vessel wall inflammation and calcified plaque burden differs across vascular beds: A PET-CT study. Int. J. Cardiovasc. Imaging 2013, 29, 1899–1908. [Google Scholar] [CrossRef]
- Pasha, A.K.; Moghbel, M.; Saboury, B.; Gharavi, M.H.; A Blomberg, B.; A Torigian, D.; Kwee, T.C.; Basu, S.; Iii, E.R.M.; Alavi, A. Effects of age and cardiovascular risk factors on 18F-FDG PET/CT quantification of atherosclerosis in the aorta and peripheral arteries. Hell. J. Nucl. Med. 2015, 18, 5–10. [Google Scholar] [CrossRef]
- Rudd, J.H.; Warburton, E.A.; Fryer, T.D.; Jones, H.A.; Clark, J.C.; Antoun, N.; Johnström, P.; Davenport, A.P.; Kirkpatrick, P.J.; Arch, B.N.; et al. Imaging atherosclerotic plaque inflammation with [18F]-fluorodeoxyglucose positron emission tomography. Circulation 2002, 105, 2708–2711. [Google Scholar] [CrossRef] [PubMed]
- Al-Zaghal, A.; Aras, M.; Borja, A.J.; Moghbel, M.; Demir, Y.; Houshmand, S.; Ciftci, E.; Werner, T.J.; Høilund-Carlsen, P.F.; A Torigian, D.; et al. Detection of pulmonary artery atherosclerosis by FDG-PET/CT: A new observation. Am. J. Nucl. Med. Mol. Imaging 2020, 10, 127–134. [Google Scholar] [PubMed]
- Arani, L.S.; Gharavi, M.H.; Zadeh, M.Z.; Raynor, W.; Seraj, S.M.; Constantinescu, C.; Gerke, O.; Werner, T.J.; Høilund-Carlsen, P.F.; Alavi, A. Association between age, uptake of 18F-fluorodeoxyglucose and of 18F-sodium fluoride, as cardiovascular risk factors in the abdominal aorta. Hell. J. Nucl. Med. 2019, 22, 14–19. [Google Scholar]
- Blomberg, B.A.; De Jong, P.A.; Thomassen, A.; Lam, M.G.E.; Vach, W.; Olsen, M.H.; Mali, W.P.T.M.; Narula, J.; Alavi, A.; Høilund-Carlsen, P.F. Thoracic aorta calcification but not inflammation is associated with increased cardiovascular disease risk: Results of the CAMONA study. Eur. J. Nucl. Med. Mol. Imaging 2017, 44, 249–258. [Google Scholar] [CrossRef]
- Ben-Haim, S.; Kupzov, E.; Tamir, A.; Israel, O. Evaluation of 18F-FDG uptake and arterial wall calcifications using 18F-FDG PET/CT. J. Nucl. Med. 2004, 45, 1816–1821. [Google Scholar]
- Tatsumi, M.; Cohade, C.; Nakamoto, Y.; Wahl, R.L. Fluorodeoxyglucose Uptake in the Aortic Wall at PET/CT: Possible Finding for Active Atherosclerosis. Radiology 2003, 229, 831–837. [Google Scholar] [CrossRef] [PubMed]
- Meirelles, G.S.; Gonen, M.; Strauss, H.W. 18F-FDG uptake and calcifications in the thoracic aorta on positron emission tomography/computed tomography examinations: Frequency and stability on serial scans. J. Thorac. Imaging 2011, 26, 54–62. [Google Scholar] [CrossRef]
- Tawakol, A.; Ishai, A.; AP Takx, R.; Figueroa, A.L.; Ali, A.; Kaiser, Y.; A Truong, Q.; Solomon, C.J.; Calcagno, C.; Mani, V.; et al. Relation between resting amygdalar activity and cardiovascular events: A longitudinal and cohort study. Lancet 2017, 389, 834–845. [Google Scholar] [CrossRef]
- Blomberg, B.A.; Thomassen, A.; Takx, R.A.P.; Hildebrandt, M.G.; Simonsen, J.A.; Buch-Olsen, K.M.; Diederichsen, A.C.P.; Mickley, H.; Alavi, A.; Høilund-Carlsen, P.F. Delayed 18F-fluorodeoxyglucose PET/CT imaging improves quantitation of atherosclerotic plaque inflammation: Results from the CAMONA study. J. Nucl. Cardiol. 2014, 21, 588–597. [Google Scholar] [CrossRef]
- Derlin, T.; Richter, U.; Bannas, P.; Begemann, P.; Buchert, R.; Mester, J.; Klutmann, S. Feasibility of 18F-Sodium Fluoride PET/CT for Imaging of Atherosclerotic Plaque. J. Nucl. Med. 2010, 51, 862–865. [Google Scholar] [CrossRef]
- Derlin, T.; Wisotzki, C.; Richter, U.; Apostolova, I.; Bannas, P.; Weber, C.; Mester, J.; Klutmann, S. In Vivo Imaging of Mineral Deposition in Carotid Plaque Using 18F-Sodium Fluoride PET/CT: Correlation with Atherogenic Risk Factors. J. Nucl. Med. 2011, 52, 362–368. [Google Scholar] [CrossRef] [PubMed]
- Beheshti, M.; Saboury, B.; Mehta, N.N.; A Torigian, D.; Werner, T.; Mohler, E.; Wilensky, R.; Newberg, A.; Basu, S.; Langsteger, W.; et al. Detection and global quantification of cardiovascular molecular calcification by fluoro18-fluoride positron emission tomography/computed tomography—A novel concept. Hell. J. Nucl. Med. 2011, 14, 114–120. [Google Scholar] [PubMed]
- Piri, R.; Lici, G.; Riyahimanesh, P.; Gerke, O.; Alavi, A.; Høilund-Carlsen, P.F. Two-year change in 18F-sodium fluoride uptake in major arteries of healthy subjects and angina pectoris patients. Int. J. Cardiovasc. Imaging 2021, 37, 3115–3126. [Google Scholar] [CrossRef] [PubMed]
- Blomberg, B.A.; Thomassen, A.; de Jong, P.A.; Lam, M.G.E.; Diederichsen, A.C.P.; Olsen, M.H.; Mickley, H.; Mali, W.; Alavi, A.; Høilund-Carlsen, P.F. Coronary fluorine-18-sodium fluoride uptake is increased in healthy adults with an unfavorable cardiovascular risk profile: Results from the CAMONA study. Nucl. Med. Commun. 2017, 38, 1007–1014. [Google Scholar] [CrossRef]
- Janssen, T.; Bannas, P.; Herrmann, J.; Veldhoen, S.; Busch, J.D.; Treszl, A.; Münster, S.; Mester, J.; Derlin, T. Association of linear 18F-sodium fluoride accumulation in femoral arteries as a measure of diffuse calcification with cardiovascular risk factors: A PET/CT study. J. Nucl. Cardiol. 2013, 20, 569–577. [Google Scholar] [CrossRef]
- Zhang, V.; Borja, A.J.; Rojulpote, C.; Padmanabhan, S.; Patil, S.; Gonuguntla, K.; Revheim, M.-E.; Werner, T.J.; Høilund-Carlsen, P.F.; Alavi, A. Global quantification of pulmonary artery atherosclerosis using 18F-sodium fluoride PET/CT in at-risk subjects. Am. J. Nucl. Med. Mol. Imaging 2020, 10, 119–126. [Google Scholar]
- Kwiecinski, J.; Tzolos, E.; Adamson, P.D.; Cadet, S.; Moss, A.J.; Joshi, N.; Williams, M.C.; van Beek, E.J.; Dey, D.; Berman, D.S.; et al. Coronary 18F-Sodium Fluoride Uptake Predicts Outcomes in Patients with Coronary Artery Disease. J. Am. Coll. Cardiol. 2020, 75, 3061–3074. [Google Scholar] [CrossRef]
- Kitagawa, T.; Yamamoto, H.; Nakamoto, Y.; Sasaki, K.; Toshimitsu, S.; Tatsugami, F.; Awai, K.; Hirokawa, Y.; Kihara, Y. Predictive Value of 18 F-Sodium Fluoride Positron Emission Tomography in Detecting High-Risk Coronary Artery Disease in Combination With Computed Tomography. J. Am. Hear. Assoc. 2018, 7, e010224. [Google Scholar] [CrossRef]
- Patil, S.; Rojulpote, C.; Gonuguntla, K.; Karambelkar, P.; Bhattaru, A.; Raynor, W.; Borja, A.J.; Vuthaluru, K.; Zhang, V.; Werner, T.J.; et al. Association of triglyceride to high density lipoprotein ratio with global cardiac microcalcification to evaluate subclinical coronary atherosclerosis in non-diabetic individuals. Am. J. Cardiovasc. Dis. 2020, 10, 241–246. [Google Scholar]
- Rojulpote, C.; Patil, S.; Gonuguntla, K.; Karambelkar, P.; Bravo, P.E.; Seraj, S.M.; Asadollahi, S.; Raynor, W.Y.; Bhattaru, A.; Borja, A.J.; et al. NaF-PET/CT global assessment in detecting and quantifying subclinical cardiac atherosclerosis and its association with blood pressure in non-dyslipidemic individuals. Am. J. Cardiovasc. Dis. 2020, 10, 101–107. [Google Scholar]
- Borja, A.J.; Bhattaru, A.; Rojulpote, C.; Hancin, E.C.; Detchou, D.K.; Patil, S.; Gonuguntla, K.; Karambelkar, P.; Chinta, S.; Vuthaluru, K.; et al. Association between atherosclerotic cardiovascular disease risk score estimated by pooled cohort equation and coronary plaque burden as assessed by NaF-PET/CT. Am. J. Nucl. Med. Mol. Imaging 2020, 10, 312–318. [Google Scholar]
- Gonuguntla, K.; Rojulpote, C.; Patil, S.; Bhattaru, A.; Karambelkar, P.; Vuthaluru, K.; Raynor, W.Y.; Borja, A.J.; Zhang, V.; Werner, T.J.; et al. Utilization of NaF-PET/CT in assessing global cardiovascular calcification using CHADS2 and CHADS2-VASc scoring systems in high risk individuals for cardiovascular disease. Am. J. Nucl. Med. Mol. Imaging 2020, 10, 293–300. [Google Scholar] [PubMed]
- Dweck, M.R.; Chow, M.W.; Joshi, N.V.; Williams, M.C.; Jones, C.; Fletcher, A.M.; Richardson, H.; White, A.; McKillop, G.; van Beek, E.J.; et al. Coronary Arterial 18F-Sodium Fluoride Uptake: A Novel Marker of Plaque Biology. J. Am. Coll. Cardiol. 2012, 59, 1539–1548. [Google Scholar] [CrossRef] [PubMed]
- Morbelli, S.; Fiz, F.; Piccardo, A.; Picori, L.; Massollo, M.; Pestarino, E.; Marini, C.; Cabria, M.; Democrito, A.; Cittadini, G.; et al. Divergent determinants of 18F-NaF uptake and visible calcium deposition in large arteries: Relationship with Framingham risk score. Int. J. Cardiovasc. Imaging 2014, 30, 439–447. [Google Scholar] [CrossRef] [PubMed]
- Li, X.; Heber, D.; Gonzalez, J.C.; Karanikas, G.; Mayerhoefer, M.E.; Rasul, S.; Beitzke, D.; Zhang, X.; Agis, H.; Mitterhauser, M.; et al. Association Between Osteogenesis and Inflammation During the Progression of Calcified Plaque Evaluated by 18F-Fluoride and 18F-FDG. J. Nucl. Med. 2017, 58, 968–974. [Google Scholar] [CrossRef] [PubMed]
- Lee, J.M.; Bang, J.-I.; Koo, B.-K.; Hwang, D.; Park, J.; Zhang, J.; Yaliang, T.; Suh, M.; Paeng, J.C.; Shiono, Y.; et al. Clinical Relevance of 18 F-Sodium Fluoride Positron-Emission Tomography in Noninvasive Identification of High-Risk Plaque in Patients with Coronary Artery Disease. Circ. Cardiovasc. Imaging 2017, 10. [Google Scholar] [CrossRef]
- Marchesseau, S.; Seneviratna, A.; Sjöholm, T.; Qin, D.L.; Ho, J.X.M.; Hausenloy, D.J.; Townsend, D.W.; Richards, A.M.; Totman, J.J.; Chan, M.Y.Y. Hybrid PET/CT and PET/MRI imaging of vulnerable coronary plaque and myocardial scar tissue in acute myocardial infarction. J. Nucl. Cardiol. 2017, 25, 2001–2011. [Google Scholar] [CrossRef]
- Ishiwata, Y.; Kaneta, T.; Nawata, S.; Hino-Shishikura, A.; Yoshida, K.; Inoue, T. Quantification of temporal changes in calcium score in active atherosclerotic plaque in major vessels by 18F-sodium fluoride PET/CT. Eur. J. Nucl. Med. Mol. Imaging 2017, 44, 1529–1537. [Google Scholar] [CrossRef]
- Fiz, F.; Morbelli, S.; Bauckneht, M.; Piccardo, A.; Ferrarazzo, G.; Nieri, A.; Artom, N.; Cabria, M.; Marini, C.; Canepa, M.; et al. Correlation between thoracic aorta 18F-natrium fluoride uptake and cardiovascular risk. World J. Radiol. 2016, 8, 82–89. [Google Scholar] [CrossRef]
- Arani, L.S.; Zadeh, M.Z.; Saboury, B.; Revheim, M.-E.; Øestergaard, B.; Borja, A.J.; Samarin, D.S.; Seraj, S.M.; Kalbush, E.; Ayubcha, C.; et al. Assessment of atherosclerosis in multiple myeloma and smoldering myeloma patients using 18F- sodium fluoride PET/CT. J. Nucl. Cardiol. 2021, 1–11. [Google Scholar] [CrossRef]
- Takx, R.A.P.; van Asperen, R.; Bartstra, J.W.; Zwakenberg, S.R.; Wolterink, J.M.; Celeng, C.; de Jong, P.A.; Beulens, J.W. Determinants of (18)F-NaF uptake in femoral arteries in patients with type 2 diabetes mellitus. J. Nucl. Cardiol. 2020, 1–6. [Google Scholar] [CrossRef]
- Sorci, O.; Batzdorf, A.S.; Mayer, M.; Rhodes, S.; Peng, M.; Jankelovits, A.R.; Hornyak, J.; Gerke, O.; Høilund-Carlsen, P.F.; Alavi, A.; et al. 18F-sodium fluoride PET/CT provides prognostic clarity compared to calcium and Framingham risk scoring when addressing whole-heart arterial calcification. Eur. J. Nucl. Med. Mol. Imaging 2020, 47, 1678–1687. [Google Scholar] [CrossRef]
- Piri, R.; Edenbrandt, L.; Larsson, M.; Enqvist, O.; Nøddeskou-Fink, A.H.; Gerke, O.; Høilund-Carlsen, P.F. Aortic wall segmentation in 18F-sodium fluoride PET/CT scans: Head-to-head comparison of artificial intelligence-based versus manual segmentation. J. Nucl. Cardiol. 2021, 1–10. [Google Scholar] [CrossRef]
- Piri, R.; Edenbrandt, L.; Larsson, M.; Enqvist, O.; Skovrup, S.; Iversen, K.K.; Saboury, B.; Alavi, A.; Gerke, O.; Høilund-Carlsen, P.F. “Global” cardiac atherosclerotic burden assessed by artificial intelligence-based versus manual segmentation in 18F-sodium fluoride PET/CT scans: Head-to-head comparison. J. Nucl. Cardiol. 2021, 1–9. [Google Scholar] [CrossRef] [PubMed]
- Crowther, M.A. Pathogenesis of Atherosclerosis. Hematology 2005, 2005, 436–441. [Google Scholar] [CrossRef] [PubMed]
- Li, H.; Cybulsky, M.; A Gimbrone, M.; Libby, P. An atherogenic diet rapidly induces VCAM-1, a cytokine-regulatable mononuclear leukocyte adhesion molecule, in rabbit aortic endothelium. Arter. Thromb. A J. Vasc. Biol. 1993, 13, 197–204. [Google Scholar] [CrossRef]
- Wenger, N.K. Prevention of Cardiovascular Disease: Highlights for the Clinician of the 2013 American College of Cardiology/American Heart Association Guidelines. Clin. Cardiol. 2014, 37, 239–251. [Google Scholar] [CrossRef][Green Version]
- Heidenreich, P.A.; Trogdon, J.G.; Khavjou, O.A.; Butler, J.; Dracup, K.; Ezekowitz, M.D.; Finkelstein, E.A.; Hong, Y.; Johnston, S.C.; Khera, A.; et al. Forecasting the future of cardiovascular disease in the United States: A policy statement from the American Heart Association. Circulation 2011, 123, 933–944. [Google Scholar] [CrossRef] [PubMed]
- Sidney, S.; Quesenberry, C.P.; Jaffe, M.G.; Sorel, M.; Nguyen-Huynh, M.N.; Kushi, L.H.; Go, A.S.; Rana, J.S. Recent Trends in Cardiovascular Mortality in the United States and Public Health Goals. JAMA Cardiol. 2016, 1, 594–599. [Google Scholar] [CrossRef]
- Herrington, W.; Lacey, B.; Sherliker, P.; Armitage, J.; Lewington, S. Epidemiology of Atherosclerosis and the Potential to Reduce the Global Burden of Atherothrombotic Disease. Circ. Res. 2016, 118, 535–546. [Google Scholar] [CrossRef]
- Syed, M.B.; Fletcher, A.; O Forsythe, R.; Kaczynski, J.; E Newby, D.; Dweck, M.R.; Van Beek, E.J. Emerging techniques in atherosclerosis imaging. Br. J. Radiol. 2019, 92, 20180309. [Google Scholar] [CrossRef]
- Takx, R.A.; Partovi, S.; Ghoshhajra, B.B. Imaging of atherosclerosis. Int. J. Cardiovasc. Imaging 2016, 32, 5–12. [Google Scholar] [CrossRef] [PubMed]
- Raynor, W.; Borja, A.J.; Rojulpote, C.; Høilund-Carlsen, P.F.; Alavi, A. 18F-sodium fluoride: An emerging tracer to assess active vascular microcalcification. J. Nucl. Cardiol. 2020, 1–6. [Google Scholar] [CrossRef]
- Høilund-Carlsen, P.F.; Moghbel, M.C.; Gerke, O.; Alavi, A. Evolving Role of PET in Detecting and Characterizing Atherosclerosis. PET Clin. 2019, 14, 197–209. [Google Scholar] [CrossRef]
- Blomberg, B.A.; Bashyam, A.; Ramachandran, A.; Gholami, S.; Houshmand, S.; Salavati, A.; Werner, T.; Zaidi, H.; Alavi, A. Quantifying [18F]fluorodeoxyglucose uptake in the arterial wall: The effects of dual time-point imaging and partial volume effect correction. Eur. J. Nucl. Med. Mol. Imaging 2015, 42, 1414–1422. [Google Scholar] [CrossRef] [PubMed]
- McKenney-Drake, M.L.; Moghbel, M.C.; Paydary, K.; Alloosh, M.; Houshmand, S.; Moe, S.; Salavati, A.; Sturek, J.M.; Territo, P.R.; Weaver, C.; et al. 18F-NaF and 18F-FDG as molecular probes in the evaluation of atherosclerosis. Eur. J. Nucl. Med. Mol. Imaging 2018, 45, 2190–2200. [Google Scholar] [CrossRef] [PubMed]
- Rosenbaum, D.; Millon, A.; Fayad, Z.A. Molecular imaging in atherosclerosis: FDG PET. Curr. Atheroscler. Rep. 2012, 14, 429–437. [Google Scholar] [CrossRef]
- Evans, N.R.; Tarkin, J.M.; Chowdhury, M.M.; Warburton, E.A.; Rudd, J.H.F. PET Imaging of Atherosclerotic Disease: Advancing Plaque Assessment from Anatomy to Pathophysiology. Curr. Atheroscler. Rep. 2016, 18, 30. [Google Scholar] [CrossRef]
- Mb, M.M.; Merwick, A.; Mb, O.C.S.; Hannon, N.; Foran, P.; Grant, T.; Dolan, E.; Moroney, J.; Murphy, S.; O’Rourke, K.; et al. Carotid plaque inflammation on 18F-fluorodeoxyglucose positron emission tomography predicts early stroke recurrence. Ann. Neurol. 2012, 71, 709–718. [Google Scholar] [CrossRef]
- Figueroa, A.L.; Subramanian, S.S.; Cury, R.C.; Truong, Q.A.; Gardecki, J.A.; Tearney, G.J.; Hoffmann, U.; Brady, T.J.; Tawakol, A. Distribution of inflammation within carotid atherosclerotic plaques with high-risk morphological features: A comparison between positron emission tomography activity, plaque morphology, and histopathology. Circ. Cardiovasc. Imaging 2012, 5, 69–77. [Google Scholar] [CrossRef]
- Alavi, A.; Werner, T.J.; Høilund-Carlsen, P.F. What can be and what cannot be accomplished with PET to detect and characterize atherosclerotic plaques. J. Nucl. Cardiol. 2017, 25, 2012–2015. [Google Scholar] [CrossRef]
- Wykrzykowska, J.; Lehman, S.; Williams, G.; Parker, J.A.; Palmer, M.R.; Varkey, S.; Kolodny, G.; Laham, R. Imaging of Inflamed and Vulnerable Plaque in Coronary Arteries with 18F-FDG PET/CT in Patients with Suppression of Myocardial Uptake Using a Low-Carbohydrate, High-Fat Preparation. J. Nucl. Med. 2009, 50, 563–568. [Google Scholar] [CrossRef] [PubMed]
- Williams, G.; Kolodny, G.M. Suppression of Myocardial18F-FDG Uptake by Preparing Patients with a High-Fat, Low-Carbohydrate Diet. Am. J. Roentgenol. 2008, 190, W151–W156. [Google Scholar] [CrossRef]
- Sheikine, Y.; Akram, K. FDG–PET imaging of atherosclerosis: Do we know what we see? Atherosclerosis 2010, 211, 371–380. [Google Scholar] [CrossRef] [PubMed]
- Stiekema, L.C.A.; Schnitzler, J.G.; Nahrendorf, M.; Stroes, E.S.G. The maturation of a ‘neural-hematopoietic’ inflammatory axis in cardiovascular disease. Curr. Opin. Lipidol. 2017, 28, 507–512. [Google Scholar] [CrossRef]
- Heidt, T.; Sager, H.B.; Courties, G.; Dutta, P.; Iwamoto, Y.; Zaltsman, A.; Muhlen, C.V.Z.; Bode, C.; Fricchione, G.L.; Denninger, J.; et al. Chronic variable stress activates hematopoietic stem cells. Nat. Med. 2014, 20, 754–758. [Google Scholar] [CrossRef] [PubMed]
- Blebea, J.S.; Houseni, M.; Torigian, D.A.; Fan, C.; Mavi, A.; Zhuge, Y.; Iwanaga, T.; Mishra, S.; Udupa, J.; Zhuang, J.; et al. Structural and Functional Imaging of Normal Bone Marrow and Evaluation of Its Age-Related Changes. Semin. Nucl. Med. 2007, 37, 185–194. [Google Scholar] [CrossRef]
- Basu, S.; Houseni, M.; Bural, G.; Chamroonat, W.; Udupa, J.; Mishra, S.; Alavi, A. Magnetic Resonance Imaging Based Bone Marrow Segmentation for Quantitative Calculation of Pure Red Marrow Metabolism Using 2-Deoxy-2-[F-18]fluoro-d-glucose- Positron Emission Tomography: A Novel Application with Significant Implications for Combined Structure–Function Approach. Mol. Imaging Biol. 2007, 9, 361–365. [Google Scholar] [CrossRef]
- Fan, C.; Hernandez-Pampaloni, M.; Houseni, M.; Chamroonrat, W.; Basu, S.; Kumar, R.; Dadparvar, S.; Torigian, D.A.; Alavi, A. Age-Related Changes in the Metabolic Activity and Distribution of the Red Marrow as Demonstrated by 2-Deoxy-2-[F-18]fluoro-d-glucose-Positron Emission Tomography. Mol. Imaging Biol. 2007, 9, 300–307. [Google Scholar] [CrossRef]
- Liu, Y. Clinical significance of diffusely increased splenic uptake on FDG-PET. Nucl. Med. Commun. 2009, 30, 763–769. [Google Scholar] [CrossRef]
- Saboury, B.; Edenbrandt, L.; Piri, R.; Gerke, O.; Werner, T.; Arbab-Zadeh, A.; Alavi, A.; Høilund-Carlsen, P. Alavi–Carlsen Calcification Score (ACCS): A Simple Measure of Global Cardiac Atherosclerosis Burden. Diagnostics 2021, 11, 1421. [Google Scholar] [CrossRef]
- Huet, P.; Burg, S.; Le Guludec, D.; Hyafil, F.; Buvat, I. Variability and Uncertainty of 18F-FDG PET Imaging Protocols for Assessing Inflammation in Atherosclerosis: Suggestions for Improvement. J. Nucl. Med. 2015, 56, 552–559. [Google Scholar] [CrossRef]
- Irkle, A.; Vesey, A.T.; Lewis, D.; Skepper, J.N.; Bird, J.; Dweck, M.; Joshi, F.R.; Gallagher, F.A.; Warburton, E.A.; Bennett, M.; et al. Identifying active vascular microcalcification by 18F-sodium fluoride positron emission tomography. Nat. Commun. 2015, 6, 7495. [Google Scholar] [CrossRef]
- Raynor, W.; Houshmand, S.; Gholami, S.; Emamzadehfard, S.; Rajapakse, C.S.; Blomberg, B.A.; Werner, T.J.; Høilund-Carlsen, P.F.; Baker, J.F.; Alavi, A. Evolving Role of Molecular Imaging with 18F-Sodium Fluoride PET as a Biomarker for Calcium Metabolism. Curr. Osteoporos. Rep. 2016, 14, 115–125. [Google Scholar] [CrossRef]
- Høilund-Carlsen, P.F.; Sturek, M.; Alavi, A.; Gerke, O. Atherosclerosis imaging with 18F-sodium fluoride PET: State-of-the-art review. Eur. J. Nucl. Med. Mol. Imaging 2020, 47, 1538–1551. [Google Scholar] [CrossRef] [PubMed]
- Chen, W.; Dilsizian, V. PET Assessment of Vascular Inflammation and Atherosclerotic Plaques: SUV or TBR? J. Nucl. Med. 2015, 56, 503–504. [Google Scholar] [CrossRef]
- Høilund-Carlsen, P.F.; Piri, R.; Gerke, O.; Edenbrandt, L.; Alavi, A. Assessment of Total-Body Atherosclerosis by PET/Computed Tomography. PET Clin. 2021, 16, 119–128. [Google Scholar] [CrossRef] [PubMed]
- Slomka, P.J.; Pan, T.; Berman, D.S.; Germano, G. Advances in SPECT and PET Hardware. Prog. Cardiovasc. Dis. 2015, 57, 566–578. [Google Scholar] [CrossRef] [PubMed]
- Tison, G.H.; Guo, M.; Blaha, M.J.; McClelland, R.L.; Allison, M.A.; Szklo, M.; Wong, N.D.; Blumenthal, R.S.; Budoff, M.J.; Nasir, K. Multisite extracoronary calcification indicates increased risk of coronary heart disease and all-cause mortality: The Multi-Ethnic Study of Atherosclerosis. J. Cardiovasc. Comput. Tomogr. 2015, 9, 406–414. [Google Scholar] [CrossRef]
- Adar, A.; Erkan, H.; Gokdeniz, T.; Karadeniz, A.; Cavusoglu, I.G.; Onalan, O. Aortic arch calcification is strongly associated with coronary artery calcification. Vasa 2015, 44, 106–114. [Google Scholar] [CrossRef] [PubMed]
- Høilund-Carlsen, P.F.; Edenbrandt, L.; Alavi, A. Global disease score (GDS) is the name of the game! Eur. J. Nucl. Med. Mol. Imaging 2019, 46, 1768–1772. [Google Scholar] [CrossRef]
- Tarkin, J.M.; Joshi, F.R.; Evans, N.R.; Chowdhury, M.M.; Figg, N.L.; Shah, A.V.; Starks, L.T.; Martin-Garrido, A.; Manavaki, R.; Yu, E.; et al. Detection of Atherosclerotic Inflammation by (68)Ga-DOTATATE PET Compared to [(18)F]FDG PET Imaging. J Am. Coll. Cardiol. 2017, 69, 1774–1791. [Google Scholar] [CrossRef]
- Laitinen, I.; Marjamäki, P.; Någren, K.; Laine, V.J.O.; Wilson, I.; Leppänen, P.; Ylä-Herttuala, S.; Roivainen, A.; Knuuti, J. Uptake of inflammatory cell marker [11C]PK11195 into mouse atherosclerotic plaques. Eur. J. Nucl. Med. Mol. Imaging 2008, 36, 73–80. [Google Scholar] [CrossRef]
- Pillarisetti, K.; Gupta, S.K. Cloning and Relative Expression Analysis of Rat Stromal Cell Derived Factor-1 (SDF-1): SDF-1 α mRNA Is Selectively Induced in Rat Model of Myocardial Infarction. Inflammation 2001, 25, 293–300. [Google Scholar] [CrossRef]
- Hu, X.; Dai, S.; Wu, W.J.; Tan, W.; Zhu, X.; Mu, J.; Guo, Y.; Bolli, R.; Rokosh, G. Stromal cell derived factor-1 alpha confers protection against myocardial ischemia/reperfusion injury: Role of the cardiac stromal cell derived factor-1 alpha CXCR4 axis. Circulation 2007, 116, 654–663. [Google Scholar] [CrossRef] [PubMed]
- Derlin, T.; Sedding, D.G.; Dutzmann, J.; Haghikia, A.; König, T.; Napp, L.C.; Schütze, C.; Owsianski-Hille, N.; Wester, H.-J.; Kropf, S.; et al. Imaging of chemokine receptor CXCR4 expression in culprit and nonculprit coronary atherosclerotic plaque using motion-corrected [68Ga]pentixafor PET/CT. Eur. J. Nucl. Med. Mol. Imaging 2018, 45, 1934–1944. [Google Scholar] [CrossRef] [PubMed]
- Hyafil, F.; Pelisek, J.; Laitinen, I.; Schottelius, M.; Mohring, M.; Döring, Y.; van der Vorst, E.P.; Kallmayer, M.; Steiger, K.; Poschenrieder, A.; et al. Imaging the Cytokine Receptor CXCR4 in Atherosclerotic Plaques with the Radiotracer 68Ga-Pentixafor for PET. J. Nucl. Med. 2017, 58, 499–506. [Google Scholar] [CrossRef] [PubMed]
- Lapa, C.; Reiter, T.; Werner, R.A.; Ertl, G.; Wester, H.-J.; Buck, A.; Bauer, W.; Herrmann, K. [68Ga]Pentixafor-PET/CT for Imaging of Chemokine Receptor 4 Expression After Myocardial Infarction. JACC: Cardiovasc. Imaging 2015, 8, 1466–1468. [Google Scholar] [CrossRef] [PubMed]
- Kircher, M.; Tran-Gia, J.; Kemmer, L.; Zhang, X.; Schirbel, A.; Werner, R.A.; Buck, A.K.; Wester, H.-J.; Hacker, M.; Lapa, C.; et al. Imaging Inflammation in Atherosclerosis with CXCR4-Directed 68Ga-Pentixafor PET/CT: Correlation with 18F-FDG PET/CT. J. Nucl. Med. 2019, 61, 751–756. [Google Scholar] [CrossRef] [PubMed]
- Weiberg, D.; Thackeray, J.T.; Daum, G.; Sohns, J.S.; Kropf, S.; Wester, H.-J.; Ross, T.L.; Bengel, F.; Derlin, T. Clinical Molecular Imaging of Chemokine Receptor CXCR4 Expression in Atherosclerotic Plaque Using 68Ga-Pentixafor PET: Correlation with Cardiovascular Risk Factors and Calcified Plaque Burden. J. Nucl. Med. 2017, 59, 266–272. [Google Scholar] [CrossRef]
- Huisman, M.V.; Barco, S.; Cannegieter, S.C.; Le Gal, G.; Konstantinides, S.V.; Reitsma, P.H.; Rodger, M.; Vonk Noordegraaf, A.; Klok, F.A. Pulmonary embolism. Nat. Rev. Dis. Primers 2018, 4, 18028. [Google Scholar] [CrossRef]
- Goethals, I.; Smeets, P.; De Winter, O.; Noens, L. Focally Enhanced F-18 Fluorodeoxyglucose (FDG) Uptake in Incidentally Detected Pulmonary Embolism on PET/CT Scanning. Clin. Nucl. Med. 2006, 31, 497–498. [Google Scholar] [CrossRef]
- Badr, A.; Joyce, J.M.; Durick, J. Rim of FDG Uptake Around a Pulmonary Infarct on PET/CT in a Patient With Unsuspected Pulmonary Embolism. Clin. Nucl. Med. 2009, 34, 285–286. [Google Scholar] [CrossRef]
- Khandelwal, A.R.; Li, G.; Takalkar, A.M. Incidental Detection of Unsuspected Pulmonary Embolism on Oncologic FDG PET/CT Imaging. Clin. Nucl. Med. 2011, 36, 720–722. [Google Scholar] [CrossRef]
- Nielsen, A.L.; Thomassen, A.; Hess, S.; Alavi, A.; Høilund-Carlsen, P.F. Deep Venous Thrombosis and Pulmonary Embolism Detected by FDG PET/CT in a Patient With Bacteremia. Clin. Nucl. Med. 2013, 38, 276–277. [Google Scholar] [CrossRef]
- Liu, Q.; Zuo, C.; Lv, T.; Cui, B. Pulmonary Embolism Caused by Right Atrial Myxoma on FDG PET/CT. Clin. Nucl. Med. 2013, 38, 928–930. [Google Scholar] [CrossRef] [PubMed]
- Wittram, C.; Scott, J.A. 18F-FDG PET of Pulmonary Embolism. Am. J. Roentgenol. 2007, 189, 171–176. [Google Scholar] [CrossRef] [PubMed]
- Ito, K.; Kubota, K.; Morooka, M.; Shida, Y.; Hasuo, K.; Endo, H.; Matsuda, H. Diagnostic usefulness of 18F-FDG PET/CT in the differentiation of pulmonary artery sarcoma and pulmonary embolism. Ann. Nucl. Med. 2009, 23, 671–676. [Google Scholar] [CrossRef] [PubMed]
- Flavell, R.R.; Behr, S.C.; Brunsing, R.L.; Naeger, D.M.; Pampaloni, M.H. The Incidence of Pulmonary Embolism and Associated FDG-PET Findings in IV Contrast-Enhanced PET/CT. Acad. Radiol. 2014, 21, 718–725. [Google Scholar] [CrossRef]
- Al-Mehisen, R.; Al-Halees, Z.; Alnemri, K.; Al-Hemayed, W.; Al-Mohaissen, M. Primary pulmonary artery sarcoma: A rare and overlooked differential diagnosis of pulmonary embolism. Clues to diagnosis. Int. J. Surg. Case Rep. 2019, 65, 15–19. [Google Scholar] [CrossRef]
- Lee, E.J.; Moon, S.H.; Choi, J.Y.; Lee, K.S.; Choi, Y.S.; Choe, Y.S.; Kim, B.-T. Usefulness of fluorodeoxyglucose positron emission tomography in malignancy of pulmonary artery mimicking pulmonary embolism. ANZ J. Surg. 2013, 83, 342–347. [Google Scholar] [CrossRef]
- Xi, X.-Y.; Gao, W.; Gong, J.-N.; Guo, X.-J.; Wu, J.-Y.; Yang, Y.-H.; Yang, M.-F. Value of 18F-FDG PET/CT in differentiating malignancy of pulmonary artery from pulmonary thromboembolism: A cohort study and literature review. Int. J. Cardiovasc. Imaging 2019, 35, 1395–1403. [Google Scholar] [CrossRef]
- Stone, J.; Hangge, P.; Albadawi, H.; Wallace, A.; Shamoun, F.; Knuttien, M.G.; Naidu, S.; Oklu, R. Deep vein thrombosis: Pathogenesis, diagnosis, and medical management. Cardiovasc. Diagn. Ther. 2017, 7, S276–S284. [Google Scholar] [CrossRef] [PubMed]
- Dronkers, C.E.; Klok, E.; Huisman, M.V. Current and future perspectives in imaging of venous thromboembolism. J. Thromb. Haemost. 2016, 14, 1696–1710. [Google Scholar] [CrossRef] [PubMed]
- Rondina, M.T.; Lam, U.T.; Pendleton, R.C.; Kraiss, L.W.; Wanner, N.; Zimmerman, G.A.; Hoffman, J.M.; Hanrahan, C.; Boucher, K.; Christian, P.E.; et al. 18F-FDG PET in the Evaluation of Acuity of Deep Vein Thrombosis. Clin. Nucl. Med. 2012, 37, 1139–1145. [Google Scholar] [CrossRef]
- Hara, T.; Truelove, J.; Tawakol, A.; Wojtkiewicz, G.R.; Hucker, W.J.; MacNabb, M.H.; Brownell, A.-L.; Jokivarsi, K.; Kessinger, C.W.; Jaff, M.R.; et al. 18F-Fluorodeoxyglucose Positron Emission Tomography/Computed Tomography Enables the Detection of Recurrent Same-Site Deep Vein Thrombosis by Illuminating Recently Formed, Neutrophil-Rich Thrombus. Circulation 2014, 130, 1044–1052. [Google Scholar] [CrossRef] [PubMed]
- Hess, S.; Madsen, P.H.; Iversen, E.D.; Frifelt, J.J.; Hoilund-Carlsen, P.F.; Alavi, A. Efficacy of FDG PET/CT imaging for venous thromboembolic disorders: Preliminary results from a prospective, observational pilot study. Clin. Nucl. Med. 2015, 40, e23–e26. [Google Scholar] [CrossRef]
- Zhu, H.J.; Hess, S.; Rubello, D.; Goris, M.L.; Alavi, A. The strong but nonspecific relationship between 18F-FDG uptake in the lower-extremity veins and venous thromboembolism. Nucl. Med. Commun. 2016, 37, 322–328. [Google Scholar] [CrossRef]
- Le Roux, P.-Y.; Robin, P.; Delluc, A.; Tardy, B.; Abgral, R.; Couturaud, F.; Reffad, A.; Le Gal, G.; Salaun, P.-Y. Performance of 18F fluoro-2-désoxy-D-glucose positron emission tomography/computed tomography for the diagnosis of venous thromboembolism. Thromb. Res. 2015, 135, 31–35. [Google Scholar] [CrossRef]
- Miceli, M.; Atoui, R.; Walker, R.; Mahfouz, T.; Mirza, N.; Diaz, J.; Tricot, G.; Barlogie, B.; Anaissie, E. Diagnosis of Deep Septic Thrombophlebitis in Cancer Patients by Fluorine-18 Fluorodeoxyglucose Positron Emission Tomography Scanning: A Preliminary Report. J. Clin. Oncol. 2004, 22, 1949–1956. [Google Scholar] [CrossRef] [PubMed]
- Davidson, T.; Goitein, O.; Avigdor, A.; Zwas, S.T.; Goshen, E. 18F- FDG-PET/CT for the diagnosis of tumor thrombosis. Isr. Med Assoc. J.: IMAJ 2009, 11, 69–73. [Google Scholar] [PubMed]
- Hess, S.; Madsen, P.H.; Basu, S.; Høilund-Carlsen, P.F.; Alavi, A. Potential Role of FDG PET/CT Imaging for Assessing Venous Thromboembolic Disorders. Clin. Nucl. Med. 2012, 37, 1170–1172. [Google Scholar] [CrossRef]
- Kaghazchi, F.; Borja, A.J.; Hancin, E.C.; Bhattaru, A.; E Detchou, D.K.; Seraj, S.M.; Rojulpote, C.; Hess, S.; Nardo, L.; E Gabriel, P.; et al. Venous thromboembolism detected by FDG-PET/CT in cancer patients: A common, yet life-threatening observation. Am. J. Nucl. Med. Mol. Imaging 2021, 11, 99–106. [Google Scholar] [PubMed]
- Gulati, A.; Bagga, A. Large vessel vasculitis. Pediatr. Nephrol. 2010, 25, 1037–1048. [Google Scholar] [CrossRef]
- Schäfer, V.S.; Jin, L.; Schmidt, W.A. Imaging for Diagnosis, Monitoring, and Outcome Prediction of Large Vessel Vasculitides. Curr. Rheumatol. Rep. 2020, 22, 1–14. [Google Scholar] [CrossRef] [PubMed]
- Tateishi, U.; Tsuchiya, J.; Yokoyama, K. Large vessel vasculitis: Imaging standards of 18F-FDG PET/CT. Jpn. J. Radiol. 2020, 39, 225–232. [Google Scholar] [CrossRef]
- Liddy, S.; Mallia, A.; Collins, C.D.; Killeen, R.P.; Skehan, S.; Dodd, J.D.; Subesinghe, M.; Murphy, D.J. Vascular findings on FDG PET/CT. Br. J. Radiol. 2020, 93, 20200103. [Google Scholar] [CrossRef] [PubMed]
- Bucerius, J. Monitoring Vasculitis with 18F-FDG PET. Q J Nucl Med Mol Imaging 2016, 60, 219–235. [Google Scholar]
- Sammel, A.M.; Hsiao, E.; Schembri, G.; Nguyen, K.; Brewer, J.; Schrieber, L.; Janssen, B.; Youssef, P.; Fraser, C.; Bailey, E.; et al. Diagnostic Accuracy of Positron Emission Tomography/Computed Tomography of the Head, Neck, and Chest for Giant Cell Arteritis: A Prospective, Double-Blind, Cross-Sectional Study. Arthritis Rheumatol. 2019, 71, 1319–1328. [Google Scholar] [CrossRef]
- Hay, B.; Mariano-Goulart, D.; Bourdon, A.; Benkiran, M.; Vauchot, F.; De Verbizier, D.; Ben Bouallègue, F. Diagnostic performance of 18F-FDG PET-CT for large vessel involvement assessment in patients with suspected giant cell arteritis and negative temporal artery biopsy. Ann. Nucl. Med. 2019, 33, 512–520. [Google Scholar] [CrossRef]
- Nielsen, B.D.; Hansen, I.T.; Kramer, S.; Haraldsen, A.; Hjorthaug, K.; Bogsrud, T.V.; Ejlersen, J.A.; Stolle, L.B.; Keller, K.K.; Therkildsen, P.; et al. Simple dichotomous assessment of cranial artery inflammation by conventional 18F-FDG PET/CT shows high accuracy for the diagnosis of giant cell arteritis: A case-control study. Eur. J. Nucl. Med. Mol. Imaging 2019, 46, 184–193. [Google Scholar] [CrossRef] [PubMed]
- Blockmans, D.E.; De Ceuninck, L.; Vanderschueren, S.; Knockaert, D.; Mortelmans, L.; Bobbaers, H. Repetitive 18F-fluorodeoxyglucose positron emission tomography in giant cell arteritis: A prospective study of 35 patients. Arthritis Rheum. 2006, 55, 131–137. [Google Scholar] [CrossRef] [PubMed]
- Keser, G.; Aksu, K. Diagnosis and differential diagnosis of large-vessel vasculitides. Rheumatol. Int. 2019, 39, 169–185. [Google Scholar] [CrossRef] [PubMed]
- Incerti, E.; Tombetti, E.; Fallanca, F.; Baldissera, E.M.; Alongi, P.; Tombolini, E.; Sartorelli, S.; Sabbadini, M.G.; Papa, M.; DE Cobelli, F.; et al. 18F-FDG PET reveals unique features of large vessel inflammation in patients with Takayasu’s arteritis. Eur. J. Nucl. Med. Mol. Imaging 2017, 44, 1109–1118. [Google Scholar] [CrossRef] [PubMed]
- Soussan, M.; Nicolas, P.; Schramm, C.; Katsahian, S.; Pop, G.; Fain, O.; Mekinian, A. Management of large-vessel vasculitis with FDG-PET: A systematic literature review and meta-analysis. Medicine (Baltimore) 2015, 94, e622. [Google Scholar] [CrossRef]
- Salvarani, C.; Gabriel, S.E.; O’Fallon, W.M.; Hunder, G.G. The incidence of giant cell arteritis in Olmsted County, Minnesota: Apparent fluctuations in a cyclic pattern. Ann. Intern. Med. 1995, 123, 192–194. [Google Scholar] [CrossRef]
- Henckaerts, L.; Gheysens, O.; Vanderschueren, S.; Goffin, K.; Blockmans, D. Use of 18F-fluorodeoxyglucose positron emission tomography in the diagnosis of polymyalgia rheumatica—A prospective study of 99 patients. Rheumatology 2018, 57, 1908–1916. [Google Scholar] [CrossRef] [PubMed]
- Yuge, S.; Nakatani, K.; Yoshino, K.; Koyama, T. Diagnosing polymyalgia rheumatica on 18F-FDG PET/CT: Typical uptake patterns. Ann. Nucl. Med. 2018, 32, 573–577. [Google Scholar] [CrossRef]
- van der Geest, K.S.M.; Treglia, G.; Glaudemans, A.W.J.M.; Brouwer, E.; Jamar, F.; Slart, R.H.J.A.; Gheysens, O. Diagnostic value of [18F]FDG-PET/CT in polymyalgia rheumatica: A systematic review and meta-analysis. Eur. J. Nucl. Med. Mol. Imaging 2021, 48, 1876–1889. [Google Scholar] [CrossRef]
- Vitiello, G.; Battaglini, C.O.; Carli, G.; Radice, A.; Matucci, A.; Vultaggio, A.; Olianti, C.; Parronchi, P.; Maggi, E.; Cammelli, D. Tocilizumab in Giant Cell Arteritis: A Real-Life Retrospective Study. Angiology 2018, 69, 763–769. [Google Scholar] [CrossRef]
- Grayson, P.C.; Alehashemi, S.; Bs, A.A.B.; Civelek, A.C.; Cupps, T.R.; Kaplan, M.J.; Malayeri, A.A.; Merkel, P.A.; Rn, E.N.; Bluemke, D.A.; et al. 18F-Fluorodeoxyglucose-Positron Emission Tomography As an Imaging Biomarker in a Prospective, Longitudinal Cohort of Patients With Large Vessel Vasculitis. Arthritis Rheumatol. 2018, 70, 439–449. [Google Scholar] [CrossRef] [PubMed]
- DellaVedova, L.; Carletto, M.; Faggioli, P.; Sciascera, A.; Del Sole, A.; Mazzone, A.; Maffioli, L.S. The prognostic value of baseline 18F-FDG PET/CT in steroid-naïve large-vessel vasculitis: Introduction of volume-based parameters. Eur. J. Nucl. Med. Mol. Imaging 2015, 43, 340–348. [Google Scholar] [CrossRef] [PubMed]
- Muratore, F.; Crescentini, F.; Spaggiari, L.; Pazzola, G.; Casali, M.; Boiardi, L.; Pipitone, N.; Croci, S.; Galli, E.; Aldigeri, R.; et al. Aortic dilatation in patients with large vessel vasculitis: A longitudinal case control study using PET/CT. Semin. Arthritis Rheum. 2019, 48, 1074–1082. [Google Scholar] [CrossRef]
- Schmall, J.P.; Karp, J.S.; Alavi, A. The Potential Role of Total Body PET Imaging in Assessment of Atherosclerosis. PET Clin. 2019, 14, 245–250. [Google Scholar] [CrossRef] [PubMed]
- Bedmutha, A.S.; Singh, N.; Shivdasani, D. Metabolic imaging as a novel strategy in evaluation of mycotic abdominal aortic aneurysm: A case report and brief clinical review. Indian J. Nucl. Med. IJNM Off. J. Soc. Nucl. Med. India 2017, 32, 336–339. [Google Scholar] [CrossRef] [PubMed]
- Choi, S.J.; Lee, J.S.; Cheong, M.H.; Byun, S.S.; Hyun, I.Y. F-18 FDG PET/CT in the Management of Infected Abdominal Aortic Aneurysm Due To Salmonella. Clin. Nucl. Med. 2008, 33, 492–495. [Google Scholar] [CrossRef]
- Murakami, M.; Morikage, N.; Samura, M.; Yamashita, O.; Suehiro, K.; Hamano, K. Fluorine-18-Fluorodeoxyglucose Positron Emission Tomography–Computed Tomography for Diagnosis of Infected Aortic Aneurysms. Ann. Vasc. Surg. 2014, 28, 575–578. [Google Scholar] [CrossRef]
- Kim, S.-J.; Lee, S.-W.; Jeong, S.Y.; Pak, K.; Kim, K. A systematic review and meta-analysis of 18F-fluorodeoxyglucose positron emission tomography or positron emission tomography/computed tomography for detection of infected prosthetic vascular grafts. J. Vasc. Surg. 2019, 70, 307–313. [Google Scholar] [CrossRef]
- Pacella, S. Mycotic coronary aneurysm detected by 18F-FDG PET/CT: A case report. J. Nucl. Cardiol. 2020, 1–2. [Google Scholar] [CrossRef]
- Calais, J.; Pasi, N.; Nguyen, V.; Hyafil, F. Mycotic aneurysm in a pulmonary artery detected with 18F-fluorodeoxyglucose positron emission tomography/computed tomography imaging. Eur. Heart J. 2017, 46, 3474. [Google Scholar] [CrossRef]
- Morimoto, M.; Norikane, T.; Yamamoto, Y.; Mitamura, K.; Nishiyama, Y. Early infected aneurysm with 18F-FDG uptake prior to substantial anatomical changes. J. Nucl. Cardiol. 2018, 26, 1373–1375. [Google Scholar] [CrossRef]
- Inoue, D.; Yoshida, K.; Yoneda, N.; Ozaki, K.; Matsubara, T.; Nagai, K.; Okumura, K.; Toshima, F.; Toyama, J.; Minami, T.; et al. IgG4-related disease: Dataset of 235 consecutive patients. Medicine 2015, 94, e680. [Google Scholar] [CrossRef] [PubMed]
- Kamisawa, T.; Zen, Y.; Pillai, S.; Stone, J.H. IgG4-related disease. Lancet 2015, 385, 1460–1471. [Google Scholar] [CrossRef]
- Nikiphorou, E.; Galloway, J.; Fragoulis, G.E. Overview of IgG4-related aortitis and periaortitis. A decade since their first description. Autoimmun. Rev. 2020, 19, 102694. [Google Scholar] [CrossRef] [PubMed]
- Ferfar, Y.; Charlotte, F.; Cacoub, P.; Saadoun, D. Temporal arteritis in IgG4 related disease. Jt. Bone Spine 2021, 88, 105087. [Google Scholar] [CrossRef]
- Huang, H.L.; Fong, W.; Peh, W.M.; A Niraj, K.; Lam, W.W. The Utility of FDG PET/CT in IgG4-Related Disease with a Focus on Coronary Artery Involvement. Nucl. Med. Mol. Imaging 2017, 52, 53–61. [Google Scholar] [CrossRef] [PubMed]
- Tajima, M.; Nagai, R.; Hiroi, Y. IgG4-Related Cardiovascular Disorders. Int. Heart J. 2014, 55, 287–295. [Google Scholar] [CrossRef]
- Tang, C.Y.L.; Chua, W.M.; Cheng, L.T.J.; Fong, W.; Zaheer, S.; Lam, W.W.-C. 18F-FDG PET/CT Manifestations of IgG4-related Disease. Br. J. Radiol. 2021, 20210105. [Google Scholar] [CrossRef]
- Zhang, J.; Chen, H.; Ma, Y.; Xiao, Y.; Niu, N.; Lin, W.; Wang, X.; Liang, Z.; Zhang, F.; Li, F.; et al. Characterizing IgG4-related disease with 18F-FDG PET/CT: A prospective cohort study. Eur. J. Nucl. Med. Mol. Imaging 2014, 41, 1624–1634. [Google Scholar] [CrossRef]
- Tong, A.K.-T.; Tan, S.-Y.; Go, Y.-Y.; Lam, W.W.-C. Cardiac Structural Abnormalities Associated With IgG4-Related Coronary Periarteritis and Inflammation Revealed by Multimodality Imaging. Can. J. Cardiol. 2014, 30, 956.e15–956.e17. [Google Scholar] [CrossRef]
- Orozco-Gálvez, O.; Fernández-Codina, A.; Simó-Perdigo, M.; Pinal-Fernández, I.; Martínez-Valle, F. Response to Treatment in IgG4-Related Disease Assessed by Quantitative PET/CT Scan. Clin. Nucl. Med. 2021, 46, e307–e311. [Google Scholar] [CrossRef] [PubMed]


Publisher’s Note: MDPI stays neutral with regard to jurisdictional claims in published maps and institutional affiliations. |
© 2021 by the authors. Licensee MDPI, Basel, Switzerland. This article is an open access article distributed under the terms and conditions of the Creative Commons Attribution (CC BY) license (https://creativecommons.org/licenses/by/4.0/).