
A Predictive Clinical-Radiomics Nomogram for Survival Prediction of Glioblastoma Using MRI

 , , , and
Abstract
1. Introduction
2. Materials and Methods
2.1. Dataset
2.1.1. BraTS 2019 Cohort
2.1.2. Validation Cohort
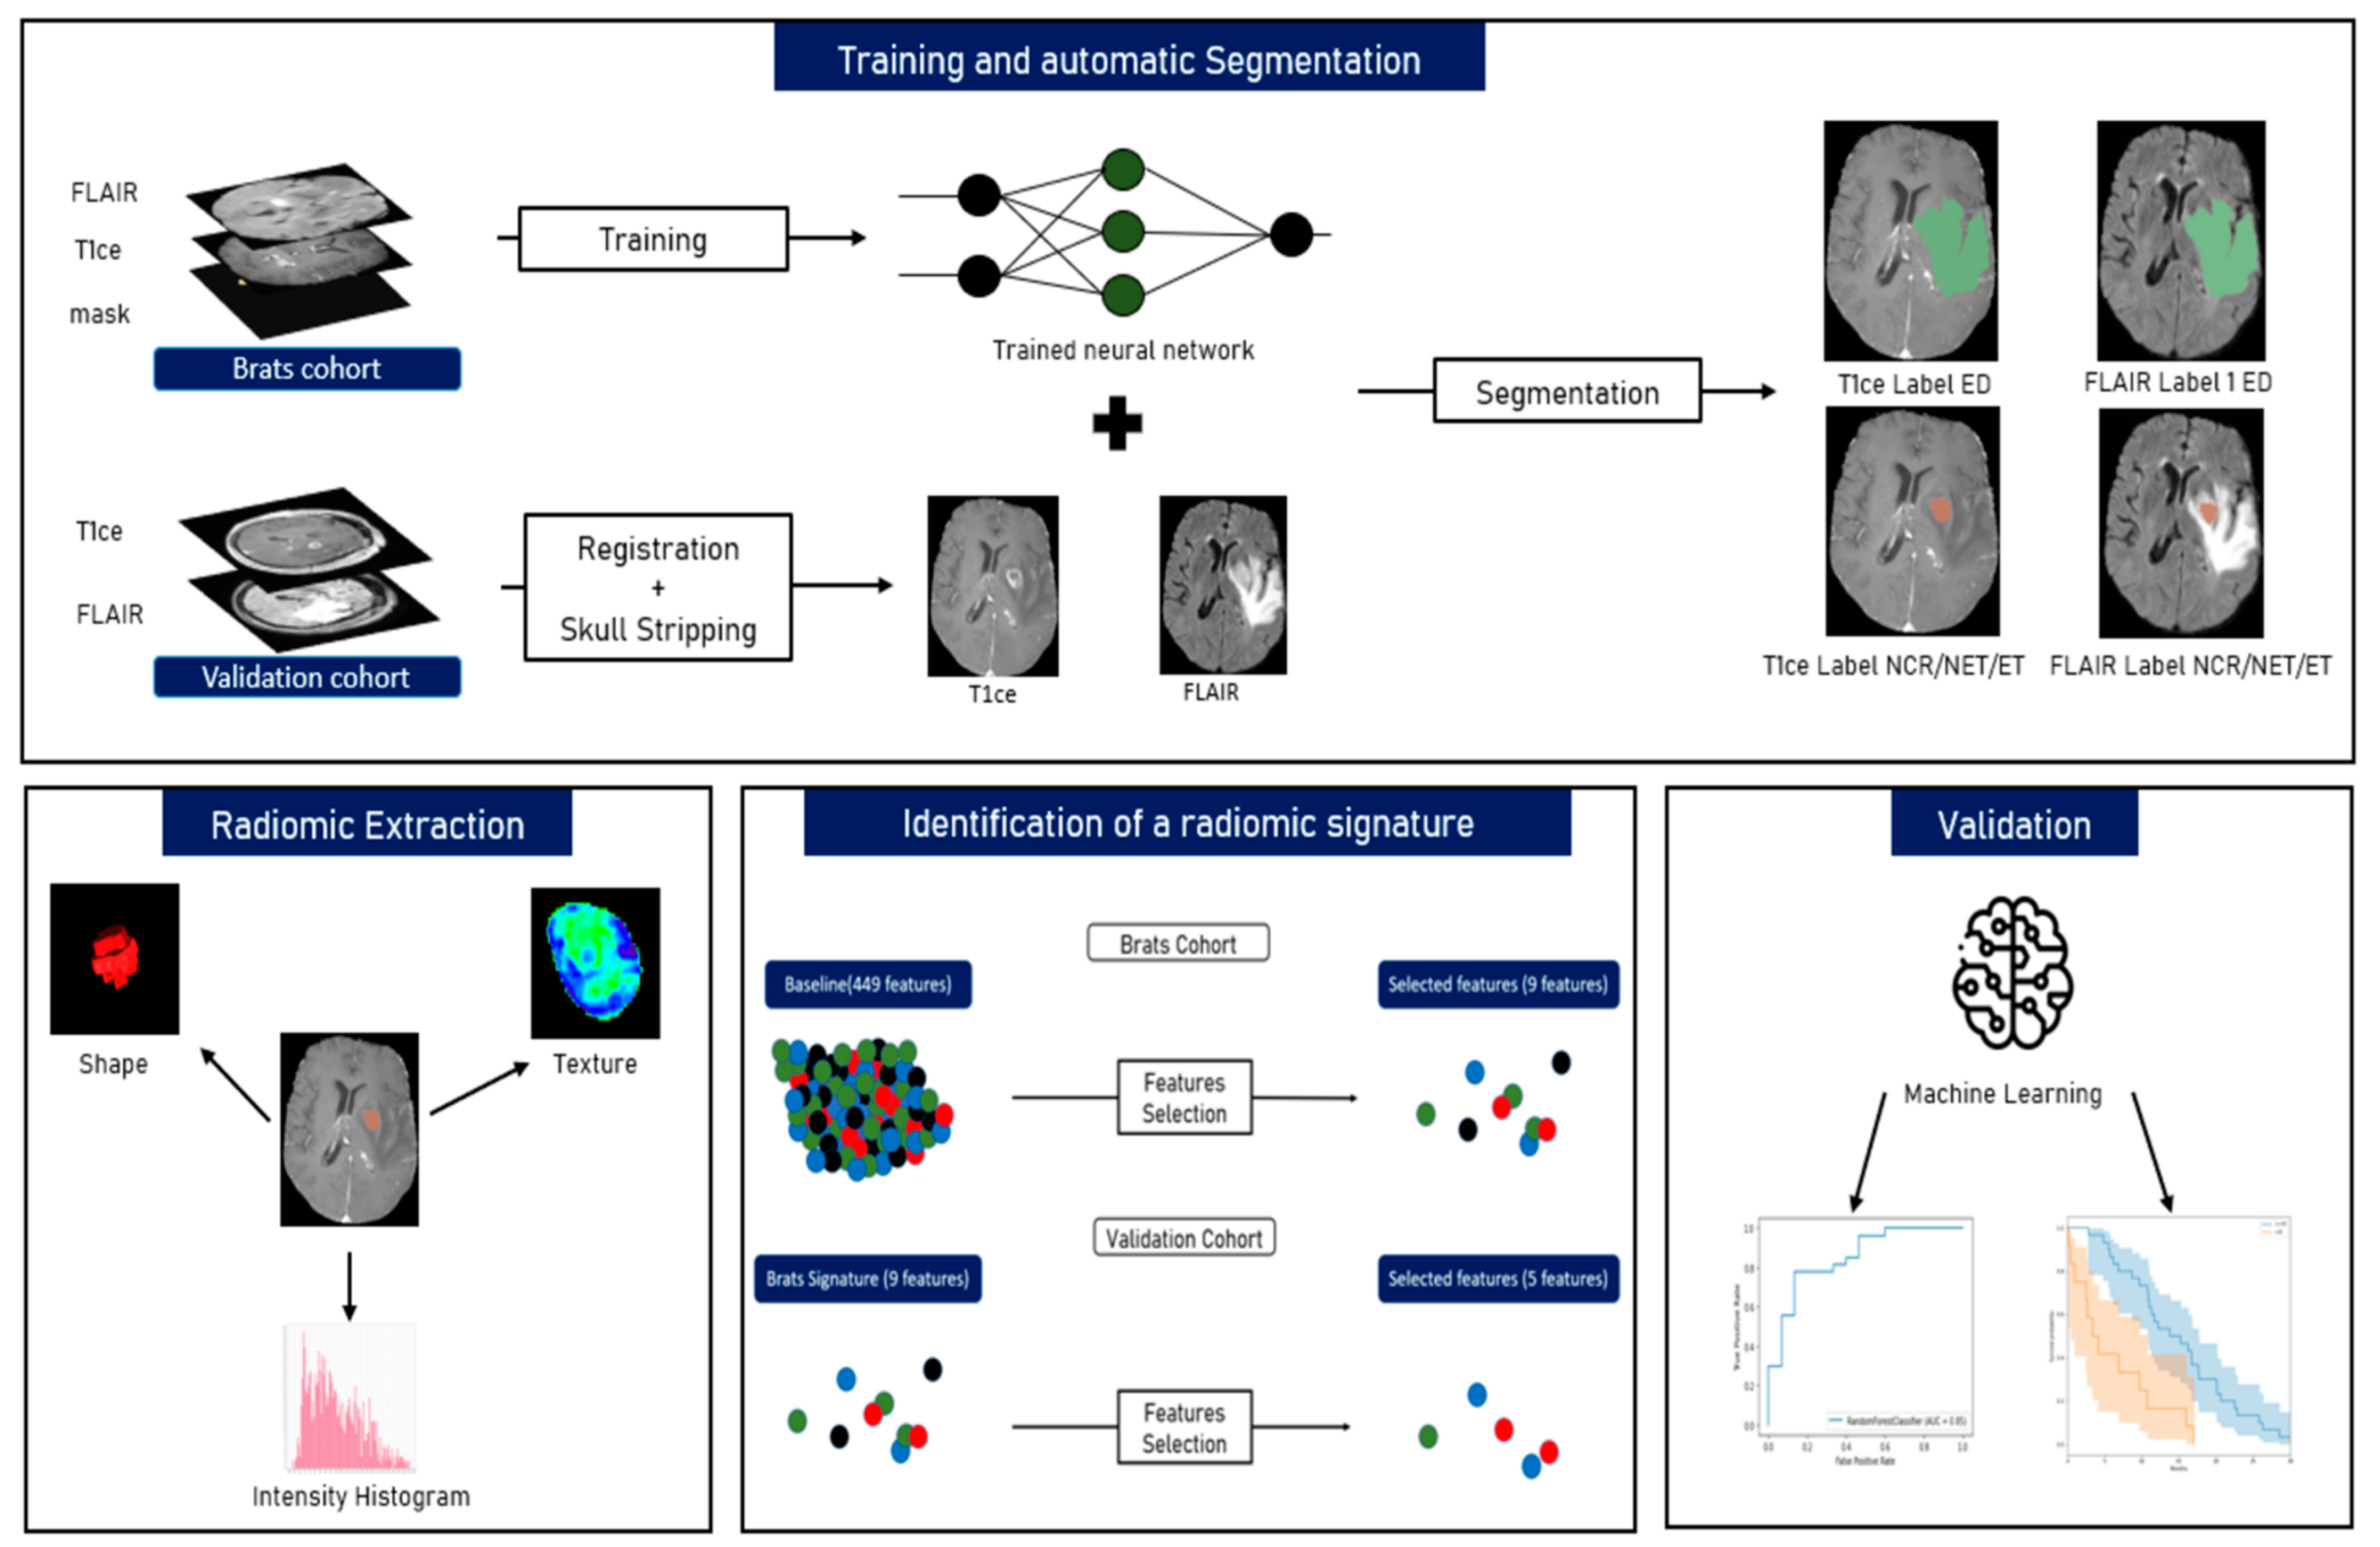
2.2. Image Processing
2.2.1. Pre-Processing
2.2.2. Tumour Segmentation
2.2.3. Radiomics and Features Extraction Technique
2.3. Machine Learning (ML) Algorithms
2.3.1. BraTS Cohort Survival Analysis
2.3.2. Identification of Radiomic Signature
2.4. Statistical Analysis
3. Results
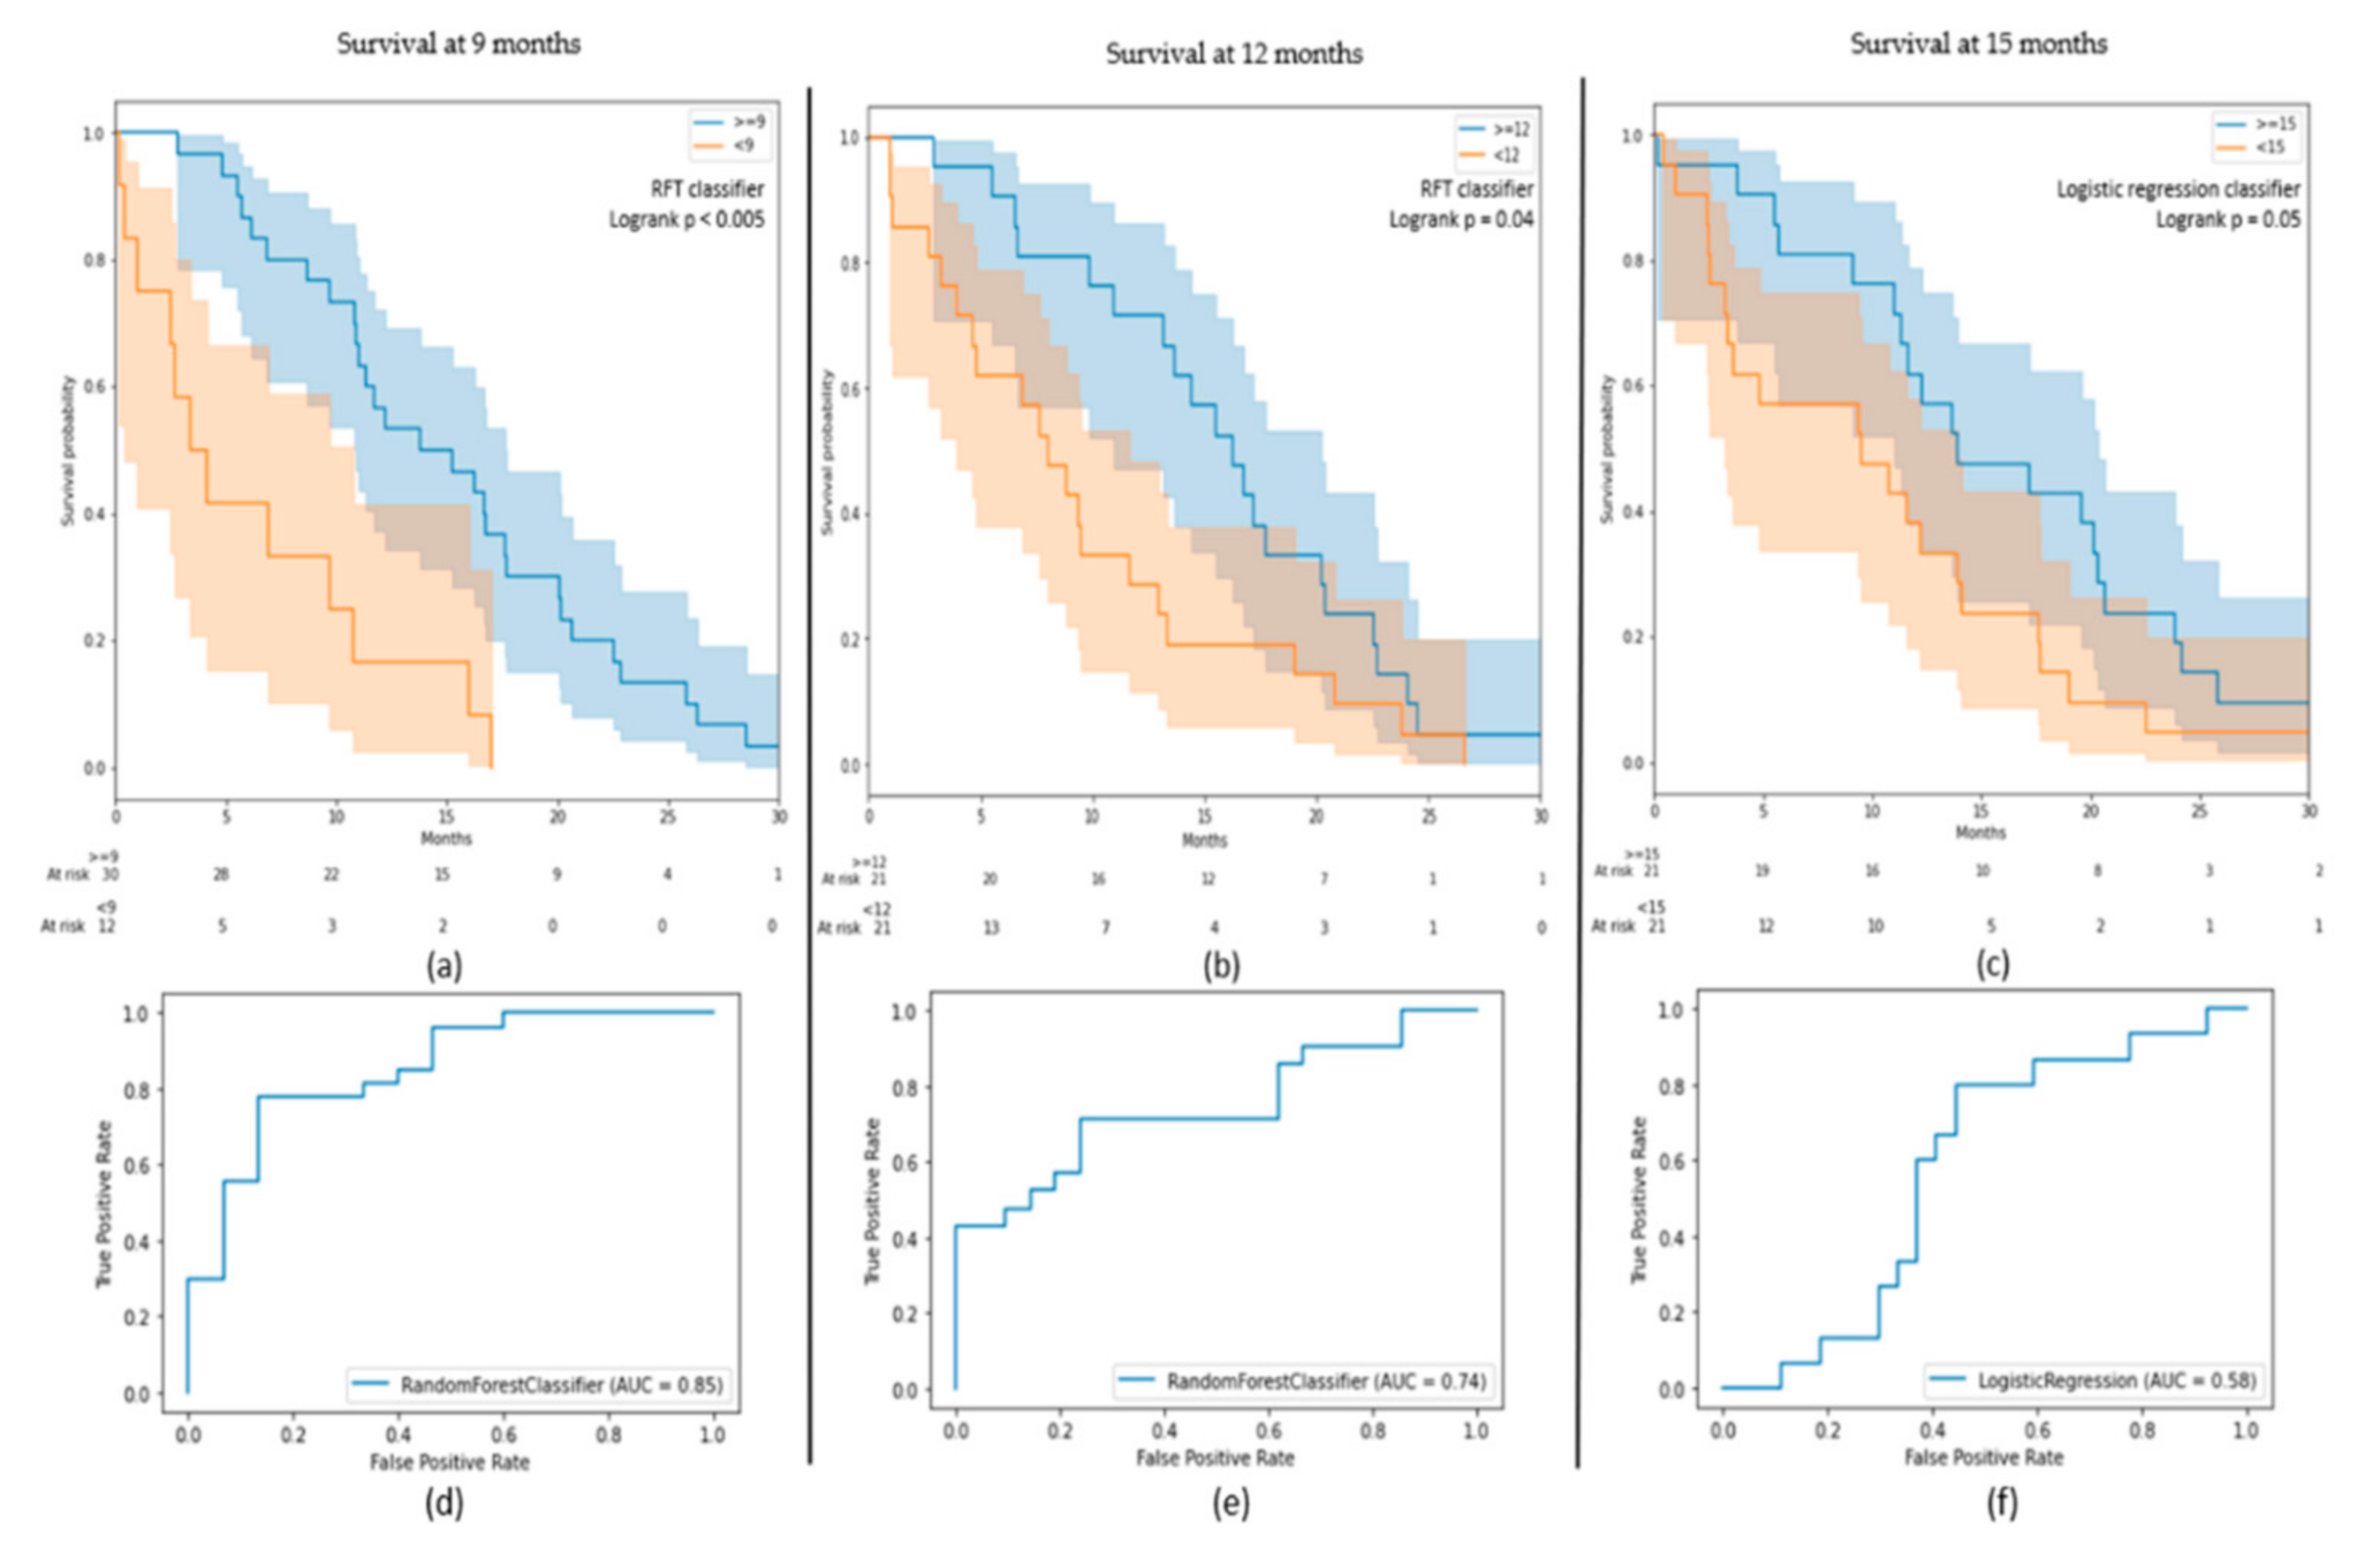
3.1. OS Outcomes on BraTS Cohort
3.2. Radiomic Signature
4. Discussion
Supplementary Materials
Author Contributions
Funding
Institutional Review Board Statement
Informed Consent Statement
Data Availability Statement
Acknowledgments
Conflicts of Interest
References
- Dolecek, T.A.; Propp, J.M.; Stroup, N.E.; Kruchko, C. CBTRUS Statistical Report: Primary Brain and Central Nervous System Tumors Diagnosed in the United States in 2005–2009. Neuro Oncol. 2012, 14, v1–v49. [Google Scholar] [CrossRef]
- Nam, J.Y.; de Groot, J.F. Treatment of Glioblastoma. J. Oncol. Pract. 2017, 13, 629–638. [Google Scholar] [CrossRef]
- Wick, W.; Osswald, M.; Wick, A.; Winkler, F. Treatment of Glioblastoma in Adults. Ther. Adv. Neurol. Disord. 2018, 11. [Google Scholar] [CrossRef] [PubMed]
- Paolillo, M.; Boselli, C.; Schinelli, S. Glioblastoma under Siege: An Overview of Current Therapeutic Strategies. Brain Sci. 2018, 8, 15. [Google Scholar] [CrossRef] [PubMed]
- Wen, P.Y.; Kesari, S. Malignant Gliomas in Adults. N. Engl. J. Med. 2008, 359, 492–507. [Google Scholar] [CrossRef] [PubMed]
- Lapointe, S.; Perry, A.; Butowski, N.A. Primary Brain Tumours in Adults. Lancet 2018, 392, 432–446. [Google Scholar] [CrossRef]
- Binabaj, M.M.; Bahrami, A.; ShahidSales, S.; Joodi, M.; Joudi Mashhad, M.; Hassanian, S.M.; Anvari, K.; Avan, A. The Prognostic Value of MGMT Promoter Methylation in Glioblastoma: A Meta-analysis of Clinical Trials. J. Cell Physiol. 2018, 233, 378–386. [Google Scholar] [CrossRef]
- Sottoriva, A.; Spiteri, I.; Piccirillo, S.G.M.; Touloumis, A.; Collins, V.P.; Marioni, J.C.; Curtis, C.; Watts, C.; Tavaré, S. Intratumor Heterogeneity in Human Glioblastoma Reflects Cancer Evolutionary Dynamics. Proc. Natl. Acad. Sci. USA 2013, 110, 4009–4014. [Google Scholar] [CrossRef]
- Snuderl, M.; Fazlollahi, L.; Le, L.P.; Nitta, M.; Zhelyazkova, B.H.; Davidson, C.J.; Akhavanfard, S.; Cahill, D.P.; Aldape, K.D.; Betensky, R.A.; et al. Mosaic Amplification of Multiple Receptor Tyrosine Kinase Genes in Glioblastoma. Cancer Cell 2011, 20, 810–817. [Google Scholar] [CrossRef]
- Francis, J.M.; Zhang, C.-Z.; Maire, C.L.; Jung, J.; Manzo, V.E.; Adalsteinsson, V.A.; Homer, H.; Haidar, S.; Blumenstiel, B.; Pedamallu, C.S.; et al. EGFR Variant Heterogeneity in Glioblastoma Resolved through Single-Nucleus Sequencing. Cancer Discov. 2014, 4, 956–971. [Google Scholar] [CrossRef]
- Kim, J.; Lee, I.-H.; Cho, H.J.; Park, C.-K.; Jung, Y.-S.; Kim, Y.; Nam, S.H.; Kim, B.S.; Johnson, M.D.; Kong, D.-S.; et al. Spatiotemporal Evolution of the Primary Glioblastoma Genome. Cancer Cell 2015, 28, 318–328. [Google Scholar] [CrossRef] [PubMed]
- Hricak, H.; Abdel-Wahab, M.; Atun, R.; Lette, M.M.; Paez, D.; Brink, J.A.; Donoso-Bach, L.; Frija, G.; Hierath, M.; Holmberg, O.; et al. Medical Imaging and Nuclear Medicine: A Lancet Oncology Commission. Lancet Oncol. 2021, 22, e136–e172. [Google Scholar] [CrossRef]
- Lohmann, P.; Galldiks, N.; Kocher, M.; Heinzel, A.; Filss, C.P.; Stegmayr, C.; Mottaghy, F.M.; Fink, G.R.; Jon Shah, N.; Langen, K.-J. Radiomics in Neuro-Oncology: Basics, Workflow, and Applications. Methods 2021, 188, 112–121. [Google Scholar] [CrossRef] [PubMed]
- Riesterer, O.; Milas, L.; Ang, K.K. Use of Molecular Biomarkers for Predicting the Response to Radiotherapy with or without Chemotherapy. J. Clin. Oncol. 2007, 25, 4075–4083. [Google Scholar] [CrossRef]
- Liu, Z.; Wang, S.; Dong, D.; Wei, J.; Fang, C.; Zhou, X.; Sun, K.; Li, L.; Li, B.; Wang, M.; et al. The Applications of Radiomics in Precision Diagnosis and Treatment of Oncology: Opportunities and Challenges. Theranostics 2019, 9, 1303–1322. [Google Scholar] [CrossRef] [PubMed]
- Pak, E.; Choi, K.S.; Choi, S.H.; Park, C.-K.; Kim, T.M.; Park, S.-H.; Lee, J.H.; Lee, S.-T.; Hwang, I.; Yoo, R.-E.; et al. Prediction of Prognosis in Glioblastoma Using Radiomics Features of Dynamic Contrast-Enhanced MRI. Korean J. Radiol. 2021, 22, e92. [Google Scholar] [CrossRef]
- Kickingereder, P.; Neuberger, U.; Bonekamp, D.; Piechotta, P.L.; Götz, M.; Wick, A.; Sill, M.; Kratz, A.; Shinohara, R.T.; Jones, D.T.W.; et al. Radiomic Subtyping Improves Disease Stratification beyond Key Molecular, Clinical, and Standard Imaging Characteristics in Patients with Glioblastoma. Neuro Oncol. 2018, 20, 848–857. [Google Scholar] [CrossRef]
- Sanghani, P.; Ang, B.T.; King, N.K.K.; Ren, H. Overall Survival Prediction in Glioblastoma Multiforme Patients from Volumetric, Shape and Texture Features Using Machine Learning. Surg. Oncol. 2018, 27, 709–714. [Google Scholar] [CrossRef]
- Baid, U.; Rane, S.U.; Talbar, S.; Gupta, S.; Thakur, M.H.; Moiyadi, A.; Mahajan, A. Overall Survival Prediction in Glioblastoma With Radiomic Features Using Machine Learning. Front. Comput. Neurosci. 2020, 14, 61. [Google Scholar] [CrossRef]
- Osman, A.F.I. A Multi-Parametric MRI-Based Radiomics Signature and a Practical ML Model for Stratifying Glioblastoma Patients Based on Survival Toward Precision Oncology. Front. Comput. Neurosci. 2019, 13, 58. [Google Scholar] [CrossRef]
- Macyszyn, L.; Akbari, H.; Pisapia, J.M.; Da, X.; Attiah, M.; Pigrish, V.; Bi, Y.; Pal, S.; Davuluri, R.V.; Roccograndi, L.; et al. Imaging Patterns Predict Patient Survival and Molecular Subtype in Glioblastoma via Machine Learning Techniques. Neuro Oncol. 2016, 18, 417–425. [Google Scholar] [CrossRef] [PubMed]
- Chen, X.; Fang, M.; Dong, D.; Liu, L.; Xu, X.; Wei, X.; Jiang, X.; Qin, L.; Liu, Z. Development and Validation of a MRI-Based Radiomics Prognostic Classifier in Patients with Primary Glioblastoma Multiforme. Acad. Radiol. 2019, 26, 1292–1300. [Google Scholar] [CrossRef]
- Menze, B.H.; Jakab, A.; Bauer, S.; Kalpathy-Cramer, J.; Farahani, K.; Kirby, J.; Burren, Y.; Porz, N.; Slotboom, J.; Wiest, R.; et al. The Multimodal Brain Tumor Image Segmentation Benchmark (BRATS). IEEE Trans. Med. Imaging 2015, 34, 1993–2024. [Google Scholar] [CrossRef] [PubMed]
- Bakas, S.; Akbari, H.; Sotiras, A.; Bilello, M.; Rozycki, M.; Kirby, J.S.; Freymann, J.B.; Farahani, K.; Davatzikos, C. Advancing The Cancer Genome Atlas Glioma MRI Collections with Expert Segmentation Labels and Radiomic Features. Sci. Data 2017, 4, 170117. [Google Scholar] [CrossRef] [PubMed]
- Bakas, S.; Reyes, M.; Jakab, A.; Bauer, S.; Rempfler, M.; Crimi, A.; Shinohara, R.T.; Berger, C.; Ha, S.M.; Rozycki, M.; et al. Identifying the Best Machine Learning Algorithms for Brain Tumor Segmentation, Progression Assessment, and Overall Survival Prediction in the BRATS Challenge. arXiv Prepr. 2018, arXiv:1811.02629. [Google Scholar]
- Gupta, A.; Dwivedi, T. A Simplified Overview of World Health Organization Classification Update of Central Nervous System Tumors 2016. J. Neurosci. Rural. Pract. 2017, 8, 629–641. [Google Scholar] [CrossRef]
- Kofler, F.; Berger, C.; Waldmannstetter, D.; Lipkova, J.; Ezhov, I.; Tetteh, G.; Kirschke, J.; Zimmer, C.; Wiestler, B.; Menze, B.H. BraTS Toolkit: Translating BraTS Brain Tumor Segmentation Algorithms into Clinical and Scientific Practice. Front. Neurosci. 2020, 14, 125. [Google Scholar] [CrossRef]
- Isensee, F.; Schell, M.; Pflueger, I.; Brugnara, G.; Bonekamp, D.; Neuberger, U.; Wick, A.; Schlemmer, H.; Heiland, S.; Wick, W.; et al. Automated Brain Extraction of Multisequence MRI Using Artificial Neural Networks. Hum. Brain Mapp. 2019, 40, 4952–4964. [Google Scholar] [CrossRef]
- Isensee, F.; Jaeger, P.F.; Kohl, S.A.A.; Petersen, J.; Maier-Hein, K.H. NnU-Net: A Self-Configuring Method for Deep Learning-Based Biomedical Image Segmentation. Nat. Methods 2021, 18, 203–211. [Google Scholar] [CrossRef]
- van Griethuysen, J.J.M.; Fedorov, A.; Parmar, C.; Hosny, A.; Aucoin, N.; Narayan, V.; Beets-Tan, R.G.H.; Fillion-Robin, J.-C.; Pieper, S.; Aerts, H.J.W.L. Computational Radiomics System to Decode the Radiographic Phenotype. Cancer Res. 2017, 77, e104–e107. [Google Scholar] [CrossRef]
- Uno, H.; Cai, T.; Pencina, M.J.; D’Agostino, R.B.; Wei, L.J. On the C-Statistics for Evaluating Overall Adequacy of Risk Prediction Procedures with Censored Survival Data. Stat. Med. 2011, 30, 1105–1117. [Google Scholar] [CrossRef] [PubMed]
- Ammari, S.; Sallé de Chou, R.; Assi, T.; Touat, M.; Chouzenoux, E.; Quillent, A.; Limkin, E.; Dercle, L.; Hadchiti, J.; Elhaik, M.; et al. Machine-Learning-Based Radiomics MRI Model for Survival Prediction of Recurrent Glioblastomas Treated with Bevacizumab. Diagnostics 2021, 11, 1263. [Google Scholar] [CrossRef]
- Fournier, L.; Costaridou, L.; Bidaut, L.; Michoux, N.; Lecouvet, F.E.; de Geus-Oei, L.-F.; Boellaard, R.; Oprea-Lager, D.E.; Obuchowski, N.A.; Caroli, A.; et al. European Society of Radiology. Correction to: Incorporating Radiomics into Clinical Trials: Expert Consensus Endorsed by the European Society of Radiology on Considerations for Data-Driven Compared to Biologically Driven Quantitative Biomarkers. Eur. Radiol. 2021, 31, 6408–6409. [Google Scholar] [CrossRef]
- Louis, D.N.; Perry, A.; Wesseling, P.; Brat, D.J.; Cree, I.A.; Figarella-Branger, D.; Hawkins, C.; Ng, H.K.; Pfister, S.M.; Reifenberger, G.; et al. The 2021 WHO Classification of Tumors of the Central Nervous System: A Summary. Neuro Oncol. 2021, 23, 1231–1251. [Google Scholar] [CrossRef] [PubMed]
- Hegi, M.E.; Diserens, A.-C.; Gorlia, T.; Hamou, M.-F.; de Tribolet, N.; Weller, M.; Kros, J.M.; Hainfellner, J.A.; Mason, W.; Mariani, L.; et al. MGMT Gene Silencing and Benefit from Temozolomide in Glioblastoma. N. Engl. J. Med. 2005, 352, 997–1003. [Google Scholar] [CrossRef]
- Dahlrot, R.H.; Kristensen, B.W.; Hjelmborg, J.; Herrstedt, J.; Hansen, S. A Population-Based Study of Low-Grade Gliomas and Mutated Isocitrate Dehydrogenase 1 (IDH1). J. Neurooncol. 2013, 114, 309–317. [Google Scholar] [CrossRef] [PubMed]
- Bae, S.; Choi, Y.S.; Ahn, S.S.; Chang, J.H.; Kang, S.-G.; Kim, E.H.; Kim, S.H.; Lee, S.-K. Radiomic MRI Phenotyping of Glioblastoma: Improving Survival Prediction. Radiology 2018, 289, 797–806. [Google Scholar] [CrossRef]
- Sorokin, M.; Raevskiy, M.; Zottel, A.; Šamec, N.; Vidmar, M.S.; Matjašič, A.; Zupan, A.; Mlakar, J.; Suntsova, M.; Kuzmin, D.V.; et al. Large-Scale Transcriptomics-Driven Approach Revealed Overexpression of CRNDE as a Poor Survival Prognosis Biomarker in Glioblastoma. Cancers 2021, 13, 3419. [Google Scholar] [CrossRef]
- van Linde, M.E.; van der Mijn, J.C.; Pham, T.V.; Knol, J.C.; Wedekind, L.E.; Hovinga, K.E.; Aliaga, E.S.; Buter, J.; Jimenez, C.R.; Reijneveld, J.C.; et al. Evaluation of Potential Circulating Biomarkers for Prediction of Response to Chemoradiation in Patients with Glioblastoma. J. Neurooncol. 2016, 129, 221–230. [Google Scholar] [CrossRef][Green Version]
- Brancato, V.; Nuzzo, S.; Tramontano, L.; Condorelli, G.; Salvatore, M.; Cavaliere, C. Predicting Survival in Glioblastoma Patients Using Diffusion MR Imaging Metrics—A Systematic Review. Cancers 2020, 12, 2858. [Google Scholar] [CrossRef] [PubMed]


| Characteristics | Value |
|---|---|
| Age----------years | |
| Mean | 59 |
| Median | 58.8 |
| Min-max | 26–80 |
| Sex----------n (%) | |
| Female | 44 (38%) |
| Male | 72 (62%) |
| OS----------months | |
| Mean | 27.33 |
| Median | 21.87 |
| Min-max | 3.93–117 |
| Tumour location----------n (%) | |
| Left | 58 (50%) |
| Right | 58 (50%) |
| Multifocal | 0 (0%) |
| Surgery----------n (%) | |
| Yes | 81 (70%) |
| No | 35 (30%) |
| Machine | Weighting | Sequence | TR | TE | Slice Thickness |
|---|---|---|---|---|---|
| Optima MR450w 1.5 T Installed in 2016, 70 cm tunnel, 32 channels, 40 cm z-axisFOV, gradient 40 mT/m SR 200 T/m/s. | T1 pre-contrast | 3D rapid gradient echo | 9 ms | 4.2 ms | 1 mm |
| T2-FLAIR | Turbo spin echo | 7002 ms | 138 ms | 1.4 mm | |
| DWI | EPI, two b-values (0 and 1000 mm/s) | 3349 ms | 79 ms | 4 mm | |
| T1 post-contrast | 3D rapid gradient echo | 6.1 ms | 1.2 ms | 1 mm | |
| Discovery MR 750w 3 T Installed in 2012, 70 cm tunnel, 32 channels, 50 cm z-axisFOV, gradient 44 mT/m SR 200 T/m/s. | T1 pre-contrast | 3D rapid gradient echo | 9 ms | 2.1 ms | 1 mm |
| T2-FLAIR | Turbo spin echo | 7002 ms | 118 ms | 1 mm | |
| DWI | EPI, two b-values (0 and 1000 mm/s) | 3349 ms | 62.6 ms | 3 mm | |
| T1 post-contrast | 3D rapid gradient echo | 6.1 ms | 2.1 ms | 1 mm |
| Model | Classes | Number (%) |
|---|---|---|
| 9 months survival | <9 | 73 (35%) |
| ≥9 | 137 (65%) | |
| 12 months survival | <12 | 105 (50%) |
| ≥12 | 105 (50%) | |
| 15 months survival | <15 | 136 (68%) |
| ≥15 | 74 (32%) |
| Model | Cohort | Best Classifier | AUC on Test (on Train) | Classes | Precision | Recall |
|---|---|---|---|---|---|---|
| 9 months survival | BraTS | RFT | 0.85 (0.92) | ≥9 | 0.77 | 0.85 |
| <9 | 0.67 | 0.53 | ||||
| 12 months survival | BraTS | RFT | 0.74 (0.88) | ≥12 | 0.71 | 0.71 |
| <12 | 0.71 | 0.71 | ||||
| 15 months survival | BraTS | Logistic regression | 0.58 (0.75) | ≥15 | 0.48 | 0.67 |
| <15 | 0.76 | 0.59 | ||||
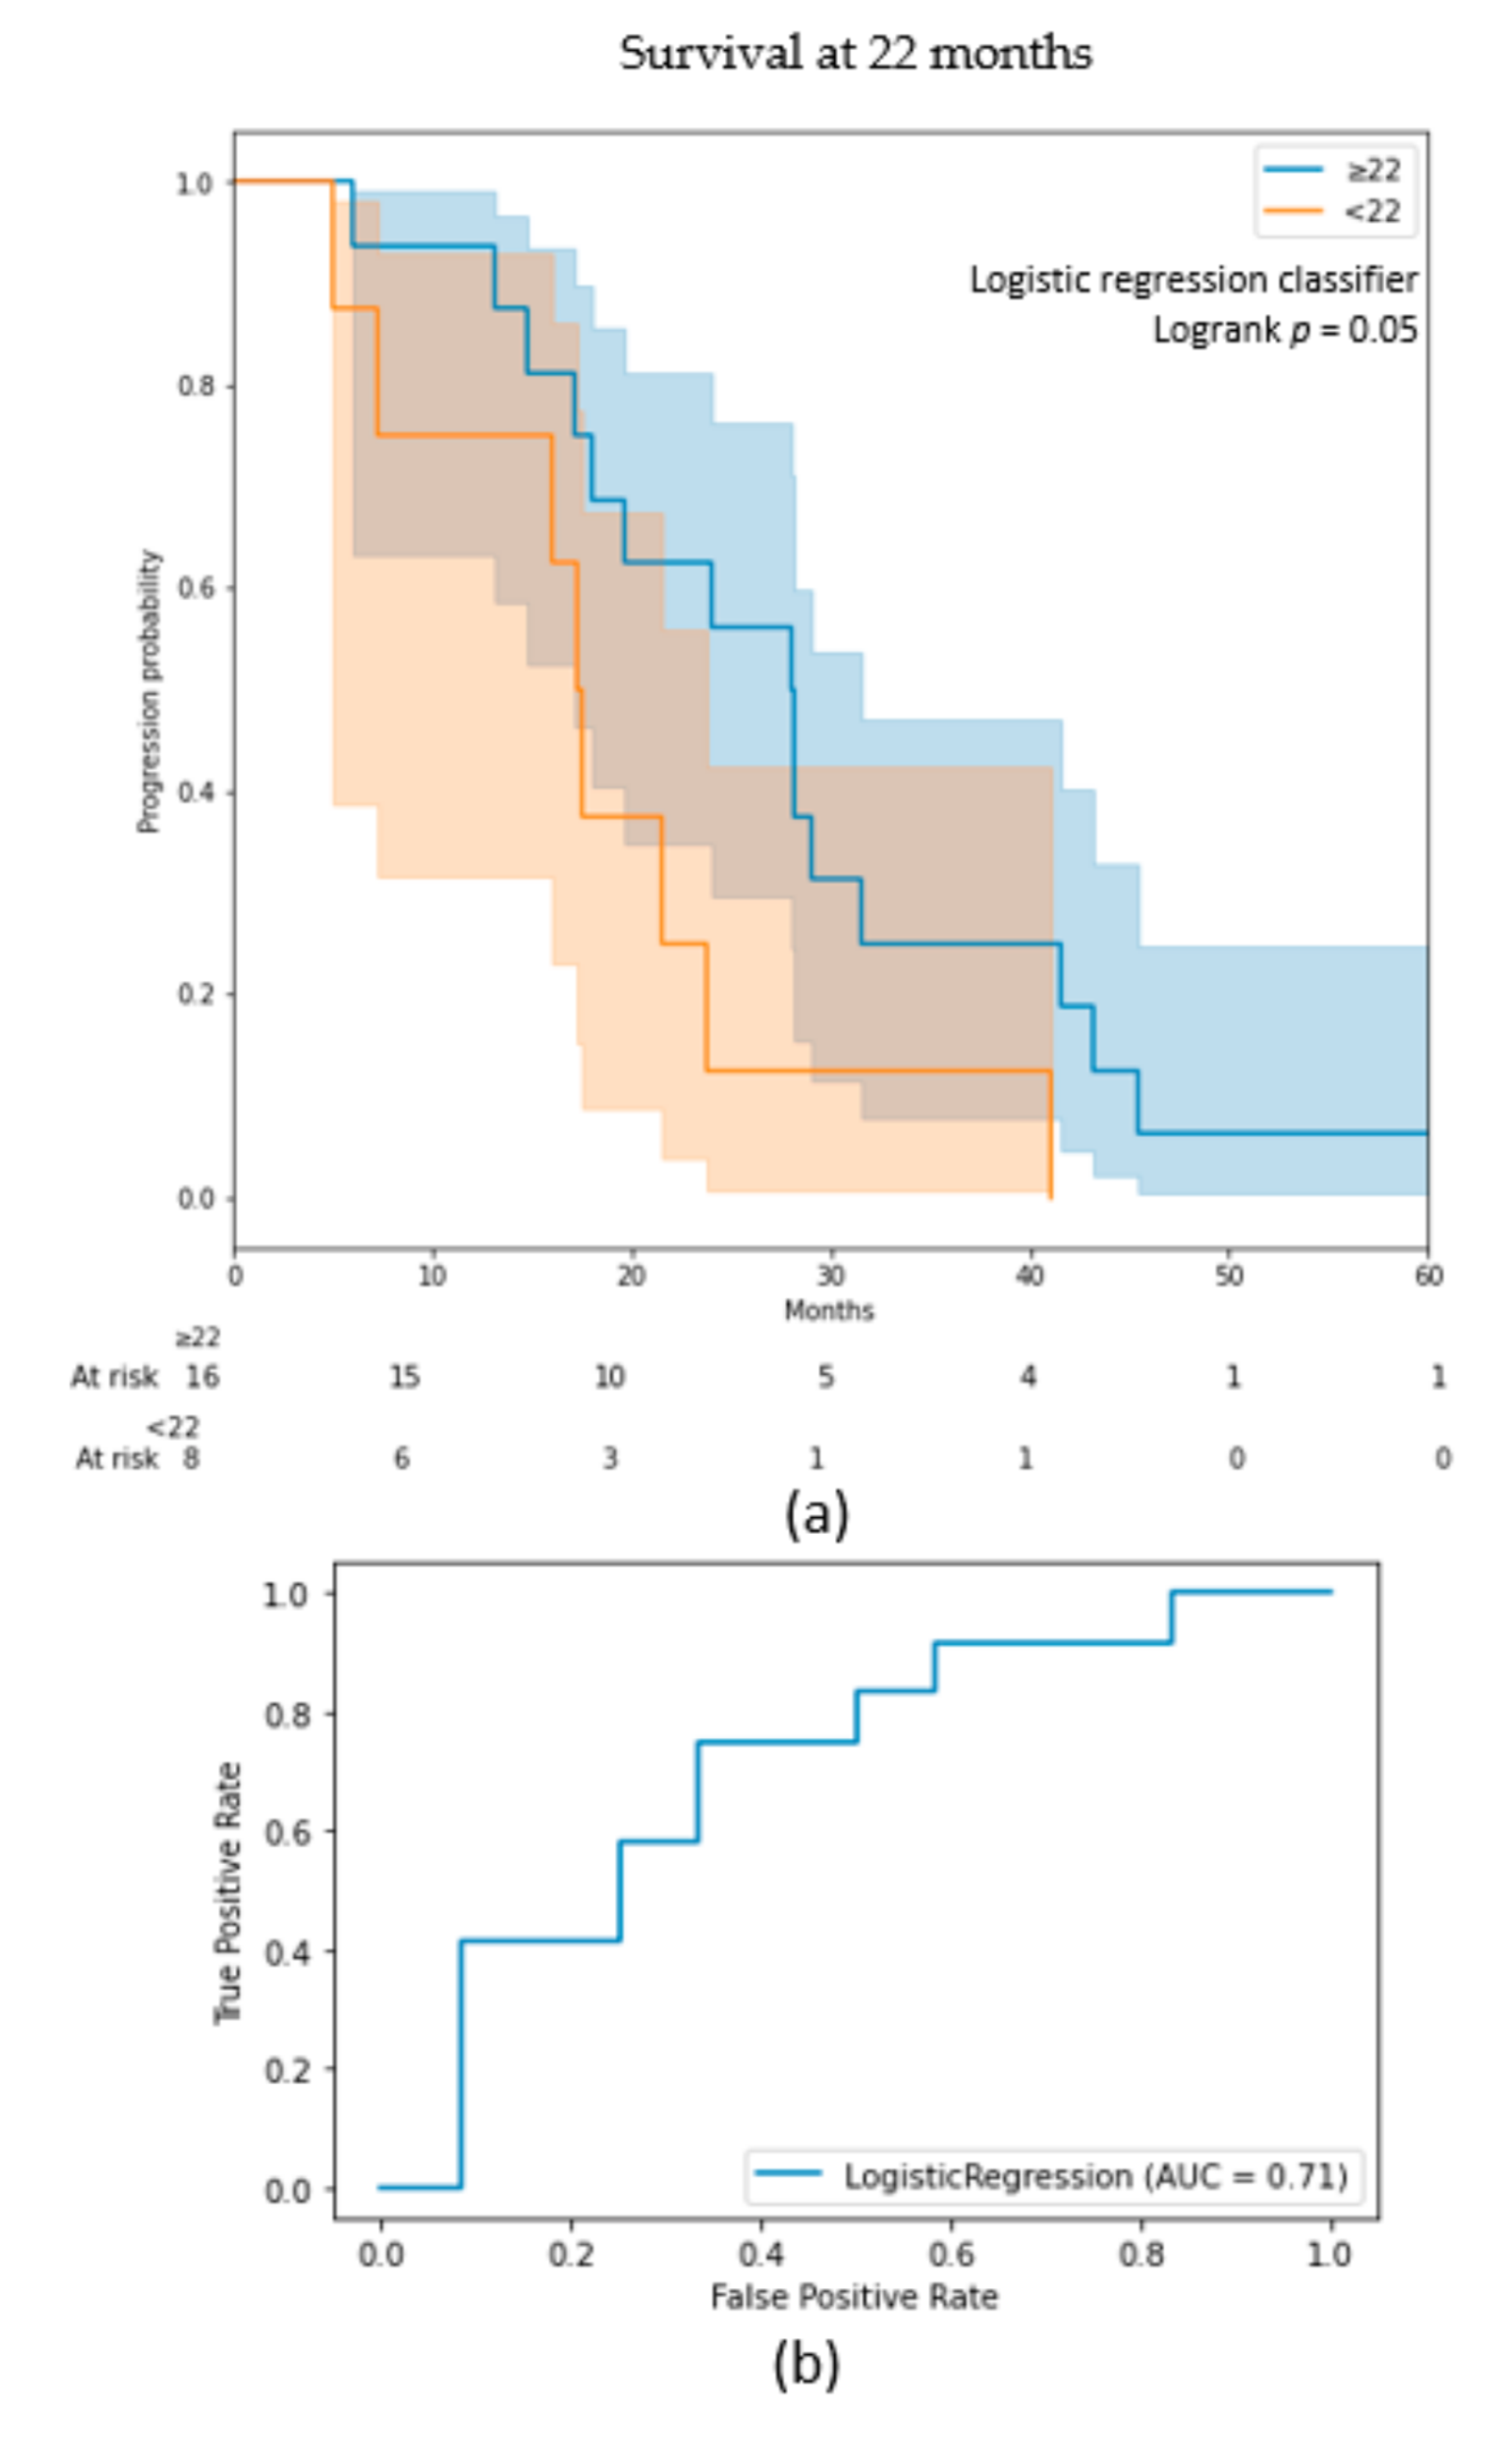
| 22 months survival | Validation | Logistic regression | 0.71 (0.65) | ≥22 <22 | 0.62 0.75 | 0.83 0.50 |
| Feature | Source | Sub-Mask | Radiomic Type | 9 Months (C-index) | 12 Months (C-index) | 15 Months (C-index) | 22 Months (C-index) | Correlation/Anticorrelation with OS |
|---|---|---|---|---|---|---|---|---|
| Sphericity | Gadolinium | ED | Shape | 0.59 | 0.58 | 0.59 | - | Correlation |
| Sphericity | Gadolinium | NCT/NET/ET | Shape | 0.58 | 0.56 | 0.56 | 0.53 | Correlation |
| Minimum | Flair | NCT/NET/ET | Histogram intensity | 0.59 | 0.59 | 0.59 | - | Correlation |
| Strength | Flair | NCT/NET/ET | Texture | 0.57 | 0.58 | 0.58 | 0.57 | Correlation |
| Strength | Gadolinium | NCT/NET/ET | Texture | 0.56 | 0.57 | 0.58 | - | Correlation |
| Age | Flair | - | - | 0.63 | 0.64 | 0.62 | 0.53 | Anticorrelation |
| Major axis length | Flair | ED | Shape | - | 0.58 | 0.56 | - | Anticorrelation |
| Contrast | Flair | NCT/NET/ET | Texture | 0.56 | 0.56 | - | 0.58 | Correlation |
| Coarseness | Flair | NCT/NET/ET | Texture | 0.59 | - | 0.60 | 0.53 | Correlation |
Publisher’s Note: MDPI stays neutral with regard to jurisdictional claims in published maps and institutional affiliations. |
© 2021 by the authors. Licensee MDPI, Basel, Switzerland. This article is an open access article distributed under the terms and conditions of the Creative Commons Attribution (CC BY) license (https://creativecommons.org/licenses/by/4.0/).
Share and Cite
Ammari, S.; Sallé de Chou, R.; Balleyguier, C.; Chouzenoux, E.; Touat, M.; Quillent, A.; Dumont, S.; Bockel, S.; Garcia, G.C.T.E.; Elhaik, M.; et al. A Predictive Clinical-Radiomics Nomogram for Survival Prediction of Glioblastoma Using MRI. Diagnostics 2021, 11, 2043. https://doi.org/10.3390/diagnostics11112043
Ammari S, Sallé de Chou R, Balleyguier C, Chouzenoux E, Touat M, Quillent A, Dumont S, Bockel S, Garcia GCTE, Elhaik M, et al. A Predictive Clinical-Radiomics Nomogram for Survival Prediction of Glioblastoma Using MRI. Diagnostics. 2021; 11(11):2043. https://doi.org/10.3390/diagnostics11112043
Chicago/Turabian StyleAmmari, Samy, Raoul Sallé de Chou, Corinne Balleyguier, Emilie Chouzenoux, Mehdi Touat, Arnaud Quillent, Sarah Dumont, Sophie Bockel, Gabriel C. T. E. Garcia, Mickael Elhaik, and et al. 2021. "A Predictive Clinical-Radiomics Nomogram for Survival Prediction of Glioblastoma Using MRI" Diagnostics 11, no. 11: 2043. https://doi.org/10.3390/diagnostics11112043
APA StyleAmmari, S., Sallé de Chou, R., Balleyguier, C., Chouzenoux, E., Touat, M., Quillent, A., Dumont, S., Bockel, S., Garcia, G. C. T. E., Elhaik, M., Francois, B., Borget, V., Lassau, N., Khettab, M., & Assi, T. (2021). A Predictive Clinical-Radiomics Nomogram for Survival Prediction of Glioblastoma Using MRI. Diagnostics, 11(11), 2043. https://doi.org/10.3390/diagnostics11112043