Abstract
The water proton spin relaxivity, colloidal stability, and biocompatibility of nanoparticle-based magnetic resonance imaging (MRI) contrast agents depend on the surface-coating ligands. Here, poly(acrylic acid-co-maleic acid) (PAAMA) (Mw = ~3000 amu) is explored as a surface-coating ligand of ultrasmall gadolinium oxide (Gd2O3) nanoparticles. Owing to the numerous carboxylic groups in PAAMA, which allow its strong conjugation with the nanoparticle surfaces and the attraction of abundant water molecules to the nanoparticles, the synthesized PAAMA-coated ultrasmall Gd2O3 nanoparticles (davg = 1.8 nm and aavg = 9.0 nm) exhibit excellent colloidal stability, extremely low cellular toxicity, and a high longitudinal water proton spin relaxivity (r1) of 40.6 s−1mM−1 (r2/r1 = 1.56, where r2 = transverse water proton spin relaxivity), which is approximately 10 times higher than those of commercial molecular contrast agents. The effectiveness of PAAMA-coated ultrasmall Gd2O3 nanoparticles as a T1 MRI contrast agent is confirmed by the high positive contrast enhancements of the in vivo T1 MR images at the 3.0 T MR field.
1. Introduction
Magnetic resonance imaging (MRI) is a noninvasive imaging method that provides high-resolution three-dimensional images of the body [1]. Because it affords substantially good image contrasts for the brain and soft tissues, MRI is preferred for diagnosis of the brain and soft tissues. Further, contrast agents enhance the image resolution and sensitivity of MRI by increasing the contrast [2,3,4]. Hence, they can facilitate the early diagnosis of diseases.
The trivalent Gd3+, possessing the highest unpaired electron spin (S = 7/2) [5], is the most powerful element in the periodic table for accelerating the longitudinal (T1) water proton spin relaxation. Therefore, Gd3+-chelates are the most utilized T1 MRI contrast agents for clinical applications [2,3]. However, these chelates possess low longitudinal water proton relaxivity (r1) values (3 to 5 s−1mM−1) because they can only interact with one water molecule [2,3]. In contrast, gadolinium oxide (Gd2O3) nanoparticles with many Gd3+ on their surfaces can interact with many water molecules to provide much higher r1 values compared with the Gd-chelates [6,7,8,9]. Furthermore, as demonstrated by various types of ultrasmall nanoparticle systems [10,11,12], ultrasmall Gd2O3 nanoparticles can be excreted through the renal system similarly to molecular agents, which are essential for in vivo applications.
The good colloidal stability and biocompatibility of Gd2O3 nanoparticles are essential for their in vitro and in vivo applications. Moreover, better colloidal stability and biocompatibility can be obtained with larger ligands than with smaller ones [13], although the smaller ligands can achieve better renal excretion [10]. Further, the r1 values are affected by surface-coating ligands [14]: higher r1 values can be obtained by hydrophilic ligands than with hydrophobic ones [15,16]. In addition, the surface coating is required to prevent the release of free Gd3+ ions from the nanoparticles (free Gd3+ ions may cause nephrogenic systemic fibrosis if they are released in the body [17,18,19]). Therefore, the surface-coating of Gd-containing nanoparticles is necessary for in vitro and in vivo applications. For example, dextran and polyethylene-glycol-modified silica have been utilized for surface coating [20,21].
Here, poly(acrylic acid-co-maleic acid) (PAAMA) (Mw = ~3000 amu) was explored as a surface-coating ligand of ultrasmall Gd2O3 nanoparticles. It is known to be biocompatible [22], and comprises an almost equal number (~16) of AA and MA monomers. Each AA and MA monomer unit possesses one and two hydrophilic COOH groups, respectively. Many of them can be strongly conjugated to nanoparticle surfaces, thereby imparting the resulting nanoparticle colloids with stability in aqueous solutions. Notably, PAAMA was successfully used as a surface-coating ligand of iron oxide nanoparticles to provide good colloidal stability [23], and thus, applied for Gd2O3 nanoparticles herein. The performance of PAAMA as a surface-coating ligand was investigated by analyzing the synthesized PAAMA-coated ultrasmall Gd2O3 nanoparticles via various experimental techniques. Furthermore, the in vitro cellular toxicities and water proton spin relaxivities of the synthesized nanoparticles were measured, and their effectiveness as a potential T1 MRI contrast agent was investigated by obtaining in vivo T1 MR images of mice in a 3.0 T MR field.
2. Materials and Methods
2.1. Chemicals
GdCl3.xH2O (99.9%), triethyleneglycol (TEG, 99%), NaOH (>99.9%), and PAAMA (50 wt.% in water, Mw = ~3000 amu) were purchased from Sigma-Aldrich, St. Louis, MO, USA, and used as-received. Ethanol (99%) was purchased from Duksan Chemical Co., South Korea, and used as-received for the initial washing of the nanoparticles. Triple-distilled water was used for the final washing of the nanoparticles and preparation of the solution samples.
2.2. Synthesis of PAAMA-Coated Ultrasmall Gd2O3 Nanoparticles
The reaction scheme is shown in Figure 1. Three different solutions were prepared: (1) A total of 2 mmol of GdCl3.xH2O was dissolved in 20 mL of TEG in a three-necked round-bottom flask. The solution was stirred magnetically at 60 °C for 1 h under atmospheric conditions. (2) A total of 9 mmol of NaOH in 20 mL of TEG was prepared in a separate beaker, which was then added slowly to the abovementioned precursor solution until the pH of the solution reached ~10. (3) A total of 0.25 mmol of PAAMA prepared in 10 mL of TEG was added to the abovementioned solution. The mixture solution was magnetically stirred at 180 °C for 13 h. The product solution was cooled to room temperature, after which it was mixed with 400 mL of ethanol. The solution was magnetically stirred for 10 min and stored in a refrigerator until the product nanoparticles precipitated at the bottom of the beaker. The upper clear solution was decanted, and 400 mL of ethanol was added to the remaining solution. This washing process was repeated thrice. To remove ethanol from the product nanoparticles, the product solution was diluted with 400 mL of triple-distilled water and concentrated with a rotatory evaporator until the volume of the solution reached ~50 mL. This washing process was also repeated thrice. The concentrated solution was divided into two equal volumes: one half of the volume was diluted with triple-distilled water to produce a nanoparticle solution sample, and the other half of the volume was dried in air to prepare a powder sample for the various characterizations.
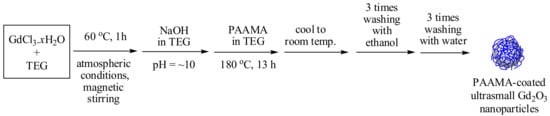
Figure 1.
Reaction scheme (one-pot polyol synthesis) of the poly(acrylic acid-co-maleic acid) (PAAMA)-coated ultrasmall Gd2O3 nanoparticles. TEG = triethylene glycol.
2.3. Characterizations
The particle diameter of the PAAMA-coated ultrasmall Gd2O3 nanoparticles was measured using a high-resolution transmission electron microscope (HRTEM) (Titan G2 ChemiSTEM CS Probe, FEI, Hillsboro, OR, USA) operated at 200 kV acceleration voltage. The Gd concentration of the aqueous solution sample was determined using an inductively coupled plasma atomic emission spectrometer (ICPAES) (IRIS/AP, Thermo Jarrell Ash Co., Waltham, MA, USA). The hydrodynamic diameter was measured using a dynamic light-scattering (DLS) particle size analyzer (Zetasizer Nano ZS, Malvern, Malvern, UK) and a 0.01 mM Gd solution sample. The zeta potentials (Zetasizer Nano ZS, Malvern, Malvern, UK) were measured using a nanoparticle suspension sample with 1.0 mM Gd. The crystal structure of the powder sample before and after thermogravimetric analysis (TGA) was measured using a multi-purpose X-ray diffraction (XRD) spectrometer (X’PERT PRO MRD, Philips, The Netherlands) with an unfiltered CuKα radiation (λ = 1.54184Å). A Fourier transform-infrared (FT-IR) absorption spectrometer (Galaxy 7020A, Mattson Instrument Inc., Madison, WI, USA) was used to investigate the surface coating of the nanoparticles using a powder sample pelletized with KBr. The amount of PAAMA coating on nanoparticle surfaces was estimated by recording the TGA curve (SDT-Q600, TA Instrument, New Castle, DE, USA) between room temperature and 900 °C while air flowed over the powder sample. A vibrating sample magnetometer (VSM) (7407-S, Lake Shore Cryotronics Inc., Westerville, OH, USA) was used to characterize the magnetic properties of the powder sample (20–30 mg) by recording the magnetization (M) versus applied field (H) (or M−H) curve (−2.0 T ≤ H ≤ 2.0 T) at 300 K. The net M value of the sample (only Gd2O3 nanoparticles without the PAAMA coating) was estimated using the net mass of the sample extracted from the TGA curve.
2.4. In Vitro Cellular Toxicity Measurements
The in vitro cellular toxicity of the nanoparticle solution sample was assessed using a CellTiter-Glo Luminescent Cell Viability Assay (Promega, Madison, WI, USA). In this assay, a luminometer (Synergy HT, BioTek, Winooski, VT, USA) was used to quantify intracellular adenosine triphosphate. Two cell lines, such as human prostate cancer (DU145) and normal mouse hepatocyte (NCTC1469), were used as the test cells. Both cells were seeded on a 24-well cell culture plate and incubated for 24 h (5 × 10⁴ cell density, 500 μL of cells per well, 5% CO2, and 37 °C). Roswell Park Memorial Institute (RPMI) 1640 and Dulbecco’s Modified Eagle Medium (DMEM) were used as culture media for DU145 and NCTC1469 cells, respectively. Five test nanoparticle solutions were prepared by diluting the original concentrated nanoparticle solution sample (18.0 mM Gd) with a sterile phosphate-buffered saline solution, and 2 μL of each test nanoparticle solution sample was added to the above cultured cells to obtain Gd-concentrations of 10, 50, 100, 200, and 500 μM Gd in them. Thereafter, the treated cells with nanoparticle solutions were incubated for 48 h. A total of 200 μL of CellTiter-Glo reagent was added to 200 μL of the above incubated treated cells per well and the cells were lysed for 30 min on an orbital shaker. The viabilities of the cells were measured using the luminometer (300–700 nm), and normalized with respect to that of the control cells with 0.0 M Gd. The measurements were repeated in triplicate to estimate average cell viabilities.
2.5. Relaxometric Property Measurements
The longitudinal (T1) and transverse (T2) water proton spin relaxation times were measured at 22 °C using a 3.0 T MRI scanner (Magnetom Trio Tim, Siemens, Munchen, Bayern, Germany). A series of nanoparticle solution samples (0.5, 0.25, 0.125, and 0.0625 mM Gd) were prepared by diluting the original concentrated nanoparticle solution sample with triple-distilled water. Then, these dilute solutions were used for the measurements of the T1 and T2 relaxation times. The longitudinal (r1) and transverse (r2) water proton spin relaxivities were estimated from the slopes of the plots of 1/T1 and 1/T2 versus the Gd-concentration, respectively. The longitudinal (R1) and transverse (R2) relaxations were obtained from 1/T1 and 1/T2, respectively. R1 and R2 map images were then obtained from R1 and R2 values of the samples. The T1 relaxation times were measured by the inversion recovery method. In this method, the inversion time (TI) was varied at 3.0 T, and the MR images were acquired at 35 different TI values in the range from 50 to 1750 ms. The T1 relaxation times were then obtained from the nonlinear least-squares fits to the measured signal intensities at various TI values. For the multiple spin-echo measurements of the T2 relaxation time, the Carr–Purcell–Meiboon–Gill pulse sequence was employed. Thereafter, 34 images were acquired at 34 different echo time (TE) values in the range from 10 to 1900 ms. The T2 relaxation times were obtained from the nonlinear least-squares fits to the mean pixel values for multiple spin-echo measurements at various TE values. The following parameters were employed for the measurements: external MR field (H) = 3.0 T, temperature (T) = 22 °C, number of acquisitions (NEX) = 1, field of view (FOV) = 16 cm, FOV phase = 0.5, matrix size = 256 × 128, slice thickness = 5 mm, pixel spacing = 0.625 mm, pixel band width = 122.10 Hz, and repetition time (TR) = 2000 ms.
2.6. In Vivo T1 MR Image Measurements
The in vivo animal imaging experiments were performed according to the rules and regulation of the animal research committee of the Korea Institute of Radiological and Medical Sciences (approval number = Kirams2018-0072 and approval data: 2019-01-09). The same 3.0 T MRI scanner was used to obtain in vivo T1 MR images. Two male Balb/c nude mice (~20 g) were used. The mice were anesthetized using 1.5% isoflurane in oxygen. The measurements were performed before and after the injection of a nanoparticle solution sample into mice tail veins. The injection dose was approximately 0.1 mmol Gd/kg. During measurements, body temperature of the mice was maintained at 37 °C using a warm water blanket. After measurements, the mice were revived from anesthesia and placed in a cage with free access to food and water. For the in vivo images, radio-frequency spoiled T1-weighted, gradient-recalled echo (GRE) sequences were used. The typical measurement parameters are as follows: applied MR field (H) = 3.0 T, temperature = 37 °C, echo time = 12 ms, repetition time = 564 ms, pixel bandwidth = 15.63 Hz, frequency = 256 Hz, phase = 256, number of acquisitions = 3, field of view = 60 mm, phase field of view = 1, slice thickness = 1.0 mm, number of slices = 24, and spacing gap = 1.1 mm.
3. Results
3.1. Particle Diameter
The ultrasmall nanoparticle dispersions were identified through the Gd-elemental mapping of a high-angle annular dark field-scanning transmission electron microscope (HAADF-STEM) image on a 30 nm scale (Figure 2a). As shown in Figure 2a, the well-dispersed, PAAMA-coated ultrasmall Gd2O3 nanoparticles are observed. Thereafter, the particle diameters were estimated by measuring HRTEM images. As shown in Figure 2b, particle diameters are nearly monodispersed and ultrasmall, ranging from 1 to 3 nm. The inset is a magnified image of a nanoparticle (labeled as a dotted circle) on a 2 nm scale, which shows the lattice fringe distance of 0.30 ± 0.01 nm, matching that of (222) planes of cubic Gd2O3 [24]. The average particle diameter (davg) was estimated to be 1.8 ± 0.1 nm using a log-normal function fit to the observed particle diameter distribution (Figure 2c and Table 1).
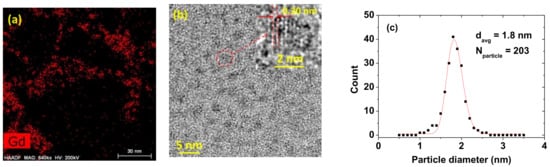
Figure 2.
(a) High-angle annular dark field-scanning transmission electron microscope (HAADF-STEM) elemental mapping image exhibiting the dispersions of the PAAMA-coated ultrasmall Gd2O3 nanoparticles. (b) High-resolution transmission electron (HRTEM) image of the PAAMA-coated ultrasmall Gd2O3 nanoparticles [red dotted circle is magnified at the top (as indicated with an arrow) as an inset on a 2 nm scale with a (222) plane lattice distance (labeled as dotted lines and arrows) of 0.30 ± 0.01 nm]. (c) Particle diameter distribution and a log-normal function fit to obtain davg (Nparticle is the total number of nanoparticles used for the fit).

Table 1.
Summary of the PAAMA-coated ultrasmall Gd2O3 nanoparticles.
3.2. Colloidal Stability
The colloidal stability was investigated by measuring the hydrodynamic diameter and zeta potential, as well as through the inspection of any nanoparticle precipitation in an aqueous nanoparticle solution sample (18.0 mM Gd). The average hydrodynamic diameter (aavg) was estimated to be 9.0 ± 0.2 nm from the log-normal function fit of the observed DLS pattern (Figure 3a and Table 1). It was measured three times with time intervals of 10 min (inset in Figure 3a) and the values were consistent with each other. A large aavg indicates that the PAAMA-coated ultrasmall Gd2O3 nanoparticles were extensively hydrated by many water molecules, thus explaining the observed good colloidal stability. This is attributable to the presence of many hydrophilic COO- groups in the PAAMA polymers, which attracted many water molecules to the nanoparticles. Moreover, the high negative zeta potential (−43.9 mV) of the PAAMA-coated ultrasmall Gd2O3 nanoparticles in aqueous solutions also explains the observed good colloidal stability (Figure 3b). The aqueous nanoparticle solution sample did not show any precipitation of the PAAMA-coated ultrasmall Gd2O3 nanoparticles in the solution after synthesis (>1 year), further explaining the observed good colloidal stability (Figure 3c). The colloidal dispersion of the PAAMA-coated ultrasmall Gd2O3 nanoparticles in an aqueous solution was confirmed through laser-light scattering (the Tyndall effect, left vial in Figure 3d), which was not observed in the vial that contained triple-distilled water (right vial in Figure 3d). Because the COOH groups of PAAMA possess a much higher binding affinity to the nanoparticles than the OH groups of TEG, most of the TEG molecules were likely replaced with PAAMA during the surface-coating reaction for 13 h. Then, the synthesized nanoparticles were thoroughly washed with 400 mL of ethanol (three times) to remove the solvent (TEG) as much as possible, including other reactants. Hence, the TEG molecules, which remained in the sample, would be fewer or negligible. Notably, if most of the TEG were not removed from the nanoparticles, the colloidal stability would not be good because TEG-coated nanoparticles generally settle in a solution after a few days. In addition, the colloidal stability was tested in the presence of magnetic field employing strong neodymium permanent-magnet disks for seven days (Figure 3e). No precipitation of the nanoparticles was observed, thus confirming the good colloidal stability of the PAAMA-coated ultrasmall Gd2O3 nanoparticles in a magnetic field. The large hydrodynamic diameter might indicate the nanoparticle aggregation. However, because of the observed long-term good colloidal stability of the nanoparticle colloids (>1 year), the nanoparticle aggregation would not be severe even if it did exist.
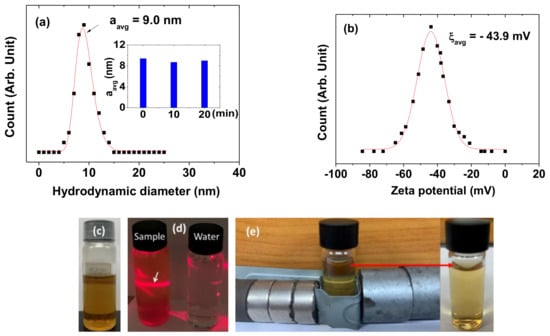
Figure 3.
(a) Dynamic light-scattering (DLS) pattern and a log-normal function fit to obtain aavg. Inset is a plot of the aavg measured as a function of time (min). (b) Zeta potential curve and a Gaussian function fit to obtain ξavg. (c) Photograph of an aqueous nanoparticle solution sample showing the good colloidal dispersion without precipitation of PAAMA-coated ultrasmall Gd2O3 nanoparticles in solution. (d) The Tyndall effect (laser-light scattering) confirming the colloidal dispersion of PAAMA-coated ultrasmall Gd2O3 nanoparticles in solution. The effect (indicated with an arrow) was only observed in the nanoparticle solution sample (left vial); it was not observed in triple-distilled water (right vial). (e) Test for the colloidal stability in a magnetic field with no precipitation of the nanoparticles (experimental set-up (left) and a photograph of the solution sample after the experiment (right)).
3.3. Crystal Structure
The XRD patterns were recorded before and after TGA, as shown in the bottom and top XRD patterns in Figure 4, respectively. Before TGA, the XRD pattern was broad and amorphous because of the incomplete crystallization of the synthesized nanoparticles due to their ultrasmall particle sizes [25]. However, after TGA up to 900 °C, the XRD pattern exhibited sharp peaks, which corresponded to those of cubic Gd2O3 with the JCPDS card no. 43–1014 [24]. This could be attributed to the particle-size growth and crystallization of the nanoparticles after TGA [26]. All the peaks after TGA could be assigned the (hkl) Miller indices, and only the strong peaks were representatively assigned in the XRD pattern. The estimated lattice constant (L) after TGA was 10.814 Å, which was consistent with the previously reported value [24].
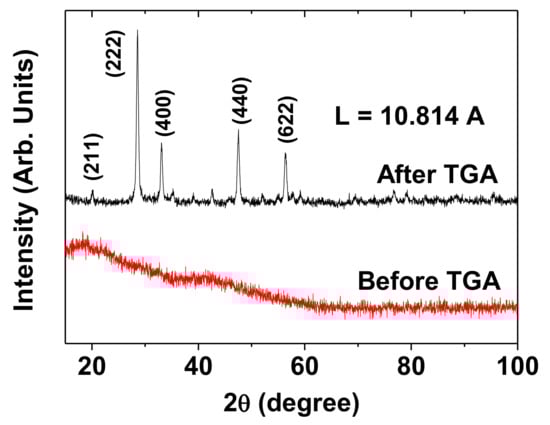
Figure 4.
XRD patterns of the powder sample before (bottom spectrum) and after (top spectrum) thermogravimetric analysis (TGA). All the peaks after TGA could be assigned the (hkl) Miller indices of cubic Gd2O3, and only the intense peaks were representatively assigned in the XRD pattern. “L” = lattice constant.
3.4. Surface-Coating Results
The surface coating was investigated by recording the FT-IR absorption spectra and TGA curve. The C–H and C=O stretches of PAAMA were observed in the spectrum of the powder sample (Figure 5a), thus confirming the successful surface coating of the Gd2O3 nanoparticles with PAAMA. The coating structure of PAAMA on the nanoparticle surface is shown in Figure 5b. As shown in Figure 5b, many carboxylic groups in PAAMA strongly bonded to many Gd3+ on the nanoparticle surface. The COO- stretch at 1537 cm−1 in the spectrum of the sample was red-shifted by 161 cm−1 from the C=O stretch at 1698 cm−1 of the free PAAMA, thereby confirming the strong coordination bonds. Such red-shifts, which have been observed in many surface-coated metal oxide nanoparticles with ligands containing carboxylic groups, further support our results [27,28,29,30]. This type of bonding corresponds to the hard acid (Gd3+ on the nanoparticle surface)−hard base (COO- of PAAMA) type of bonding [31,32].
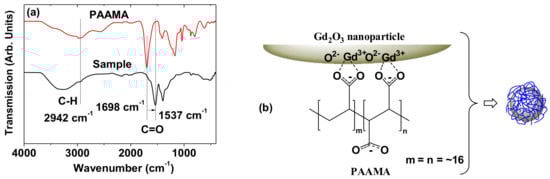
Figure 5.
(a) FT-IR absorption spectra of the powder sample (bottom spectrum) and free PAAMA (top spectrum). The arrow indicates the red-shift of the C=O stretch. (b) Coating structure of PAAMA on the ultrasmall Gd2O3 nanoparticle surface. Each PAAMA was strongly bonded to the ultrasmall Gd2O3 nanoparticle surface through many coordination bonds between many COO- groups of PAAMA and many Gd3+ on the nanoparticle surface (approximately six PAAMA polymers were coated per nanoparticle, as estimated from TGA).
The amount (P) of PAAMA coating on the ultrasmall Gd2O3 nanoparticle surface was 40.3%, as estimated from the mass drop in the TGA curve that was caused by the PAAMA combustion reaction with flowing hot air after considering the initial mass drop of 19.9 wt.% between room temperature and ~105 °C due to water and air desorption (Figure 6). The remaining 39.8 wt.% was due to the Gd2O3 nanoparticles. Using the abovementioned P-value, davg from HRTEM imaging, and bulk density (7.41 g/cm3) of Gd2O3 [33], the grafting (or coating) density (σ) [34,35], which corresponds to the average number of PAAMA polymers coating a nanoparticle unit surface area, was estimated to be 0.48 nm−2. By multiplying σ by the nanoparticle surface area (=πdavg2), the average number (N) of PAAMA polymers coating a nanoparticle was estimated to be ~6. As each PAAMA (Mw = ~3000 amu), as a copolymer, comprises (AA)m and (MA)n monomer units (m = n = ~16) (Figure 5b), each PAAMA has ~48 COO− groups because of the presence of one COO- group per AA and two COO- groups per MA. Thus, there are ~288 COO- groups per nanoparticle (some of them are conjugated to the nanoparticle surface, while the others are free). The surface-coating results are summarized in Table 1.
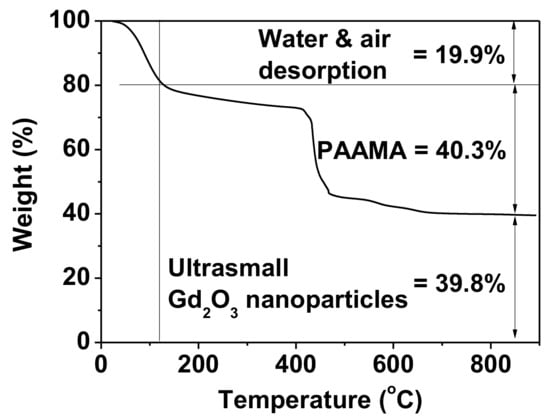
Figure 6.
TGA curve of the powder sample exhibiting wt.% of PAAMA (40.3%) and that of the ultrasmall Gd2O3 nanoparticles (39.8%) after assessing wt.% of water and air desorption (19.9%) from the sample.
3.5. Cell Viability
The PAAMA-coated ultrasmall Gd2O3 nanoparticles were nearly non-toxic up to 500 μM Gd in the DU145 and NCTC1469 cell lines (Figure 7). This was due to the biocompatible PAAMA coating on the nanoparticle surfaces.
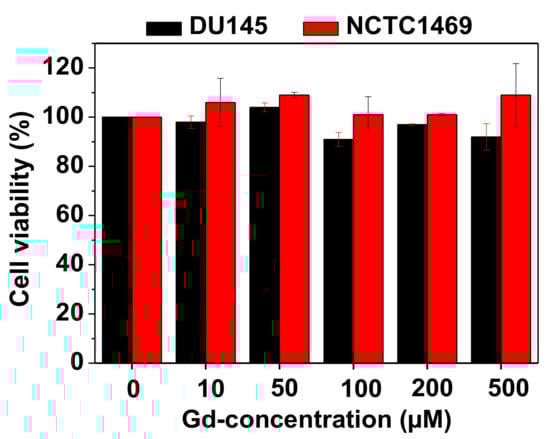
Figure 7.
In vitro cell viabilities of the PAAMA-coated ultrasmall Gd2O3 nanoparticles on the DU145 and NCTC1469 cells as a function of Gd-concentration, which showed extremely low cellular toxicities.
3.6. Magnetic Properties
The magnetic properties of the PAAMA-coated ultrasmall Gd2O3 nanoparticles were characterized by recording the M−H curve (−2.0 T ≤ H ≤ 2.0 T) at 300K. The measured M value of the sample was mass-corrected using the net mass (the mass of the Gd2O3 nanoparticles without PAAMA) that was estimated from the TGA curve. As shown in Figure 8, the nanoparticles are paramagnetic (no hysteresis, zero coercivity, and zero remanence on the M−H curve), similar to the corresponding bulk material [36,37,38]. From the mass-corrected M−H curve (Figure 8), the estimated net M value at 2.0 T was 1.71 emu/g (Table 1). This value at 300 K was appreciable and originates from S = 7/2 of Gd3+ (7/2S).
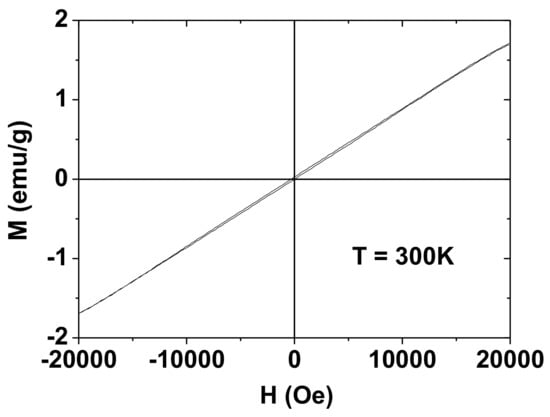
Figure 8.
M-H curve of the PAAMA-coated ultrasmall Gd2O3 nanoparticles at 300 K, showing paramagnetism. The M value is the net M value of the ultrasmall Gd2O3 nanoparticles only (without PAAMA), which was estimated from the net mass of the ultrasmall Gd2O3 nanoparticles that was obtained by TGA.
3.7. r1 and r2 Values
r1 and r2 at the 3.0 T MR field were estimated from the slopes of the plots of inverse T1 and T2 water proton spin relaxation times as a function of the Gd-concentration, respectively (Figure 9a). The estimated r1 and r2 values are 40.6 and 63.4 s−1mM−1 (r2/r1 = 1.56), respectively (Table 1). r1 value is approximately 10 times higher than those [2,3] of commercial molecular T1 MRI contrast agents. These high r1 and r2 values indicate that the PAAMA-coated ultrasmall Gd2O3 nanoparticles could strongly induce T1 and T2 water proton spin relaxations. These were demonstrated in vitro by measuring the R1 and R2 map images, in which dose-dependent contrast changes were clearly observed by an increase in the Gd-concentration (Figure 9b). The particle size of the core Gd2O3 nanoparticles is important for the r1 value. The previous study suggested that the optimal particle diameter for the r1 value is 1.0 to 2.5 nm [39]. The observed particle diameter is also within this size range.
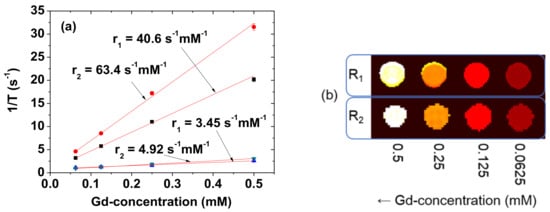
Figure 9.
(a) Plots of 1/T1 and 1/T2 of the solution sample and the reference (Dotarem) as a function of the Gd-concentration. The slopes correspond to the r1 and r2 values, respectively. (b) The R1 and R2 map images showing clear dose-dependent contrast changes.
3.8. In Vivo T1 MR Images at the 3.0 T MR Field
To demonstrate the effectiveness of the PAAMA-coated ultrasmall Gd2O3 nanoparticles as a T1 MRI contrast agent, in vivo T1 MR images were obtained at the 3.0 T MR field before and after the administration of an aqueous solution sample into the mice tail veins. As shown in Figure 10a, positive-contrast enhancements were clearly observed in the liver and kidneys after the administration, thus confirming that the nanoparticles functioned as a T1 MRI contrast agent. The signal-to-noise ratios (SNR) of regions-of-interest (ROI) (labeled as dotted circles in Figure 10a) were plotted as a function time (Figure 10b) and indicated that the SNRs reached the maxima ~30 min after the administration before decreasing with time because of the excretion of the nanoparticles from the liver and kidneys. These excretions were due to the ultrasmall particle sizes of the nanoparticles, as observed in various ultrasmall nanoparticle systems [10,11,12]. The T1 MR images and SNR plots indicate a fast requisition of the nanoparticles by macrophages, so the trend of these nanoparticles is to be quickly accumulated in the kidneys and liver. The average core particle diameter of the nanoparticles is 1.8 nm. Thus, the surface-coating with PAAMA mainly contributed to the observed large hydrodynamic diameter (aavg = 9.0 nm). However, it is known that polymeric nanoparticles with large hydrodynamic diameters (>100 nm) [40] or large molecular weights (~16.2 kD) [41] could be excreted through the renal system. Therefore, the observed renal excretion might be because most part of the nanoparticles are polymers. In addition, the mice survived after in vivo MRI experiments, thereby confirming the good biocompatibility of the synthesized nanoparticles. These results further indicate that the PAAMA-coated ultrasmall Gd2O3 nanoparticles are a potential T1 MRI contrast agent.
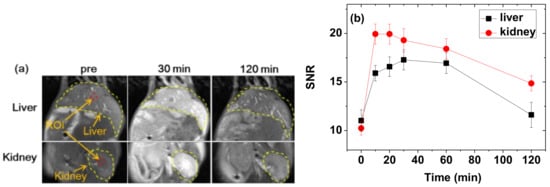
Figure 10.
(a) In vivo T1 MR images of the liver and kidneys before and after the intravenous administration of the aqueous solution sample to the mice tails. Small red dotted circles = ROI and yellow dotted lines = liver or kidney. (b) Plots of SNR of ROI as a function of time (p-values between 0 timepoint and the other timepoints: p-value = 0.029 * for 10, 20, 30, and 60 min for both the liver and kidneys, p-value = 0.486 for 120 min for the liver, and p-value = 0.032 * for 120 min for the kidneys). “pre” = before administration, “SNR” = signal-to-noise ratio, and “ROI” = region-of-interest.
4. Discussion
The obtained high r1 value of the PAAMA-coated ultrasmall Gd2O3 nanoparticles is attributable to the hydrophilic PAAMA coating on the nanoparticle surface in addition to the ultrasmall core particle size. Owing to the presence of ~288 COO− groups per nanoparticle, as previously mentioned, the PAAMA-coated ultrasmall Gd2O3 nanoparticles could strongly attract numerous water molecules to the nanoparticle surface, which eases the diffusion of the water molecules around the nanoparticle, thereby causing heavy hydration (a large hydrodynamic diameter) (Figure 11). Therefore, many water molecules interacted with many Gd3+ on the nanoparticle surface, thus achieving an extremely high r1 value based on the inner-sphere model [2,3].
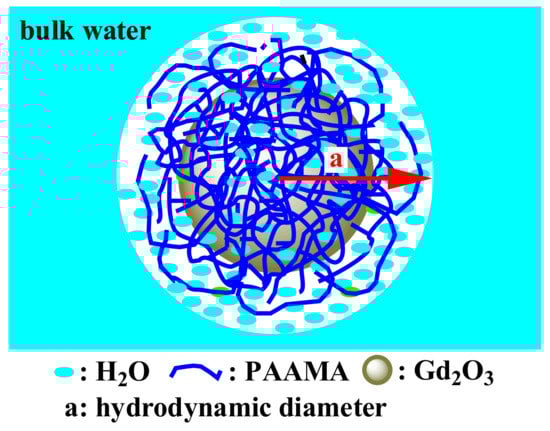
Figure 11.
Model picture showing the numerous water molecules that were attracted by the PAAMA polymers coating the ultrasmall Gd2O3 nanoparticle surface, which availed a large hydrodynamic diameter (a) and, as a result, a very high r1 value and good colloidal stability.
Herein, the relevance of PAAMA as a surface-coating ligand is not just limited to the surface-coating of the ultrasmall Gd2O3 nanoparticles. Each PAAMA possesses ~48 COOH groups. Therefore, functional molecules, such as drugs and cancer-targeting ligands, could be easily attached to the PAAMA-coated ultrasmall Gd2O3 nanoparticles by conjugating them to the free COOH groups of PAAMA through the amide bond, making the nanoparticles relevant cancer theragnostic agents. In addition, other imaging agents such as dyes would be conjugated to the nanoparticles to make the nanoparticles suitable multimodal imaging agents.
Compared with other hydrophilic biocompatible polymers with many carboxylic groups, such as poly(acrylic acid) (PAA) [42] and poly(methyl vinyl ether-alt-maleic acid) (PMVEMA) [43], their average hydrodynamic diameters are generally large, and all r1 values are approximately 10 times higher than those [2,3] of commercial molecular contrast agents (Table 2). These results are similar to those reported herein and indicate that, as explained above, such polymers allow heavy hydration of numerous water molecules around the nanoparticle surface. Therefore, they afford extremely high r1 values and good colloidal stability. Hence, hydrophilic biocompatible polymers comprising many carboxylic groups are good candidates as surface-coating ligands of ultrasmall Gd2O3 nanoparticles to be employed as T1 MRI contrast agents. Further, such hydrophilic polymer coatings impart the nanoparticles with good biocompatibility, as confirmed by the very low cellular toxicities in this (Figure 7) and previous works [42,43].
Table 2.
r1 and r2 values of various hydrophilic biocompatible polymer-coated ultrasmall Gd2O3 nanoparticles and a commercial molecular agent (for reference).
5. Conclusions
PAAMA was used as a surface-coating ligand of ultrasmall Gd2O3 nanoparticles (davg = 1.8 nm); the results are summarized below.
- (1)
- The abundant carboxylic groups in PAAMA allowed its strong bonding to the nanoparticle surface and the attraction of numerous water molecules around the nanoparticle surface, thereby achieving a large aavg of 9.0 nm. This led to an extremely high r1 value of 40.6 s−1mM−1 (r2/r1 = 1.56) and good colloidal stability, as confirmed by the high zeta potential and absence of precipitation of the nanoparticles in the aqueous solution;
- (2)
- The biocompatible PAAMA coating resulted in extremely low cellular toxicity;
- (3)
- The observed r1 value was ~10 times higher than those of commercial molecular contrast agents. Thus, strong positive-contrast enhancements in the in vivo T1 MR images were observed. However, more studies, including the pharmacokinetic study, are required to further demonstrate the possibility of using the synthesized nanoparticles as a powerful T1 MRI contrast agent.
Author Contributions
Conceptualization and formal analysis, Y.-J.J. and S.L.; methodology, S.L.H.; investigation, J.A.P., H.C. and K.-S.C.; data curation, H.Y., S.M., A.G., M.Y.A., X.M. and T.T.; writing—original draft preparation, Y.-J.J.; writing—review and editing, G.H.L.; supervision, Y.C. and G.H.L.; funding acquisition, Y.C. and G.H.L. All authors have read and agreed to the published version of the manuscript.
Funding
This study was supported by the Basic Science Research Program (Grant No. 2016R1D1A3B01007622 to G.H.L. and 2020R1A2C2008060 to Y.C.) of the National Research Foundation funded by the Ministry of Education, Science, and Technology.
Acknowledgments
We would like to thank the Korea Basic Science Institute for allowing us to use their XRD machine.
Conflicts of Interest
The authors declare no conflict of interest.
References
- Hashemi, R.H.; Bradley, W.G.; Lisanti, C.J. MRI the Basics; Lippincott Williams & Wilkins: New York, NY, USA, 2004. [Google Scholar]
- Lauffer, R.B. Paramagnetic metal complexes as water proton relaxation agents for NMR imaging: Theory and design. Chem. Rev. 1987, 87, 901–927. [Google Scholar] [CrossRef]
- Caravan, P.; Ellison, J.J.; McMurry, T.J.; Lauffer, R.B. Gadolinium(III) chelates as MRI contrast agents: Structure, dynamics, and applications. Chem. Rev. 1999, 99, 2293–2352. [Google Scholar] [CrossRef]
- Xiao, Y.-D.; Paudel, R.; Liu, J.; Ma, C.; Zhang, Z.-S.; Zhou, S.-K. MRI contrast agents: Classification and application (Review). Int. J. Mol. Med. 2016, 38, 1319–1326. [Google Scholar] [CrossRef]
- Greenwood, N.N.; Earnshaw, A. Chemistry of the Elements; Butterworth-Heinemann: Oxford, UK, 1997; p. 1243. [Google Scholar]
- Guay-Bégin, A.-A.; Chevallier, P.; Faucher, L.; Turgeon, S.; Fortin, A.-A. Surface modification of gadolinium oxide thin films and nanoparticles using poly(ethylene glycol)-phosphate. Langmuir 2012, 28, 774–782. [Google Scholar] [CrossRef]
- Engström, M.; Klasson, A.; Pedersen, H.; Vahlberg, C.; Käll, P.-O.; Uvdal, K. High proton relaxivity for gadolinium oxide nanoparticles. Magn. Reson. Mater. Phys. Biol. Med. 2006, 19, 180–186. [Google Scholar] [CrossRef]
- Mekuria, S.L.; Debele, T.A.; Tsai, H.-C. Encapsulation of gadolinium oxide nanoparticle (Gd2O3) contrasting agents in PAMAM dendrimer templates for enhanced magnetic resonance imaging in vivo. ACS Appl. Mater. Interfaces 2017, 9, 6782–6795. [Google Scholar] [CrossRef] [PubMed]
- Cho, M.; Sethi, R.; Ananta narayanan, J.S.; Lee, S.S.; Benoit, D.N.; Taheri, N.; Decuzzi, P.; Colvin, V.L. Gadolinium oxide nanoplates with high longitudinal relaxivity for magnetic resonance imaging. Nanoscale 2014, 6, 13637–13645. [Google Scholar] [CrossRef] [PubMed]
- Choi, H.S.; Liu, W.; Misra, P.; Tanaka, E.; Zimmer, J.P.; Ipe, B.I.; Bawendi, M.G.; Frangioni, J.V. Renal clearance of quantum dots. Nat. Biotechnol. 2007, 25, 1165–1170. [Google Scholar] [CrossRef] [PubMed]
- Longmire, M.; Choyke, P.L.; Kobayashi, H. Clearance properties of nano-sized particles and molecules as imaging agents: Considerations and caveats. Nanomedicine 2008, 3, 703–717. [Google Scholar] [CrossRef] [PubMed]
- Hainfeld, J.F.; Slatkin, D.N.; Focella, T.M.; Smilowitz, H.M. Gold nanoparticles: A new X-ray contrast agent. Br. J. Radiol. 2006, 79, 248–253. [Google Scholar] [CrossRef] [PubMed]
- Singh, R.; Singh, S. Surface Modification of Nanomaterials for Biomedical Applications: Strategies and Recent Advances. In Nanobiotechnology; Dhawan, A., Singh, S., Kumar, A., Shanker, R., Eds.; CRC Press: Boca Raton, FL, USA, 2018. [Google Scholar]
- Zeng, J.; Jing, L.; Hou, Y.; Jiao, M.; Qiao, R.; Jia, Q.; Liu, C.; Fang, F.; Lei, H.; Gao, M. Anchoring group effects of surface ligands on magnetic properties of Fe3O4 nanoparticles: Towards high performance MRI contrast agents. Adv. Mater. 2014, 26, 2694–2698. [Google Scholar] [CrossRef] [PubMed]
- Tegafaw, T.; Xu, W.; Lee, S.-H.; Chae, K.S.; Cha, H.; Chang, Y.; Lee, G.H. Ligand-size and ligand-chain hydrophilicity effects on the relaxometric properties of ultrasmall Gd2O3 nanoparticles. AIP Adv. 2016, 6, 065114. [Google Scholar] [CrossRef]
- Duan, H.; Kuang, M.; Wang, X.; Wang, Y.A.; Mao, H.; Nie, S. Reexamining the effects of particle size and surface chemistry on the magnetic properties of iron oxide nanocrystals: New insights into spin disorder and proton relaxivity. J. Phys. Chem. C 2008, 112, 8127–8131. [Google Scholar] [CrossRef]
- Thomsen, H.S. Nephrogenic systemic fibrosis: A serious late adverse reaction to gadodiamide. Eur. Radiol. 2006, 16, 2619–2621. [Google Scholar] [CrossRef]
- Gao, S.; Chen, M.-L.; Zhou, Z.-H. Substitution of gadolinium ethylenediaminetetraacetate with phosphites: Towards gadolinium deposit in nephrogenic systemic fibrosis. Dalton Trans. 2014, 43, 639–645. [Google Scholar] [CrossRef]
- Penfield, J.G.; Reilly, R.F., Jr. What nephrologists need to know about gadolinium. Nat. Clin. Pract. Nephrol. 2007, 3, 654–668. [Google Scholar] [CrossRef]
- Hifumi, H.; Yamaoka, S.; Tanimoto, A.; Citterio, D.; Suzuki, K. Gadolinium-based hybrid nanoparticles as a positive MR contrast agent. J. Am. Chem. Soc. 2006, 128, 15090–15091. [Google Scholar] [CrossRef]
- Bridot, J.-L.; Faure, A.-C.; Laurent, S.; Rivière, C.; Billotey, C.; Hiba, B.; Janier, M.; Josserand, V.; Coll, J.-L.; Elst, L.V.; et al. Hybrid gadolinium oxide nanoparticles: Multimodal contrast agents for in vivo imaging. J. Am. Chem. Soc. 2007, 129, 5076–5084. [Google Scholar] [CrossRef]
- Ottenbrite, R.M. Antitumor activity of polycarboxylic acid polymers. J. Macromol. Sci. A 1985, 22, 819–832. [Google Scholar] [CrossRef]
- Tóth, I.Y.; Illés, E.; Bauer, R.A.; Nesztor, D.; Szekeres, M.; Zupkó, I.; Tombácz, E. Designed polyelectrolyte shell on magnetite nanocore for dilution-resistant biocompatible magnetic fluids. Langmuir 2012, 28, 16638–16646. [Google Scholar] [CrossRef]
- International Center for Diffraction Data. Card No. 43-1014, JCPDS-International Centre for Diffraction Data, PCPDFWIN, Software Version 1.30; International Center for Diffraction Data: Newtown Square, PA, USA, 1997. [Google Scholar]
- Söderlind, F.; Pedersen, H.; Petoral, R.M., Jr.; Käll, P.-O.; Uvdal, K. Synthesis and characterisation of Gd2O3 nanocrystals functionalised by organic acids. J. Colloid Interface Sci. 2005, 288, 140–148. [Google Scholar] [CrossRef] [PubMed]
- Kruis, F.E.; Nielsch, K.; Fissan, H.; Rellinghaus, B.; Wassermann, E.F. Preparation of size-classified PbS nanoparticles in the gas phase. Appl. Phys. Lett. 1998, 73, 547–549. [Google Scholar] [CrossRef]
- Duckworth, O.W.; Martin, S.T. Surface complexation and dissolution of hematite by C1-C6 dicarboxylic acids at pH = 5.0. Geochim. Cosmochim. Acta 2001, 65, 4289–4301. [Google Scholar] [CrossRef]
- Hug, S.J.; Bahnemann, D. Infrared spectra of oxalate, malonate and succinate adsorbed on the aqueous surface of rutile, anatase and lepidocrocite measured with in situ ATR-FTIR. J. Electron Spectrosc. Related Phenomena 2006, 150, 208–219. [Google Scholar] [CrossRef]
- Hug, S.J.; Sulzberger, B. In situ Fourier transform infrared spectroscopic evidence for the formation of several different surface complexes of oxalate on TiO2 in the aqueous phase. Langmuir 1994, 10, 3587–3597. [Google Scholar] [CrossRef]
- Mendive, C.B.; Bredow, T.; Blesa, M.A.; Bahnemann, D.W. ATR-FTIR measurements and quantum chemical calculations concerning the adsorption and photoreaction of oxalic acid on TiO2. Phys. Chem. Chem. Phys. 2006, 8, 3232–3247. [Google Scholar] [CrossRef]
- Pearson, R.G. Hard and soft acids and bases, HSAB, part 1: Fundamental principles. J. Chem. Edu. 1968, 45, 581–587. [Google Scholar] [CrossRef]
- Pearson, R.G. Hard and soft acids and bases, HSAB, part II: Underlying theories. J. Chem. Edu. 1968, 45, 643–648. [Google Scholar] [CrossRef]
- Haynes, W.M.; Lide, D.R.; Bruno, T.J. CRC Handbook of Chemistry and Physcis; CRC Press: Boca Raton, FL, USA, 2015–2016; pp. 4–64. [Google Scholar]
- Corbierre, M.K.; Cameron, N.S.; Lennox, R.B. Polymer-stabilized gold nanoparticles with high grafting densities. Langmuir 2004, 20, 2867–2873. [Google Scholar] [CrossRef]
- Benoit, D.N.; Zhu, H.; Lilierose, M.H.; Verm, R.A.; Ali, N.; Morrison, A.N.; Fortner, J.D.; Avendano, C.; Colvin, V.L. Measuring the grafting density of nanoparticles in solution by analytical ultracentrifugation and total organic carbon analysis. Anal. Chem. 2012, 84, 9238–9245. [Google Scholar] [CrossRef]
- Moon, R.M.; Koehler, W.C. Magnetic properties of Gd2O3. Phys. Rev. B 1975, 11, 1609–1622. [Google Scholar] [CrossRef]
- Schinkel, C.J.; van Amstel, W.D. Reduced magnetic moment of gadolinium in the oxyde and the sulphate. Phys. Lett. 1973, 44, 467–468. [Google Scholar] [CrossRef]
- Wolf, W.P.; Meissner, H.; Catanese, C.A. Magnetic properties of rare earth hydroxides. J. Appl. Phys. 1968, 39, 1134–1136. [Google Scholar] [CrossRef]
- Park, J.Y.; Baek, M.J.; Choi, E.S.; Woo, S.; Kim, J.H.; Kim, T.J.; Jung, J.C.; Chae, K.S.; Chang, Y.; Lee, G.H. Paramagnetic ultrasmall gadolinium oxide nanoparticles as advanced T1 MRI contrast agent: Account for large longitudinal relaxivity, optimal particle diameter, and in vivo T1 MR images. ACS Nano 2009, 3, 3663–3669. [Google Scholar] [CrossRef]
- Wyss, P.P.; Lamichhane, S.P.; Abed, A.; Vonwil, D.; Kretz, O.; Huber, T.B.; Sarem, M.; Shastri, V.P. Renal clearance of polymeric nanoparticles by mimicry of glycan surface of viruses. Biomaterials 2020, 230, 119643. [Google Scholar] [CrossRef]
- Huang, H.; Hernandez, R.; Geng, J.; Sun, H.; Song, W.; Chen, F.; Graves, S.A.; Nickles, R.J.; Cheng, C.; Cai, W.; et al. A porphyrin-PEG polymer with rapid renal clearance. Biomaterials 2016, 76, 25–32. [Google Scholar] [CrossRef]
- Miao, X.; Ho, S.L.; Tegafaw, T.; Cha, H.; Chang, Y.; Oh, I.T.; Yaseen, A.M.; Marasini, S.; Ghazanfari, A.; Yue, H.; et al. Stable and non-toxic ultrasmall gadolinium oxide nanoparticle colloids (coating material = polyacrylic acid) as high-performance T1 magnetic resonance imaging contrast agents. RSC Adv. 2018, 8, 3189–3197. [Google Scholar] [CrossRef]
- Ahmad, M.Y.; Ahmad, M.W.; Yue, H.; Ho, S.L.; Park, J.A.; Jung, K.-H.; Cha, H.; Marasini, S.; Ghazanfari, A.; Liu, S.; et al. In vivo positive magnetic resonance imaging applications of poly(methyl vinyl ether-alt-maleic acid)-coated ultra-small paramagnetic gadolinium oxide nanoparticles. Molecules 2020, 25, 1159. [Google Scholar] [CrossRef]
Publisher’s Note: MDPI stays neutral with regard to jurisdictional claims in published maps and institutional affiliations. |
© 2020 by the authors. Licensee MDPI, Basel, Switzerland. This article is an open access article distributed under the terms and conditions of the Creative Commons Attribution (CC BY) license (http://creativecommons.org/licenses/by/4.0/).