Deep-Pneumonia Framework Using Deep Learning Models Based on Chest X-Ray Images


Abstract
1. Introduction
2. Related Works
3. Background of Deep Learning Algorithms
3.1. Convolutional Neural Networks (CNNs)
3.2. Recurrent Neural Networks (RNN)
3.3. Long Short-Term Memory (LSTM)
3.4. Pre-Trained Convolutional Neural Networks
- ResNet152v2 ArchitectureResidual Network (ResNet) is a CNN architecture with hundreds or thousands of convolutional layers. Previous CNN structures decreased the efficacy of additional layers. ResNet contains a huge number of layers, with strong performance [34]. The primary difference between ResNetV2 and the original (V1) is that V2 uses batch normalization before each weight layer. In the field of image recognition and localization tasks, ResNet has strong performance that demonstrates the importance of many visual recognition tasks.
- MobileNetV2 ArchitectureThe architecture of MobileNetV2 is based on an inverted residual structure where the shortcut connections of the residual block are between the thin bottleneck layers. The intermediate expansion layer of the MobileNetV2 uses lightweight depth-wise convolutions in order to filter the features. In traditional residual models, expanded representations in the input are used [34]. MobileNetV2 consists of the primary full convolution layer through 32 filters, followed by 19 residual bottleneck layers.
4. The Deep-Pneumonia Framework
5. The Proposed Architectures
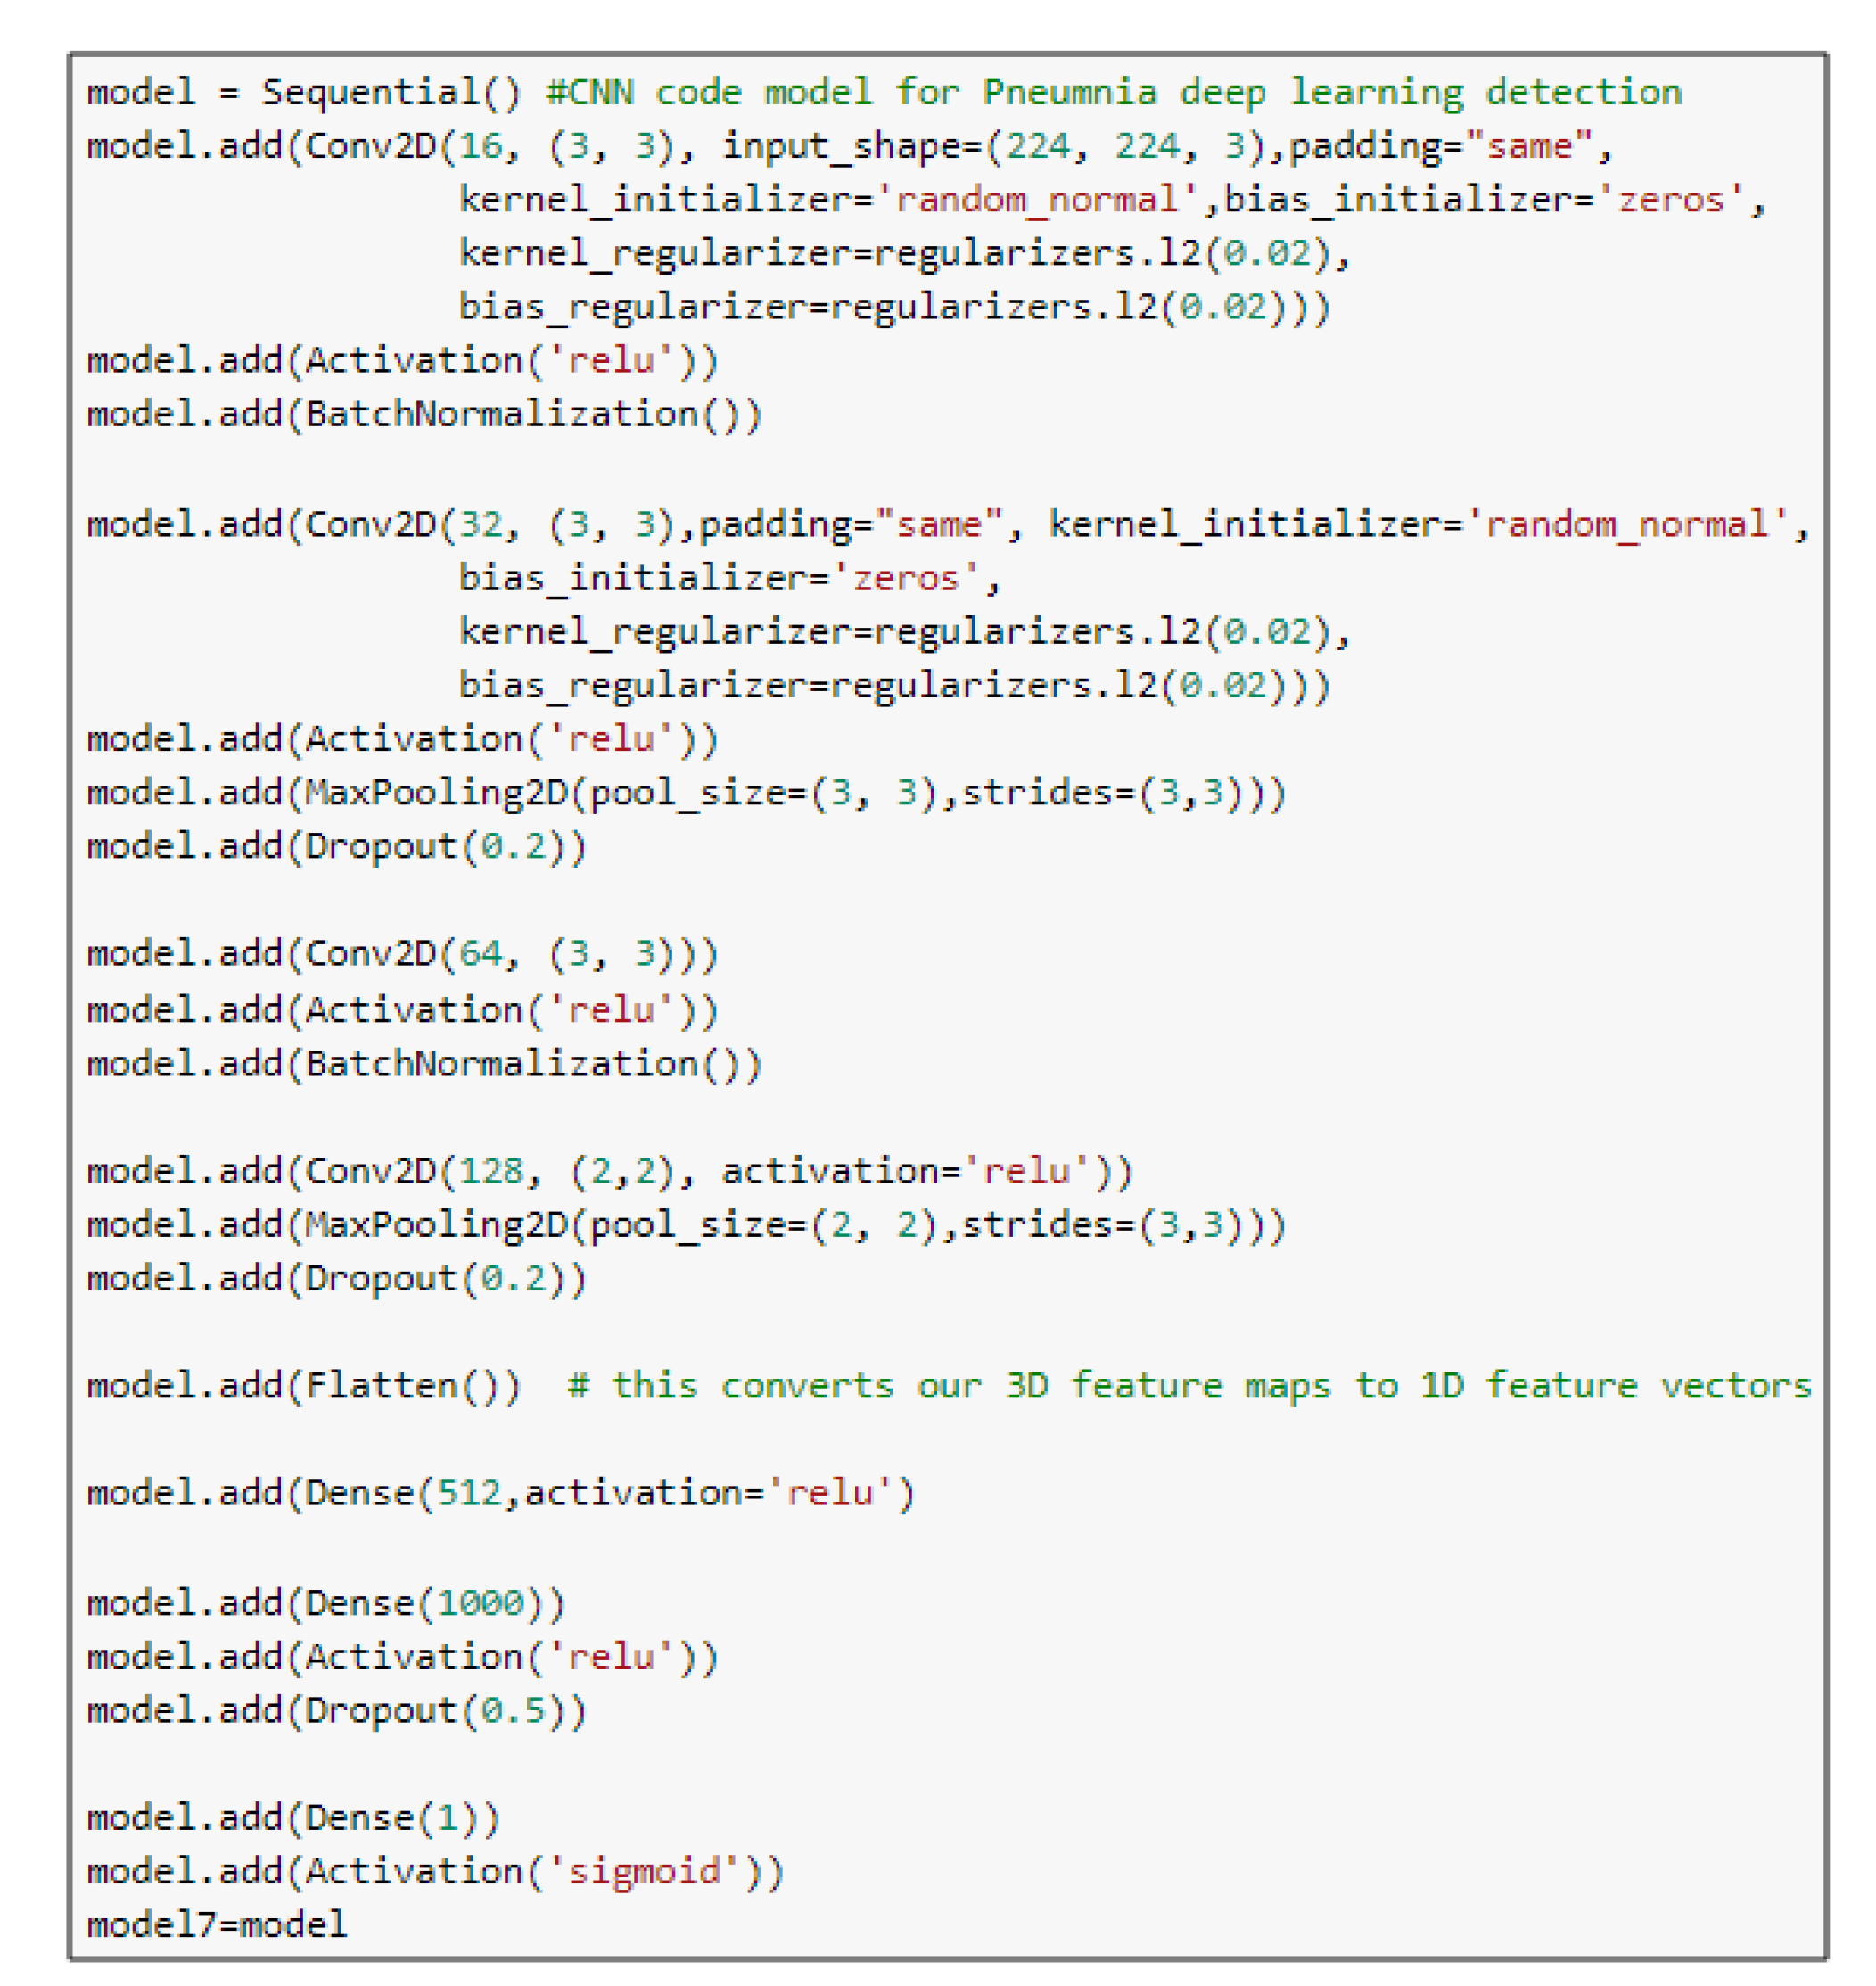
5.1. CNN Model
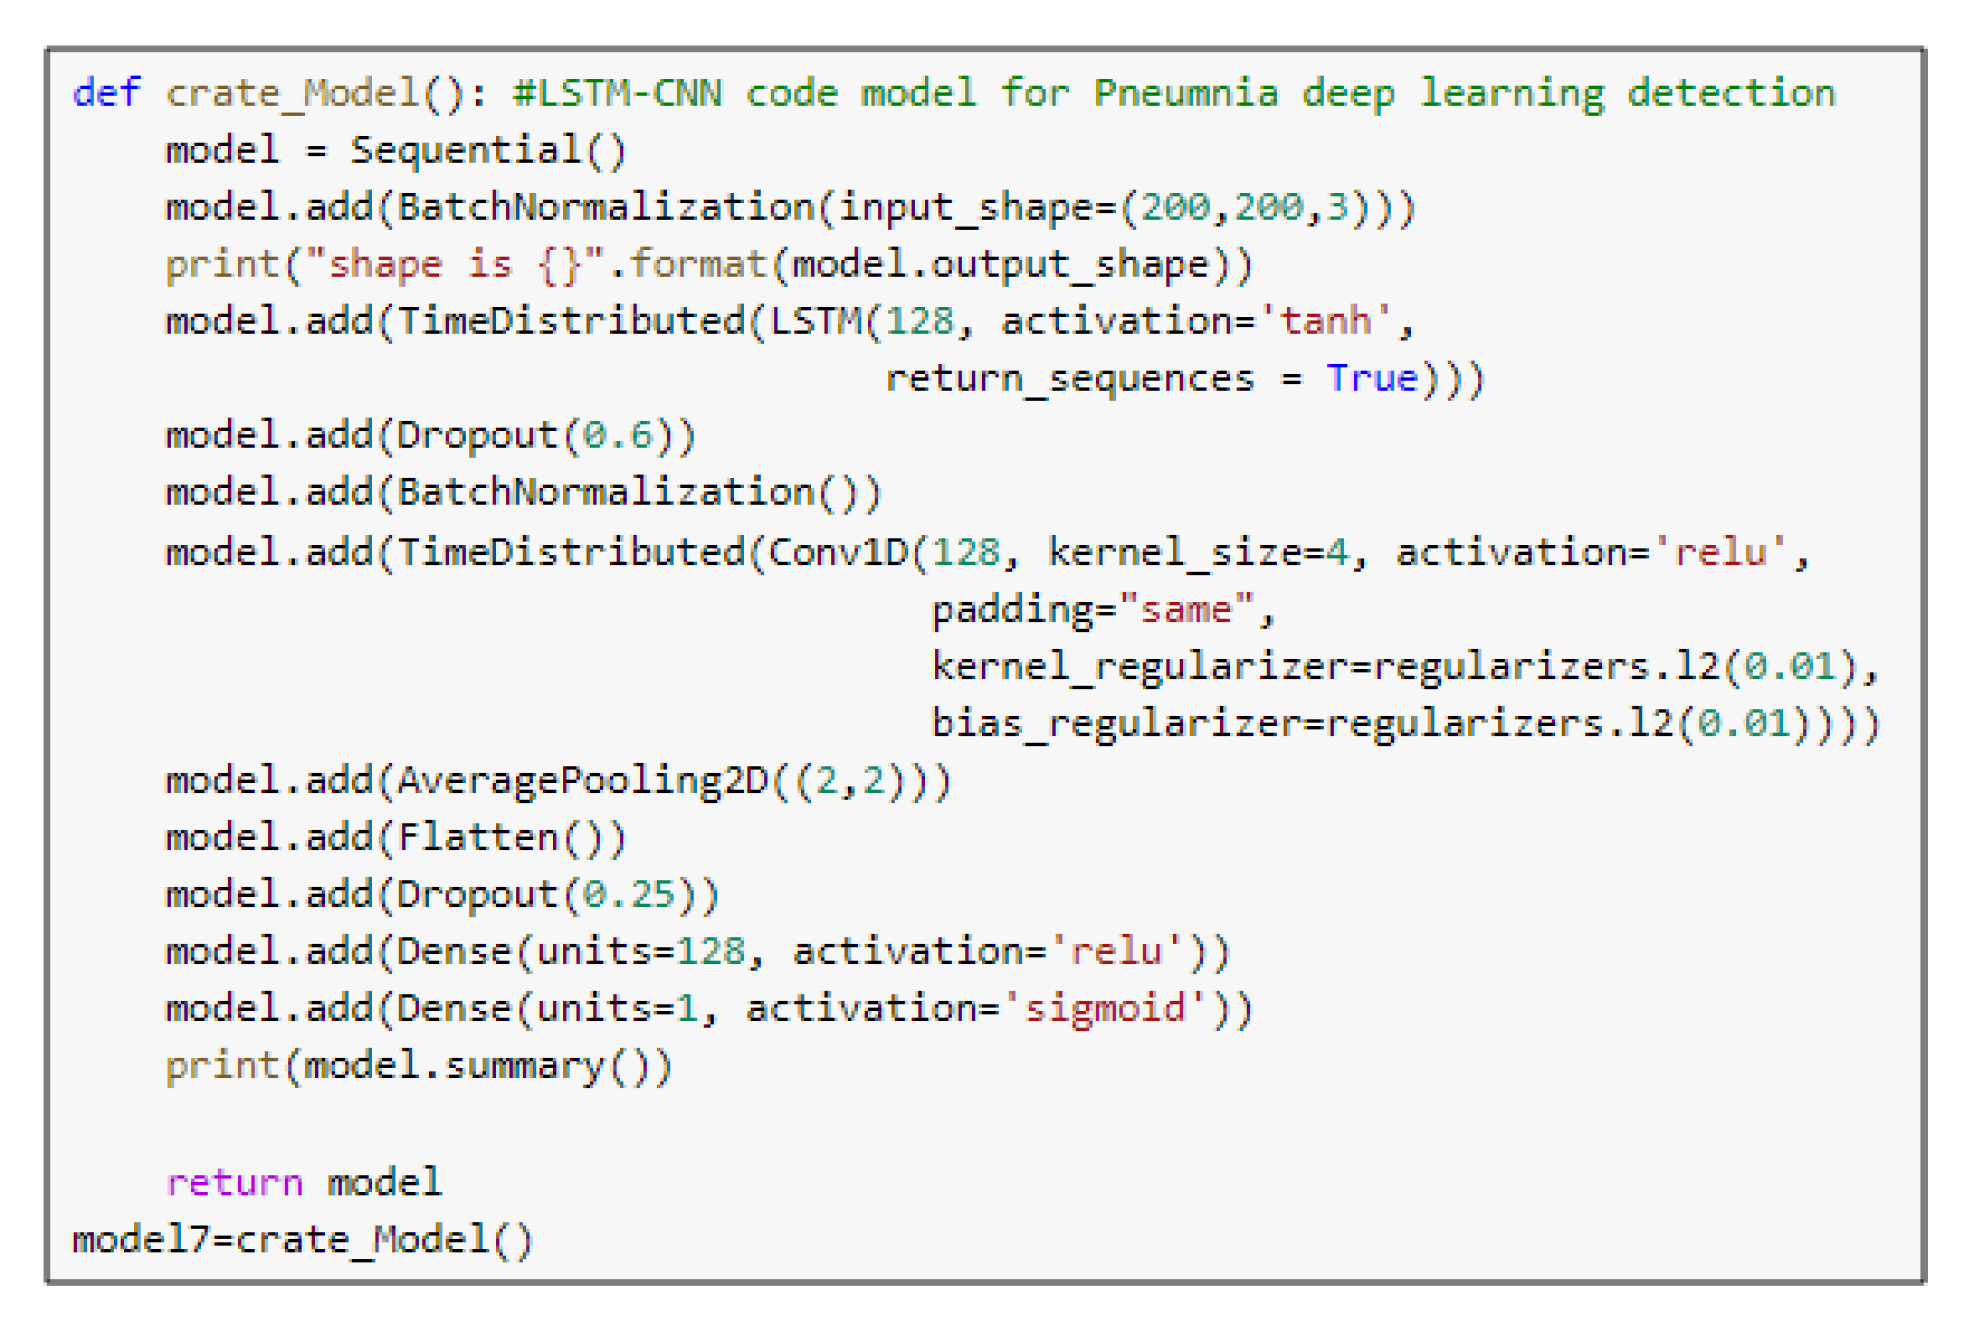
5.2. The LSTM-CNN Model
5.3. Pre-Trained Models
6. Methodology
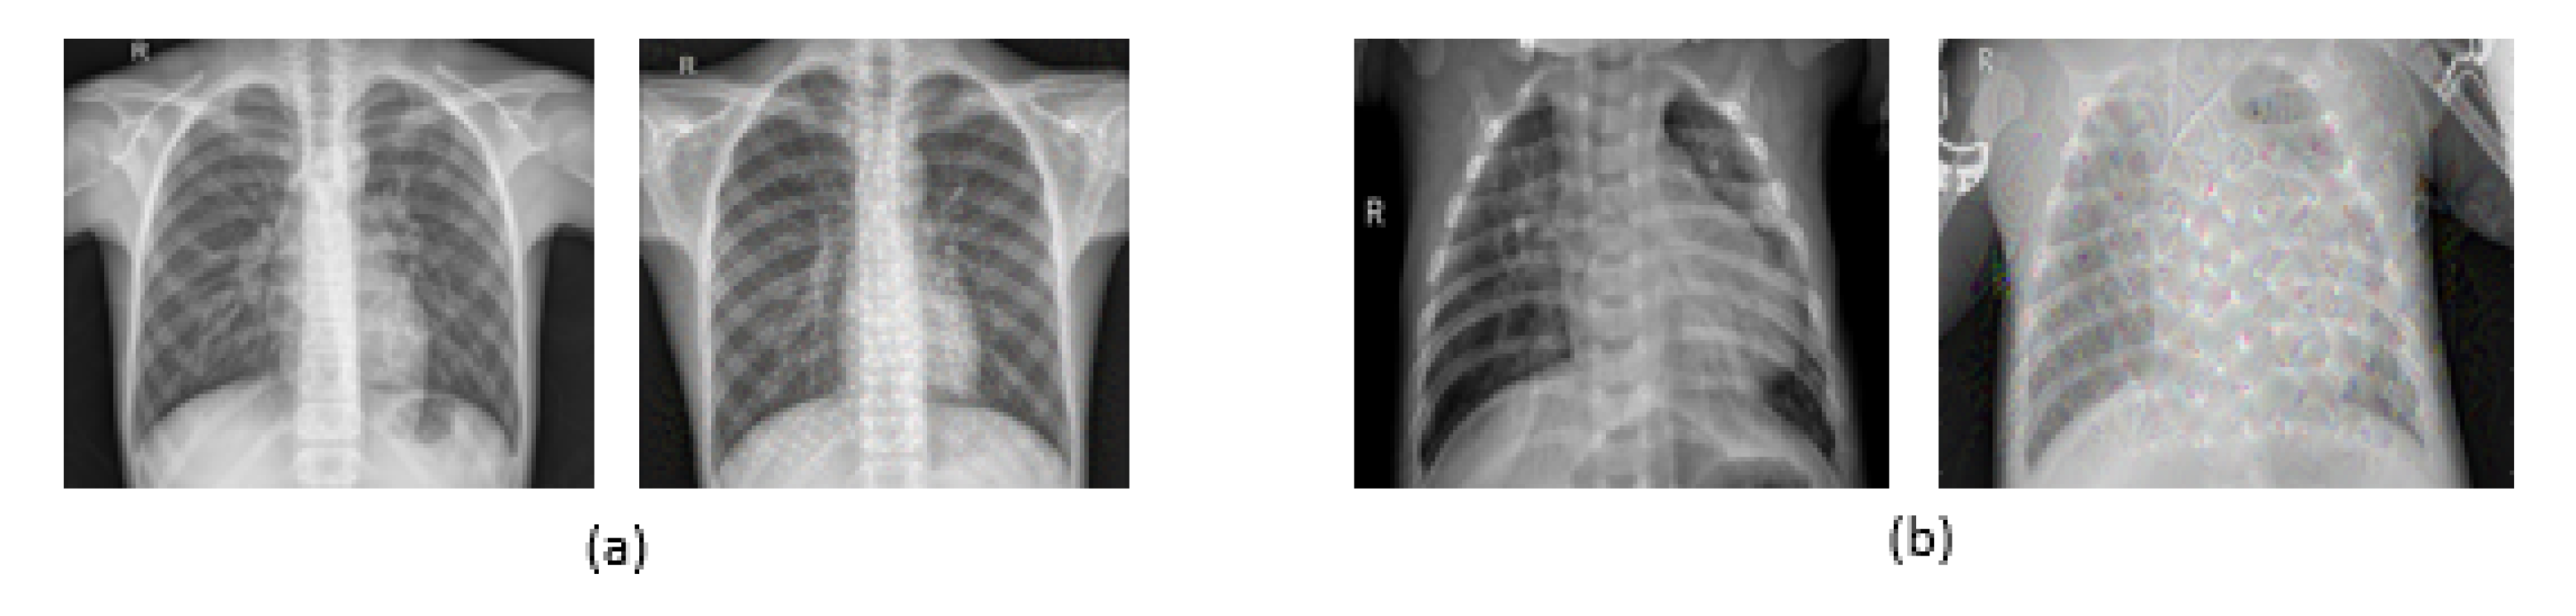
6.1. Dataset
6.2. The Used Deep-Pneumonia Platform
7. Experimental Results and Discussion
8. Conclusions and Future Work
Author Contributions
Funding
Conflicts of Interest
References
- Rahman, T.; Chowdhury, M.E.; Khandakar, A.; Islam, K.R.; Islam, K.F.; Mahbub, Z.B.; Kadir, M.A.; Kashem, S. Transfer Learning with Deep Convolutional Neural Network (CNN) for Pneumonia Detection using Chest X-ray. Appl. Sci. 2020, 10, 3233. [Google Scholar] [CrossRef]
- Ayan, E.; Ünver, H.M. Diagnosis of pneumonia from chest x-ray images using deep learning. In Proceedings of the Scientific Meeting on Electrical-Electronics Biomedical Engineering and Computer Science (EBBT), Istanbul, Turkey, 24–26 April 2019; Volume 7, pp. 1–5. [Google Scholar]
- Nguyen, K.P.; Son, T.H.; Le, T.H.; Tuan, L.; Nguyen, T.T. Applying multi-cnns model for detecting abnormal problem on chest x-ray images. In Proceedings of the 10th International Conference on Knowledge and Systems Engineering (KSE), Ho Chi Minh City, Vietnam, 1–3 November 2018; pp. 300–305. [Google Scholar]
- Labhane, G.; Pansare, R.; Maheshwari, S.; Tiwari, R.; Shukla, A. Detection of Pediatric Pneumonia from Chest X-Ray Images using CNN and Transfer Learning. In Proceedings of the 3rd International Conference on Emerging Technologies in Computer Engineering: Machine Learning and Internet of Things (ICETCE), Jaipur, India, 7–8 February 2020; pp. 85–92. [Google Scholar]
- Stephen, O.; Sain, M.; Maduh, U.J.; Jeong, D.U. An efficient deep learning approach to pneumonia classification in healthcare. J. Healthc. Eng. 2019, 2019, 4180949. [Google Scholar] [CrossRef] [PubMed]
- Tahir, A.M.; Chowdhury, M.E.; Khandakar, A.; Al-Hamouz, S.; Abdalla, M.; Awadallah, S.; Reaz, M.B.I.; Al-Emadi, N. A systematic approach to the design and characterization of a smart insole for detecting vertical ground reaction force (vGRF) in gait analysis. Sensors 2020, 20, 957. [Google Scholar] [CrossRef] [PubMed]
- Chowdhury, M.E.; Alzoubi, K.; Khandakar, A.; Khallifa, R.; Abouhasera, R.; Koubaa, S.; Ahmed, R.; Hasan, A. Wearable real-time heart attack detection and warning system to reduce road accidents. Sensors 2019, 19, 2780. [Google Scholar] [CrossRef]
- Chowdhury, M.E.; Khandakar, A.; Alzoubi, K.; Mansoor, S.; Tahir, A.M.; Reaz, M.B.I.; Al-Emadi, N. Real-Time Smart-Digital Stethoscope System for Heart Diseases Monitoring. Sensors 2019, 19, 2781. [Google Scholar] [CrossRef] [PubMed]
- Kallianos, K.; Mongan, J.; Antani, S.; Henry, T.; Taylor, A.; Abuya, J.; Kohli, M. How far have we come? Artificial intelligence for chest radiograph interpretation. Clin. Radiol. 2019, 74, 338–345. [Google Scholar] [CrossRef] [PubMed]
- Chouhan, V.; Singh, S.K.; Khamparia, A.; Gupta, D.; Tiwari, P.; Moreira, C.; Damasevicius, R.; de Albuquerque, V.H.C. A Novel Transfer Learning Based Approach for Pneumonia Detection in Chest X-ray Images. Appl. Sci. 2020, 10, 559. [Google Scholar] [CrossRef]
- Luján-García, J.E.; Yáñez-Márquez, C.; Villuendas-Rey, Y.; Camacho-Nieto, O. A Transfer Learning Method for Pneumonia Classification and Visualization. Appl. Sci. 2020, 10, 2908. [Google Scholar] [CrossRef]
- Antin, B.; Kravitz, J.; Martayan, E. Detecting Pneumonia in Chest X-rays with Supervised Learning; Semanticscholar Org.: Allen Institute for Artificial intelligence, Seattle, WA, USA, 2017. [Google Scholar]
- Rajpurkar, P.; Irvin, J.; Zhu, K.; Yang, B.; Mehta, H.; Duan, T.; Ding, D.; Bagul, A.; Langlotz, C.; Shpanskaya, K.; et al. Chexnet: Radiologist-level pneumonia detection on chest x-rays with deep learning. arXiv 2017, arXiv:1711.05225. [Google Scholar]
- Wang, X.; Peng, Y.; Lu, L.; Lu, Z.; Bagheri, M.; Summers, R.M. Chestx-ray8: Hospital-scale chest x-ray database and benchmarks on weakly-supervised classification and localization of common thorax diseases. In Proceedings of the IEEE Conference on Computer Vision and Pattern Recognition, Honolulu, HI, USA, 21–26 July 2017; pp. 2097–2106. [Google Scholar]
- Donthi, A.; Huang, A.; Tammanagari, A. Detecting Pneumonia with Convolutional Neural Networks; Semanticscholar Org.: Allen Institute for Artificial intelligence, Seattle, WA, USA, 2018. [Google Scholar]
- Al Mubarok, A.F.; Dominique, J.A.; Thias, A.H. Pneumonia detection with deep convolutional architecture. In Proceedings of the International Conference of Artificial Intelligence and Information Technology (ICAIIT), Ouargla, Algeria, 4–6 March 2019; pp. 486–489. [Google Scholar]
- Li, B.; Kang, G.; Cheng, K.; Zhang, N. Attention-guided convolutional neural network for detecting pneumonia on chest x-rays. In Proceedings of the 41st Annual International Conference of the IEEE Engineering in Medicine and Biology Society (EMBC), Berlin, Germany, 23–27 July 2019; pp. 4851–4854. [Google Scholar]
- Sirazitdinov, I.; Kholiavchenko, M.; Mustafaev, T.; Yixuan, Y.; Kuleev, R.; Ibragimov, B. Deep neural network ensemble for pneumonia localization from a large-scale chest x-ray database. Comput. Electr. Eng. 2019, 78, 388–399. [Google Scholar] [CrossRef]
- Sharma, H.; Jain, J.S.; Bansal, P.; Gupta, S. Feature Extraction and Classification of Chest X-Ray Images Using CNN to Detect Pneumonia. In Proceedings of the 10th International Conference on Cloud Computing, Data Science & Engineering (Confluence), Noida, India, 29–31 January 2020; pp. 227–231. [Google Scholar]
- LeCun, Y.; Bengio, Y.; Hinton, G. Deep learning. Nature 2015, 521, 436. [Google Scholar] [CrossRef] [PubMed]
- Salido, J.A.A.; Ruiz, C., Jr. Using Deep Learning to Detect Melanoma in Dermoscopy Images. Int. J. Mach. Learn. Comput. 2018, 8, 61–68. [Google Scholar] [CrossRef]
- Lakhani, P.; Sundaram, B. Deep learning at chest radiography: Automated classification of pulmonary tuberculosis by using convolutional neural networks. Radiology 2017, 284, 574–582. [Google Scholar] [CrossRef] [PubMed]
- Li, Q.; Nishikawa, R.M. Computer-Aided Detection and Diagnosis in Medical Imaging; Taylor & Francis: Abingdon, UK, 2015. [Google Scholar]
- Gao, X.W.; Hui, R.; Tian, Z. Classification of CT brain images based on deep learning networks. Comput. Methods Programs Biomed. 2017, 138, 49–56. [Google Scholar] [CrossRef]
- Pathak, A.R.; Pandey, M.; Rautaray, S. Application of deep learning for object detection. Procedia Comput. Sci. 2018, 132, 1706–1717. [Google Scholar] [CrossRef]
- Xue, Z.; You, D.; Candemir, S.; Jaeger, S.; Antani, S.; Long, L.R.; Thoma, G.R. Chest x-ray image view classification. In Proceedings of the IEEE 28th International Symposium on Computer-Based Medical Systems, Sao Carlos, Brazil, 22–25 June 2015; pp. 66–71. [Google Scholar]
- Ragab, D.A.; Sharkas, M.; Marshall, S.; Ren, J. Breast cancer detection using deep convolutional neural networks and support vector machines. PeerJ 2019, 7, e6201. [Google Scholar] [CrossRef] [PubMed]
- Pereira, S.; Pinto, A.; Alves, V.; Silva, C.A. Brain tumor segmentation using convolutional neural networks in MRI images. IEEE Trans. Med Imaging 2016, 35, 1240–1251. [Google Scholar] [CrossRef]
- Esteva, A.; Kuprel, B.; Novoa, R.A.; Ko, J.; Swetter, S.M.; Blau, H.M.; Thrun, S. Dermatologist-level classification of skin cancer with deep neural networks. Nature 2017, 542, 115–118. [Google Scholar] [CrossRef]
- Ayan, E.; Ünver, H.M. Data augmentation importance for classification of skin lesions via deep learning. In Proceedings of the 2018 Electric Electronics, Computer Science, Biomedical Engineering’s Meeting (EBBT), Istanbul, Turkey, 18–19 April 2018; pp. 1–4. [Google Scholar]
- Ker, J.; Wang, L.; Rao, J.; Lim, T. Deep learning applications in medical image analysis. IEEE Access 2017, 6, 9375–9389. [Google Scholar] [CrossRef]
- Litjens, G.; Kooi, T.; Bejnordi, B.E.; Setio, A.A.A.; Ciompi, F.; Ghafoorian, M.; van der Laak, J.A.W.M.; van Ginneken, B.; Sanchez, C.I. A survey on deep learning in medical image analysis. Med. Image Anal. 2017, 42, 60–88. [Google Scholar] [CrossRef]
- Sak, H.; Senior, A.W.; Beaufays, F. Long short-term memory recurrent neural network architectures for large scale acoustic modeling. In Proceedings of the Annual Conference of the International Speech Communication Association, INTERSPEECH, Singapore, 14–18 September 2014; pp. 338–342. [Google Scholar]
- Gulli, A.; Pal, S. Deep Learning with Keras; Packt Publishing Ltd.: Birmingham, UK, 2017. [Google Scholar]
- Tsironi, E.; Barros, P.; Weber, C.; Wermter, S. An analysis of convolutional long short-term memory recurrent neural networks for gesture recognition. Neurocomputing 2017, 268, 76–86. [Google Scholar] [CrossRef]
- Mooney, P. Chest X-ray Images (Pneumonia). Available online: https://www.kaggle.com/paultimothymooney/chest-xray-pneumonia (accessed on 16 June 2020).
- Bisong, E. Google Colaboratory in Building Machine Learning and Deep Learning Models on Google Cloud Platform; Springer: Berlin/Heidelberg, Germany, 2019; pp. 59–64. [Google Scholar]
- Deep-Pneumonia Framework Using Deep Learning Models Based on Chest X-ray Images. Available online: https://github.com/Dr-Dina-M-Ibrahim/Pneumonia-Detection-using-Deep-Learning (accessed on 22 August 2020).


| Research | Author | Technique | Accuracy | Recall | F1-Score | Precision | AUC |
|---|---|---|---|---|---|---|---|
| R1 | Antin B. et al. [12] | CNN+Adam (DenseNet121) | – | – | – | – | 60.9% |
| R2 | Rajpurkar P. et al. [13] | CNN (DensNet121) | – | – | 43.5% | – | – |
| R3 | Donthi A. et al. [15] | CNN | 78.9% | 90.7% | – | – | 71.7% |
| R4 | Almubarok A. et al. [16] | (deep ResNet), mask RCNN +Adam + FPN | 85.60% | 51.52% | – | – | – |
| R5 | Li B. et al. [17] | CNN (RetinaNet, Mask R-CNN) | 26.2% | 83.5% | – | 61.1% | – |
| R6 | Sirazitdinov I. et al. [18] | CNN (RetinaNet, Mask R-CNN) + FPN principle | – | 79.3% | 77.5% | 75.8% | – |
| R7 | Sharma H. et al. [19] | CNN (4 models) | 90.68% | – | – | – | – |
| R8 | Rahman T. et al. [1] | AlexNet, ResNet18, DenseNet201, SqueezeNet | 98% | 99% | 98.1% | 97% | 98% |
| Layer (Type) | Output Shape | Parameters |
|---|---|---|
| conv2d_37 (Conv2D) | (None, 224, 224, 16) | 448 |
| activation_37 (Activation) | (None, 224, 224, 16) | 0 |
| batch_normalization_19 (Batch) | (None, 224, 224, 16) | 64 |
| conv2d_38 (Conv2D) | (None, 224, 224, 32) | 4640 |
| activation_38 (Activation) | (None, 224, 224, 32) | 0 |
| max_pooling2d_19 (MaxPooling2d) | (None, 74, 74, 32) | 0 |
| dropout_37 (Dropout) | (None, 74, 74, 32) | 0 |
| conv2d_39(Conv2D) | (None, 72, 72, 64) | 18,496 |
| activation_39 (Activation) | (None, 72, 72, 64) | 0 |
| batch_normalization_20 (Batch) | (None, 72, 72, 64) | 256 |
| conv2d_40 (Conv2D) | (None, 71, 71, 128) | 32,896 |
| max_pooling2d_20 (MaxPooling2d) | (None, 24, 24, 128) | 0 |
| dropout_38 (Dropout) | (None, 24, 24, 128) | 0 |
| flatten_10 (Flatten) | (None, 73728) | 0 |
| dense_28 (Dense) | (None, 512) | 37,749,248 |
| dropout_39 (Dropout) | (None, 512) | 0 |
| dense_29 (Dense) | (None, 1000) | 513,000 |
| dropout_40 (Dropout) | (None, 1000) | 0 |
| dense_30 (Dense) | (None, 1) | 1001 |
| activation_40 (Activation) | (None, 1) | 0 |
| Layer (Type) | Output Shape | Parameters |
|---|---|---|
| batch_normalization_7 (Batch) | (None, 224, 224, 3) | 12 |
| time_distribution_6 (TimeDistribution) | (None, 224, 224, 64) | 17,408 |
| time_distribution_6 (TimeDistribution) | (None, 224, 224, 64) | 12,352 |
| activation_9 (Activation) | (None, 224, 224, 64) | 0 |
| batch_normalization_8 (Batch) | (None, 224, 224, 64) | 256 |
| max_pooling2d_7 (MaxPooling2d) | (None, 74, 74, 64) | 0 |
| conv2d_7 (Conv2D) | (None, 74, 74, 32) | 18,464 |
| activation_10 (Activation) | (None, 74, 74, 32) | 0 |
| max_pooling2d_8 (MaxPooling2d) | (None, 24, 24, 32) | 0 |
| dropout_9 (Dropout) | (None, 24, 24, 32) | 0 |
| conv2d_8(Conv2D) | (None, 22, 22, 64) | 18,496 |
| activation_11 (Activation) | (None, 22, 22, 64) | 0 |
| batch_normalization_9 (Batch) | (None, 22, 22, 64) | 256 |
| conv2d_9 (Conv2D) | (None, 21, 21, 128) | 32,896 |
| max_pooling2d_9 (MaxPooling2d) | (None, 7, 7, 128) | 0 |
| dropout_10 (Dropout) | (None, 7, 7, 128) | 0 |
| flatten_3 (Flatten) | (None, 6272) | 0 |
| dense_7 (Dense) | (None, 512) | 3,211,776 |
| dropout_11 (Dropout) | (None, 512) | 0 |
| dense_8 (Dense) | (None, 1000) | 513,000 |
| dropout_12 (Dropout) | (None, 1000) | 0 |
| dense_9 (Dense) | (None, 1) | 1001 |
| activation_12 (Activation) | (None, 1) | 0 |
| Layer (Type) | Output Shape | Parameters |
|---|---|---|
| resnet152v2 (Model) | (None, 4, 4, 2048) | 58,331,648 |
| reshape_2 (Reshape) | (None, 4, 4, 2048) | 0 |
| flatten_2 (Flatten) | (None, 100352) | 0 |
| dense_3 (Dense) | (None, 256) | 25,690,368 |
| dropout_2 (Dropout) | (None, 256) | 0 |
| dense_4 (Dense) | (None, 1) | 257 |
| Layer (Type) | Output Shape | Parameters |
|---|---|---|
| mobilenetv2_1.00_224 (Model) | (None, 7, 7, 1280) | 2,257,984 |
| reshape_2 (Reshape) | (None, 7, 7, 1280) | 0 |
| flatten_2 (Flatten) | (None, 62720) | 0 |
| dense_3 (Dense) | (None, 512) | 32,113,152 |
| dropout_2 (Dropout) | (None, 512) | 0 |
| dense_4 (Dense) | (None, 1) | 513 |
| Models | Optimizer | Learning Rate (LR) | Total Number of Parameters | |
|---|---|---|---|---|
| Pre-trained models | ResNet152V2 | SGD | 0.0001 | 84,022,273 |
| MobileNetV2 | SGD | 0.0001 | 34,371,649 | |
| Our proposed models | CNN | Adamax | 0.00003 | 38,320,049 |
| LSTM-CNN | Adamax | 0.00006 | 3,825,917 | |
| Models | Loss | Accuracy | Precision | AUC | F1-Score | Recall | |
|---|---|---|---|---|---|---|---|
| Pre-trained models | ResNet152V2 | 0.0523 | 99.22% | 99.44% | 99.77% | 99.44% | 99.43% |
| MobileNetV2 | 0.1665 | 96.48% | 95.68% | 97.50% | 97.52% | 99.44% | |
| Our proposed models | CNN | 0.3020 | 92.19% | 95.57% | 96.92% | 93.79% | 92.07% |
| LSTM-CNN | 0.5771 | 91.80% | 93.24% | 95.49% | 92.29% | 92.62% | |
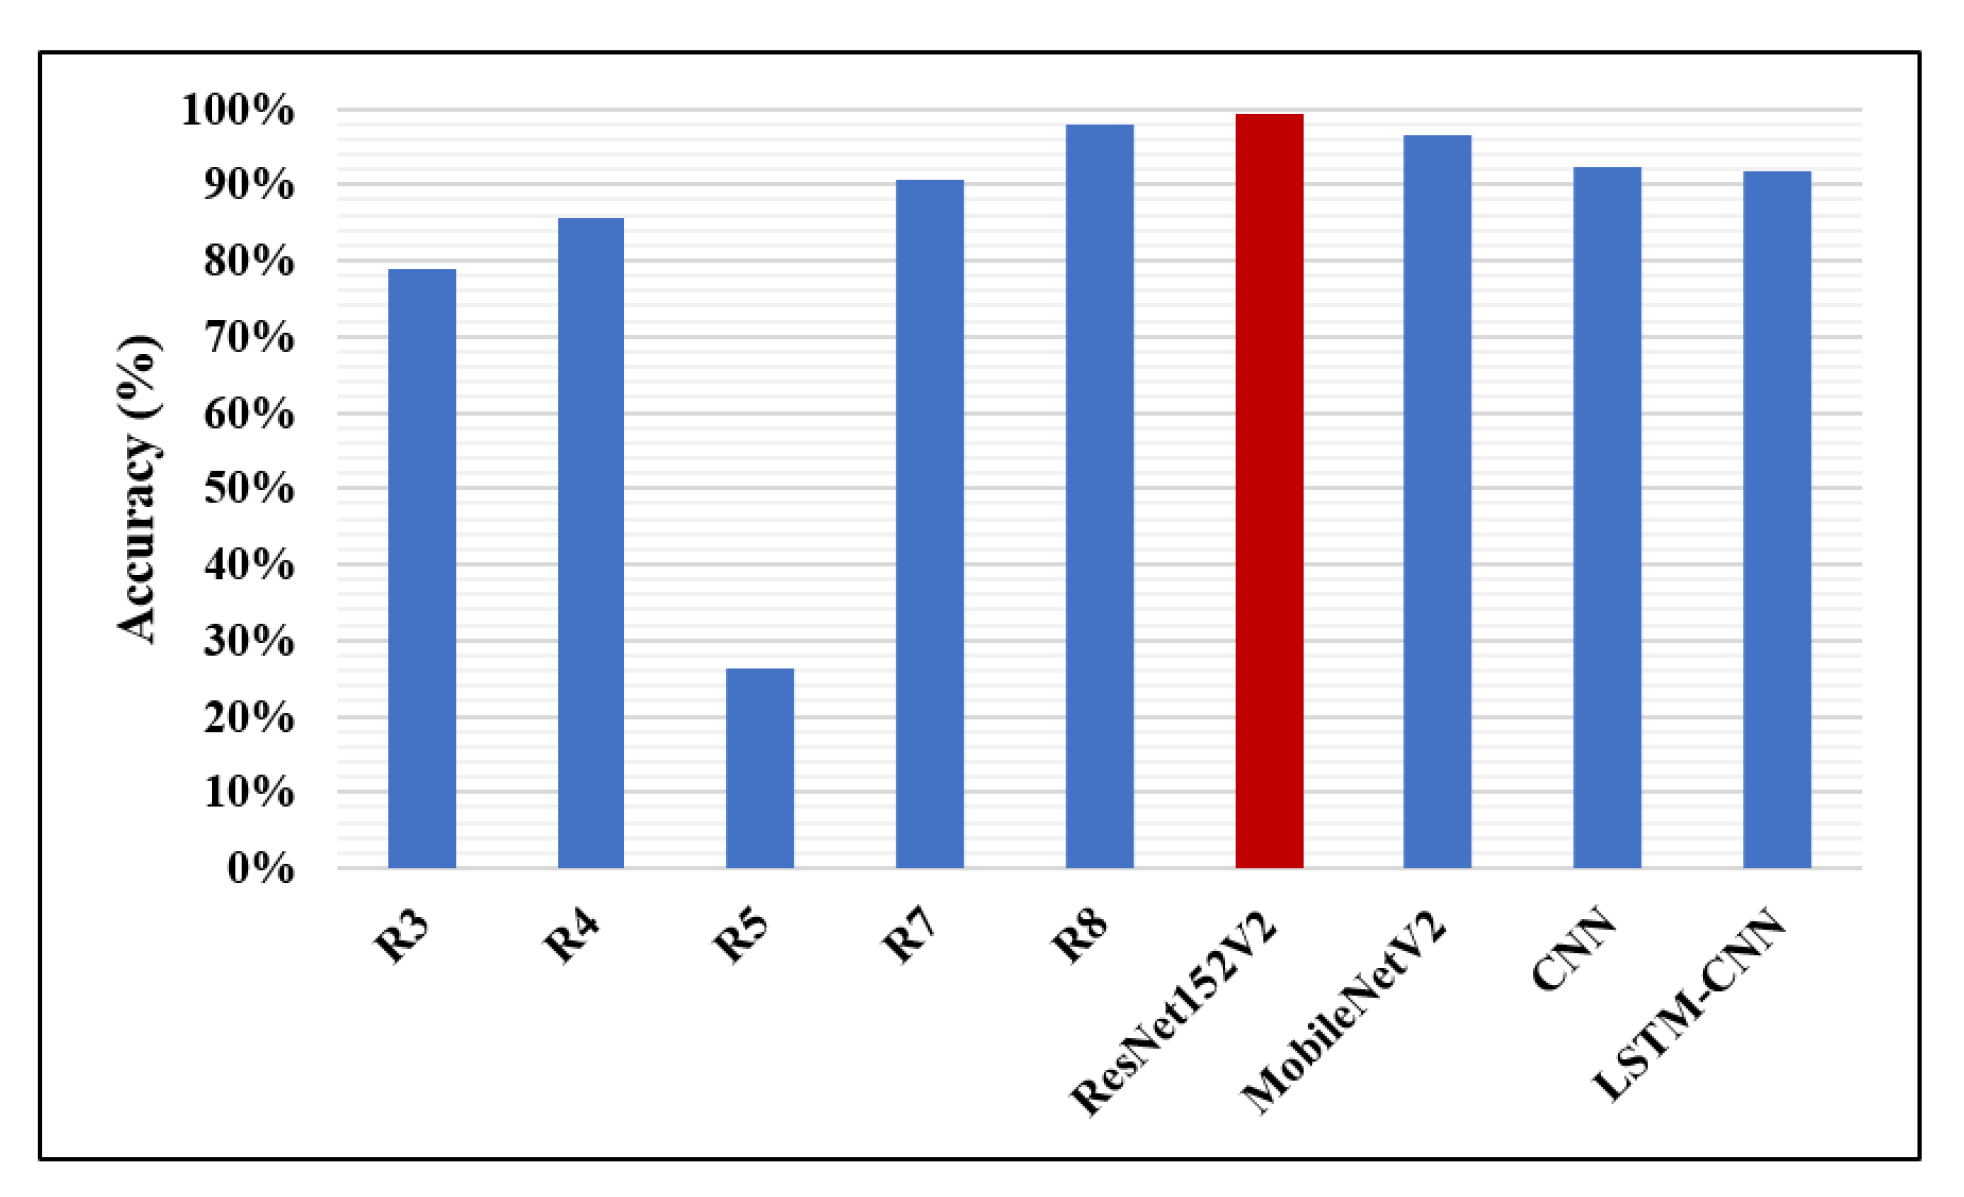
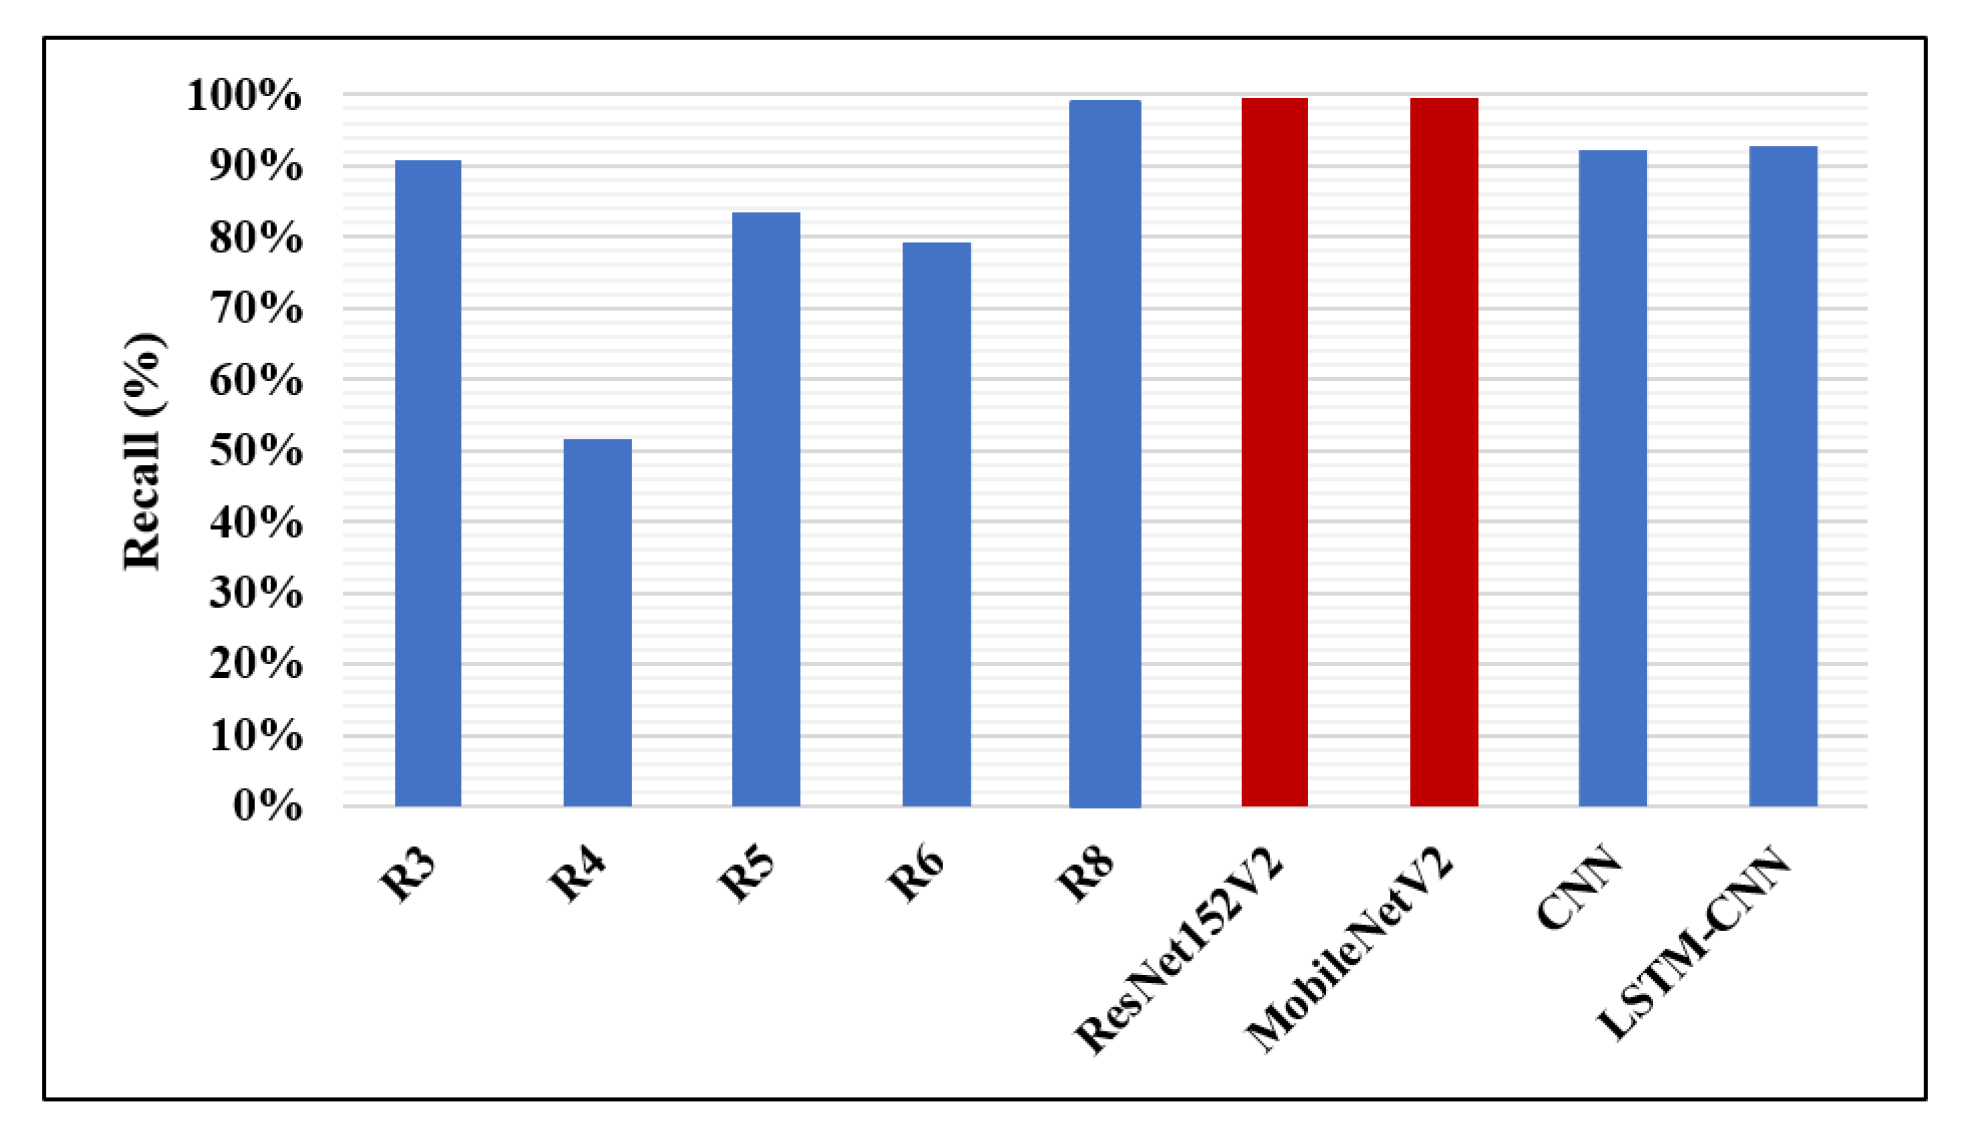
| Research | Author | Accuracy | Recall | F1-Score | Precision | AUC |
|---|---|---|---|---|---|---|
| R1 | Antin B. et al. [12] | – | – | – | – | 60.9% |
| R2 | Rajpurkar P. et al. [13] | – | – | 43.5% | – | – |
| R3 | Donthi A. et al. [15] | 78.9% | 90.7% | – | – | 71.1% |
| R4 | Almubarok A. et al. [16] | 85.60% | 51.52% | – | – | – |
| R5 | Li B. et al. [17] | 26.2% | 83.5% | – | 61.1% | – |
| R6 | Sirazitdinoy I. et al. [18] | – | 79.3% | 77.5% | 75.8% | – |
| R7 | Sharma H. et al. [19] | 90.68% | – | – | – | – |
| R8 | Rahman T. et al. [1] | 98% | 99% | 98.1% | 97% | 98% |
| The proposed four models | ResNet152V2 | 99.22% | 99.43% | 99.44% | 99.44% | 99.77% |
| MobileNetV2 | 96.48% | 99.44% | 97.52% | 95.68% | 97.50% | |
| CNN | 92.19% | 92.07% | 93.79% | 95.57% | 96.92% | |
| LSTM-CNN | 91.80% | 92.62% | 92.29% | 93.24% | 95.49% |
© 2020 by the authors. Licensee MDPI, Basel, Switzerland. This article is an open access article distributed under the terms and conditions of the Creative Commons Attribution (CC BY) license (http://creativecommons.org/licenses/by/4.0/).
Share and Cite
Elshennawy, N.M.; Ibrahim, D.M. Deep-Pneumonia Framework Using Deep Learning Models Based on Chest X-Ray Images. Diagnostics 2020, 10, 649. https://doi.org/10.3390/diagnostics10090649
Elshennawy NM, Ibrahim DM. Deep-Pneumonia Framework Using Deep Learning Models Based on Chest X-Ray Images. Diagnostics. 2020; 10(9):649. https://doi.org/10.3390/diagnostics10090649
Chicago/Turabian StyleElshennawy, Nada M., and Dina M. Ibrahim. 2020. "Deep-Pneumonia Framework Using Deep Learning Models Based on Chest X-Ray Images" Diagnostics 10, no. 9: 649. https://doi.org/10.3390/diagnostics10090649
APA StyleElshennawy, N. M., & Ibrahim, D. M. (2020). Deep-Pneumonia Framework Using Deep Learning Models Based on Chest X-Ray Images. Diagnostics, 10(9), 649. https://doi.org/10.3390/diagnostics10090649