Performance of Radiomics Features in the Quantification of Idiopathic Pulmonary Fibrosis from HRCT

 ,
,  ,
,  ,
,  , ,
, ,  ,
,  ,
,
Abstract
1. Introduction
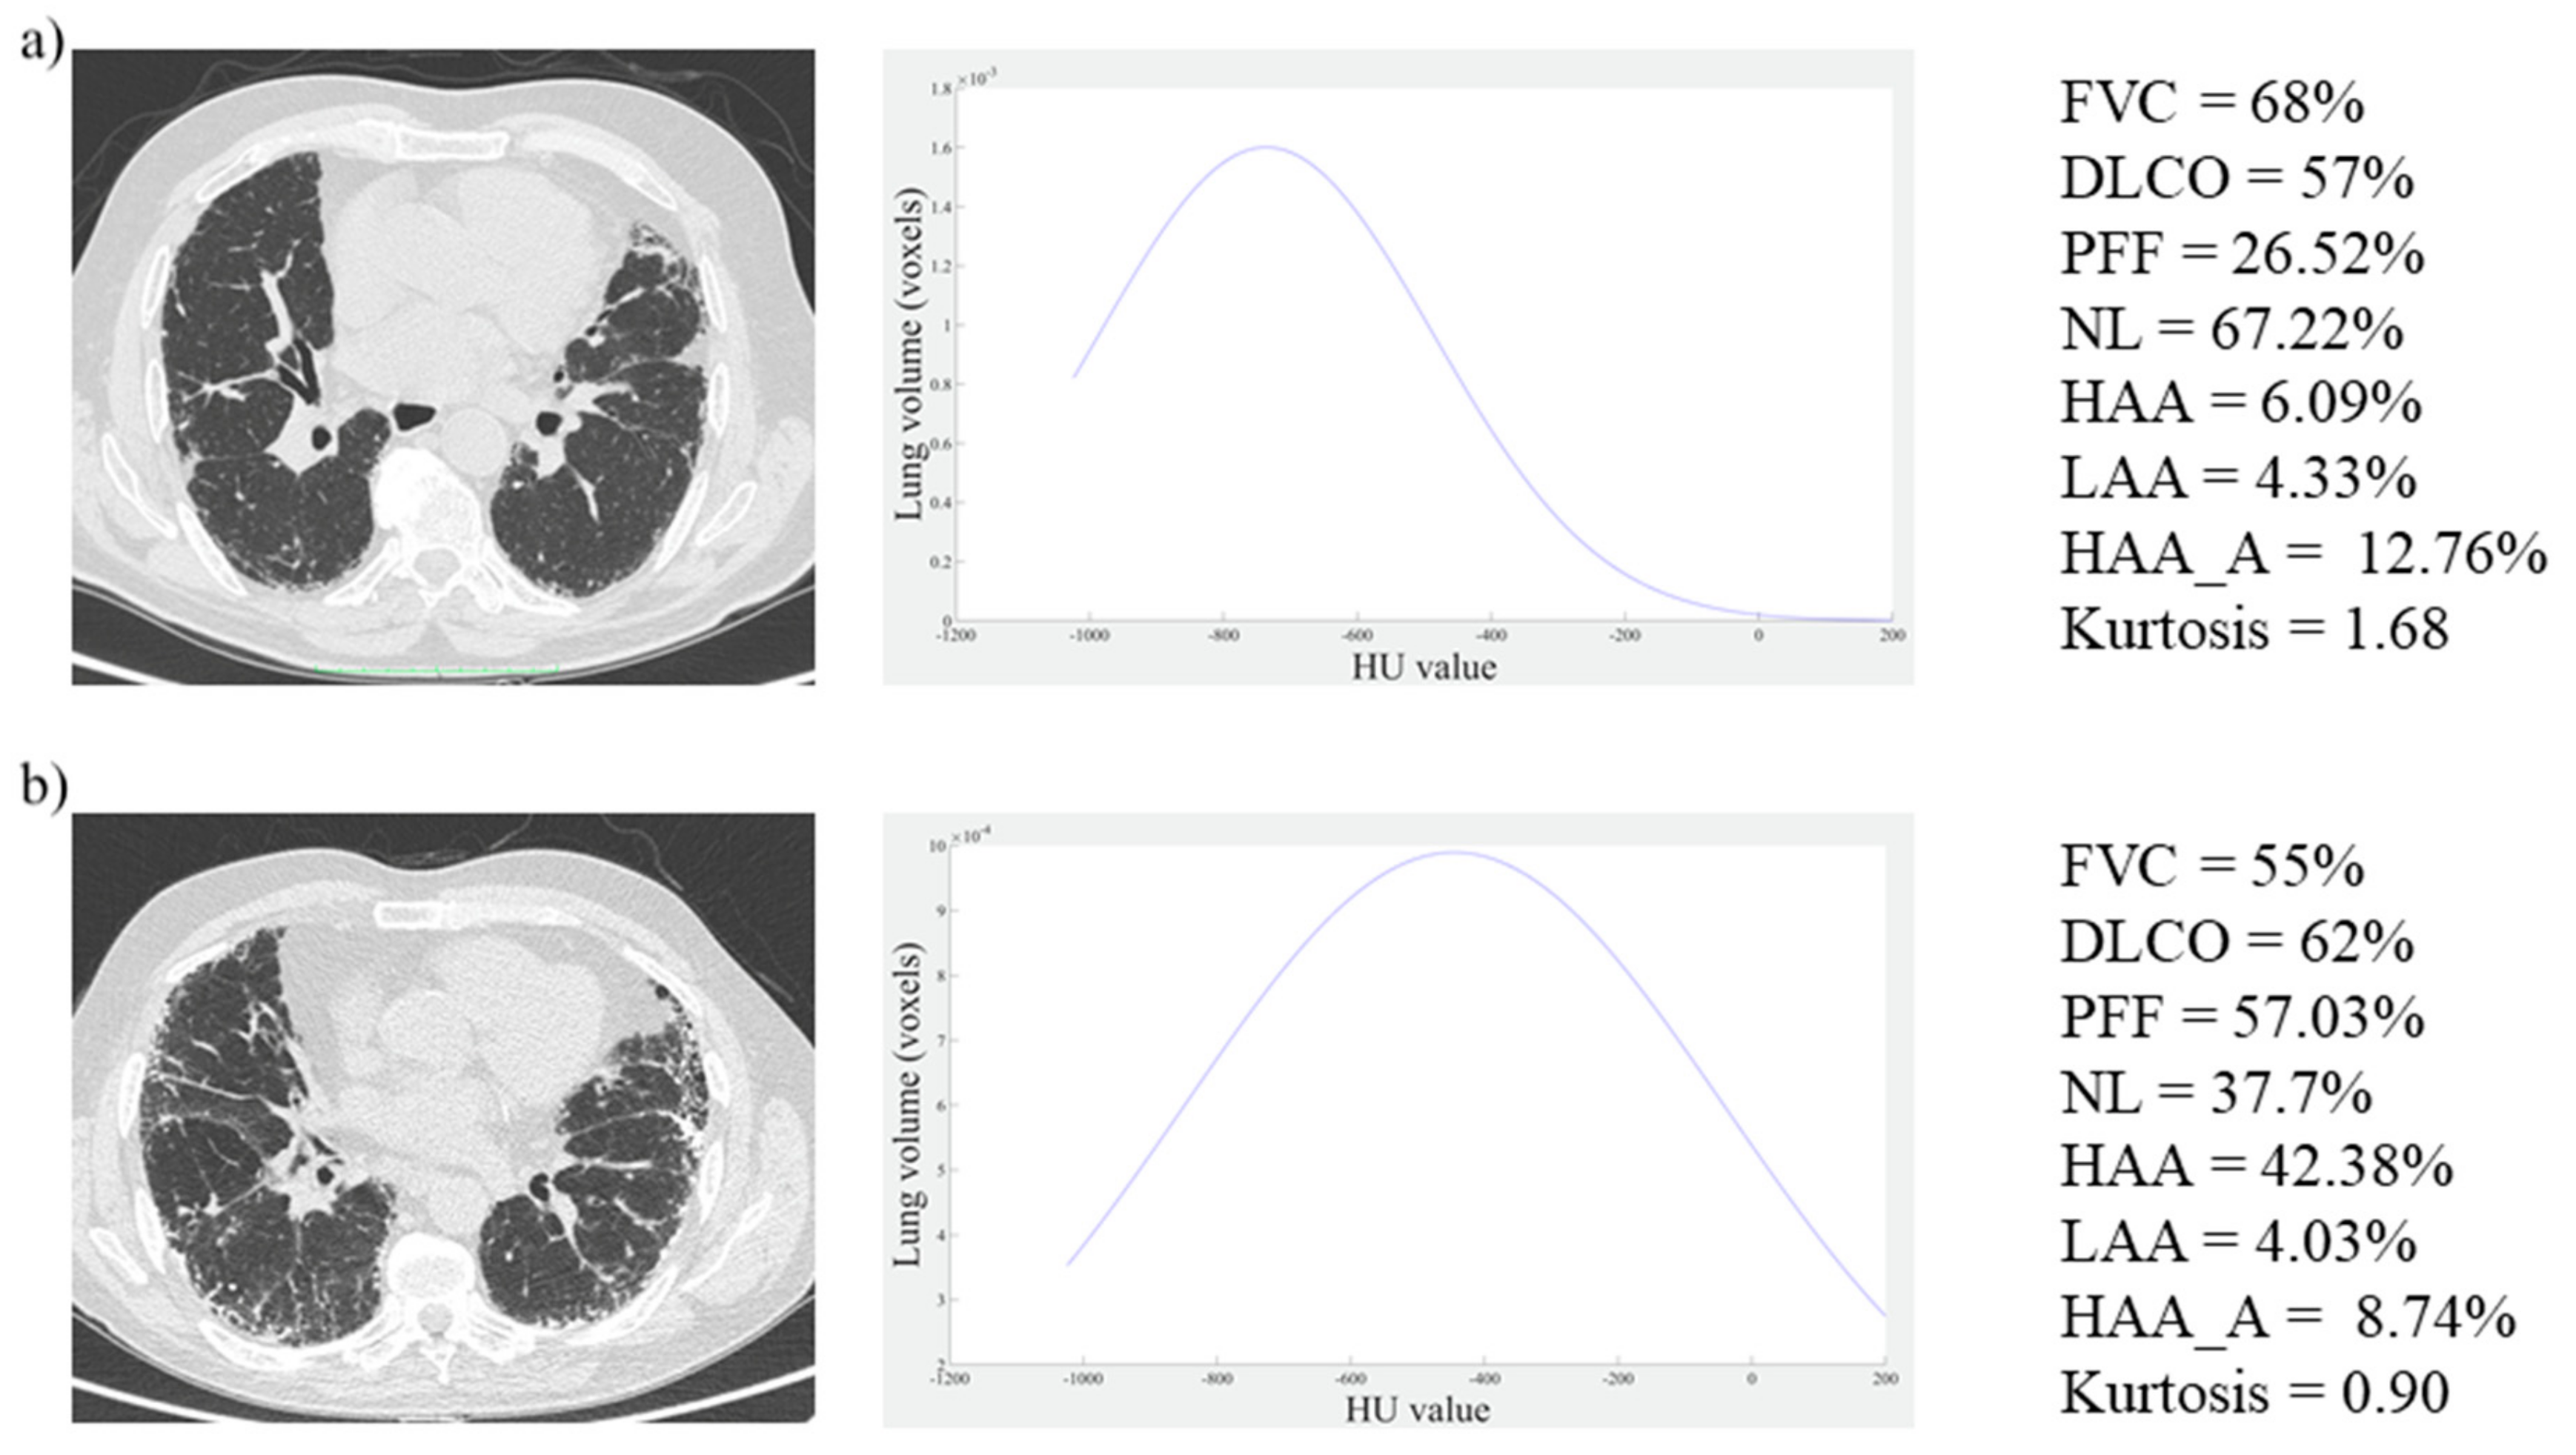
- Salaffi et al. [7] proposed the PFF% parameter, defined as the percentage of the non-fibrotic area (from −1.024 HU to −700 HU) in the HRCT lung volume (from −1.024 HU to −200 HU). This motivates our −200 HU choice.
- Ohkubo et al. [8] proposed the NL% parameter, defined as the percentage of the normally attenuated lung (from −950 HU and −701 HU) in the HRCT lung volume (from −1.024 HU to 0 HU. This motivates our 0 HU choice.
- In Tanizawa et al. [9], HAAs and LAAs were defined as areas with attenuation values greater than −200 HU and less than −960 HU, respectively. HAA is indicative of parenchymal lesions, such as ground-glass opacity and reticulation, whereas LAA is indicative of emphysematous patches. Additionally, HAA% and LAA% were defined as percentages of the HRCT lung volume) occupied by HAA and LAA, respectively. Unfortunately, HU thresholds were not explicitly declared in this study.
- Ash et al. [10] introduced the HAA_A% parameter as an alternative to HAA. HAA_A% corresponds to the percentage of the HRCT lung volume that has a density from −250 to −600 HU. The HRCT lung volume was considered, in this case, from −1.024 HU to −200 HU.
- Finally, Klim et al. [11] obtained kurtosis, skewness, MLD, median, and variance values by choosing +200 HU as the upper threshold in the HRCT lung volume calculation. Of course, this motivated our last threshold choice.
2. Materials and Methods
2.1. Patients
2.2. High Resolution Computed Tomography (HRCT) Protocol
2.3. Quantitative HRCT Assessment
2.4. Statistical Analysis
3. Results
3.1. Subsection
3.2. Exploratory Analysis
3.3. Models Analysis
4. Discussion
5. Conclusions
Author Contributions
Funding
Conflicts of Interest
References
- American Thoracic Society. Idiopathic pulmonary fibrosis: Diagnosis and treatment. International consensus statement. American Thoracic Society (ATS) and the European Respiratory Society (ERS). Am. J. Respir. Crit. Care Med. 2000, 161, 646–664. [Google Scholar] [CrossRef]
- Tzouvelekis, A.; Spagnolo, P.; Bonella, F.; Vancheri, C.; Tzilas, V.; Crestani, B.; Kreuter, M.; Bouros, D. Patients with IPF and lung cancer: Diagnosis and management. Lancet Respir. Med. 2018, 6, 86–88. [Google Scholar] [CrossRef]
- Puglisi, S.; Torrisi, S.E.; Giuliano, R.; Vindigni, V.; Vancheri, C. What We Know about the Pathogenesis of Idiopathic Pulmonary Fibrosis. Semin. Respir. Crit. Care Med. 2016, 37, 358–367. [Google Scholar] [CrossRef] [PubMed]
- Raghu, G.; Collard, H.R.; Egan, J.J.; Martinez, F.J.; Behr, J.; Brown, K.K.; Colby, T.V.; Cordier, J.F.; Flaherty, K.R.; Lasky, J.A.; et al. An Official ATS/ERS/JRS/ALAT Statement: Idiopathic pulmonary fibrosis: Evidence-based guidelines for diagnosis and management. Am. J. Respir. Crit. Care Med. 2011, 183, 788–824. [Google Scholar] [CrossRef] [PubMed]
- Sverzellati, N. Highlights of HRCT imaging in IPF. Respir. Res. 2013, 14, S3. [Google Scholar] [CrossRef]
- Palmucci, S.; Torrisi, S.E.; Falsaperla, D.; Stefano, A.; Torcitto, A.G.; Russo, G.; Pavone, M.; Vancheri, A.; Mauro, L.A.; Grassedonio, E.; et al. Assessment of Lung Cancer Development in Idiopathic Pulmonary Fibrosis Patients Using Quantitative High-Resolution Computed Tomography: A Retrospective Analysis. J. Thorac. Imaging 2019, 35, 115–122. [Google Scholar] [CrossRef]
- Salaffi, F.; Carotti, M.; Di Donato, E.; Di Carlo, M.; Ceccarelli, L.; Giuseppetti, G. Computer-aided tomographic analysis of interstitial lung disease (ILD) in patients with systemic sclerosis (SSc). Correlation with pulmonary physiologic tests and patient-centred measures of perceived dyspnea and functional disability. PLoS ONE 2016, 11, e0149240. [Google Scholar] [CrossRef]
- Ohkubo, H.; Kanemitsu, Y.; Uemura, T.; Takakuwa, O.; Takemura, M.; Maeno, K.; Ito, Y.; Oguri, T.; Kazawa, N.; Mikami, R.; et al. Normal lung quantification in usual interstitial pneumonia pattern: The impact of threshold-based volumetric CT analysis for the staging of idiopathic pulmonary fibrosis. PLoS ONE 2016, 11, e0152505. [Google Scholar] [CrossRef]
- Tanizawa, K.; Handa, T.; Nagai, S.; Hirai, T.; Kubo, T.; Oguma, T.; Ito, I.; Ito, Y.; Wayanabe, K.; Aihara, K.; et al. Clinical impact of high-attenuation and cystic areas on computed tomography in fibrotic idiopathic interstitial pneumonias. BMC Pulm. Med. 2015, 15. [Google Scholar] [CrossRef]
- Ash, S.Y.; Harmouche, R.; Vallejo, D.L.L.; Villalba, J.A.; Ostridge, K.; Gunville, R.; Come, C.E.; Onieva, J.; Ross, J.C.; Hunninghake, G.M.; et al. Densitometric and local histogram based analysis of computed tomography images in patients with idiopathic pulmonary fibrosis. Respir. Res. 2017, 18, 45. [Google Scholar] [CrossRef]
- Kim, H.J.; Brown, M.S.; Chong, D.; Gjertson, D.W.; Lu, P.; Kim, H.J.; Coy, H.; Goldin, J.G. Comparison of the Quantitative CT Imaging Biomarkers of Idiopathic Pulmonary Fibrosis at Baseline and Early Change with an Interval of 7 Months. Acad. Radiol. 2015, 22, 70–80. [Google Scholar] [CrossRef] [PubMed]
- Comelli, A.; Stefano, A.; Bignardi, S.; Russo, G.; Sabini, M.G.; Ippolito, M.; Barone, S.; Yezzi, A. Active contour algorithm with discriminant analysis for delineating tumors in positron emission tomography. Artif. Intell. Med. 2019, 94, 67–78. [Google Scholar] [CrossRef] [PubMed]
- Wang, J.; Li, F.; Li, Q. Automated segmentation of lungs with severe interstitial lung disease in CT. Med. Phys. 2009, 36, 4592–4599. [Google Scholar] [CrossRef] [PubMed]
- Ballangan, C.; Wang, X.; Fulham, M.; Eberl, S.; Feng, D.D. Lung tumor segmentation in PET images using graph cuts. Comput. Methods Programs Biomed. 2013, 109, 260–268. [Google Scholar] [CrossRef]
- Wanet, M.; Lee, J.A.; Weynand, B.; de Bast, M.; Poncelet, A.; Lacroix, V.; Coche, E.; Gregoire, V.; Geets, X. Gradient-based delineation of the primary GTV on FDG-PET in non-small cell lung cancer: A comparison with threshold-based approaches, CT and surgical specimens. Radiother. Oncol. 2011, 98, 117–125. [Google Scholar] [CrossRef]
- Chen, H.; Butler, A. Automatic Lung Segmentation in HRCT Images. In Proceedings of the 2011 26th International Conference on Image and Vision Computing, Wellington, New Zealand, 29 November–1 December 2011; pp. 293–298. [Google Scholar]
- Massoptier, L.; Misra, A.; Sowmya, A. Automatic lung segmentation in HRCT images with diffuse parenchymal lung disease using graph-cut. In Proceedings of the 2009 24th International Conference Image and Vision Computing New Zealand, Wellington, New Zealand, 23–25 November 2009; pp. 266–270. [Google Scholar]
- Cuocolo, R.; Stanzione, A.; Ponsiglione, A.; Romeo, V.; Verde, F.; Creta, M.; La Rocca, R.; Longo, N.; Pace, L.; Imbriaco, M. Clinically significant prostate cancer detection on MRI: A radiomic shape features study. Eur. J. Radiol. 2019, 116, 144–149. [Google Scholar] [CrossRef]
- Castiglioni, I.; Gilardi, M.C. Radiomics: Is it time to compose the puzzle? Clin. Transl. Imaging 2018, 6, 411–413. [Google Scholar] [CrossRef]
- Stefano, A.; Comelli, A.; Bravata, V.; Barone, S.; Daskalovski, I.; Savoca, G.; Sabini, M.G.; Ippolito, M.; Russo, G. A preliminary PET radiomics study of brain metastases using a fully automatic segmentation method. BMC Suppl. 2020, in press. [Google Scholar]
- Giambelluca, D.; Cannella, R.; Vernuccio, F.; Comelli, A.; Pavone, A.; Salvaggio, L.; Galia, M.; Midiri, M.; Lagalla, R.; Salvaggio, G. PI-RADS 3 Lesions: Role of Prostate MRI Texture Analysis in the Identification of Prostate Cancer. Curr. Probl. Diagn. Radiol. 2019. [Google Scholar] [CrossRef]
- Gillies, R.J.; Kinahan, P.E.; Hricak, H. Radiomics: Images Are More than Pictures, They Are Data. Radiology 2016, 278, 563–577. [Google Scholar] [CrossRef]
- Lee, G.; Lee, H.Y.; Park, H.; Schiebler, M.L.; van Beek, E.J.R.; Ohno, Y.; Seo, J.B.; Leung, A. Radiomics and its emerging role in lung cancer research, imaging biomarkers and clinical management: State of the art. Eur. J. Radiol. 2017, 86, 297–307. [Google Scholar] [CrossRef] [PubMed]
- Comelli, A.; Stefano, A.; Russo, G.; Bignardi, S.; Sabini, M.G.; Petrucci, G.; Ippolito, M.; Yezzi, A. K-nearest neighbor driving active contours to delineate biological tumor volumes. Eng. Appl. Artif. Intell. 2019, 81, 133–144. [Google Scholar] [CrossRef]
- Comelli, A.; Stefano, A.; Russo, G.; Sabini, M.G.; Ippolito, M.; Bignardi, S.; Petrucci, G.; Yezzi, A. A smart and operator independent system to delineate tumours in Positron Emission Tomography scans. Comput. Biol. Med. 2018, 102, 1–15. [Google Scholar] [CrossRef]
- Torrisi, S.E.; Palmucci, S.; Stefano, A.; Russo, G.; Torcitto, A.G.; Falsaperla, D.; Gioe, M.; Pavone, M.; Vancheri, A.; Sambataro, D.; et al. Assessment of survival in patients with idiopathic pulmonary fibrosis using quantitative HRCT indexes. Multidiscip. Respir. Med. 2018, 13, 13–43. [Google Scholar] [CrossRef]
- Mesanovic, N.; Grgic, M.; Huseinagic, H.; Males, M.; Skejić, E.; Muamer, S. Automatic CT Image Segmentation of the Lungs with Region Growing Algorithm. Signals Image 2017, 395–400. Available online: http://www.vcl.fer.hr/papers_pdf/Automatic%20CT%20Image%20Segmentation%20of%20the%20Lungs%20with%20Region%20Growing%20Algorithm.pdf (accessed on 14 May 2020).
- Ley, B.; Ryerson, C.J.; Vittinghoff, E.; Ryu, J.H.; Tomassetti, S.; Lee, J.S.; Poletti, V.; Buccioli, M.; Elicker, B.M.; Jones, K.D.; et al. A multidimensional index and staging system for idiopathic pulmonary fibrosis. Ann. Intern. Med. 2012, 156, 684–691. [Google Scholar] [CrossRef] [PubMed]


| HRCT Parameter | Acronyms | Reference |
|---|---|---|
| Pulmonary fibrosis fraction | PFF% | [7] |
| Normally Attenuated Lung | NL% | [8] |
| High Attenuation Area | HAA% | [9] |
| Low Attenuation Area | LAA% | [9] |
| High Attenuation Area | HAA_A% | [10] |
| Kurtosis | - | [11] |
| Skewness | - | [11] |
| Mean Lung Density | MLD | [11] |
| Median | - | [11] |
| Variance | - | [11] |
| −200 HU | 0 HU | 200 HU | ||||
|---|---|---|---|---|---|---|
| Parameters | Mean ± SD | Median | Mean ± SD | Median | Mean ± SD | Median |
| NL% | 65.12 ± 7.41 | 65.24 | 61.51 ± 6.68 | 62.96 | 58.99 ± 10.64 | 61.29 |
| PFF% | 23.98 ± 8.25 | 22.71 | 26.84 ± 9.32 | 24.80 | 31.05 ± 11.94 | 26.40 |
| HAA% | n.a. | n.a. | 14.84 ± 24.97 | 3.95 | 9.42 ± 10.99 | 4.88 |
| LAA% | 8.51 ± 6.42 | 5.95 | 9.15 ± 5.50 | 6.95 | 7.19 ± 4.59 | 5.57 |
| HAA_A% | 14.09 ± 4.87 | 13.61 | 14.16 ± 4.74 | 13.81 | 12.70 ± 4.40 | 12.23 |
| Kurtosis | 1.49 ± 1.08 | 1.39 | 1.65 ± 3.02 | 1.69 | 1.91 ± 3.33 | 1.95 |
| HU: −200 | |||||
|---|---|---|---|---|---|
| NL | PFF | HAA_A | Kurtosis | LAA | |
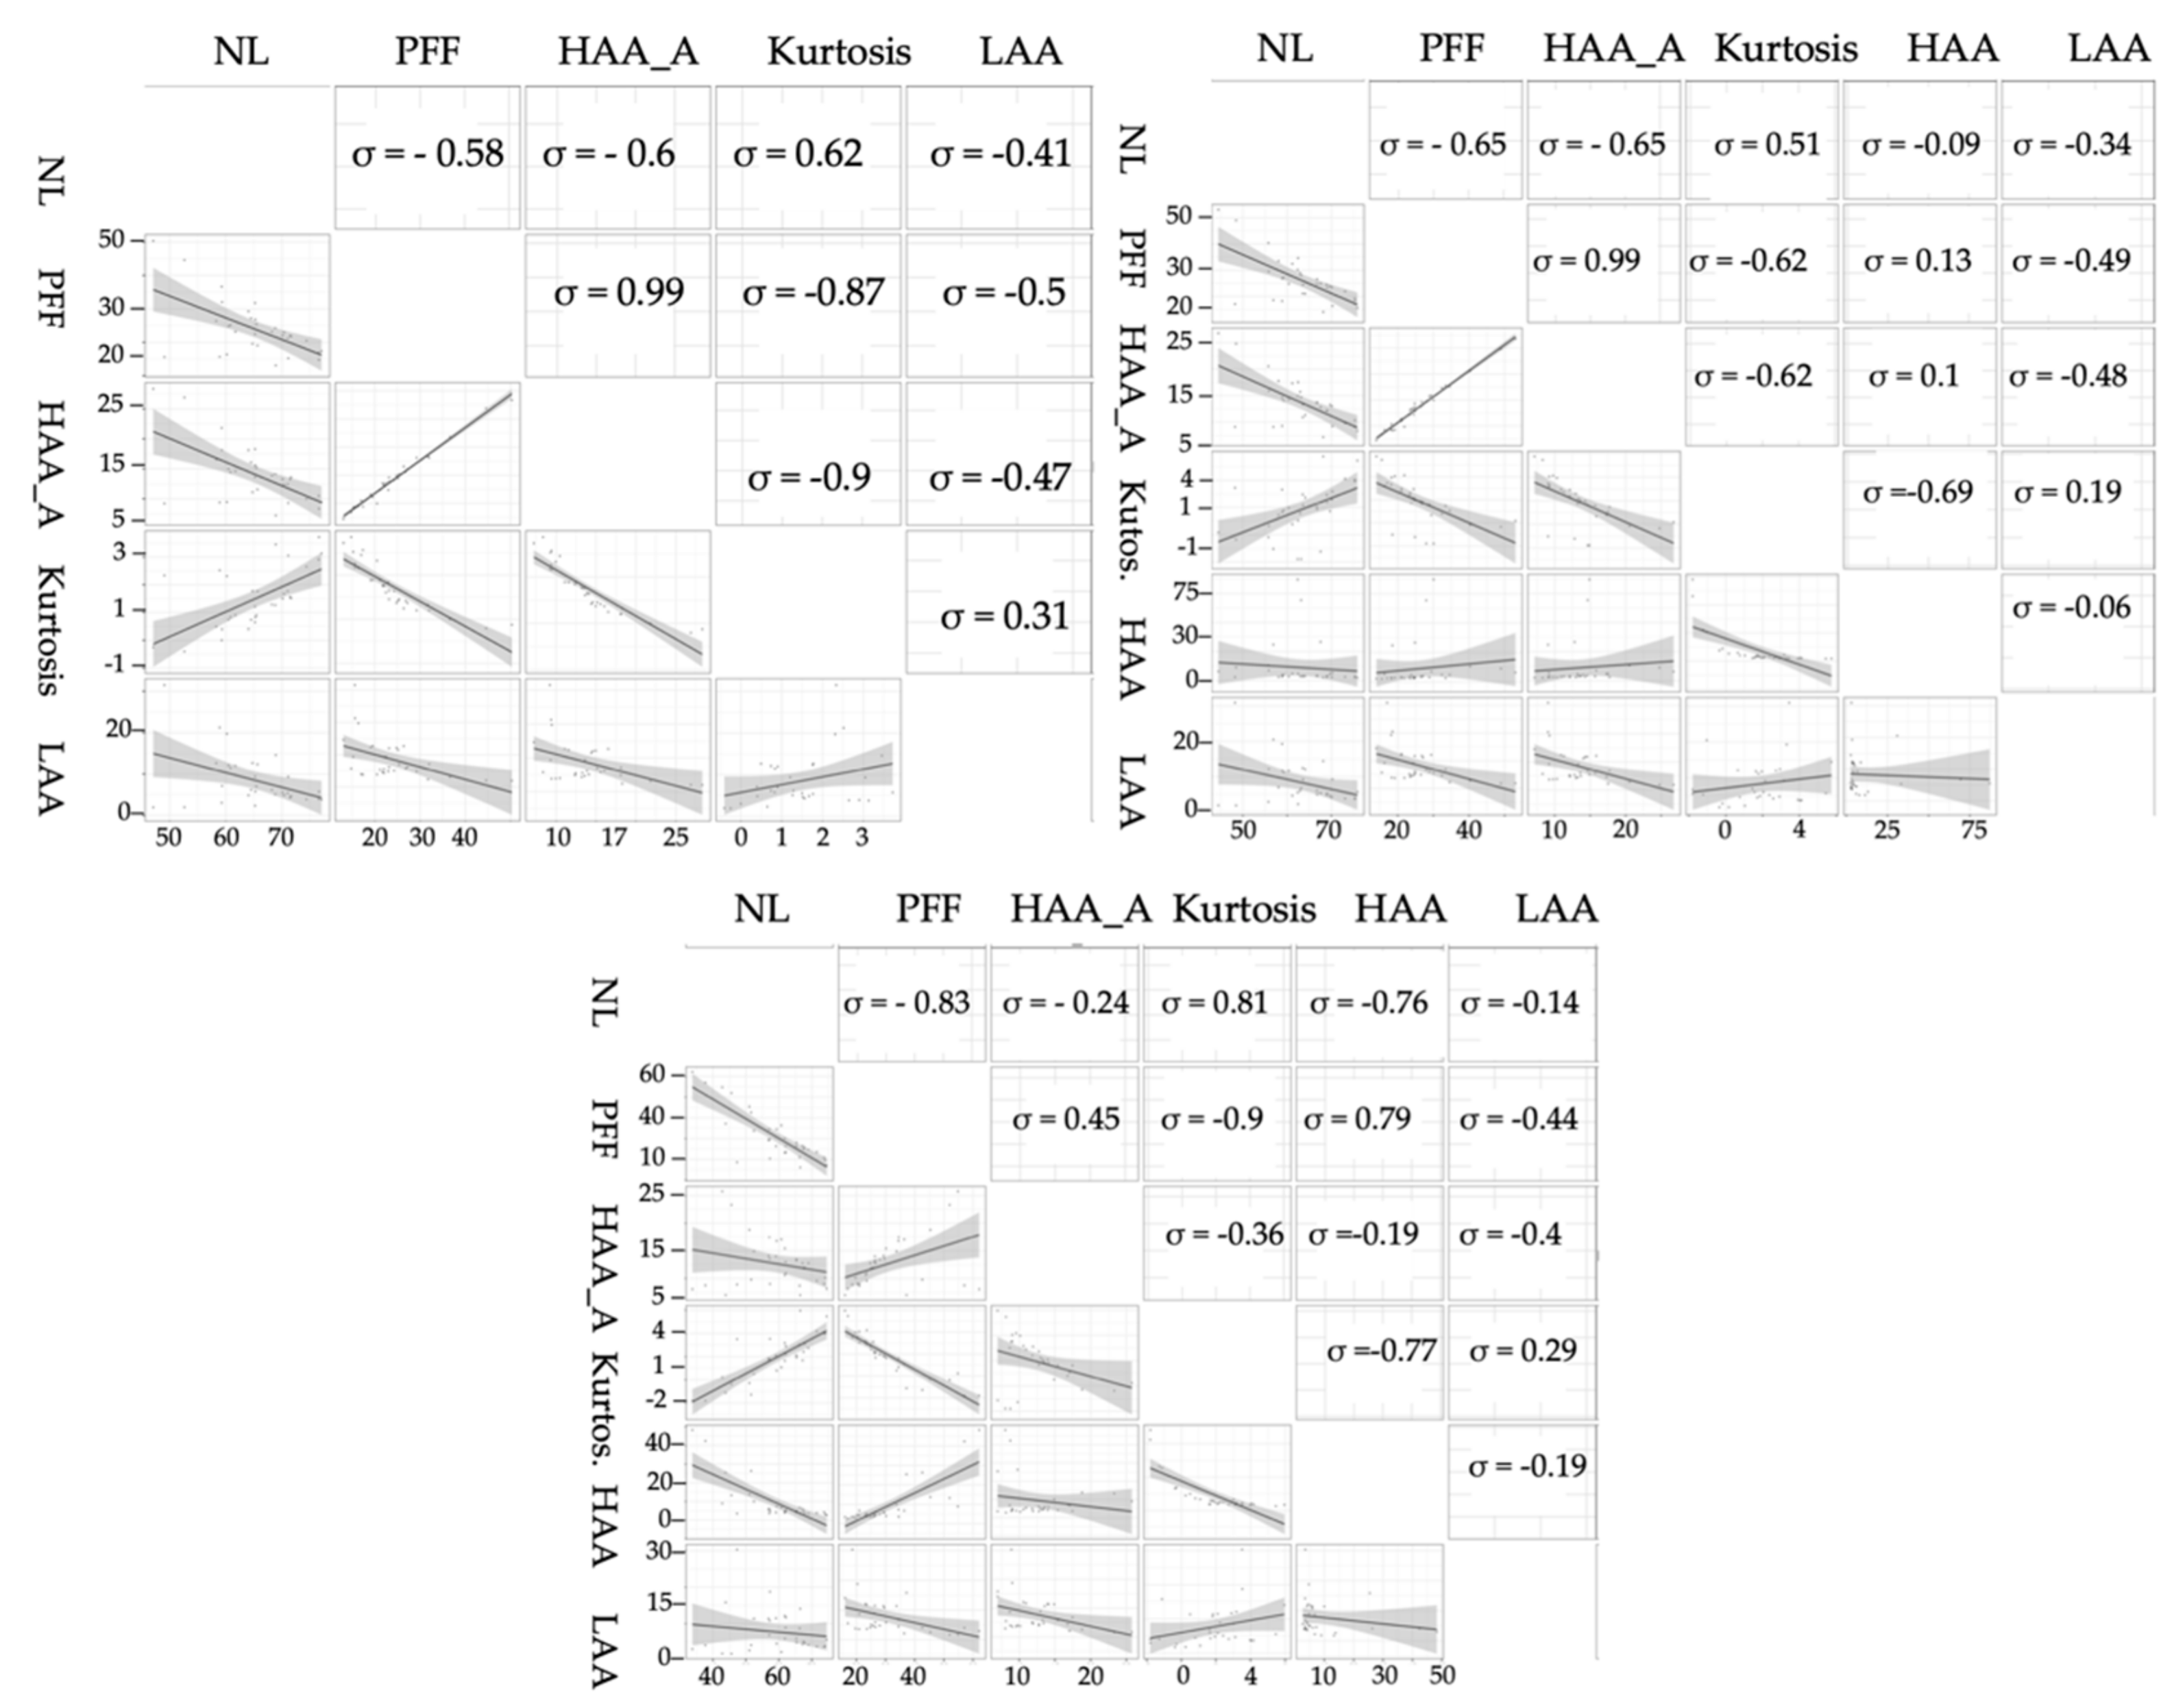
| NL | 1.00 | −0.58 | −0.60 | 0.62 | −0.41 |
| PFF | −0.58 | 1.00 | 0.99 | −0.87 | −0.50 |
| HAA_A | −0.60 | 0.99 | 1.00 | −0.90 | −0.47 |
| Kurtosis | 0.62 | −0.87 | −0.90 | 1.00 | 0.31 |
| LAA | −0.41 | −0.50 | −0.47 | 0.31 | 1 |
| HU: 0 | HU: 200 | |||||||||||
|---|---|---|---|---|---|---|---|---|---|---|---|---|
| NL | PFF | HAA_A | Kurtosis | HAA | LAA | NL | PFF | HAA_A | Kurtosis | HAA | LAA | |
| NL | 1.00 | −0.65 | −0.65 | 0.51 | −0.10 | −0.34 | 1.00 | −0.83 | −0.24 | 0.81 | −0.76 | −0.14 |
| PFF | −0.65 | 1.00 | 0.99 | −0.62 | 0.13 | −0.49 | −0.83 | 1.00 | 0.45 | −0.90 | 0.79 | −0.44 |
| HAA_A | −0.65 | 0.99 | 1.00 | −0.62 | 0.10 | −0.48 | −0.24 | 0.45 | 1.00 | −0.36 | −0.19 | −0.40 |
| Kurtosis | 0.51 | −0.62 | −0.62 | 1.00 | −0.69 | 1.00 | 0.81 | −0.90 | −0.36 | 1.00 | −0.77 | 0.29 |
| HAA | −0.10 | 0.13 | 0.10 | −0.69 | 1.00 | −0.06 | −0.76 | 0.79 | −0.19 | −0.77 | 1.00 | −0.19 |
| LAA | −0.34 | −0.49 | −0.48 | 0.19 | −0.06 | 1.00 | −0.14 | −0.44 | −0.40 | 0.29 | −0.19 | 1.00 |
| 200 HU | 0 HU | -200 HU | ||||
|---|---|---|---|---|---|---|
| p-Value | Log-lik | p-Value | Log-lik | p-Value | Log-lik | |
| Kurtosis | 0.28 | −33.40 | 0.06 | −31.97 | 0.047 | −31.80 |
| NL% | 0.08 | −32.46 | 0.008 | −30.68 | 0.009 | −30.76 |
| PFF% | 0.34 | −33.54 | 0.12 | −32.89 | 0.13 | −32.94 |
| HAA_A% | 0.10 | −32.71 | 0.09 | −32.66 | 0.09 | −32.68 |
| HAA% | 0.98 | −33.96 | 0.85 | −33.95 | n.a. | n.a. |
| LAA% | 0.19 | −33.22 | 0.24 | −33.36 | 0.24 | −33.36 |
| 200 HU | −200 HU | |||||||||
|---|---|---|---|---|---|---|---|---|---|---|
| β; | Exp (β) | SE [β] | p-Value | Log-lik | β | Exp (β) | SE [β] | p-Value | Log-lik | |
| Ln (FVC) | 0.006 | 1.006 | 0.002 | 7.38 × 10⁻⁴ | −233 | 0.01 | 1.003 | 0.003 | 1.44 × 10⁻³ | −234 |
| Ln (DLco) | 0.007 | 1.007 | 0.003 | 8.61 × 10⁻³ | −230 | 0.002 | 1.003 | 0.005 | 1.45 × 10⁻⁴ | −227 |
© 2020 by the authors. Licensee MDPI, Basel, Switzerland. This article is an open access article distributed under the terms and conditions of the Creative Commons Attribution (CC BY) license (http://creativecommons.org/licenses/by/4.0/).
Share and Cite
Stefano, A.; Gioè, M.; Russo, G.; Palmucci, S.; Torrisi, S.E.; Bignardi, S.; Basile, A.; Comelli, A.; Benfante, V.; Sambataro, G.; et al. Performance of Radiomics Features in the Quantification of Idiopathic Pulmonary Fibrosis from HRCT. Diagnostics 2020, 10, 306. https://doi.org/10.3390/diagnostics10050306
Stefano A, Gioè M, Russo G, Palmucci S, Torrisi SE, Bignardi S, Basile A, Comelli A, Benfante V, Sambataro G, et al. Performance of Radiomics Features in the Quantification of Idiopathic Pulmonary Fibrosis from HRCT. Diagnostics. 2020; 10(5):306. https://doi.org/10.3390/diagnostics10050306
Chicago/Turabian StyleStefano, Alessandro, Mauro Gioè, Giorgio Russo, Stefano Palmucci, Sebastiano Emanuele Torrisi, Samuel Bignardi, Antonio Basile, Albert Comelli, Viviana Benfante, Gianluca Sambataro, and et al. 2020. "Performance of Radiomics Features in the Quantification of Idiopathic Pulmonary Fibrosis from HRCT" Diagnostics 10, no. 5: 306. https://doi.org/10.3390/diagnostics10050306
APA StyleStefano, A., Gioè, M., Russo, G., Palmucci, S., Torrisi, S. E., Bignardi, S., Basile, A., Comelli, A., Benfante, V., Sambataro, G., Falsaperla, D., Torcitto, A. G., Attanasio, M., Yezzi, A., & Vancheri, C. (2020). Performance of Radiomics Features in the Quantification of Idiopathic Pulmonary Fibrosis from HRCT. Diagnostics, 10(5), 306. https://doi.org/10.3390/diagnostics10050306