Abstract
Aging of functional ovaries occurs many years before aging of other organs in the female body. In recent years, a greater number of women continue to postpone their pregnancies to later stages in their lives, raising concerns of the effect of ovarian aging. Mitochondria play an important role in the connection between the aging granulosa cells and oocytes. However, the underlying mechanisms of mitochondrial dysfunction in these cells remain poorly understood. Therefore, we evaluated the molecular mechanism of the aging granulosa cells, including aspects such as accumulation of mitochondrial reactive oxygen species, reduction of mtDNA, imbalance of mitochondrial dynamics, and diminished cell proliferation. Here, we applied bioinformatics approaches, and integrated publicly available resources, to investigate the role of CREB1 gene expression in reproduction. Senescence hallmark enrichment and pathway analysis suggested that the downregulation of bioenergetic-related genes in CREB1. Gene expression analyses showed alterations in genes related to energy metabolism and ROS production in ovary tissue. We also demonstrate that the biogenesis of aging granulosa cells is subject to CREB1 binding to the PRKAA1 and PRKAA2 upstream promoters. In addition, cofactors that regulate biogenesis significantly increase the levels of SIRT1 and PPARGC1A mRNA in the aging granulosa cells. These findings demonstrate that CREB1 elevates an oxidative stress-induced senescence in granulosa cells by reducing the mitochondrial function.
1. Introduction
Ovarian aging is one of the earliest signs of aging in the female body, and has become a cause for concern as more women postpone their childbearing age in modern society. The main cause for the decline in female fertility is the decrease in the number of oocytes, the decline in oocyte quality, and the reduction in hormone levels during ovarian aging, which in turn leads to diseases of the female reproductive system [1,2].
Within the ovarian follicle, the fitness of the oocyte is maintained by a bidirectional signaling between the oocyte and the surrounding granulosa cells [3]. In particular, the cumulus-oocyte complexes coordinate energy metabolism to provide oocytes with sufficient energy to undergo meiosis and support an embryonic development [1,4,5]. Granulosa cells metabolize glucose in the bloodstream to pyruvate and then supply it to the oocytes to enable oxidative phosphorylation to produce ATP [6,7]. The granulosa cells and the oocyte mitochondria are the major mediators of these metabolic pathways and are directly involved in the establishment of oocyte quality during oogenesis [8,9].
During an aerobic metabolism, the process of generation of adenosine triphosphate (ATP) and oxidative phosphorylation inevitably produces reactive oxygen species (ROS) [10]. These include superoxide anion radicals, hydroxyl radicals, and hydrogen peroxide, which can destroy biological molecules and endanger self-regulation mechanisms [11]. Exposure to ROS leads to the deterioration of oocyte quality, rapid consumption of the follicles, and a decrease in the mitochondrial electron transport chain activity in the oocytes [12]. As the mitochondrial respiratory chain complexes age, the complex activity reduces, resulting in a blocked electron transfer, an ineffective oxygen use, and the generation of a large amount of oxygen free radicals [13].
Organisms produce energy through mitochondria to provide homeostasis for cells. At the molecular level, many transcription factors and cofactors are involved in the activation and regulation of mitochondrial biogenesis. The CREB expression level is directly related to the mitochondrial biogenic activity. The activation of the transcription factor CREB1 mediates the activities of PGC1A, AMPK and ATF2, or regulates the phosphorylation of CREB by PKA [14,15,16]. Therefore, CREB plays the core role of biogenesis and activates the regulatory component of mitochondrial biogenesis, which has become a promising research field for enhancing geriatrics.
In the later stages of female reproductive life, the remaining oocytes in the ovaries are maintained in a quiescent state before ovulation [17]. The increase in female age and the extended dormancy of the ovaries also results in an ROS accumulation [18]. The accumulation of oxidized products causes deletion mutations in the mitochondrial DNA (mtDNA) to continuously accumulate [19]. This seriously affects the mitochondrial functions as the respiratory chain complex activity and ATP synthesis are further reduced and ROS continues to increase [12]. At the same time, the antioxidant enzyme activity in the mitochondria also decreases with age [20].
The granulosa cell microenvironment is similar to that of oocytes, and the function and activity of granulosa cells are good indicators of oocyte quality and can be used to evaluate the effects of aging on the oocytes [21,22]. Therefore, we investigated age-related changes in the mitochondria in different aspects of the granulosa cells. Based on our results, the decline in the oxidative phosphorylation function of granulosa cells due to aging is more significant than the mitochondrial copy number and genetic integrity, indicating ovarian aging and reveals strategies to improve the assisted reproductive technology (ART) outcomes in older women. A comprehensive understanding of the underlying mechanisms of infertility related to ovarian aging will help in the better management of the disease in the future.
2. Results
2.1. Predicted Function and Pathway Enrichment Analysis
To investigate the biological significance of these overlapping genes, we uploaded the list of 96 upregulated genes into Metascape software for functional enrichment analysis. The Metascape analysis shows the top 20 clusters of enriched sets (Figure 1A). These genes were enriched in the molecular function categories telomere-associated protein complex, aging, and mitochondrion organization. To further capture the associations that exist between terms, a subset of rich terms was selected and presented as a network graph. Subsequently, we chose the term with the best p-value. Metascape was used to construct the protein-protein interaction (PPI) network of the 96 upregulated genes (Figure 1B). The network was visualized using Cytoscape, where each node represents a rich term and is first colored according to its cluster ID (Figure 1C).
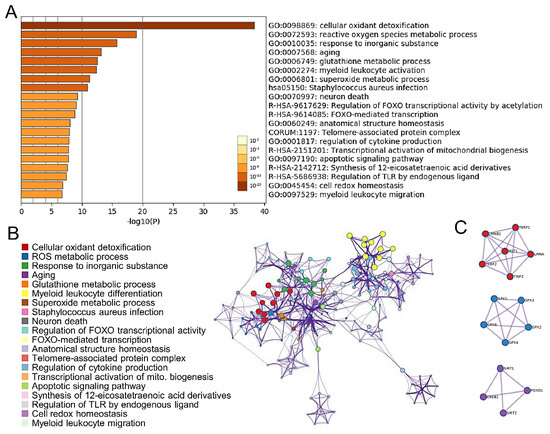
Figure 1.
Functional enrichment and pathway analysis. (A) The Metascape analysis shows the top 20 clusters of enriched sets. Left panel, heatmap of the 20 enriched terms. (B) Representative Molecular Complex Detection (MCODE) network node showing DEG regulated by CREB1. (C) Representative Molecular Complex Detection (MCODE) network nodes, showing the CREB1-regulated DEGs densely connected.
2.2. Establishment and Characteristics of the Aged Granulosa Cells
To ascertain the effect of hydrogen peroxide on cellular senescence, HGL5 cells were incubated with hydrogen peroxide. HGL5 cells were sensitive to increasing concentrations of H2O2 with an IC50 value of 100 μM at 24 h (Figure 2A). Senescent granulosa cells exhibited typical morphological changes characteristic of aged cells as they became flattened and enlarged when compared to those in the control groups (Figure 2B). We also observed that the senescent phenotype gradually developed with H2O2 treatment, which was confirmed by an increase in the cellular granularity, cell size and telomerase activity (Figure 2C,D). To further validate our model of cellular aging, we determined that mRNA expression for the senescence biomarkers, P16, P21 and P27, was significantly increased during cell senescence (Figure 2E).
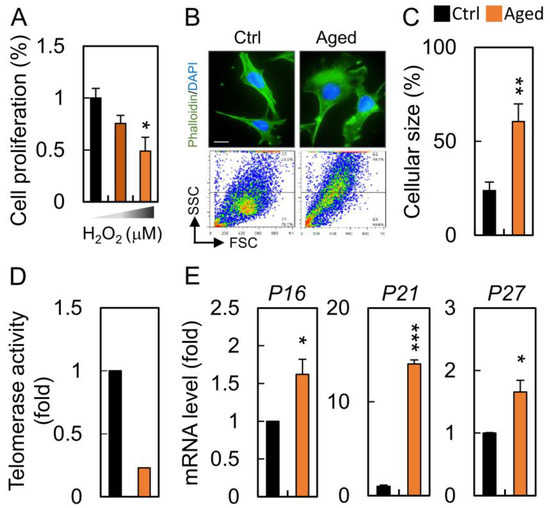
Figure 2.
Granulosa cells undergo senescence after hydrogen peroxide treatment. (A) HGL5 cells were treated with different concentrations of H2O2 for 24 h, and the cell proliferation was assessed by CCK8. (B) The cells were stained for cytoskeleton and analyzed for cellular granularity during senescence. (C) Quantification of cellular size was determined between control and aged groups. (D) Determination of telomerase activity by qPCR. (E) The expression of senescence markers in control and senescent cells. Scare bar = 20 µm, * p < 0.05, ** p < 0.01, and *** p < 0.001.
2.3. Mitochondrial Dysfunction in Granulosa Cells Undergoing Senescence
To further examine whether mitochondrial dysfunction was present in the granulosa cells undergoing senescence, the overall mitochondrial function of the aged granulosa cells was measured at 24 h. The mitochondrial membrane potential (MMP) analysis revealed that H2O2 resulted in a dramatic reduction of the membrane potential depolarization, indicating a loss of MMP and the damage of mitochondria in the aged granulosa cells (Figure 3A). The total cellular and mitochondrial ROS of the H2O2-treated HGL5 was higher than that of the nontreated control group (Figure 3B,C). A lack of mitochondrial sufficiency in the senescent cells also led to a marked reduction in the mtDNA copy number. (Figure 3D).
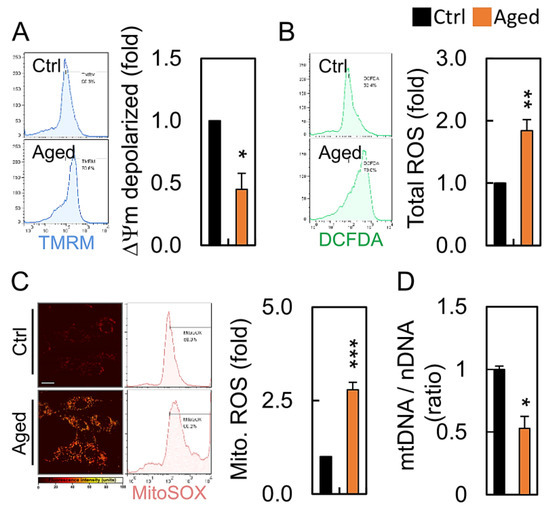
Figure 3.
Aging leads to mitochondrial dysfunction: (A) mitochondrial membrane potential, (B) cellular ROS levels, (C) mitochondrial ROS, and (D) mitochondrial DNA content in in HGL5 cells treated with or without hydrogen peroxide. * p < 0.05, ** p < 0.01, and *** p < 0.001.
2.4. Abnormal Mitochondrial Dynamics in Aged Granulosa Cells
To assess whether the mitochondrial network of the aging granulosa cells was imbalanced, we analyzed changes in the mitochondrial morphology. The mitochondria were classified into three types according to their morphological characteristics (globules, tubules, and others), using the MicroP software [23]. After tracking mitochondria with fluorescent dyes, we found that mitochondrial elongation in the aging group was significantly reduced (Figure 4A). Moreover, the percentage of fragmented mitochondria shown by the aging group was significantly higher than that of the control group (Figure 4B). In addition, the average mitochondrial length was significantly reduced in the aged group compared to that in the control group (Figure 4C).
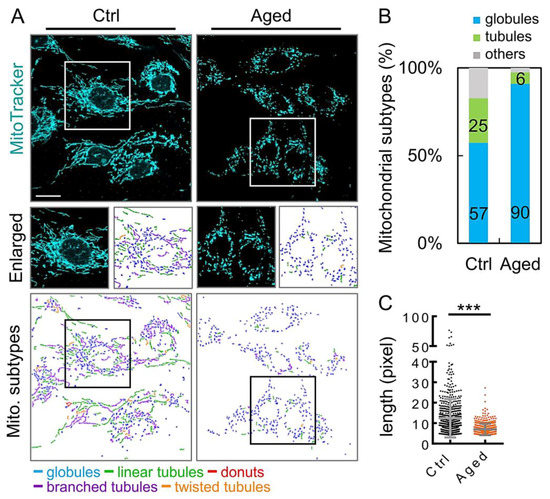
Figure 4.
Aging granulosa cells exhibit increased fragmentation. (A) Mitochondria in granulosa cells, with or without H2O2 treatment, were labeled with MitoTracker. (B) Three major types of mitochondria were quantified: globules, tubules, and others. (C) The total length of each mitochondrion was determined. Scare bar = 20 µm, *** p < 0.001.
To explore the mechanisms underlying the observed reduction in the mitochondrial morphological change, the relative expression of the mitochondrial dynamic genes was analyzed using qRT-PCR. The mRNA levels of DNM1L was significantly higher in the aged group than that in the control group (Figure 5A). However, there were no significant differences in the MFN1, MFN2, OPA1, and FIS1 expression levels between the control and the aged groups (Figure 5B).
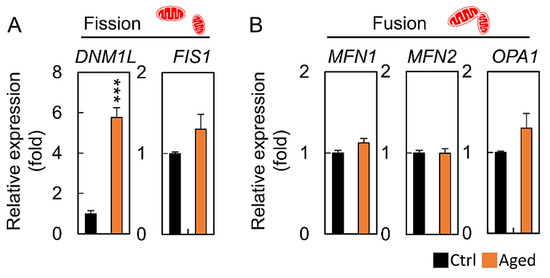
Figure 5.
Aging leads to mitochondrial dynamics imbalance and increased DNM1L expression. (A,B) Quantitative real-time polymerase chain reaction analysis for mRNA expression of mitochondrial dynamics-related genes of granulosa cells among the control and aged groups. All values are normalized to GAPDH and expressed as a fold of control. *** p < 0.001.
2.5. Bioinformatic Analysis of CREB1 Function in Ovary
Heat maps of gene expression in the ovary from public databases show that CREB1 mRNA expression in ovarian tissue is higher than other normal tissues (Figure 6A). In addition to ovarian tissue, the expression of CREB1 mRNA in different types of tissues was further tested, and it was found that the expression of CREB1 mRNA in spleen tissues is usually higher (Figure 6B). In addition, compared with other genes, it was further confirmed that the expression of CREB1 was significantly up-regulated in ovarian tissue (Figure 6C). The enriched terms included the glutathione metabolism, ferroptosis, CREB1 regulates biogenesis genes, and positive regulation of cellular senescence. Meanwhile, the network of core modules of genes (PPARGC1A, SIRT1, ATF2, NRF1, PRKAA1, PRKAA2), as well as core enriched term linked to CREB1, were also constructed by String, which indicating important and potential biomarkers that contributed to the development and progression of senescence with CREB1 (Figure 6D).
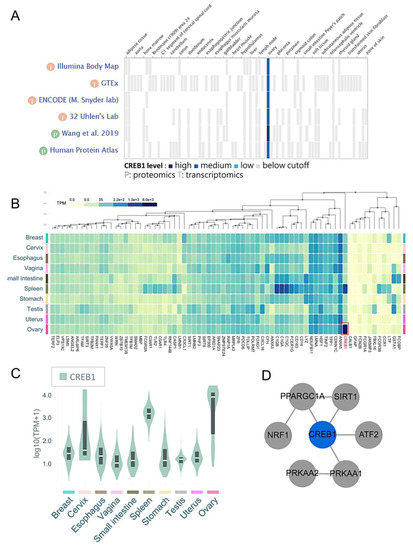
Figure 6.
The level of CREB1 expression in different tissues. (A) CREB1 gene was analyzed for gene distribution and expression in different tissues using GTExPortal website. (B) Heatmap representing the CREB1 indexes of all the 72 genes across all the tissues from Web-based Gene Set analysis Toolkit. (C) The CREB1 mRNA levels in 10 different types of tissues. (D) The protein–protein interaction networks of genes associated with CREB1.
2.6. Regulation of the CREB/PRKAA Transcription Factor Axis in Aged Granulosa Cells
We further explored the upstream regulators that potentially mediated the decreased mitochondrial biogenesis level. Hydrogen peroxide treatment may regulate the expression of PRKAA1 and PRKAA2 mRNA, which are the key effectors of a mitochondrial biogenesis. Publicly available sequencing data showed that CREB1 could bind directly to the PRKAA1 and PRKAA2 promoters (Figure 7A). qPCR with granulosa cells showed that endogenous CREB1 was bound to both PRKAA1 and PRKAA2 during cell senescence, while treatment with H2O2 markedly elevated this (Figure 7B). We further showed that SIRT1 and PPARGC1A mRNA expressions increased in the aging group compared to those in the control, while there was no significant change in the NRF1 mRNA expression (Figure 7C).
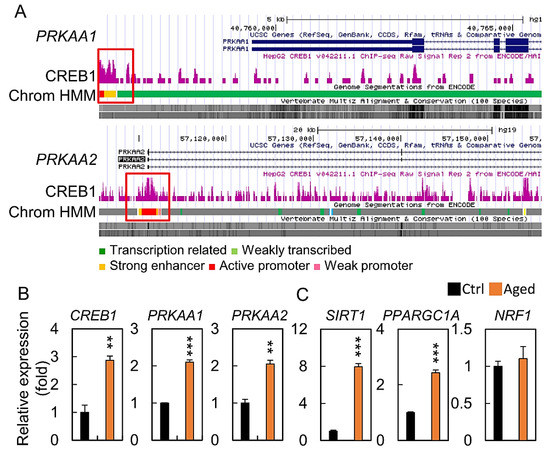
Figure 7.
Age-related changes in key metabolic and transcriptional regulators. (A) Scheme of the human genomic region encompassing the CREB1 promoter. The purple peaks represent the promoter binding regions, according to ENCODE. The red square shows the amplified region in the promoter. (B,C) mRNA expression level of CREB1, PRKAA1, PRKAA2, SIRT1, PPARGC1A, and NRF1. All values were normalized to GAPDH and expressed as a fold of control. ** p < 0.01, and *** p < 0.001.
3. Discussion
Mitochondria are a major factor in the oocyte quality and are vital in the supply of sufficient ATP, but these may be directly affected during ovarian aging [1,11]. Although mitochondria have been hypothesized to be involved in energy metabolism, calcium homeostasis, growth and apoptosis [12,24,25], they have also been indicated to be the main source of intracellular ROS production [26,27]. Previous studies have reported that as age increases, the oocyte mass decreases, and mitochondrial dysfunction, oocyte mtDNA mutation, and deletion levels increase [12,28]. Studies have also shown that the fertilization capacity and subsequent embryo growth potential of oocytes is directly proportional to the mtDNA content of older women, which is closely related to the ATP production in developing embryos [29]. Owing to the higher energy requirements of the developing embryos, oocyte maturation, division, preimplantation, and embryogenesis, a reduced glycolysis and preservation of the mtDNA function, prior to the oocyte blastocyst stage, provides the main source of ATP [30,31,32].
In the present study, we focused on the mitochondria in granulosa cells and found age-related changes in the mitochondrial morphology and functions, accompanied by a decreased MMP in the aging group. However, changes in the intracellular ROS level, the mtDNA content, and mtDNA integrity did not decline significantly with aging. Finally, a reduced mitochondrial DNA copy number and an impaired ability of mitochondrial biogenesis were observed in the study, which may be mainly responsible for the age-related dysfunction of the granulosa cells [33]. In our study, the mitochondria in the younger-age group were mostly elongated. In contrast, the mitochondria in the older-age group were fragmented and accompanied by a higher mitochondrial ROS production [10]. Intracellular ATP levels are often measured as a key indicator of the mitochondrial function; however, the view of mitochondria and reproductive aging in granulosa cells remains controversial. We hypothesized that the mtDNA content in cells would decrease with aging and ultimately regulate the homeostasis of mitochondria in the granulosa cells.
Mitochondria are highly dynamic organelles that move, fuse, and divide continuously according to changes in the cellular energy requirements. Mitochondrial dynamics are mediated by large dynamic GTPases (DRP1, FIS1, OPA1, MFN1, and MFN2) embedded in the mitochondrial membrane [34,35]. Mitochondrial division produces new organelles necessary for cell growth and cell proliferation, while encouraging the elimination of damaged mitochondria [36]. Mitochondrial fusions ensure tight complementarity between organelles to meet the energy needs at the cellular level [37]. Noteworthy, our results showed that the mitochondrial fragmentation morphology of granular cells in the aging group was as high as 90% (Figure 4B). Although the DNM1L mRNA level in the aging group was approximately six-fold that of the control group (Figure 5A), there were no significant differences in expression of the other genes tested. This result indicates that the DRP1 GTPase, which regulates mitochondrial fission and is encoded by the DNM1L gene, plays an important role in the aging granulocytes, and the mitochondrial dynamic imbalance also reflects the result of an mtDNA reduction (Figure 3D).
Many other factors play a major role in the aging process, including key genes SIRT1, PPARGC1A, CREB1, PRKAA1, and PRKAA2. CREB1 is a major regulator of biogenesis and plays a key role in ATP production, which is critical for cell survival under stress conditions [38,39,40]. In different cell types, CREB1 activation induced by an impaired mitochondrial activity suggests that this transcription factor plays an important role in response of the adaptive cells towards a high-energy stress [41,42]. CREB1 was shown to have regulatory binding regions for both PRKAA1 and PRKAA2 upstream regions that activated expression [43,44]. In addition, mRNA expression of the biogenesis cofactors PPARGC1A and SIRT1 were also associated with aging. Although the molecular mechanism of NRF1 mRNA expression is unclear, our study clearly shows that CREB1 is involved in the regulation of the aging granulosa cells when exposed to an oxidative stress. We also observed a higher level of CREB1 mRNA expression in the aging group. The H2O2 stimulation induced significant PRKAA1 and PRKAA2 mRNA expressions, oxidative stress, mitochondrial imbalance, and cell senescence in the HGL5 cells.
4. Materials and Methods
4.1. Cell Culture and Treatment
The human granulosa cell line HGL5 was grown in Dulbecco’s Modified Eagle Medium/Nutrient Mixture F-12 (DMEM/F12; GIBCO Invitrogen Co.) supplemented with 10% fetal bovine serum (FBS) at 37 °C in a humidified incubator containing 5% CO2 and 95% air. The cells cultured in a complete medium (10% FBS) were used as the control. For the senescence experiment, the cells were treated with 100 μM H2O2 for 24 h.
4.2. Cell Proliferation Assay
The cell viability was analyzed using the cell counting kit-8 (CCK-8), which detected the metabolic activity of the cells. At the end of the various treatments, 10 μL of the CCK-8 reagent was added to each well, and the cells were then incubated at 37 °C for 4 h. Absorbance was recorded using an ELISA microplate reader at 450 nm.
4.3. RT-PCR
Total RNA was extracted with REzol (Protech Technology EC, London, UK). Levels of mRNA were analyzed with SYBR green-based real-time quantitative PCR assays (Applied Biosystems, Darmstadt, Germany), with GAPDH as the reference genes in each reaction. Sequences of the primers used for qPCR assays are shown in Table S1.
4.4. Mitochondrial Functional Analysis (ROS and MMP)
Cells were harvested, washed, resuspended in culture medium, and stained with DCFDA (10 μM), MitoSOX (5 μM), and TMRM (500 nM) (Molecular Probes, Eugene, CA, USA) at 37 °C for 30 min. After incubation and wash, cells were analyzed by flow cytometry (FACSCalibur, BD Bioscience, San Jose, CA, USA).
4.5. Fluorescent Labeling
Cells were grown on coverslips, washed with PBS, fixed with 4% paraformaldehyde for 10 min at room temperature (RT). Mitotracker and phalloidin probe were used to label mitochondria and cytoskeleton, respectively. Briefly, cells grown on coverslips were incubated with mitotracker probe (Molecular Probes Inc., Eugene, OR, USA) for 30 min at 37 °C before fixation. Mitochondrial morphology was analyzed by categorizing cells as previously described [45]. Images were acquired using EVOS M5000 imaging system (63× objective).
4.6. Big Data Analytics Tools
Metascape is a free gene annotation and analysis resource that helps researcher make sense of one or multiple gene lists [46]. The Genotype-Tissue Expression (GTEx) project is an ongoing effort to build a comprehensive public resource to study tissue-specific gene expression and regulation [47]. WebGestalt integrates functional enrichment analysis and information visualization. It permits the management, information retrieval, organization, visualization and statistical analysis of large sets of genes. STRING (a search tool for searching interacting genes/proteins) is a known and predicted biological database and network resource for protein-protein interactions [48]. The STRING database contains information from many sources, including experimental data, calculation prediction methods, and public text sets. It can be accessed for free and will be updated regularly. The resource also uses many functional classification systems (such as GO, Pfam, and KEGG) to highlight the functional enrichment in the user-provided protein list [49].
4.7. Telomerase Activity Assay
Quantitative determination of telomerase activity was performed using Telomerase activity quantification qPCR assay kit (Sciencell research lab., Inc., Carlsbad, CA, USA) according to the manufacturer’s protocol.
4.8. Statistical Analysis
The data presented are the mean ± standard error of the mean (S.E.M.) from at least 3 independent experiments and were analyzed using a Student’s t-test. All calculations were performed using GraphPad Prism, 6.0. The intensity of fluorescence was quantified and analyzed using ImageJ software (NIH) and MicroP software [50]. Differences were considered significant when p < 0.05.
5. Conclusions
In conclusion, our study demonstrates that dysfunction of the aging granulosa cells is mainly related to an impaired mitochondrial function, especially for the mitochondrial biogenesis and dynamics. Our research suggests that increasing the biogenic capacity of the granulosa cells may improve infertility in elder women receiving ART (Figure 8). In addition to the common strategies to reduce oxidative stress, preventing ovarian aging also improves the ovarian function by increasing the mitochondrial biogenesis.
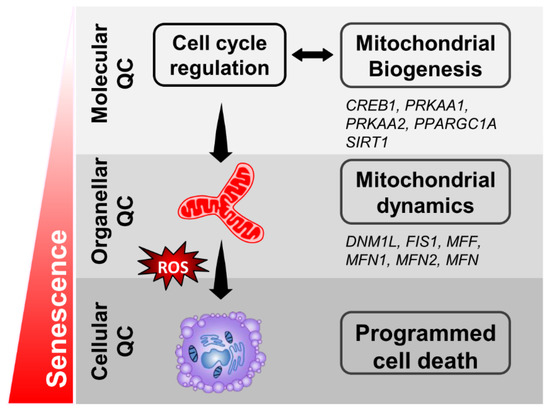
Figure 8.
A working model of the effects in senescent granulosa cells.
Supplementary Materials
Supplementary materials can be found at https://www.mdpi.com/2075-4418/10/5/295/s1. Table S1: Sequence of oligo-nucleotides used as RT-PCR primers.
Author Contributions
Conceptualization, P.-H.L., L.-T.L. and K.-H.T.; methodology, C.-J.L., H.-W.T. and P.-G.K.; software, H.-W.T. and P.-G.K.; formal analysis, H.-W.T.,C.-J.L. and P.-G.K.; investigation, S.-N.C. and Z.-H.W.; resources, K.-H.T. and L.-T.L.; writing—original draft preparation, P.-H.L., L.-T.L. and K.-H.T.; writing—review and editing, Z.-H.W., P.-H.W. and K.-H.T.; visualization, S.-N.C.; supervision, K.-H.T.; project administration, L.-T.L. and K.-H.T.; funding acquisition, L.-T.L. and K.-H.T. All authors have read and agreed to the published version of the manuscript.
Funding
This research was funded by the Kaohsiung Veterans General Hospital (VGHKS108-123, VGHKS108-125, VGHKS108-D14-1, VGHKS109-105, VGHKS109-D07). The authors also appreciate very much financial support from the Female Cancer Foundation, Taipei 104, Taiwan.
Acknowledgments
We thank Ching-Yu Chu for support with the data collection and statistical analysis.
Conflicts of Interest
The authors declare no conflict of interest.
References
- Faddy, M.J. Follicle dynamics during ovarian ageing. Mol. Cell. Endocrinol. 2000, 163, 43–48. [Google Scholar] [CrossRef]
- te Velde, E.R.; Pearson, P.L. The variability of female reproductive ageing. Hum. Reprod. Update 2002, 8, 141–154. [Google Scholar] [CrossRef]
- Alam, M.H.; Miyano, T. Interaction between growing oocytes and granulosa cells in vitro. Reprod. Med. Biol. 2020, 19, 13–23. [Google Scholar] [CrossRef]
- de Bruin, J.P.; Dorland, M.; Spek, E.R.; Posthuma, G.; van Haaften, M.; Looman, C.W.; te Velde, E.R. Age-related changes in the ultrastructure of the resting follicle pool in human ovaries. Biol. Reprod. 2004, 70, 419–424. [Google Scholar] [CrossRef]
- Sutton-McDowall, M.L.; Mottershead, D.G.; Gardner, D.K.; Gilchrist, R.B.; Thompson, J.G. Metabolic differences in bovine cumulus-oocyte complexes matured in vitro in the presence or absence of follicle-stimulating hormone and bone morphogenetic protein 15. Biol. Reprod. 2012, 87, 87. [Google Scholar] [CrossRef]
- Broekmans, F.J.; Soules, M.R.; Fauser, B.C. Ovarian aging: Mechanisms and clinical consequences. Endocr. Rev. 2009, 30, 465–493. [Google Scholar] [CrossRef]
- Liu, Y.; Han, M.; Li, X.; Wang, H.; Ma, M.; Zhang, S.; Guo, Y.; Wang, S.; Wang, Y.; Duan, N.; et al. Age-related changes in the mitochondria of human mural granulosa cells. Hum. Reprod. 2017, 32, 2465–2473. [Google Scholar] [CrossRef]
- Tatone, C.; Amicarelli, F. The aging ovary—The poor granulosa cells. Fertil. Steril. 2013, 99, 12–17. [Google Scholar] [CrossRef]
- Li, C.J.; Chen, S.N.; Lin, L.T.; Chern, C.U.; Wang, P.H.; Wen, Z.H.; Tsui, K.H. Dehydroepiandrosterone Ameliorates Abnormal Mitochondrial Dynamics and Mitophagy of Cumulus Cells in Poor Ovarian Responders. J. Clin. Med. 2018, 7, 293. [Google Scholar] [CrossRef]
- Bhatti, J.S.; Bhatti, G.K.; Reddy, P.H. Mitochondrial dysfunction and oxidative stress in metabolic disorders—A step towards mitochondria based therapeutic strategies. Biochim. Biophys Acta Mol. Basis Dis. 2017, 1863, 1066–1077. [Google Scholar] [CrossRef]
- Eichenlaub-Ritter, U.; Vogt, E.; Yin, H.; Gosden, R. Spindles, mitochondria and redox potential in ageing oocytes. Reprod. Biomed. Online 2004, 8, 45–58. [Google Scholar] [CrossRef]
- May-Panloup, P.; Boucret, L.; Chao de la Barca, J.M.; Desquiret-Dumas, V.; Ferre-L’Hotellier, V.; Moriniere, C.; Descamps, P.; Procaccio, V.; Reynier, P. Ovarian ageing: The role of mitochondria in oocytes and follicles. Hum. Reprod. Update 2016, 22, 725–743. [Google Scholar] [CrossRef] [PubMed]
- Lin, L.T.; Wang, P.H.; Wen, Z.H.; Li, C.J.; Chen, S.N.; Tsai, E.M.; Cheng, J.T.; Tsui, K.H. The Application of Dehydroepiandrosterone on Improving Mitochondrial Function and Reducing Apoptosis of Cumulus Cells in Poor Ovarian Responders. Int. J. Med. Sci. 2017, 14, 585–594. [Google Scholar] [CrossRef] [PubMed]
- Lopez-Lluch, G.; Irusta, P.M.; Navas, P.; de Cabo, R. Mitochondrial biogenesis and healthy aging. Exp. Gerontol. 2008, 43, 813–819. [Google Scholar] [CrossRef] [PubMed]
- Berdeaux, R.; Hutchins, C. Anabolic and Pro-metabolic Functions of CREB-CRTC in Skeletal Muscle: Advantages and Obstacles for Type 2 Diabetes and Cancer Cachexia. Front. Endocrinol. (Lausanne) 2019, 10, 535. [Google Scholar] [CrossRef]
- Than, T.A.; Lou, H.; Ji, C.; Win, S.; Kaplowitz, N. Role of cAMP-responsive element-binding protein (CREB)-regulated transcription coactivator 3 (CRTC3) in the initiation of mitochondrial biogenesis and stress response in liver cells. J. Biol. Chem. 2011, 286, 22047–22054. [Google Scholar] [CrossRef]
- Rojas, J.; Chavez-Castillo, M.; Olivar, L.C.; Calvo, M.; Mejias, J.; Rojas, M.; Morillo, J.; Bermudez, V. Physiologic Course of Female Reproductive Function: A Molecular Look into the Prologue of Life. J. Pregnancy 2015, 2015, 715735. [Google Scholar] [CrossRef] [PubMed]
- Tsui, K.H.; Wang, P.H.; Lin, L.T.; Li, C.J. DHEA protects mitochondria against dual modes of apoptosis and necroptosis in human granulosa HO23 cells. Reproduction 2017, 154, 101–110. [Google Scholar] [CrossRef] [PubMed]
- Herbst, A.; Pak, J.W.; McKenzie, D.; Bua, E.; Bassiouni, M.; Aiken, J.M. Accumulation of mitochondrial DNA deletion mutations in aged muscle fibers: Evidence for a causal role in muscle fiber loss. J. Gerontol. A Biol. Sci. Med. Sci. 2007, 62, 235–245. [Google Scholar] [CrossRef]
- Lin, L.T.; Cheng, J.T.; Wang, P.H.; Li, C.J.; Tsui, K.H. Dehydroepiandrosterone as a potential agent to slow down ovarian aging. J. Obstet. Gynaecol. Res. 2017, 43, 1855–1862. [Google Scholar] [CrossRef]
- Eppig, J.J.; Chesnel, F.; Hirao, Y.; O’Brien, M.J.; Pendola, F.L.; Watanabe, S.; Wigglesworth, K. Oocyte control of granulosa cell development: How and why. Hum. Reprod. 1997, 12, 127–132. [Google Scholar] [PubMed]
- Su, Y.Q.; Sugiura, K.; Eppig, J.J. Mouse oocyte control of granulosa cell development and function: Paracrine regulation of cumulus cell metabolism. Semin. Reprod. Med. 2009, 27, 32–42. [Google Scholar] [CrossRef] [PubMed]
- Li, C.J.; Chen, P.K.; Sun, L.Y.; Pang, C.Y. Enhancement of Mitochondrial Transfer by Antioxidants in Human Mesenchymal Stem Cells. Oxid. Med. Cell. Longev. 2017, 2017, 8510805. [Google Scholar] [CrossRef] [PubMed]
- Mobarak, H.; Heidarpour, M.; Tsai, P.J.; Rezabakhsh, A.; Rahbarghazi, R.; Nouri, M.; Mahdipour, M. Autologous mitochondrial microinjection; a strategy to improve the oocyte quality and subsequent reproductive outcome during aging. Cell Biosci. 2019, 9, 95. [Google Scholar] [CrossRef] [PubMed]
- Kristensen, S.G.; Pors, S.E.; Andersen, C.Y. Improving oocyte quality by transfer of autologous mitochondria from fully grown oocytes. Hum. Reprod. 2017, 32, 725–732. [Google Scholar] [CrossRef]
- Chappel, S. The role of mitochondria from mature oocyte to viable blastocyst. Obstet. Gynecol. Int. 2013, 2013, 183024. [Google Scholar] [CrossRef]
- Das, S.; Chattopadhyay, R.; Ghosh, S.; Ghosh, S.; Goswami, S.K.; Chakravarty, B.N.; Chaudhury, K. Reactive oxygen species level in follicular fluid--embryo quality marker in IVF? Hum. Reprod. 2006, 21, 2403–2407. [Google Scholar] [CrossRef]
- Woods, D.C.; Khrapko, K.; Tilly, J.L. Influence of Maternal Aging on Mitochondrial Heterogeneity, Inheritance, and Function in Oocytes and Preimplantation Embryos. Genes (Basel) 2018, 9, 265. [Google Scholar] [CrossRef]
- Cecchino, G.N.; Seli, E.; Alves da Motta, E.L.; Garcia-Velasco, J.A. The role of mitochondrial activity in female fertility and assisted reproductive technologies: Overview and current insights. Reprod. Biomed. Online 2018, 36, 686–697. [Google Scholar] [CrossRef]
- Gu, L.; Liu, H.; Gu, X.; Boots, C.; Moley, K.H.; Wang, Q. Metabolic control of oocyte development: Linking maternal nutrition and reproductive outcomes. Cell. Mol. Life Sci. 2015, 72, 251–271. [Google Scholar] [CrossRef]
- Barbehenn, E.K.; Wales, R.G.; Lowry, O.H. The explanation for the blockade of glycolysis in early mouse embryos. Proc. Natl. Acad. Sci. USA 1974, 71, 1056–1060. [Google Scholar] [CrossRef] [PubMed]
- Krisher, R.L.; Prather, R.S. A role for the Warburg effect in preimplantation embryo development: Metabolic modification to support rapid cell proliferation. Mol. Reprod. Dev. 2012, 79, 311–320. [Google Scholar] [CrossRef] [PubMed]
- Iwata, H. Age-associated changes in granulosa cells and follicular fluid in cows. J. Reprod. Dev. 2017, 63, 339–345. [Google Scholar] [CrossRef] [PubMed]
- Scott, I.; Youle, R.J. Mitochondrial fission and fusion. Essays Biochem. 2010, 47, 85–98. [Google Scholar] [CrossRef] [PubMed]
- Youle, R.J.; van der Bliek, A.M. Mitochondrial fission, fusion, and stress. Science 2012, 337, 1062–1065. [Google Scholar] [CrossRef]
- Antico Arciuch, V.G.; Elguero, M.E.; Poderoso, J.J.; Carreras, M.C. Mitochondrial regulation of cell cycle and proliferation. Antioxid. Redox Signal. 2012, 16, 1150–1180. [Google Scholar] [CrossRef]
- Liu, Y.J.; McIntyre, R.L.; Janssens, G.E.; Houtkooper, R.H. Mitochondrial fission and fusion: A dynamic role in aging and potential target for age-related disease. Mech. Ageing Dev. 2020, 186, 111212. [Google Scholar] [CrossRef]
- Canto, C.; Auwerx, J. PGC-1alpha, SIRT1 and AMPK, an energy sensing network that controls energy expenditure. Curr. Opin. Lipidol. 2009, 20, 98–105. [Google Scholar] [CrossRef]
- Di Emidio, G.; Falone, S.; Vitti, M.; D’Alessandro, A.M.; Vento, M.; Di Pietro, C.; Amicarelli, F.; Tatone, C. SIRT1 signalling protects mouse oocytes against oxidative stress and is deregulated during aging. Hum. Reprod. 2014, 29, 2006–2017. [Google Scholar] [CrossRef]
- Ma, R.; Zhang, Y.; Zhang, L.; Han, J.; Rui, R. Sirt1 protects pig oocyte against in vitro aging. Anim. Sci. J. 2015, 86, 826–832. [Google Scholar] [CrossRef]
- Bentov, Y.; Casper, R.F. The aging oocyte--can mitochondrial function be improved? Fertil. Steril. 2013, 99, 18–22. [Google Scholar] [CrossRef]
- Gilchrist, R.B.; Luciano, A.M.; Richani, D.; Zeng, H.T.; Wang, X.; Vos, M.D.; Sugimura, S.; Smitz, J.; Richard, F.J.; Thompson, J.G. Oocyte maturation and quality: Role of cyclic nucleotides. Reproduction 2016, 152, R143–R157. [Google Scholar] [CrossRef]
- Garcia, D.; Shaw, R.J. AMPK: Mechanisms of Cellular Energy Sensing and Restoration of Metabolic Balance. Mol. Cell 2017, 66, 789–800. [Google Scholar] [CrossRef]
- Herzig, S.; Shaw, R.J. AMPK: Guardian of metabolism and mitochondrial homeostasis. Nat. Rev. Mol. Cell. Biol. 2018, 19, 121–135. [Google Scholar] [CrossRef] [PubMed]
- Peng, J.Y.; Lin, C.C.; Chen, Y.J.; Kao, L.S.; Liu, Y.C.; Chou, C.C.; Huang, Y.H.; Chang, F.R.; Wu, Y.C.; Tsai, Y.S.; et al. Automatic morphological subtyping reveals new roles of caspases in mitochondrial dynamics. PLoS Comput. Biol. 2011, 7, e1002212. [Google Scholar] [CrossRef] [PubMed]
- Zhou, Y.; Zhou, B.; Pache, L.; Chang, M.; Khodabakhshi, A.H.; Tanaseichuk, O.; Benner, C.; Chanda, S.K. Metascape provides a biologist-oriented resource for the analysis of systems-level datasets. Nat. Commun. 2019, 10, 1523. [Google Scholar] [CrossRef] [PubMed]
- Consortium, G.T. The Genotype-Tissue Expression (GTEx) project. Nat. Genet. 2013, 45, 580–585. [Google Scholar] [CrossRef]
- Liao, Y.; Wang, J.; Jaehnig, E.J.; Shi, Z.; Zhang, B. WebGestalt 2019: Gene set analysis toolkit with revamped UIs and APIs. Nucleic Acids Res. 2019, 47, W199–W205. [Google Scholar] [CrossRef]
- Szklarczyk, D.; Gable, A.L.; Lyon, D.; Junge, A.; Wyder, S.; Huerta-Cepas, J.; Simonovic, M.; Doncheva, N.T.; Morris, J.H.; Bork, P.; et al. STRING v11: Protein-protein association networks with increased coverage, supporting functional discovery in genome-wide experimental datasets. Nucleic Acids Res. 2019, 47, D607–D613. [Google Scholar] [CrossRef]
- Tsui, K.H.; Wu, M.Y.; Lin, L.T.; Wen, Z.H.; Li, Y.H.; Chu, P.Y.; Li, C.J. Disruption of mitochondrial homeostasis with artemisinin unravels anti-angiogenesis effects via auto-paracrine mechanisms. Theranostics 2019, 9, 6631–6645. [Google Scholar] [CrossRef]
© 2020 by the authors. Licensee MDPI, Basel, Switzerland. This article is an open access article distributed under the terms and conditions of the Creative Commons Attribution (CC BY) license (http://creativecommons.org/licenses/by/4.0/).