Article

The Influence of Methylating Mutations on Acute Myeloid Leukemia: Preliminary Analysis on 56 Patients

1
Department of Hematology, Iuliu Hatieganu University of Medicine and Pharmacy, 400124 Cluj Napoca, Romania
2
Research Center for Functional Genomics and Translational Medicine, Iuliu Hatieganu University of Medicine and Pharmacy, 400124 Cluj Napoca, Romania
3
Department of Hematology, Ion Chiricuta Clinical Cancer Center, 400006 Cluj Napoca, Romania
4
Medfuture Research Center for Advanced Medicine, Iuliu Hatieganu University of Medicine and Pharmacy, 400124 Cluj Napoca, Romania
*
Author to whom correspondence should be addressed.
Diagnostics 2020, 10(5), 263; https://doi.org/10.3390/diagnostics10050263
Submission received: 13 April 2020 / Revised: 26 April 2020 / Accepted: 28 April 2020 / Published: 29 April 2020
(This article belongs to the Section Pathology and Molecular Diagnostics)

Abstract

:
Acute myeloid leukemia (AML) is a hematologic malignancy characterized by abnormal proliferation and a lack of differentiation of myeloid blasts. Considering the dismal prognosis this disease presents, several efforts have been made to better classify it and offer a tailored treatment to each subtype. This has been formally done by the World Health Organization (WHO) with the AML classification schemes from 2008 and 2016. Nonetheless, there are still mutations that are not currently included in the WHO AML classification, as in the case of some mutations that influence methylation. In this regard, the present study aimed to determine if some of the mutations that influence DNA methylation can be clustered together regarding methylation, expression, and clinical profile. Data from the TCGA LAML cohort were downloaded via cBioPortal. The analysis was performed using R 3.5.2, and the necessary packages for classical statistics, dimensionality reduction, and machine learning. We included only patients that presented mutations in DNMT3A, TET2, IDH1/2, ASXL1, WT1, and KMT2A. Afterwards, mutations that were present in too few patients were removed from the analysis, thus including a total of 57 AML patients. We observed that regarding expression, methylation, and clinical profile, patients with mutated TET2, IDH1/2, and WT1 presented a high degree of similarity, indicating the equivalence that these mutations present between themselves. Nonetheless, we did not observe this similarity between DNMT3A- and KMT2A-mutated AML. Moreover, when comparing the hypermethylating group with the hypomethylating one, we also observed important differences regarding expression, methylation, and clinical profile. In the current manuscript we offer additional arguments for the similarity of the studied hypermethylating mutations and suggest that those should be clustered together in further classifications. The hypermethylating and hypomethylating groups formed above were shown to be different from each other considering overall survival, methylation profile, expression profile, and clinical characteristics. In this manuscript, we present additional arguments for the similarity of the effect generated by TET2, IDH1/2, and WT1 mutations in AML patients. Thus, we hypothesize that hypermethylating mutations skew the AML cells to a similar phenotype with a possible sensitivity to hypermethylating agents.

1. Introduction

Acute myeloid leukemia (AML) is a hematologic malignancy characterized by aberrant differentiation and abnormal proliferation of myeloid blasts [1,2,3]. Continuous efforts are being made to uncover the biology of AML, with implications both in prognosis and in tailoring new therapeutic options for these patients. These efforts can be formally observed in the AML World Health Organization (WHO) classification in 2008 and 2016 [4,5].
Over time, several research groups have shown different prognostic capabilities of expression and methylation profiling [6,7,8]. Nonetheless, most molecular biology markers used in clinical practice are represented by gene mutations, while DNA methylation and RNA expression are commonly only used within the research setting [6,9,10,11,12]. This might be due to economic reasons, levels of evidence, and the reproducibility that can be achieved. Nevertheless, the epigenome and transcriptome are known to be different between AML patients, having a good potential to act as tools for classifying AML and choosing the best available therapy. Thus, an inferred epigenome and transcriptome considering mutations that affect genes implicated in methylation could be useful to improve our understanding of the biology of AML as well as the AML clinical practice.
Important pathways in AML are formed by key genes implicated in methylation, hydroxymethylation, and demethylation [13,14,15,16]. These are represented by, but not limited to, DNMT3A, TET2, IDH1/2, WT1, ASXL1, and KMT2A. DNMT3A is a de novo DNA methyl transferase that in physiological conditions transforms a non-methylated CpG into a hemymethylated CpG. In AML, it has been shown that DNMT3A can present mutations in an important portion of cases, which induce a global hypomethylation, changes in AML biology, and a worse prognosis [17]. TET2 physiologically leads to the hydroxymethylation of methylated CpG, initiating the demethylation process. Most mutations in TET2 lead to the formation of non-functional forms of TET2, associated with a decrease in its function and a hypermethylated genome [15]. In contrast to TET2, IDH1/2 present few mutations that can be commonly observed in AML and that induce the formation of 2-hydroxy-glutarate, a metabolite that inhibits TET2, leading to similar effects to TET2 mutations [15]. WT1 is a gene that physically interacts with TET2, aiding in the process of hydroxymethylation. As in the case of TET2, most mutations observed in WT1 lead to the formation of a non-functional protein, indirectly determining a diminished activity of TET2 [18]. ASXL1 is a gene that has been observed to be important in interacting with TET2 and can be mutated in several myeloid malignancies [19]. KMT2A presents roles in methylating H3K4, DNA binding, and either inhibiting methylation or modifying the chromatin conformation. Mutations in this genes are generally represented either by amplifications or fusions, with patients presenting a hypomethylated epigenome and generally having a worse prognosis [20,21,22,23].
The aim of this study was to determine the differences that the presented mutations induce in AML regarding methylation, expression, and clinical profile.

2. Material and Methods

TCGA Analysis

cBioPortal was used to download clinical, methylation, and expression data from the TCGA cohort on adult AML [24,25,26]. The results shown here are based upon data generated by the TCGA Research Network: https://www.cancer.gov/tcga (accessed on 21 January 2020). Data analysis was performed using R version 3.5.2. Oncoprints were generated using the cBioPortal platform. The normality of the data was assessed using the Shapiro-Wilk test and histogram visualization. For the comparison of two groups with continuous variables, we used the Mann-Whitney-Wilcoxon test. For comparing multiple groups with continuous variables, we used the Kruskal-Wallis test. The analysis of contingency tables was performed using Fisher’s test. Survival analysis was performed using Kaplan-Meier curves and the log-rank test. Unsupervised machine learning was performed using pheatmap and prcomp to generate the needed heatmaps and principal component analysis (PCAs), respectively. Supervised machine learning was performed using randomForest. The differential expression analysis was performed using the DEseq2 package [27], with an lfcThreshold of 0.32 and using the Benjamini-Hochberg p adjustment method. Functional enrichment analysis was performed using FENet [28], topGO, and GO.db [29]. A p value under 0.05 was considered statistically significant.

3. Results

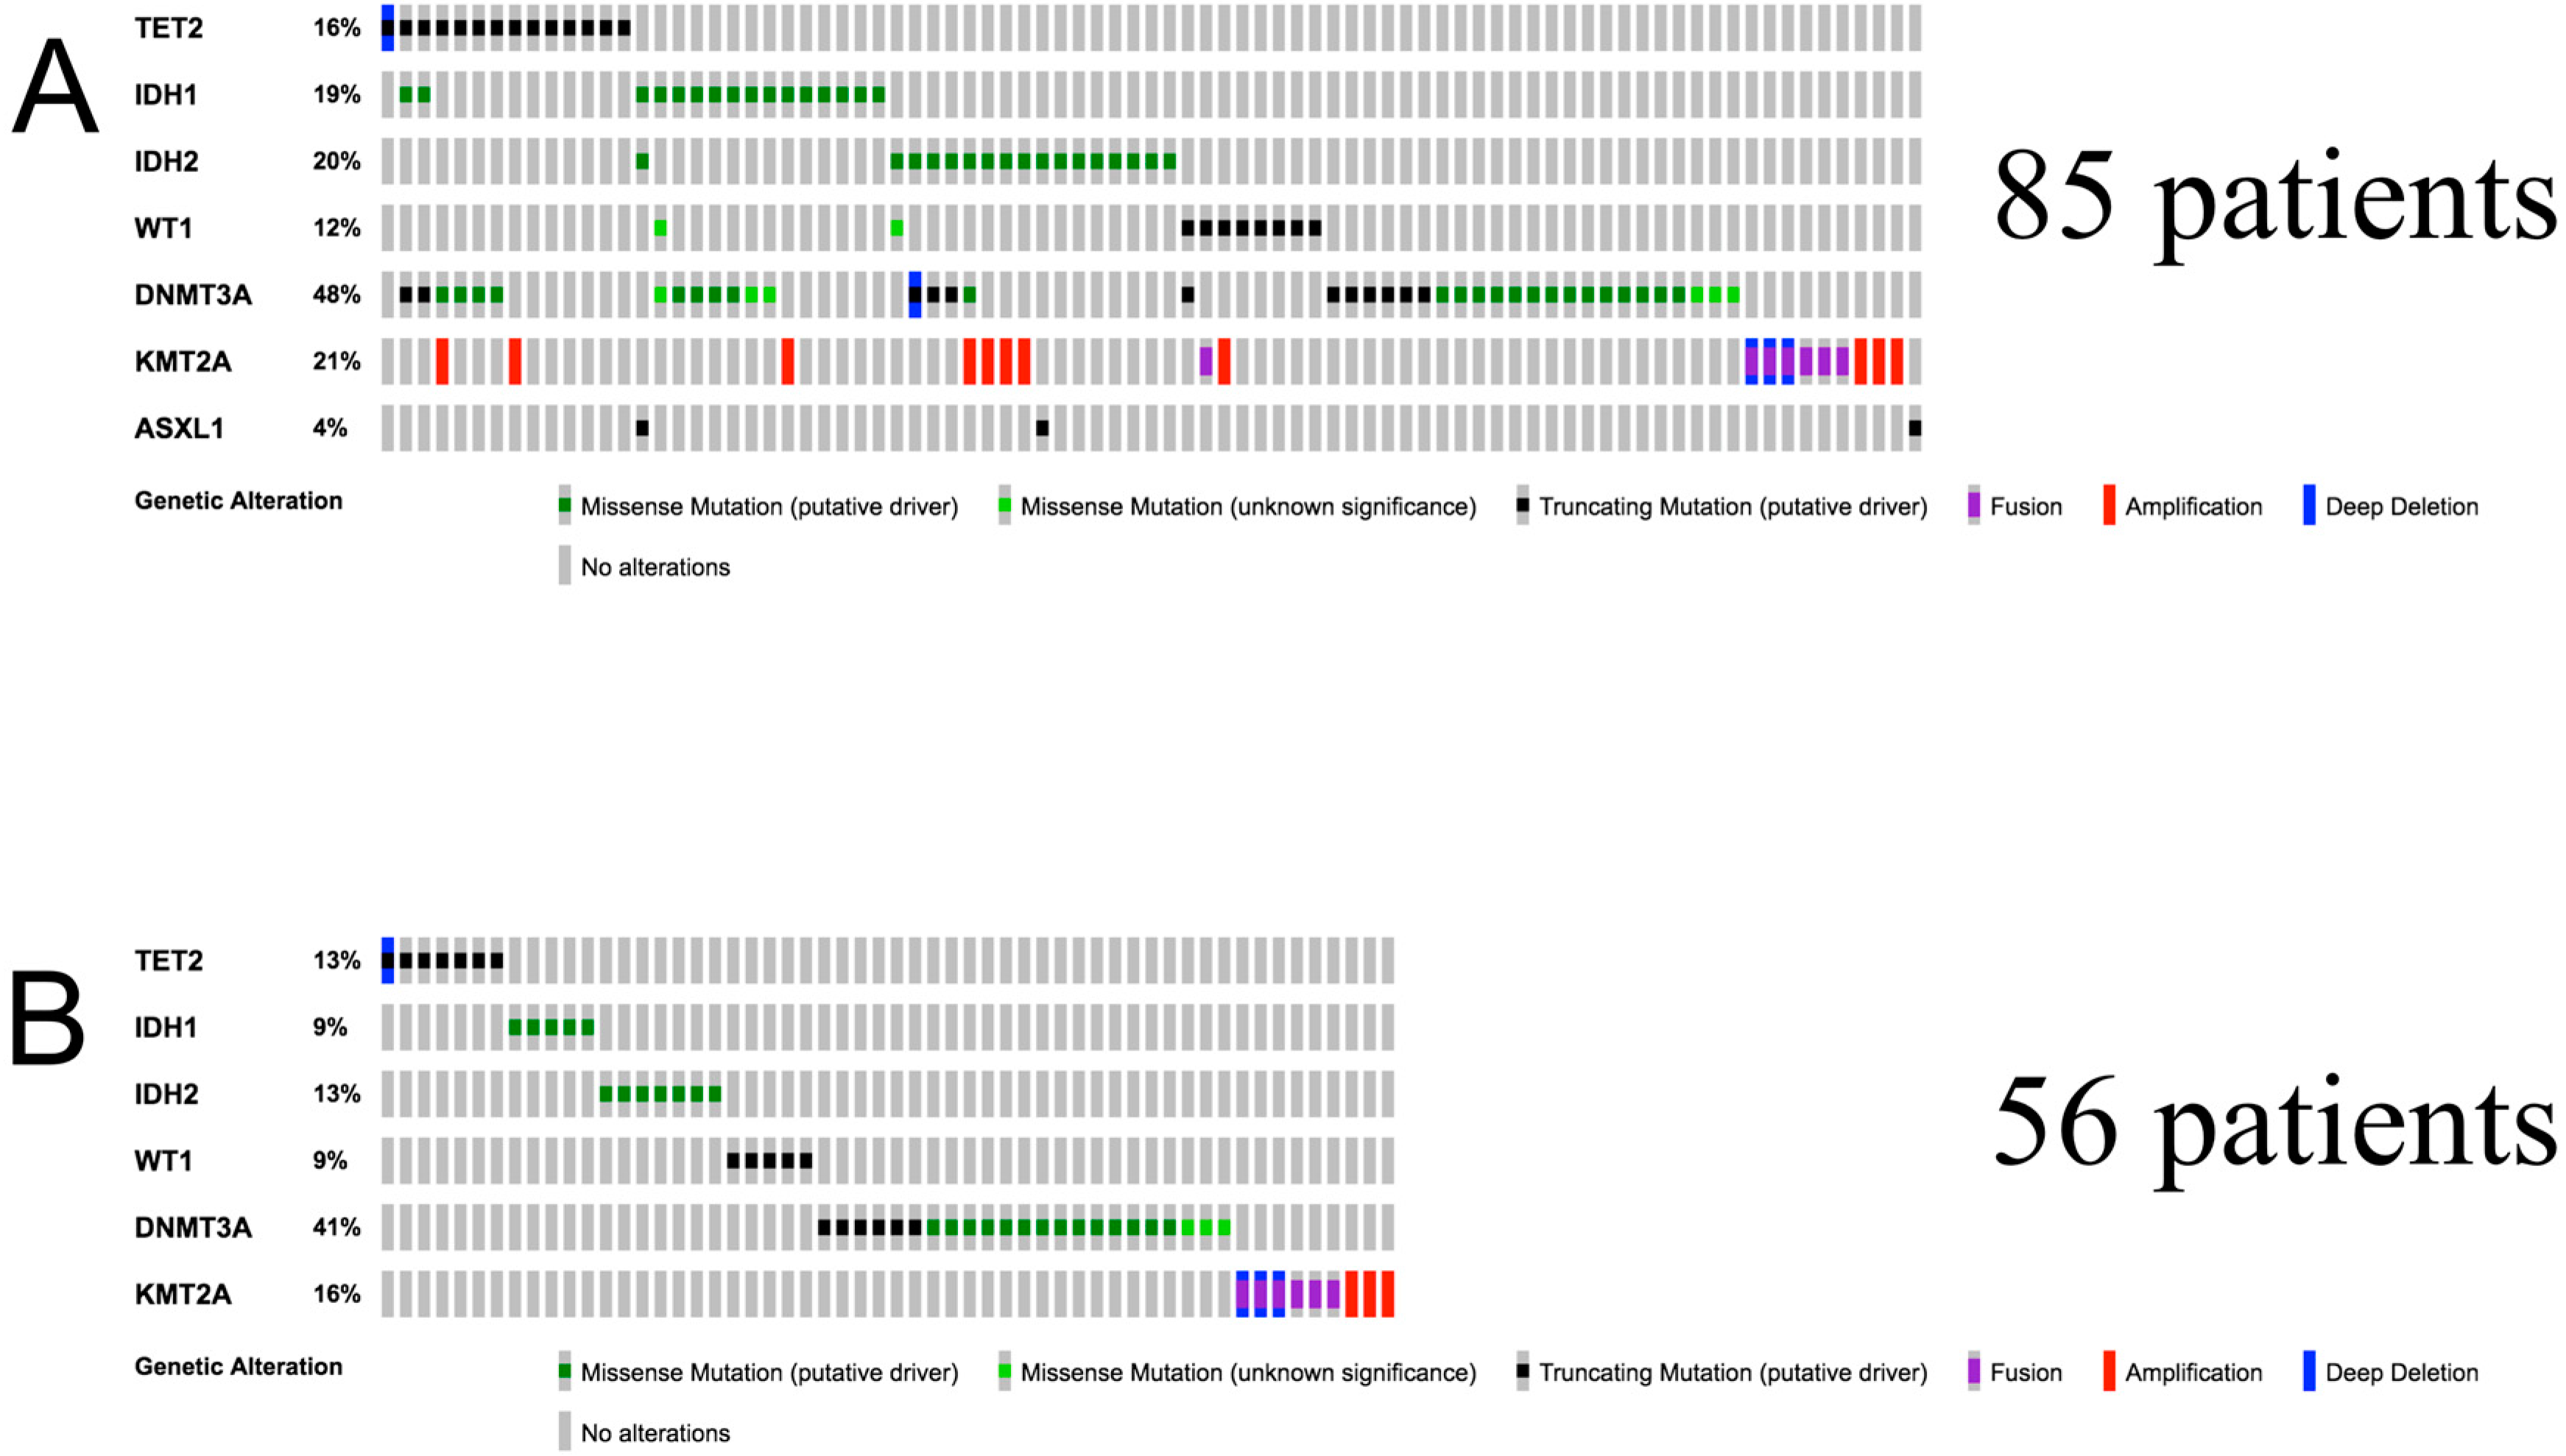
3.1. Patient Selection

We included the patients that had transcriptomic and methylation profiles available and presented mutations in any of the following genes: TET2, IDH1, IDH2, WT1, KMT2A, DNMT3A, ASXL1. After applying these criteria, 85 patients were initially included (Figure 1A). Because these genes are known to highly influence DNA methylation and thus expression [13,15,18,30,31,32], we further included only the patients in which only one of the seven genes was mutated, so that the influence of each mutation could be observed without the influence of the other mutations included. After applying this second filter, the resulting cohort included 57 patients. Considering that ASXL1 was mutated only in one patient, that patient was excluded from the analysis to avoid overfitting, thus using a cohort of 56 AML patients for further analyses (Figure 1B).

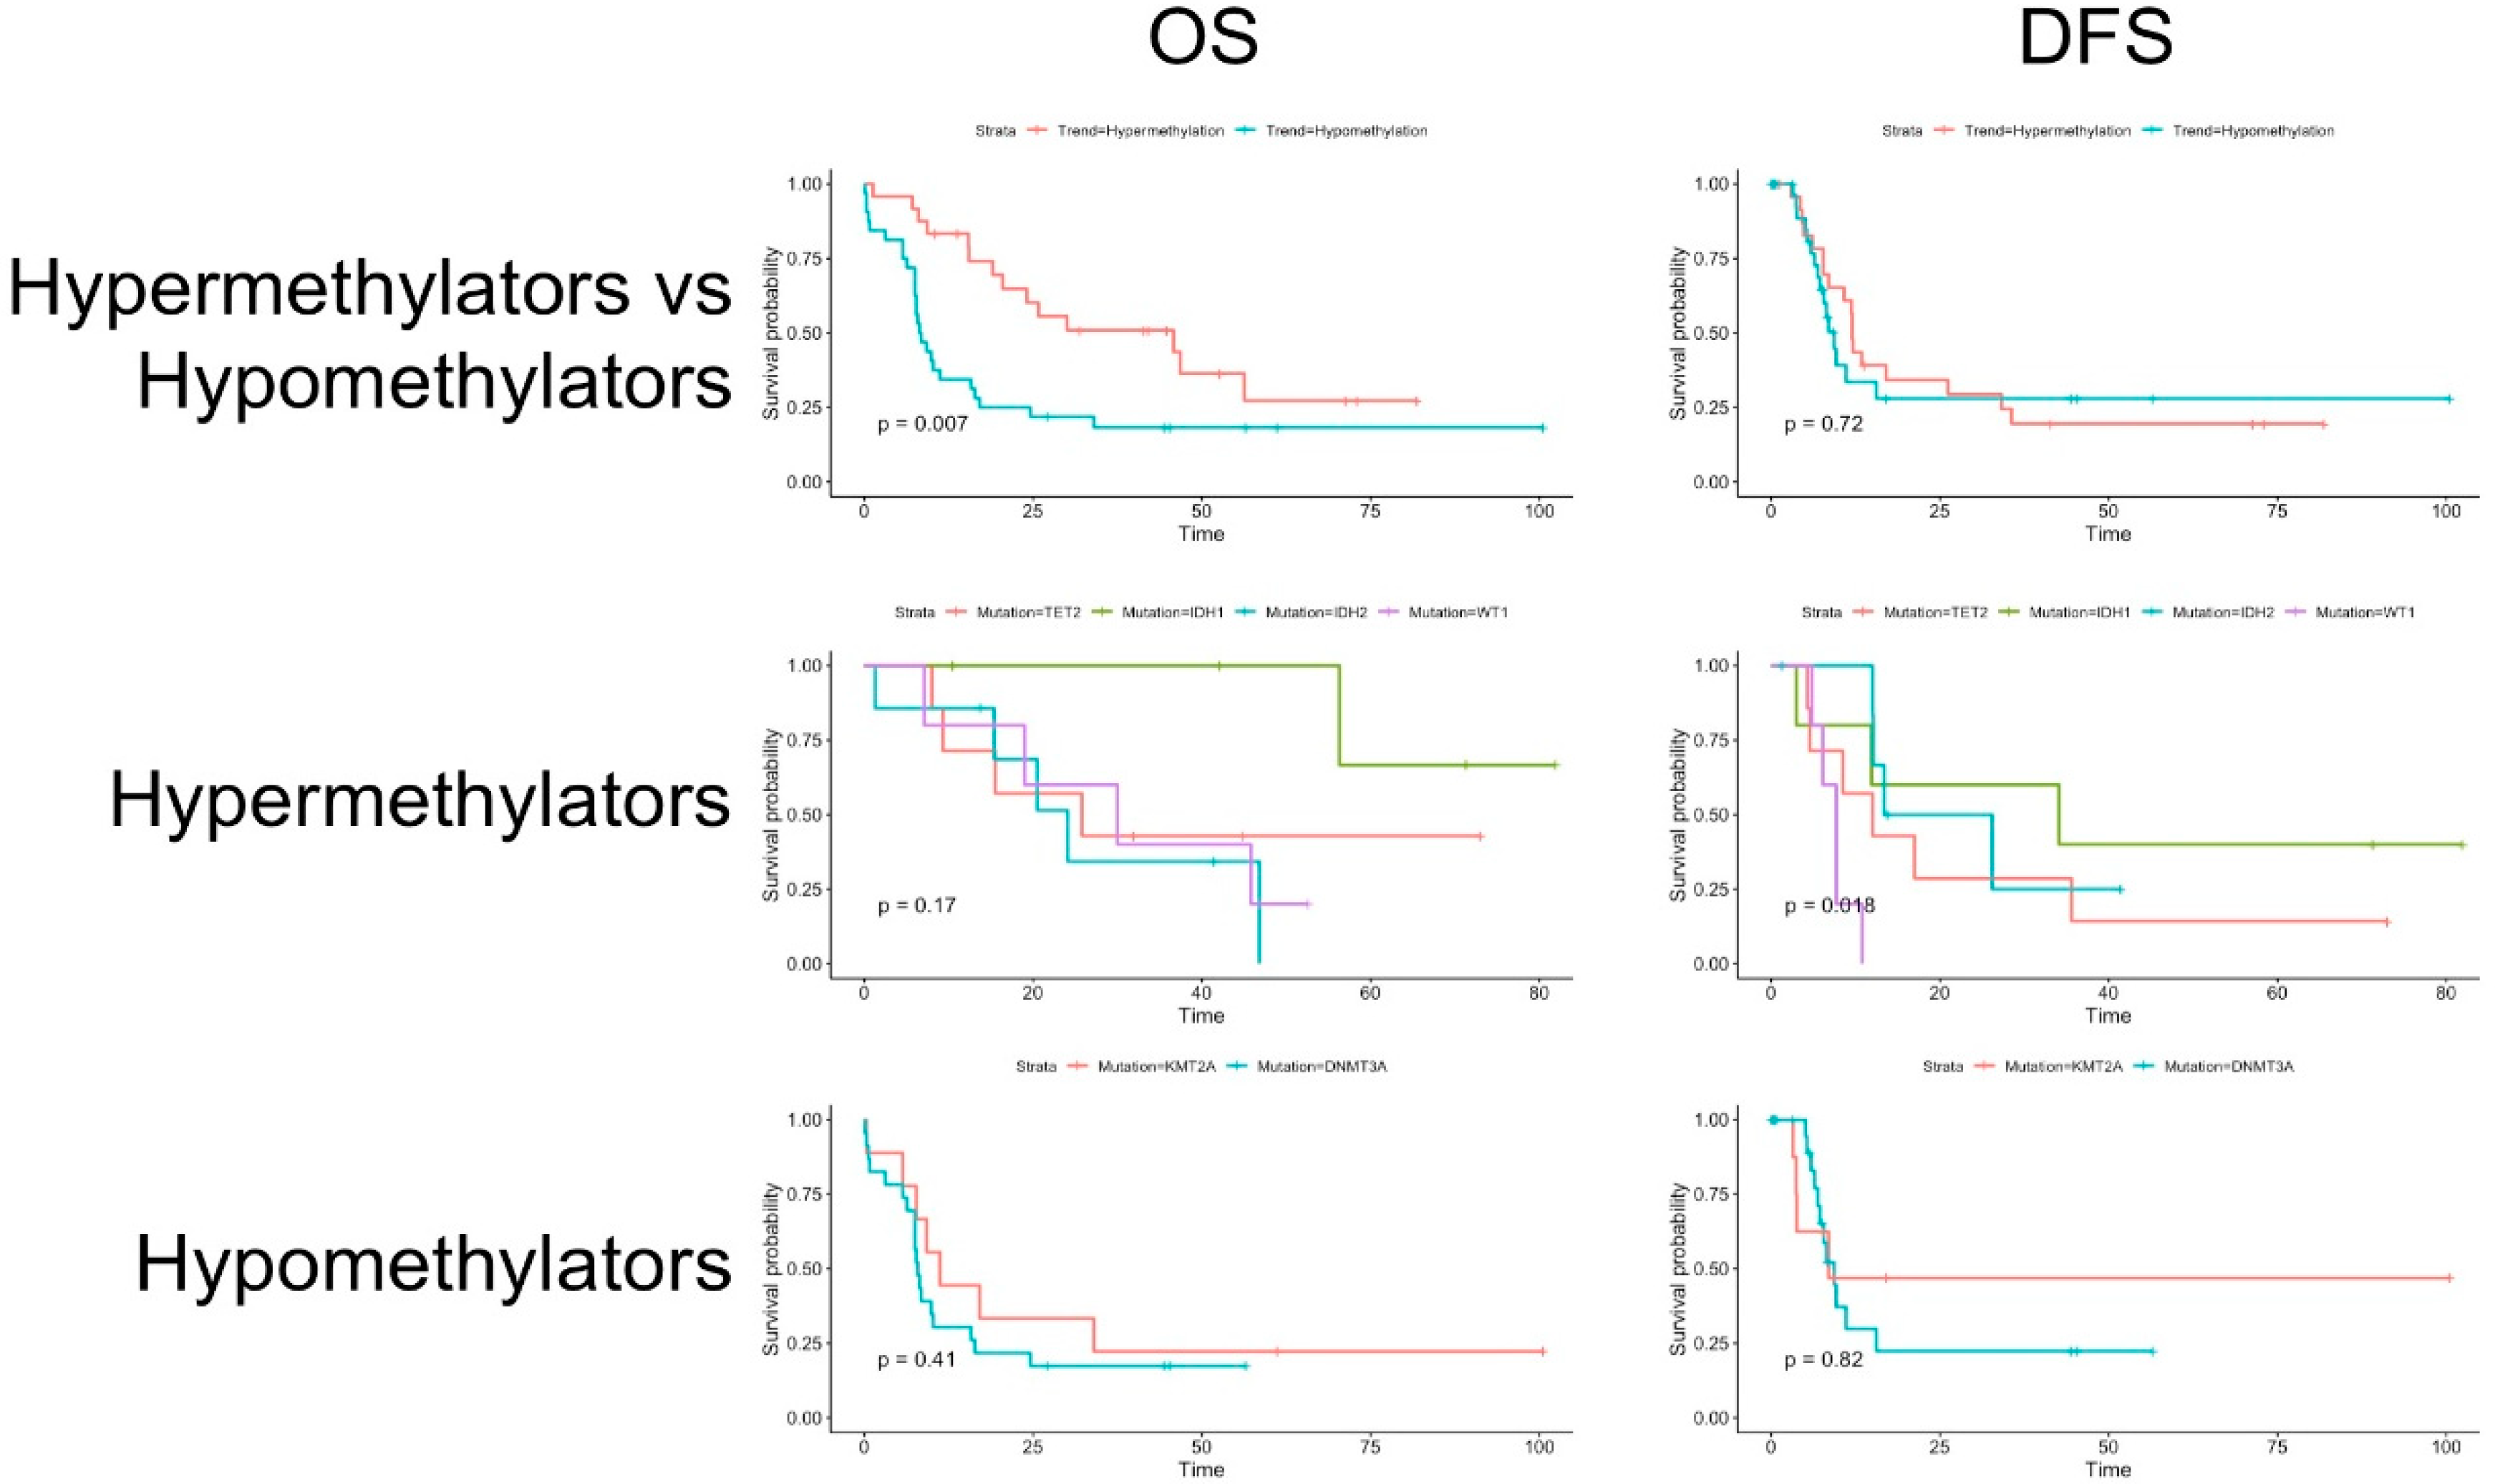
3.2. Clinical Data and Survival Analysis

The available clinical parameters analyzed were represented by gender, age, French-American-British (FAB) classification transposed in the equivalent WHO-NOS (Not Otherwise Specified), white blood cell count (WBC), bone marrow blast percentage, peripheral blood blast percentage, and cytogenetic risk. Clinically, patients with hypermethylating mutations had a higher peripheral blast percentage and included more AML patients without maturation compared with the hypomethylating mutations group, the latter including acute monoblastic/monocytic leukemia more frequently. The cytogenetic risk most frequently reported in both hypermethylating (83%) and hypomethylating (84%) groups was represented by intermediate cytogenetic risk (Table 1).
In subgroup analysis, in the hypermethylating group, the only difference between the four mutations was in age (Table 2), whereas in the hypomethylating group, there were no differences in the clinical parameters (Table 3).
Regarding survival analysis, the hypomethylating group showed a lower overall survival (OS) (p = 0.007), but there was no difference in disease-free survival (DFS). In the hypermethylating group, there was no significant difference in OS between mutations, but there was a statistically significant difference in DFS (p = 0.018) between mutations. Analyzing the Kaplan-Meyer curves, it appears that this difference was caused mainly by WT1 mutated patients (n = 5), while the other mutations showed a similar trend between each other. In the hypomethylating group, there was no difference in survival between mutations (Figure 2).

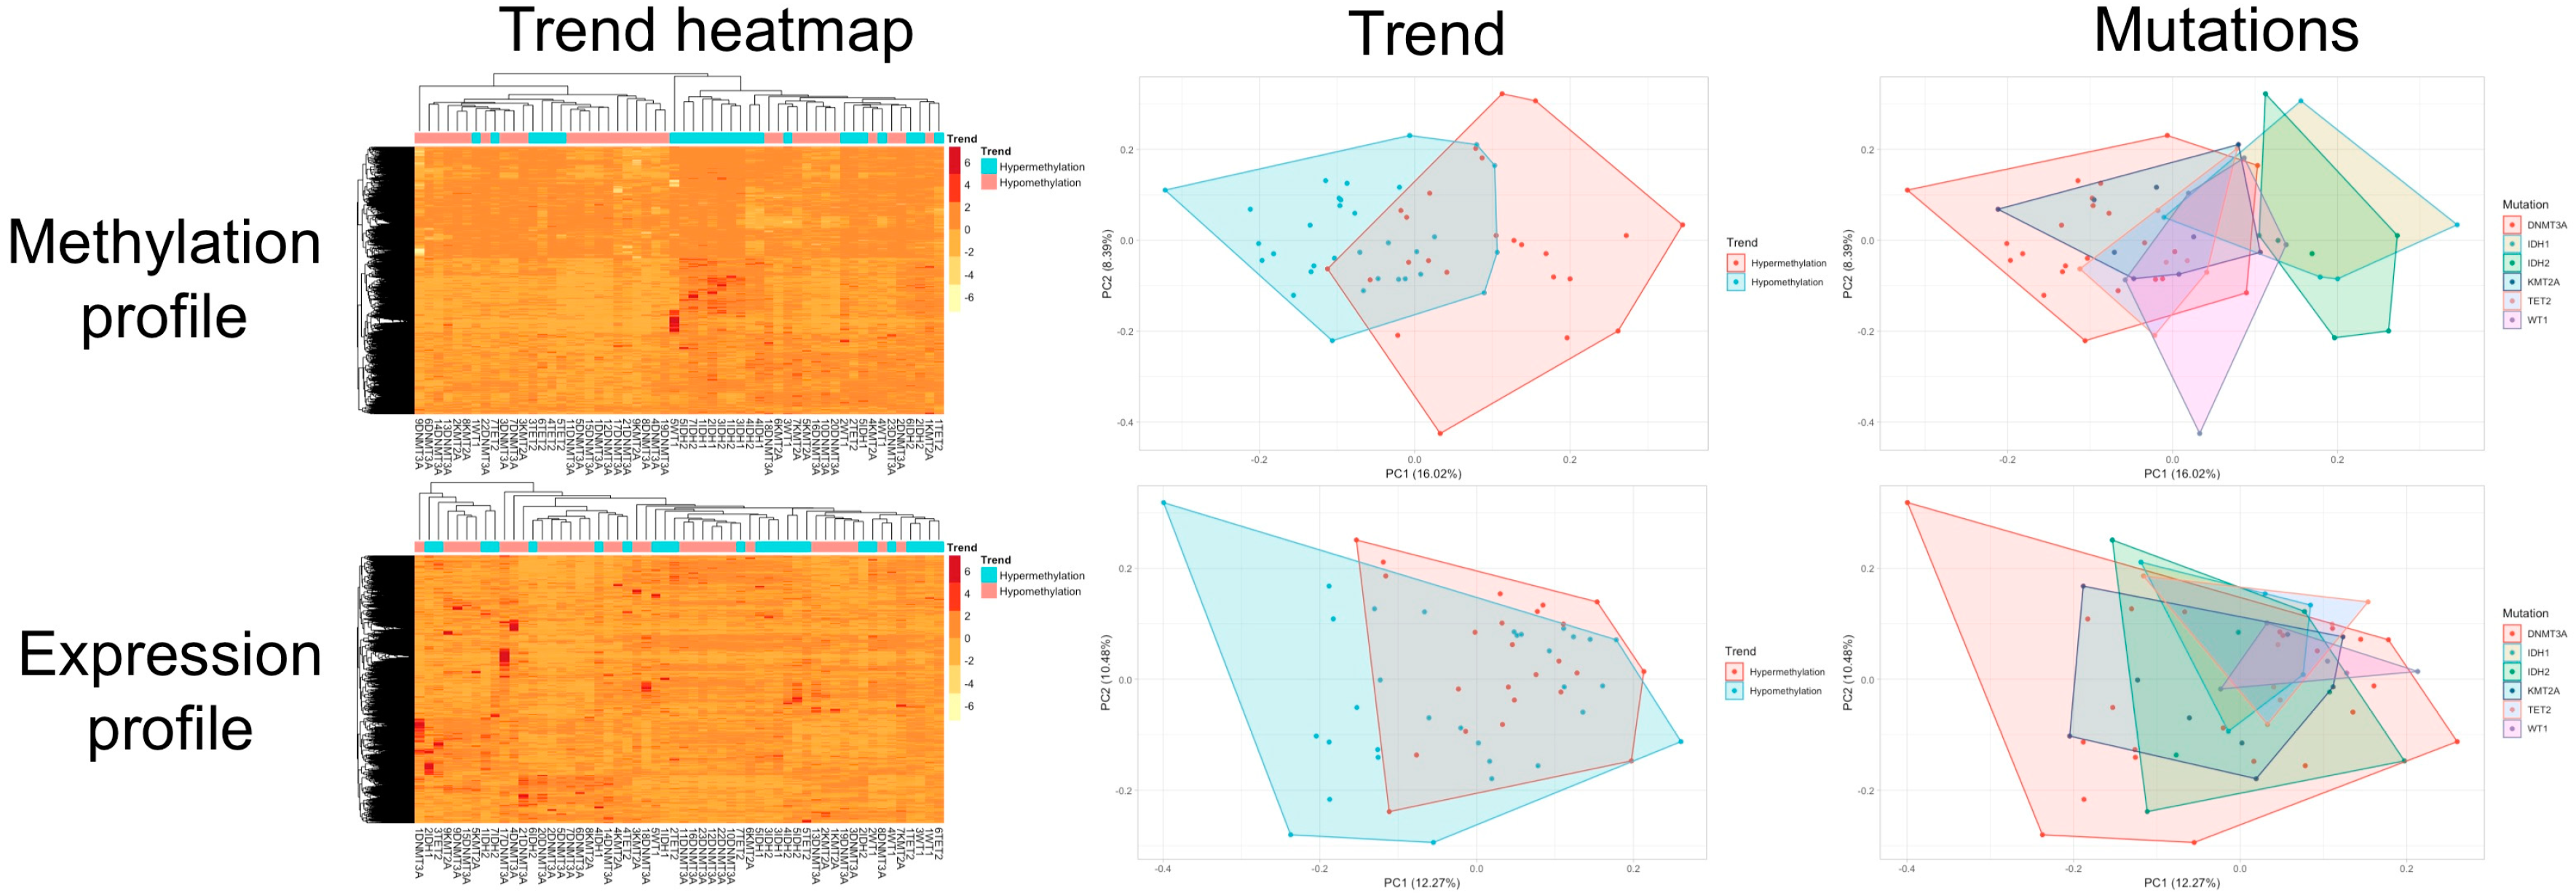
3.3. Clustering and Principal Component Analysis

For the methylation profile, a certain enrichment of hypermethylating and hypomethylating mutations, respectively, was observed between the two most distant clusters on the heatmap. This discrimination between the hypermethylating and hypomethylating groups is lower when considering the expression profile.
In Figure 3 we depicted the heatmaps and PCAs for the methylation and expression profiles.

3.4. Supervised Machine Learning

When analyzing the predictive capabilities between hypermethylating and hypomethylating groups, hypermethylating mutations were determined with an accuracy of 75%, and hypomethylating mutations were determined with an accuracy of 81.25% with an out of bag (OOB) of 21.43%.
When only hypermethylating mutations were introduced in the algorithm, the accuracy varied from 0 to 14.3%, and the OOB was 91.65%. When only hypomethylating mutations were introduced in the algorithm, all mutations were classified as KMT2A with an OOB of 71.88%.

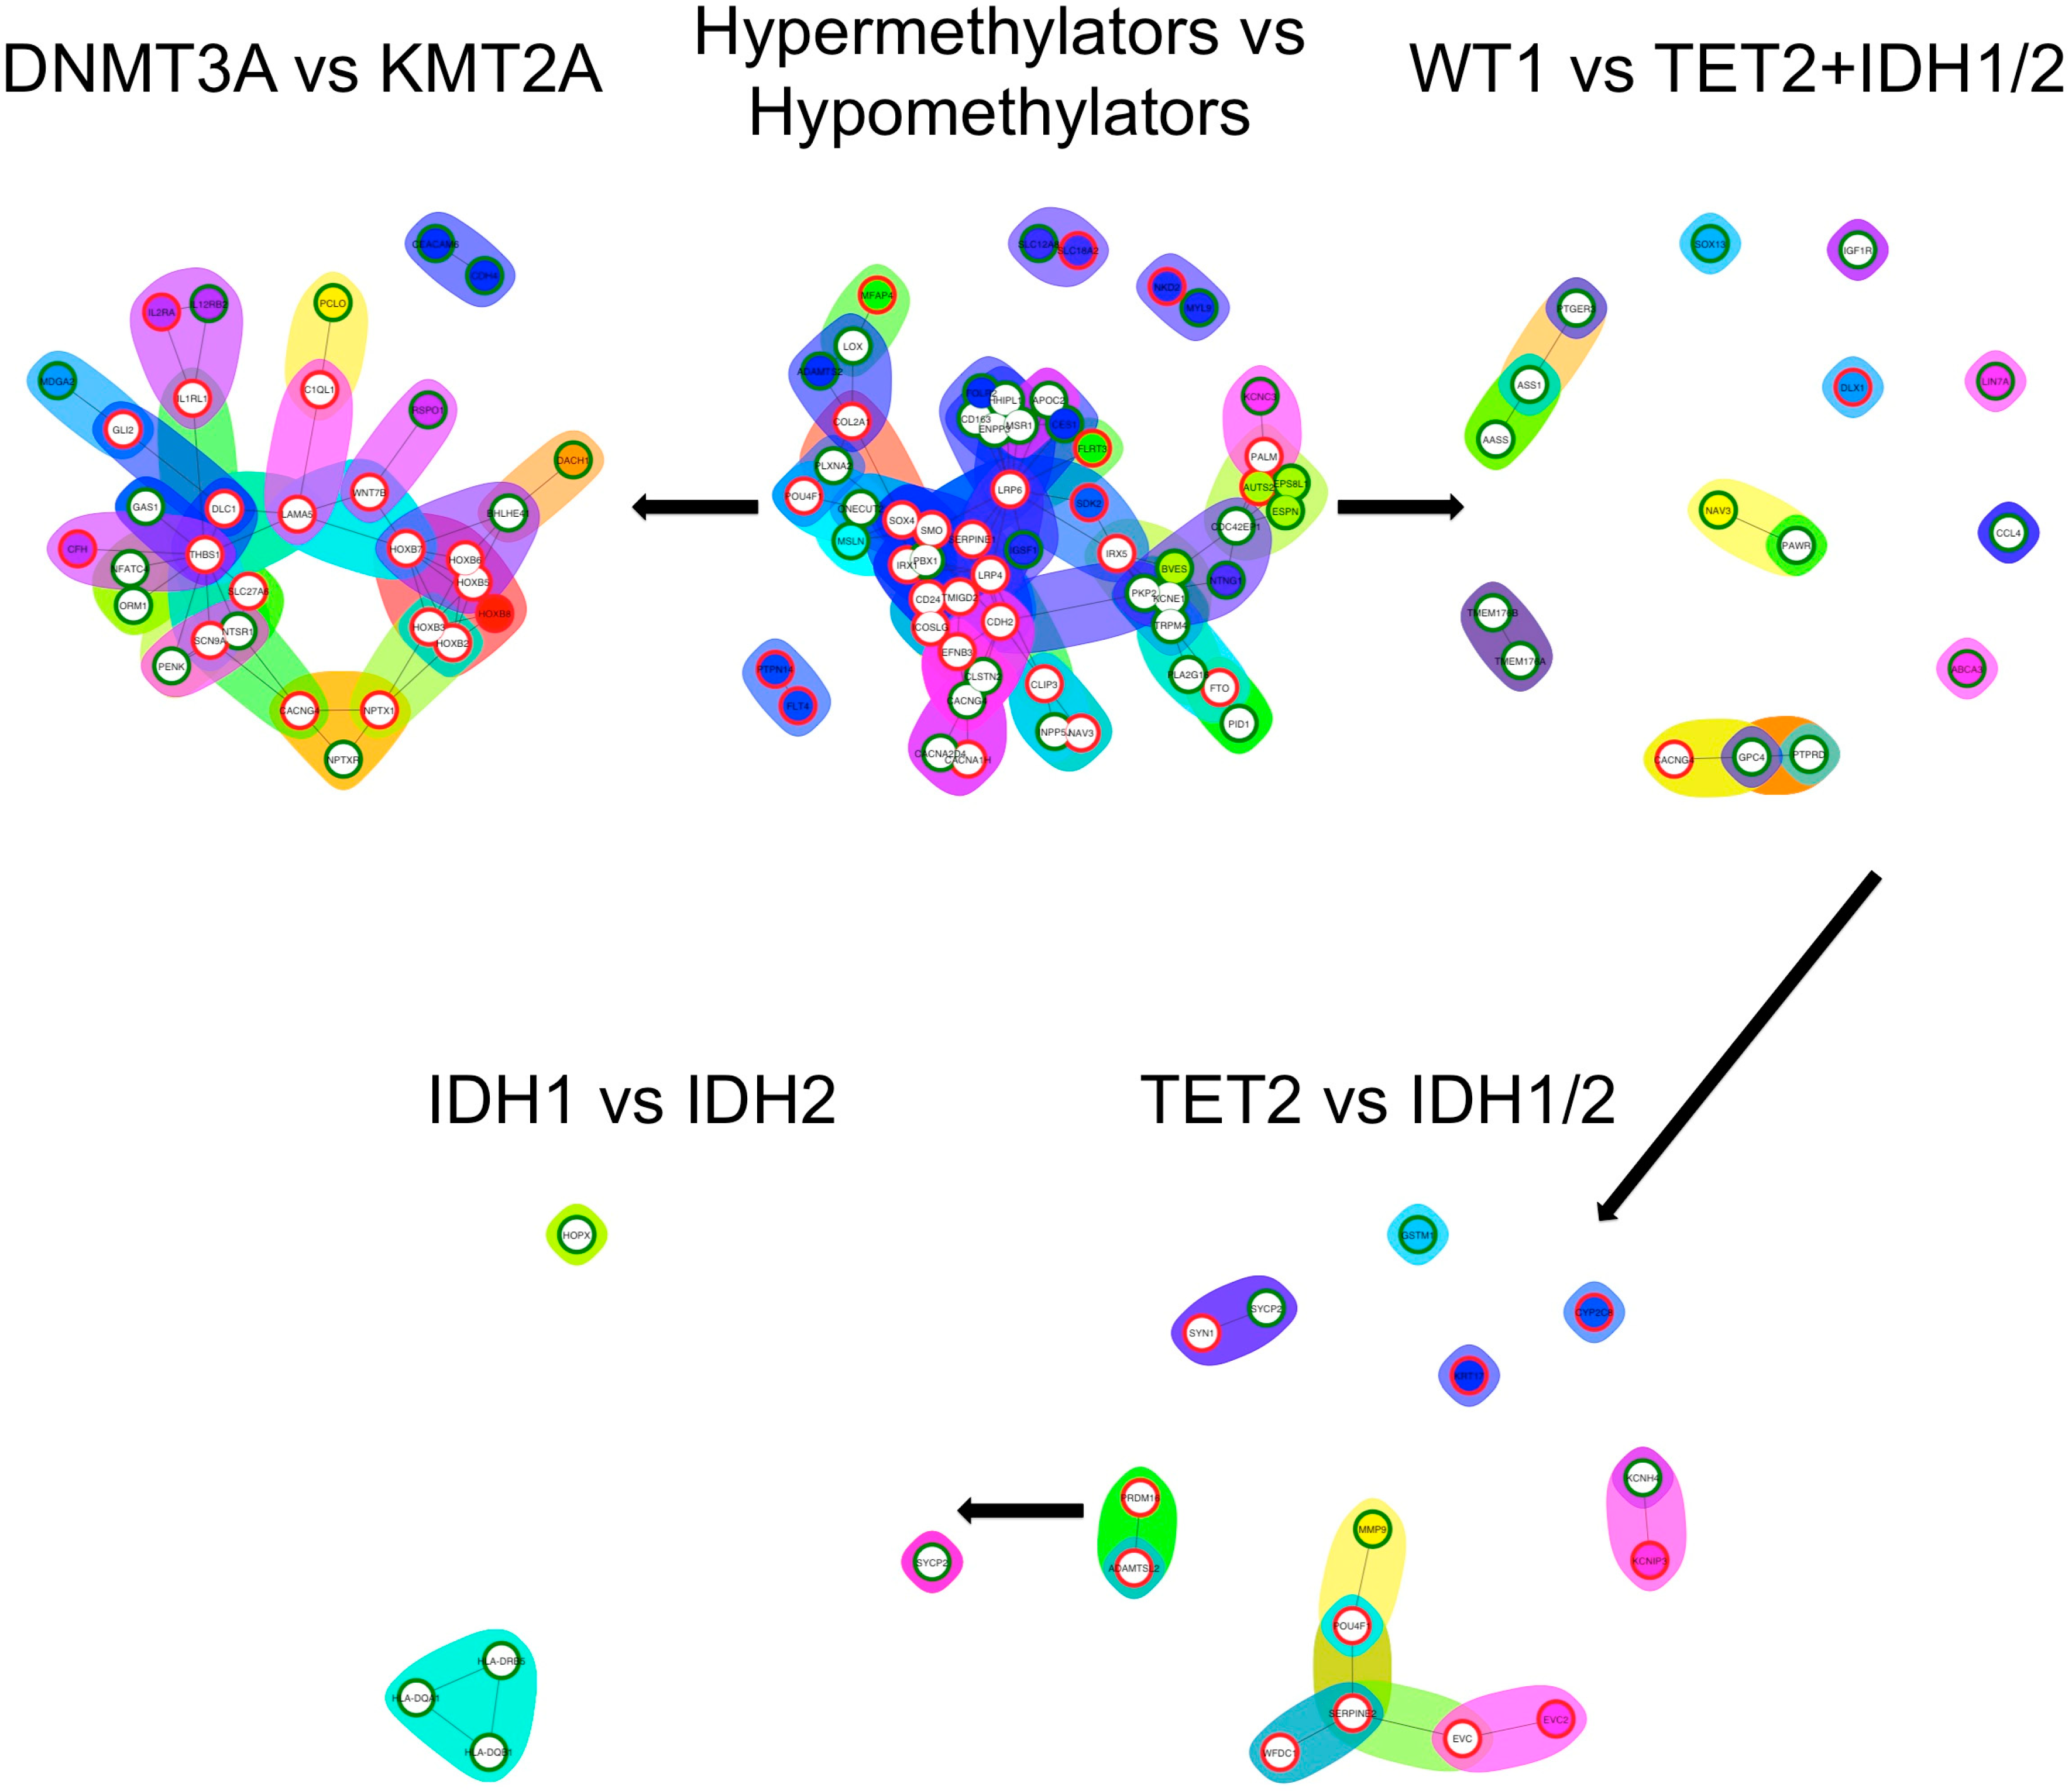
3.5. Differential Expression Analysis and Functional Enrichment Analysis

When comparing the hypermethylating with the hypomethylating group without setting a threshold, 484 genes were upregulated and 647 were downregulated. When the lfcThreshold was set, 89 genes were upregulated and 103 were downregulated. When the latter genes were analyzed with topGO, 213 processes were found to be different between the two groups. When comparing WT1 with TET2 + IDH1/2, we observed that without setting a threshold 15 genes were upregulated and 74 were downregulated. When the lfcThreshold was set, 3 genes were upregulated and 31 were downregulated. When the latter genes were analyzed with topGO, 43 processes were found to be different between the two groups.
When comparing TET2 with IDH1/2, we observed that without setting a threshold 74, genes were upregulated and 31 were downregulated. When the lfcThreshold was set, 34 genes were upregulated and 10 were downregulated. When the latter genes were analyzed with topGO, 40 processes were found to be different between the two groups. When comparing IDH1 with IDH2 without a threshold set, 5 genes were upregulated and 14 were downregulated. When the lfcThreshold was set, there were no genes upregulated and 5 were downregulated. When the latter genes were analyzed with topGO, 92 processes were found to be different between the two groups. The counterintuitive number of processes was caused by three differentially expressed HLA-D family genes. When comparing DNMT3A with KMT2A without a threshold, 90 genes were upregulated and 84 were downregulated. After setting the lfcThreshold, 40 genes were upregulated and 35 were downregulated. When the latter genes were analyzed with topGO, 157 processes were found to be different between the two groups.
On the functional networks generated, the network with most nodes and edges was generated by the DE genes between the hypermethylating and hypomethylating groups, followed by the comparison between DNMT3A and KMT2A. After them, the networks formed in the hypermethylating group had a clear drop in nodes and edges, giving another argument for the similarity between the genes selected for the hypermethylating group (Figure 4).

4. Discussion

In the current study, we have shown that mutations in TET2, IDH1/2, and WT1 present similar methylation, expression, and clinical profiles, making a case for these mutations to be clustered together in further AML classifications.
Both in the case of IDH1 R132 and of IDH2 R140 or R172, it has been shown that they switch IDH1/2 from generating α-keto-glutarate into generating D-2-hydroxyglutarate [15,33,34]. The generated metabolite, 2-hydroxiglutarate, has been shown to have an inhibitory effect on TET2, leading to similar effects to the loss of function that TET2 can present [35,36]. Other studies on IDH1/2 mutations have shown that these can induce an impaired differentiation in AML blasts, thus explaining the more frequent immature forms of AML that occur in the hypermethylating group [15,35,37].
WT1 mutations are generally represented by loss-of-function mutations [38]. It has been shown that truncated WT1 messenger RNA is degraded, thus reducing the amount of protein produced [39]. Because of the known interaction between WT1 and TET2, a reduction in WT1 would potentially reduce TET2 activity, a fact that could be observed indirectly in the current study [18].
In accordance with published data, we consider that a large amount of evidence shows the equivalence between TET2, IDH1/2, and WT1 mutations in AML, with similar global and gene-specific CpG methylation profiles between them and similar expression profiles.
Wild-type DNMT3A acts as a de novo DNA methyltransferase, and its mutations are generally associated with hypomethylation compared with the wild-type allele, especially in the case of R882 mutations [30]. Because DNMT3A mutations generally lead to an impaired function of DNMT3A leading to globally hypomethylated genome, it can be hypothesized that AML presenting DNMT3A mutations will have a different methylation and expression profile compared with the hypermethylating group. This hypothesis was confirmed in our study, as the hypomethylating and hypermethylating groups present different WHO-NOS subtypes, OS, CpG methylation, and expression profiles. An association of DNMT3A mutations with myelomonocytic or monoblastic/monocytic AML was previously observed and could potentially be used as an argument of the validity of these results [40].
KMT2A has different modes of action, the most prominent known so far being its role in methylating H3K4 [41]. Nevertheless, it has also been shown that KMT2A binds to unmethylated DNA and inhibits methylation [23]. Thus, the most common mutations observed in these gene, amplifications, should act as an inhibitor of CpG methylation [20,22,23,41,42,43]. Considering the results of this study, it cannot be suggested that mutations in KMT2A have a similar effect to those in DNMT3A, as the expression profile presents marked differences between the two gene mutations.
The presented mutations are mostly associated with intermediate cytogenetic risk [44], both in the literature and in our study. Thus, this classification can be better tailored in the future for patients with intermediate cytogenetics AML [17].
Because of the role that the included mutations have in modifying CpG methylation, it could be hypothesized that AML presenting different mutations will respond different to hypomethylating agents (HMA). The HMAs currently used in clinical practice outside clinical trials are azacytidine (AZA) and decitabine (DAC).
The AZA mechanism of action is based on DNA hypomethylation. Of the administered AZA, 10–20% is converted to 5-aza-2′-deoxycytidine triphosphate and then incorporated in the DNA strands [45]. Through the incorporation in DNA, it forms adducts between DNA and DNMT1. At high doses, the DNA strand is not able to recover, and apoptosis occurs, while at lower doses the adducts are degraded by the proteasome, and DNA synthesis is resumed in the absence of DNMT1, leading to hypomethylation [46]. The other approved hypomethylating agent is DAC, which has the same mechanism of action as AZA, but a part of the cellular metabolization is different when compared to AZA. Both compounds are considered equivalent and are referred to as HMAs.
For AML, HMA monotherapy was first used in patients over 65 years with palliative intent, with subsequent combinations being used in younger age groups [47]. Because of the mechanism of action, it was assumed that single-agent treatment would be heavily influenced by mutations that modify the DNA methylation profile, with TET2 receiving more attention compared to other genes involved in DNA methylation, but the studies did not reach a consensus. Currently, the clinical prognosis of patients treated with HMAs does not take into account TET2 or other equivalent mutations such as IDH1/2 or WT1 [48,49].
One of the more successful combinations for AML was represented by HMA plus venetoclax (VEN), the latter being a BCL2 inhibitor first used for relapse/refractory (R/R) chronic lymphocytic leukemia (CLL). Because of the impressive results that VEN generated for CLL, it was further tested for other hematologic malignancies, of which AML presented unexpectedly outstanding results [50,51]. It has been shown that HMA plus VEN increased the overall response rate (ORR) to 76% in R/R AML, and in subgroup analysis of IDH1/2 mutated AML, the ORR reached 82%, showing the importance of these mutations and their effect regarding the response to the HMA/VEN combination. In this case, the increase in ORR was mainly considered to be caused by the VEN component of the combination. Nonetheless, it should be considered whether the IDH1/2 mutations also influence the response to HMAs in this instance.
Even if the current study presented TET2, IDH1/2, and WT1 mutations as equivalent from some perspectives, it must be remembered that in some cases, these mutations might respond differently. One of the most notable examples of this is represented by the case of specific IDH1/2 inhibitors such as ivosidenib and enasidenib. Ivosidenib (IVO) is an inhibitor of IDH1 R132 that acts in synergy with AZA inducing myeloid blast differentiation [52,53], with promising results of this combination in the clinical scenario for relapsed/refractory (R/R) AML [54]. This synergy was also observed for the combination of HMA with the IDH2 inhibitor enasidenib (ENA), both decreasing the level of DNA methylation in vitro and promoting blast differentiation [53,55,56].
The major limitation of the current study was the small patient cohort. The reason for not including other databases was the fact that most other datasets on AML do not present can; thus, we would not be able to assess KMT2A amplifications. Nevertheless, the results shown in our study are in agreement with other publications, especially in the case of hypermethylating mutations.

5. Conclusions

The hypermethylation and hypomethylation groups described above were shown to be different from each other considering OS, methylation profile, expression profile, and clinical presentation. In this manuscript, we brought additional arguments for the similarity of the effect generated by TET2, IDH1/2, and WT1 mutations in AML patients. Thus, we hypothesized that hypermethylating mutations skew the AML cells to a similar phenotype with a possible sensitivity to hypermethylating agents, which should be further assessed clinically.

Author Contributions

All authors contributed to data analysis. S.P., C.T. (Cristina Turcas) and A.J. contributed to the manuscript writing. C.T. (Ciprian Tomuleasa) supervised the work. All authors have read and agreed to the published version of the manuscript.

Funding

Cristina Turcas was funded by an internal grant of the Iuliu Hatieganu University-School of Doctoral Studies (PCD 2019-2020). Ciprian Tomuleasa was supported by a National Research Grant awarded for Frontiers Research Projects (PN-III-P4-ID-PCCF-2016-112) awarded to the Babes Bolyai University in collaboration with the Ion Chiricuta Oncology Institute Cluj Napoca.

Acknowledgments

Sergiu Pasca, Cristina Turcas, and Ancuta Jurj contributed equally to the manuscript and are considered first authors.

Conflicts of Interest

The authors declare no conflict of interest.

References

  1. Khwaja, A.; Bjorkholm, M.; Gale, R.E.; Levine, R.L.; Jordan, C.T.; Ehninger, G.; Bloomfield, C.D.; Estey, E.; Burnett, A.; Cornelissen, J.J.; et al. Acute myeloid leukaemia. Nat. Rev. Dis. Primers 2016, 2, 16010. [Google Scholar] [CrossRef]
  2. Döhner, H.; Estey, E.; Grimwade, D.; Amadori, S.; Appelbaum, F.R.; Büchner, T.; Dombret, H.; Ebert, B.L.; Fenaux, P.; Larson, R.A.; et al. Diagnosis and management of AML in adults: 2017 ELN recommendations from an international expert panel. Blood 2017, 129, 424–447. [Google Scholar] [CrossRef] [Green Version]
  3. Basheer, F.; Giotopoulos, G.; Meduri, E.; Yun, H.; Mazan, M.; Sasca, D.; Gallipoli, P.; Marando, L.; Gozdecka, M.; Asby, R.; et al. Contrasting requirements during disease evolution identify EZH2 as a therapeutic target in AML. J. Exp. Med. 2019, 216, 966–981. [Google Scholar] [CrossRef] [PubMed] [Green Version]
  4. Arber, D.A.; Orazi, A.; Hasserjian, R.; Thiele, J.; Borowitz, M.J.; Le Beau, M.M.; Bloomfield, C.D.; Cazzola, M.; Vardiman, J.W. The 2016 revision to the World Health Organization classification of myeloid neoplasms and acute leukemia. Blood 2016, 127, 2391–2405. [Google Scholar] [CrossRef] [PubMed]
  5. Vardiman, J.W.; Thiele, J.; Arber, D.A.; Brunning, R.D.; Borowitz, M.J.; Porwit, A.; Harris, N.L.; Le Beau, M.M.; Hellström-Lindberg, E.; Tefferi, A.; et al. The 2008 revision of the World Health Organization (WHO) classification of myeloid neoplasms and acute leukemia: Rationale and important changes. Blood 2009, 114, 937–951. [Google Scholar] [CrossRef] [PubMed] [Green Version]
  6. Li, Z.-H.; Liu, Y.; Gao, S.-Y. Correlation between IL-7 genomic protein methylation level and acute myeloid leukemia. Eur. Rev. Med. Pharmacol. Sci. 2019, 23, 1196–1202. [Google Scholar] [CrossRef]
  7. Heath, E.M.; Chan, S.M.; Minden, M.D.; Murphy, T.; Shlush, L.I.; Schimmer, A.D. Biological and clinical consequences of NPM1 mutations in AML. Leukemia 2017, 31, 798–807. [Google Scholar] [CrossRef]
  8. Stengel, A.; Kern, W.; Meggendorfer, M.; Nadarajah, N.; Perglerovà, K.; Haferlach, T.; Haferlach, C. Number of RUNX1 mutations, wild-type allele loss and additional mutations impact on prognosis in adult RUNX1-mutated AML. Leukemia 2018, 32, 295–302. [Google Scholar] [CrossRef]
  9. Kelly, A.D.; Kroeger, H.; Yamazaki, J.; Taby, R.; Neumann, F.; Yu, S.; Lee, J.T.; Patel, B.; Li, Y.; He, R.; et al. A CpG island methylator phenotype in acute myeloid leukemia independent of IDH mutations and associated with a favorable outcome. Leukemia 2017, 31, 2011–2019. [Google Scholar] [CrossRef] [Green Version]
  10. Sellers, Z.P.; Bolkun, L.; Kloczko, J.; Wojtaszewska, M.L.; Lewandowski, K.; Moniuszko, M.; Ratajczak, M.Z.; Schneider, G. Increased methylation upstream of the MEG3 promotor is observed in acute myeloid leukemia patients with better overall survival. Clin. Epigenetics 2019, 11, 50. [Google Scholar] [CrossRef]
  11. Lavallée, V.-P.; Lemieux, S.; Boucher, G.; Gendron, P.; Boivin, I.; Armstrong, R.N.; Sauvageau, G.; Hébert, J. RNA-sequencing analysis of core binding factor AML identifies recurrent ZBTB7A mutations and defines RUNX1-CBFA2T3 fusion signature. Blood 2016, 127, 2498–2501. [Google Scholar] [CrossRef] [PubMed] [Green Version]
  12. Feng, Y.; Shen, Y.; Chen, H.; Wang, X.; Zhang, R.; Peng, Y.; Lei, X.; Liu, T.; Liu, J.; Gu, L.; et al. Expression profile analysis of long non-coding RNA in acute myeloid leukemia by microarray and bioinformatics. Cancer Sci. 2018, 109, 340–353. [Google Scholar] [CrossRef] [PubMed] [Green Version]
  13. Sandoval, J.E.; Huang, Y.-H.; Muise, A.; Goodell, M.A.; Reich, N.O. Mutations in the DNMT3A DNA methyltransferase in acute myeloid leukemia patients cause both loss and gain of function and differential regulation by protein partners. J. Biol. Chem. 2019, 294, 4898–4910. [Google Scholar] [CrossRef] [PubMed]
  14. Ohgami, R.S.; Ma, L.; Merker, J.D.; Gotlib, J.R.; Schrijver, I.; Zehnder, J.L.; Arber, D.A. Next-generation sequencing of acute myeloid leukemia identifies the significance of TP53, U2AF1, ASXL1, and TET2 mutations. Mod. Pathol. 2015, 28, 706–714. [Google Scholar] [CrossRef] [PubMed]
  15. Inoue, S.; Lemonnier, F.; Mak, T.W. Roles of IDH1/2 and TET2 mutations in myeloid disorders. Int. J. Hematol. 2016, 103, 627–633. [Google Scholar] [CrossRef] [Green Version]
  16. Petrova, L.; Vrbacky, F.; Lanska, M.; Zavrelova, A.; Zak, P.; Hrochova, K. IDH1 and IDH2 mutations in patients with acute myeloid leukemia: Suitable targets for minimal residual disease monitoring? Clin. Biochem. 2018, 61, 34–39. [Google Scholar] [CrossRef]
  17. Ley, T.J.; Ding, L.; Walter, M.J.; McLellan, M.D.; Lamprecht, T.; Larson, D.E.; Kandoth, C.; Payton, J.E.; Baty, J.; Welch, J.; et al. DNMT3A mutations in acute myeloid leukemia. N. Engl. J. Med. 2010, 363, 2424–2433. [Google Scholar] [CrossRef] [Green Version]
  18. Rampal, R.; Alkalin, A.; Madzo, J.; Vasanthakumar, A.; Pronier, E.; Patel, J.; Li, Y.; Ahn, J.; Abdel-Wahab, O.; Shih, A.; et al. DNA Hydroxymethylation Profiling Reveals that WT1 Mutations Result in Loss of TET2 Function in Acute Myeloid Leukemia. Cell Rep. 2014, 9, 1841–1855. [Google Scholar] [CrossRef]
  19. Patnaik, M.M.; Lasho, T.L.; Vijayvargiya, P.; Finke, C.M.; Hanson, C.A.; Ketterling, R.P.; Gangat, N.; Tefferi, A. Prognostic interaction between ASXL1 and TET2 mutations in chronic myelomonocytic leukemia. Blood Cancer J. 2016, 6, e385. [Google Scholar] [CrossRef] [Green Version]
  20. Huang, Y.-C.; Lin, S.-J.; Shih, H.-Y.; Chou, C.-H.; Chu, H.-H.; Chiu, C.-C.; Yuh, C.-H.; Yeh, T.-H.; Cheng, Y.-C. Epigenetic regulation of NOTCH1 and NOTCH3 by KMT2A inhibits glioma proliferation. Oncotarget 2017, 8, 63110–63120. [Google Scholar] [CrossRef] [Green Version]
  21. Bolouri, H.; Farrar, J.E.; Triche, T.; Ries, R.E.; Lim, E.L.; Alonzo, T.A.; Ma, Y.; Moore, R.; Mungall, A.J.; Marra, M.A.; et al. The molecular landscape of pediatric acute myeloid leukemia reveals recurrent structural alterations and age-specific mutational interactions. Nat. Med. 2018, 24, 103–112. [Google Scholar] [CrossRef] [PubMed] [Green Version]
  22. Winters, A.C.; Bernt, K.M. MLL-Rearranged Leukemias-An Update on Science and Clinical Approaches. Front. Pediatr. 2017, 5, 4. [Google Scholar] [CrossRef] [PubMed] [Green Version]
  23. Birke, M.; Schreiner, S.; García-Cuéllar, M.-P.; Mahr, K.; Titgemeyer, F.; Slany, R.K. The MT domain of the proto-oncoprotein MLL binds to CpG-containing DNA and discriminates against methylation. Nucleic Acids Res. 2002, 30, 958–965. [Google Scholar] [CrossRef] [PubMed] [Green Version]
  24. Cancer Genome Atlas Research Network; Ley, T.J.; Miller, C.; Ding, L.; Raphael, B.J.; Mungall, A.J.; Robertson, A.G.; Hoadley, K.; Triche, T.J.; Laird, P.W.; et al. Genomic and epigenomic landscapes of adult de novo acute myeloid leukemia. N. Engl. J. Med. 2013, 368, 2059–2074. [Google Scholar] [CrossRef] [Green Version]
  25. Cerami, E.; Gao, J.; Dogrusoz, U.; Gross, B.E.; Sumer, S.O.; Aksoy, B.A.; Jacobsen, A.; Byrne, C.J.; Heuer, M.L.; Larsson, E.; et al. The cBio cancer genomics portal: An open platform for exploring multidimensional cancer genomics data. Cancer Discov. 2012, 2, 401–404. [Google Scholar] [CrossRef] [Green Version]
  26. Gao, J.; Aksoy, B.A.; Dogrusoz, U.; Dresdner, G.; Gross, B.; Sumer, S.O.; Sun, Y.; Jacobsen, A.; Sinha, R.; Larsson, E.; et al. Integrative analysis of complex cancer genomics and clinical profiles using the cBioPortal. Sci. Signal. 2013, 6, pl1. [Google Scholar] [CrossRef] [Green Version]
  27. Love, M.I.; Huber, W.; Anders, S. Moderated estimation of fold change and dispersion for RNA-seq data with DESeq2. Genome Biol. 2014, 15, 550. [Google Scholar] [CrossRef] [Green Version]
  28. Aibar, S.; Fontanillo, C.; Droste, C.; De Las Rivas, J. Functional Gene Networks: R/Bioc package to generate and analyse gene networks derived from functional enrichment and clustering. Bioinformatics 2015, 31, 1686–1688. [Google Scholar] [CrossRef]
  29. Ashburner, M.; Ball, C.A.; Blake, J.A.; Botstein, D.; Butler, H.; Cherry, J.M.; Davis, A.P.; Dolinski, K.; Dwight, S.S.; Eppig, J.T.; et al. Gene ontology: Tool for the unification of biology. The Gene Ontology Consortium. Nat. Genet. 2000, 25, 25–29. [Google Scholar] [CrossRef] [Green Version]
  30. Bera, R.; Chiu, M.-C.; Huang, Y.-J.; Liang, D.-C.; Lee, Y.-S.; Shih, L.-Y. Genetic and Epigenetic Perturbations by DNMT3A-R882 Mutants Impaired Apoptosis through Augmentation of PRDX2 in Myeloid Leukemia Cells. Neoplasia 2018, 20, 1106–1120. [Google Scholar] [CrossRef]
  31. Mrózek, K.; Marcucci, G.; Paschka, P.; Whitman, S.P.; Bloomfield, C.D. Clinical relevance of mutations and gene-expression changes in adult acute myeloid leukemia with normal cytogenetics: Are we ready for a prognostically prioritized molecular classification? Blood 2007, 109, 431–448. [Google Scholar] [CrossRef] [PubMed]
  32. Liu, F.; Gong, M.; Gao, L.; Cai, X.; Zhang, H.; Ma, Y. RASSF1A hypermethylation is associated with ASXL1 mutation and indicates an adverse outcome in non-M3 acute myeloid leukemia. OncoTargets Ther. 2017, 10, 4143–4151. [Google Scholar] [CrossRef] [PubMed] [Green Version]
  33. Estey, E.; Döhner, H. Acute myeloid leukaemia. Lancet 2006, 368, 1894–1907. [Google Scholar] [CrossRef]
  34. Smeitink, J. Metabolism, gliomas, and IDH1. N. Engl. J. Med. 2010, 362, 1144–1145. [Google Scholar] [CrossRef] [PubMed] [Green Version]
  35. Figueroa, M.E.; Abdel-Wahab, O.; Lu, C.; Ward, P.S.; Patel, J.; Shih, A.; Li, Y.; Bhagwat, N.; Vasanthakumar, A.; Fernandez, H.F.; et al. Leukemic IDH1 and IDH2 Mutations Result in a Hypermethylation Phenotype, Disrupt TET2 Function, and Impair Hematopoietic Differentiation. Cancer Cell 2010, 18, 553–567. [Google Scholar] [CrossRef] [Green Version]
  36. Parsons, D.W.; Jones, S.; Zhang, X.; Lin, J.C.-H.; Leary, R.J.; Angenendt, P.; Mankoo, P.; Carter, H.; Siu, I.-M.; Gallia, G.L.; et al. An integrated genomic analysis of human glioblastoma multiforme. Science 2008, 321, 1807–1812. [Google Scholar] [CrossRef] [Green Version]
  37. Mardis, E.R.; Ding, L.; Dooling, D.J.; Larson, D.E.; McLellan, M.D.; Chen, K.; Koboldt, D.C.; Fulton, R.S.; Delehaunty, K.D.; McGrath, S.D.; et al. Recurring mutations found by sequencing an acute myeloid leukemia genome. N. Engl. J. Med. 2009, 361, 1058–1066. [Google Scholar] [CrossRef] [Green Version]
  38. Abbas, S.; Erpelinck-Verschueren, C.A.J.; Goudswaard, C.S.; Löwenberg, B.; Valk, P.J.M. Mutant Wilms’ tumor 1 (WT1) mRNA with premature termination codons in acute myeloid leukemia (AML) is sensitive to nonsense-mediated RNA decay (NMD). Leukemia 2010, 24, 660–663. [Google Scholar] [CrossRef] [Green Version]
  39. Miyagi, T.; Ahuja, H.; Kubota, T.; Kubonishi, I.; Koeffler, H.P.; Miyoshi, I. Expression of the candidate Wilm’s tumor gene, WT1, in human leukemia cells. Leukemia 1993, 7, 970–977. [Google Scholar]
  40. Yan, X.-J.; Xu, J.; Gu, Z.-H.; Pan, C.-M.; Lu, G.; Shen, Y.; Shi, J.-Y.; Zhu, Y.-M.; Tang, L.; Zhang, X.-W.; et al. Exome sequencing identifies somatic mutations of DNA methyltransferase gene DNMT3A in acute monocytic leukemia. Nat. Genet. 2011, 43, 309–315. [Google Scholar] [CrossRef]
  41. Cierpicki, T.; Risner, L.E.; Grembecka, J.; Lukasik, S.M.; Popovic, R.; Omonkowska, M.; Shultis, D.D.; Zeleznik-Le, N.J.; Bushweller, J.H. Structure of the MLL CXXC domain-DNA complex and its functional role in MLL-AF9 leukemia. Nat. Struct. Mol. Biol. 2010, 17, 62–68. [Google Scholar] [CrossRef] [PubMed] [Green Version]
  42. Erfurth, F.E.; Popovic, R.; Grembecka, J.; Cierpicki, T.; Theisler, C.; Xia, Z.-B.; Stuart, T.; Diaz, M.O.; Bushweller, J.H.; Zeleznik-Le, N.J. MLL protects CpG clusters from methylation within the Hoxa9 gene, maintaining transcript expression. Proc. Natl. Acad. Sci. USA 2008, 105, 7517–7522. [Google Scholar] [CrossRef] [PubMed] [Green Version]
  43. Mohan, M.; Lin, C.; Guest, E.; Shilatifard, A. Licensed to elongate: A molecular mechanism for MLL-based leukaemogenesis. Nat. Rev. Cancer 2010, 10, 721–728. [Google Scholar] [CrossRef] [PubMed]
  44. Lin, P.-H.; Li, H.-Y.; Fan, S.-C.; Yuan, T.-H.; Chen, M.; Hsu, Y.-H.; Yang, Y.-H.; Li, L.-Y.; Yeh, S.-P.; Bai, L.-Y.; et al. A targeted next-generation sequencing in the molecular risk stratification of adult acute myeloid leukemia: Implications for clinical practice. Cancer Med. 2017, 6, 349–360. [Google Scholar] [CrossRef]
  45. Sato, T.; Issa, J.-P.J.; Kropf, P. DNA Hypomethylating Drugs in Cancer Therapy. Cold Spring Harb. Perspect. Med. 2017, 7, a026948. [Google Scholar] [CrossRef] [Green Version]
  46. Derissen, E.J.B.; Beijnen, J.H.; Schellens, J.H.M. Concise Drug Review: Azacitidine and Decitabine. Oncologist 2013, 18, 619–624. [Google Scholar] [CrossRef] [Green Version]
  47. Müller-Tidow, C.; Tschanter, P.; Röllig, C.; Thiede, C.; Koschmieder, A.; Stelljes, M.; Koschmieder, S.; Dugas, M.; Gerss, J.; Study Alliance Leukemia Group; et al. Azacitidine in combination with intensive induction chemotherapy in older patients with acute myeloid leukemia: The AML-AZA trial of the study alliance leukemia. Leukemia 2016, 30, 555–561. [Google Scholar] [CrossRef]
  48. Garz, A.-K.; Wolf, S.; Grath, S.; Gaidzik, V.; Habringer, S.; Vick, B.; Rudelius, M.; Ziegenhain, C.; Herold, S.; Weickert, M.-T.; et al. Azacitidine combined with the selective FLT3 kinase inhibitor crenolanib disrupts stromal protection and inhibits expansion of residual leukemia-initiating cells in FLT3-ITD AML with concurrent epigenetic mutations. Oncotarget 2017, 8. [Google Scholar] [CrossRef] [Green Version]
  49. Döhner, H.; Dolnik, A.; Tang, L.; Seymour, J.F.; Minden, M.D.; Stone, R.M.; del Castillo, T.B.; Al-Ali, H.K.; Santini, V.; Vyas, P.; et al. Cytogenetics and gene mutations influence survival in older patients with acute myeloid leukemia treated with azacitidine or conventional care. Leukemia 2018, 32, 2546–2557. [Google Scholar] [CrossRef]
  50. Pollyea, D.A.; Stevens, B.M.; Jones, C.L.; Winters, A.; Pei, S.; Minhajuddin, M.; D’Alessandro, A.; Culp-Hill, R.; Riemondy, K.A.; Gillen, A.E.; et al. Venetoclax with azacitidine disrupts energy metabolism and targets leukemia stem cells in patients with acute myeloid leukemia. Nat. Med. 2018, 24, 1859–1866. [Google Scholar] [CrossRef]
  51. Konopleva, M.; Letai, A. BCL-2 inhibition in AML: An unexpected bonus? Blood 2018, 132, 1007–1012. [Google Scholar] [CrossRef] [PubMed] [Green Version]
  52. DiNardo, C.D.; Stein, E.M.; de Botton, S.; Roboz, G.J.; Altman, J.K.; Mims, A.S.; Swords, R.; Collins, R.H.; Mannis, G.N.; Pollyea, D.A.; et al. Durable Remissions with Ivosidenib in IDH1 -Mutated Relapsed or Refractory AML. N. Engl. J. Med. 2018, 378, 2386–2398. [Google Scholar] [CrossRef] [PubMed]
  53. Montalban-Bravo, G.; DiNardo, C.D. The role of IDH mutations in acute myeloid leukemia. Future Oncol. 2018, 14, 979–993. [Google Scholar] [CrossRef] [PubMed]
  54. Nassereddine, S.; Lap, C.J.; Tabbara, I.A. Evaluating ivosidenib for the treatment of relapsed/refractory AML: Design, development, and place in therapy. OncoTargets Ther. 2018, 12, 303–308. [Google Scholar] [CrossRef] [Green Version]
  55. Stein, E.M.; DiNardo, C.D.; Fathi, A.T.; Pollyea, D.A.; Stone, R.M.; Altman, J.K.; Roboz, G.J.; Patel, M.R.; Collins, R.; Flinn, I.W.; et al. Molecular remission and response patterns in patients with mutant-IDH2 acute myeloid leukemia treated with enasidenib. Blood 2019, 133, 676–687. [Google Scholar] [CrossRef] [Green Version]
  56. Paschka, P.; Schlenk, R.F.; Gaidzik, V.I.; Habdank, M.; Krönke, J.; Bullinger, L.; Späth, D.; Kayser, S.; Zucknick, M.; Götze, K.; et al. IDH1 and IDH2 Mutations Are Frequent Genetic Alterations in Acute Myeloid Leukemia and Confer Adverse Prognosis in Cytogenetically Normal Acute Myeloid Leukemia with NPM1 Mutation Without FLT3 Internal Tandem Duplication. JCO 2010, 28, 3636–3643. [Google Scholar] [CrossRef]
Figure 1. (A) Oncoprint representing patients before the mutual exclusivity condition was applied; (B) Oncoprint representing patients after the mutual exclusivity condition was applied.
Diagnostics 10 00263 g001
Figure 2. Kaplan-Meier curves showing the differences in overall survival (OS) and disease-free survival (DFS) between the hypermethylating and hypomethylating groups and in subgroup analysis between mutations.
Diagnostics 10 00263 g002
Figure 3. Heatmap and principal component analysis (PCA) representation of methylation and expression profiles. For methylation profile, the gene methylation score was used, while for expression profile, the transcript levels were used. The dendrograms show potential clustering (horizontal: between cases; vertical: between genes).
Diagnostics 10 00263 g003
Figure 4. Functional network representation of the differentially expressed genes between groups. The second group from the titles was always considered as the baseline. Upregulation was represented with red circles, while downregulation was represented with green circles.
Diagnostics 10 00263 g004
Table 1. Clinical differences between hypermethylators and hypomethylators (bold numbers are statistically significant data).
HypermethylatingHypomethylatingp Value
(n = 24)(n = 32)
SexFemale14 (58%)15 (47%)0.430
Male10 (42%)17 (53%)
Median age (quartile 1, quartile 3)61 (38, 67)58 (48, 66)0.684
WHO NOSAML with minimal maturation3 (13%)2 (6%)0.00271
AML without maturation10 (42%)4 (13%)
AML with maturation6 (25%)5 (16%)
Acute myelomonocytic leukemia5 (21%)9 (28%)
Acute monoblastic/monocytic leukemia0 (0%)11 (34%)
Acute megakaryocytoblastic leukemia0 (0%)1 (3%)
Median WBC (quartile 1, quartile 3) (/μL)16.95 (5.40, 60.33)42.70 (8.13, 91.20)0.224
Median bone marrow blast percentage (quartile 1, quartile 3)76 (59, 87)76 (57, 86)0.734
Median peripheral blood blast percentage (quartile 1, quartile 3)51 (17, 86)10 (4, 58)0.0048
Cytogenetic riskGood2 (8%)0 (0%)0.388
Intermediate20 (83%)27 (84%)
Poor1 (4%)4 (13%)
Not determined1 (4%)1 (3%)
Table 2. Clinical differences between different hypermethylating mutations (bold numbers are statistically significant data).
TET2IDH1IDH2WT1p Value
(n = 7)(n = 5)(n = 7)(n = 5)
GenderFemale5 (71%)2 (40%)5 (71%)2 (40%)0.525
Male2 (29%)3 (60%)2 (29%)3 (60%)
Median age (quartile 1, quartile 3)61 (49, 72)32 (27, 38)67 (62, 70)57 (53, 61)0.0118
WHO NOSAML with minimal maturation0 (0%)0 (0%)2 (29%)1 (20%)0.153
AML without maturation3 (43%)5 (100%)1 (14%)1 (20%)
AML with maturation3 (43%)0 (0%)2 (29%)1 (20%)
Acute myelomonocytic leukemia1 (14%)0 (0%)2 (29%)2 (40%)
Acute monoblastic/monocytic leukemia0 (0%)0 (0%)0 (0%)0 (0%)
Acute megakaryoblastic leukemia0 (0%)0 (0%)0 (0%)0 (0%)
Median WBC (quartile 1, quartile 3) (/μL)9.80 (3.95, 30.75)39.80 (8.20, 63.70)11.50 (3.80, 38.40)27.70 (27.10, 61.60)0.339
Median bone marrow blast percentage (quartile 1, quartile 3)63 (51, 86)86 (85, 91)72 (57, 81)72 (61, 86)0.255
Median peripheral blood blast percentage (quartile 1, quartile 3)32 (15, 60)85 (83, 88)43 (14, 68)52 (49, 63)0.164
Cytogenetic riskGood1 (14%)0 (0%)0 (0%)1 (20%)0.7187
Intermediate6 (84%)4 (80%)6 (84%)4 (80%)
Poor0 (0%)0 (0%)1 (14%)0 (0%)
Not determined0 (0%)1 (20%)0 (0%)0 (0%)
Table 3. Clinical differences between the hypomethylating mutations.
DNMT3AKMT2Ap Value
(n = 23)(n = 9)
GenderFemale13 (57%)2 (22%)0.122
Male10 (43%)7 (78%)
Median age (quartile 1, quartile 3)58 (50, 71)54 (45, 64)0.571
WHO NOSAML with minimal maturation0 (0%)2 (22%)
AML without maturation4 (17%)0 (0%)
AML with maturation4 (17%)1 (11%)
Acute myelomonocytic leukemia6 (26%)3 (33%)
Acute monoblastic/monocytic leukemia8 (35%)3 (33%)
Acute megakaryoblastic leukemia1 (4%)0 (0%)
Median WBC (quartile 1, quartile 3) (/μL)75.20 (15.15, 98.70)8.40 (2.30, 25.90)0.00497
Median bone marrow blast percentage (quartile 1, quartile 3)76 (55, 86)75 (67, 83)0.949
Median peripheral blood blast percentage (quartile 1, quartile 3)11 (6, 76)0 (0, 14)0.0477
Cytogenetic riskGood0 (0%)0 (0%)0.0572
Intermediate21 (91%)6 (66%)
Poor1 (4%)3 (33%)
Not determined1 (4%)0 (0%)

