Accurate Diagnosis of Suicide Ideation/Behavior Using Robust Ensemble Machine Learning: A University Student Population in the Middle East and North Africa (MENA) Region

 ,
, 
 and
and
Abstract
1. Introduction
2. Materials and Methods
2.1. Sample Size Calculation and Sampling
2.2. PTSD Checklist (PCL-5)
2.3. Post-Traumatic Growth Inventory (PTGI)
2.4. Patient Health Questionnaire (PHQ-9)
2.5. Multidimensional Scale of Perceived Social Support (MSPSS)
2.6. Positive Mental Health Scale (PMH)
2.7. Suicide Behaviors Questionnaire-Revised (SBQ-R)
2.8. Ethical Considerations
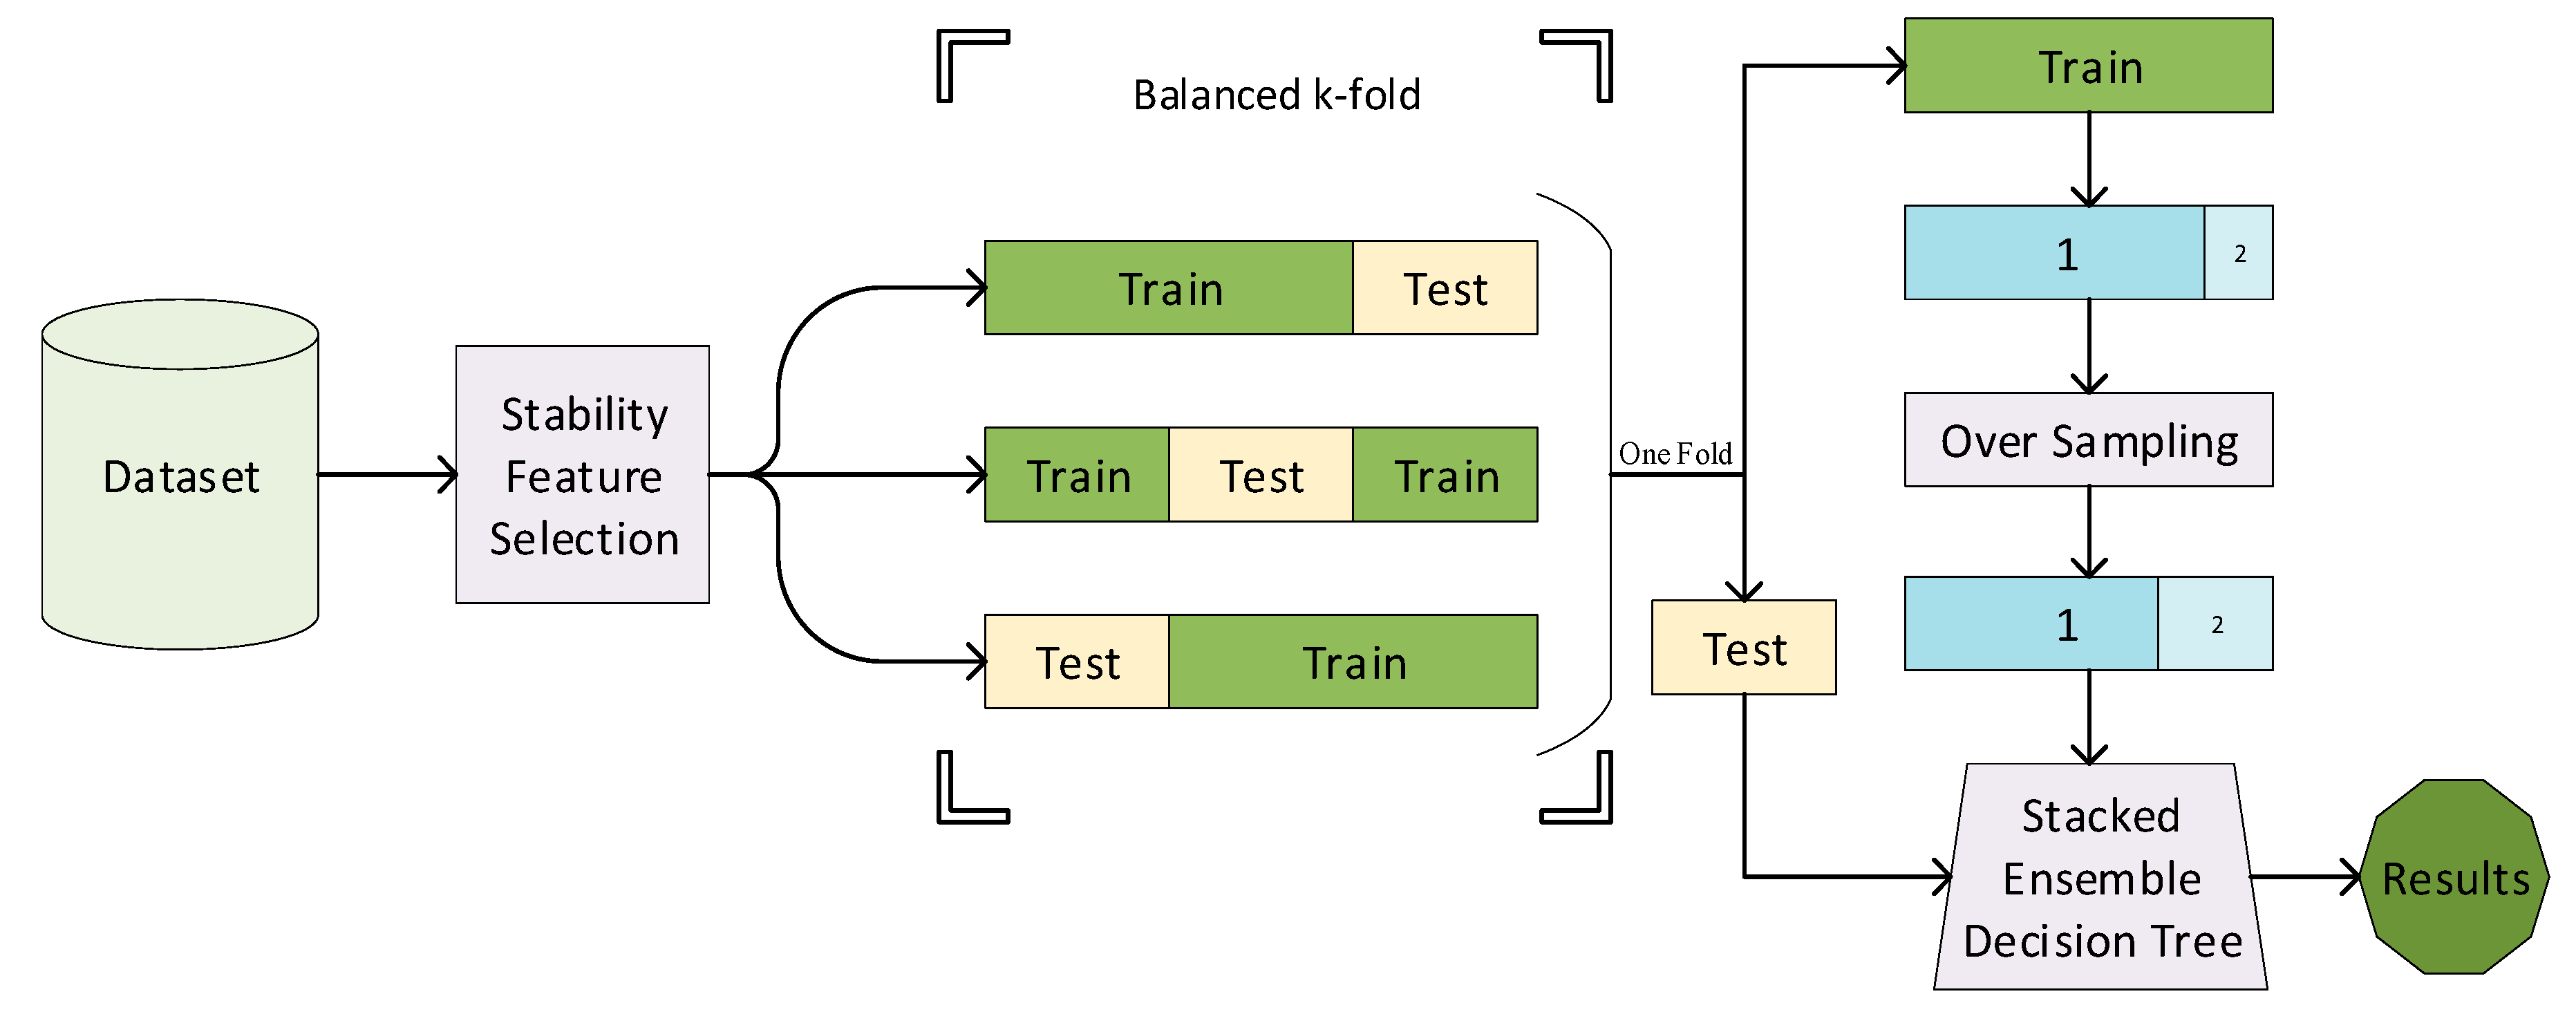
2.9. Methods
2.10. Validation
3. Results
4. Discussion
4.1. Limitations and Strength
4.2. Implications
5. Conclusions
Author Contributions
Funding
Acknowledgments
Conflicts of Interest
Appendix A

| Total (N = 573) | (L.R) N = 430 | (H.R) N = 143 | p-Value 1 | |
|---|---|---|---|---|
| Fathers’ job | Unemployed | 20 (4.7%) | 3 (2.1%) | 0.047 |
| Employed | 87 (20.2%) | 36 (25.2%) | ||
| Self-employed | 174 (40.5%) | 60 (42%) | ||
| Retired | 149 (34.7%) | 44 (30.8%) | ||
| Mothers’ job | Housewife | 334 (77.7%) | 98 (68.5%) | 0.023 |
| Employed | 48 (11.2%) | 26 (18.2%) | ||
| Self-employed | 20 (4.7%) | 4 (2.8%) | ||
| Retired | 28 (6.5%) | 15 (10.5%) | ||
| Economic status | Weak | 25 (5.8%) | 3 (2.1%) | 0.268 |
| Middle | 227 (52.8%) | 78 (54.5%) | ||
| Good | 168 (39.1%) | 61 (42.7%) | ||
| Excellent | 10 (2.3%) | 1 (0.7%) | ||
| Accommodation | with family | 341 (79.3%) | 106 (74.1%) | 0.195 |
| dormitory | 89 (20.7%) | 37 (25.9%) | ||
| History of physical illness | None | 364 (84.7%) | 105 (73.4%) | 0.003 |
| High blood pressure | 2 (0.5%) | - | ||
| Cardiovascular | 3 (0.7%) | 7 (4.9%) | ||
| Musculoskeletal | 9 (2.1%) | 4 (2.8%) | ||
| Digestive | 26 (6%) | 7 (4.9%) | ||
| Diabetes | 1 (0.2%) | 3 (2.1%) | ||
| Hashimoto | 2 (0.5%) | - | ||
| Hepatitis B | 1 (0.2%) | - | ||
| Respiratory | 5 (1.2%) | - | ||
| Kidney | 1 (0.2%) | 2 (1.4%) | ||
| Migraine | 1 (0.2%) | 3 (2.1%) | ||
| Obesity | 1 (0.2%) | 1 (0.7%) | ||
| Minor Thalassemia | 2 (0.5%) | 2 (1.4%) | ||
| Fauvism | - | 1 (0.7%) | ||
| Visual impairment | 1 (0.2%) | 2 (1.4%) | ||
| Epilepsy | 4 (0.9%) | - | ||
| Skin problem | 1 (0.2%) | - | ||
| Cancer | 3 (0.7%) | 3 (2.1%) | ||
| Polycystic ovary syndrome | 2 (0.5%) | 3 (2.1%) | ||
| Genital issues | 1 (0.2%) | - | ||
| History of using psychological medicine (Yes, %) | 31 (7.2%) | 27 (18.9%) | <0.001 | |
| History of using drugs, smoking, and alcohol (Yes, %) | 35 (8.1%) | 26 (18.2%) | 0.001 | |
| Types of trauma (Yes, %) | Sudden loss | 154 (35.8%) | 49 (34.3%) | 0.7373 |
| Serious ill diagnosis | 85 (19.8%) | 29 (20.3%) | 0.865 | |
| Road accident | 48 (11.2%) | 10 (7%) | 0.158 | |
| Earthquake | 8 (1.9%) | 9 (6.3%) | 0.007 | |
| Loss of romantic relationship | 105 (24.4%) | 62 (43.4%) | <0.001 | |
| Loss of important things | 30 (7%) | 9 (6.3%) | 0.774 | |
| Suicide | 14 (3.3%) | 5 (3.5%) | 0.889 | |
| Flood | 2 (0.5%) | 2 (1.4%) | 0.557 | |
| Sexual abuse | 23 (5.3%) | 20 (14%) | 0.001 | |
| Homicide | 2 (0.5%) | 1 (0.7%) | 1.000 | |
| Attack and violent | 10 (2.3%) | 11 (7.7%) | 0.003 | |
| Death treated | 3 (0.7%) | 2 (1.4%) | 0.026 | |
| Fire and explosion | 4 (9%) | 2 (1.4%) | 1.000 | |
| War and terror | 6 (1.4%) | - | 0.156 | |
| Air accident | 2 (0.5%) | 1 (0.7%) | 1.000 | |
| How to experience trauma | It happened to me directly. | 177 (41.2%) | 95 (66.4%) | <0.001 |
| I witnessed it. | 105 (24.4%) | 20 (14%) | ||
| It happened to a close person. | 56 (13%) | 8 (5.6%) | ||
| I was exposed to it as part of my job. | - | 1 (0.7%) | ||
| Q | Not at All | A Little Bit | Middle | Quite a Bit | Extremely | p-Value 1 | |||||
|---|---|---|---|---|---|---|---|---|---|---|---|
| L.R | H.R | L.R | H.R | L.R | H.R | L.R | H.R | L.R | H.R | ||
| 1 | 52 (12.1%) | 13 (9.1%) | 129 (30%) | 25 (17.5%) | 107 (24.9%) | 31 (21.7%) | 97 (22.6%) | 35 (24.5%) | 44 (10.2%) | 39 (27.3%) | <0.001 |
| 2 | 124 (28.8%) | 29 (20.3%) | 119 (27.7%) | 30 (21%) | 92 (21.4) | 30 (21%) | 66 (15.3%) | 30 (21%) | 29 (6.7%) | 24 (16.8%) | <0.001 |
| 3 | 170 (39.5%) | 29 (20.3%) | 102 (23.7%) | 28 (19.6%) | 84 (19.5%) | 26 (18.2%) | 48 (11.2%) | 35 (24.5%) | 25 (5.8%) | 25 (17.5%) | <0.001 |
| 4 | 97 (22.6%) | 17 (11.9%) | 115 (26.7%) | 12 (8.4%) | 106 (24.7%) | 27 (18.9%) | 78 (18.1) | 50 (35%) | 33 (7.7%) | 37 (25.9%) | <0.001 |
| 5 | 198 (46%) | 33 (23.1%) | 110 (25.6%) | 27 (18.9%) | 66 (15.3%) | 36 (25.2%) | 39 (9.1%) | 28 (19.6%) | 16 (3.7%) | 19 (13.3%) | <0.001 |
| 6 | 104 (24.2%) | 19 (13.3%) | 107 (24.9%) | 32 (22.4%) | 117 (27.2%) | 35 (24.5%) | 63 (14.7%) | 34 (23.8%) | 39 (9.1%) | 23 (16.1%) | <0.001 |
| 7 | 127 (29.5%) | 26 (18.2%) | 99 (33%) | 30 (21%) | 108 (25.1%) | 30 (21%) | 63 (14.7%) | 37 (25.9%) | 33 (7.7%) | 20 (14%) | <0.001 |
| 8 | 229 (53.3%) | 64 (44.8%) | 107 (24.9%) | 38 (26.6%) | 58 (13.5%) | 25 (17.5%) | 24 (5.6%) | 12 (8.4%) | 12 (2.8%) | 4 (2.8%) | 0.056 |
| 9 | 157 (36.5%) | 18 (12.6) | 94 (21.9%) | 22 (15.4%) | 86 (20%) | 22 (15.4%) | 58 (13.5%) | 33 (23.1%) | 34 (7.9%) | 48 (38.6%) | <0.001 |
| 10 | 127 (29.5%) | 19 (13.3%) | 99 (23%) | 19 (13.3%) | 93 (21.6%) | 22 (15.4%) | 74 (17.2%) | 37 (25.9%) | 36 (8.4%) | 46 (32.2%) | <0.001 |
| 11 | 126 (29.3%) | 16 (11.2%) | 119 (27.7%) | 24 (16.8%) | 82 (19.1%) | 16 (11.2%) | 69 (16%) | 42 (29.4%) | 33 (7.7%) | 45 (315%) | <0.001 |
| 12 | 153 (35.6%) | 24 (16.8%) | 107 (24.9%) | 18 (12.6%) | 78 (18.1%) | 37 (25.9%) | 61 (14.2%) | 33 (23.1%) | 30 (7%) | 31 (21.7%) | <0.001 |
| 13 | 200 (46.5%) | 34 (23.8%) | 106 (24.7%) | 33 (23.1%) | 69 (16%) | 27 (18.9%) | 45 (10.5%) | 33 (23.1%) | 10 (2.3%) | 16 (11.2%) | <0.001 |
| 14 | 188 (43.7%) | 29 (20.3%) | 109 (25.3%) | 27 (18.9%) | 80 (18.6%) | 23 (16.1%) | 41 (9.5%) | 32 (22.4%) | 12 (2.8%) | 32 (22.4%) | <0.001 |
| 15 | 185 (43%) | 28 (19.6%) | 122 (28.4%) | 25 (17.5%) | 69 (16%) | 32 (22.4%) | 39 (9.1%) | 33 (23.1%) | 15 (3.5%) | 25 (17.5%) | <0.001 |
| 16 | 285 (66.3%) | 61 (42.7%) | 87 (20.2%) | 31 (21.7%) | 40 (9.3%) | 24 (16.8%) | 14 (3.3%) | 18 (12.6%) | 4 (0.9%) | 9 (6.3%) | <0.001 |
| 17 | 145 (33.7%) | 34 (23.8%) | 133 (30.9%) | 21 (14.7%) | 83 (19.3%) | 37 (25.9%) | 44 (10.2%) | 32 (22.4%) | 25 (5.8%) | 19 (13.3%) | <0.001 |
| 18 | 201 (46.7%) | 44 (30.8) | 123 (28.6%) | 31 (21.7%) | 55 (12.8%) | 30 (21%) | 37 (8.6%) | 21 (14.7%) | 14 (3.3%) | 17 (11.9%) | <0.001 |
| 19 | 116 (27%) | 18 (12.6%) | 128 (29.8%) | 22 (15.4%) | 82 (19.1%) | 35 (24.5%) | 66 (15.3%) | 41 (28.7%) | 37 (8.6%) | 27 (18.9%) | <0.001 |
| 20 | 165 (38.4%) | 33 (22.4%) | 113 (26.3%) | 33 (22.4%) | 69 (16%) | 23 (16.1%) | 48 (11.2%) | 21 (14.7%) | 35 (8.1%) | 35 (24.5%) | <0.001 |
| Q | Not at All | A Little Bit | A Little | Middle | Quite a Bit | Extremely | p-Value 1 | ||||||
|---|---|---|---|---|---|---|---|---|---|---|---|---|---|
| L.R | H.R | L.R | H.R | L.R | H.R | L.R | H.R | L.R | H.R | L.R | H.R | ||
| 1 | 56 (13%) | 23 (16.1%) | 82 (19.1%) | 14 (9.8%) | 80 (18.6%) | 22 (15.4%) | 123 (28.6%) | 41 (28.7%) | 60 (14%) | 25 (17.5%) | 28 (6.5%) | 18 (12.6%) | 0.044 |
| 2 | 10 (2.3%) | 25 (17.5%) | 34 (7.9%) | 22 (15.4%) | 45 (10.5%) | 29 (20.3%) | 95 (22.1%) | 28 (19.6%) | 127 (29.5%) | 27 (18.9%) | 119 (27.7%) | 12 (8.4%) | <0.001 |
| 3 | 34 (7.9%) | 18 (12.6%) | 42 (9.8%) | 27 (18.9%) | 62 (14.4%) | 24 (16.8%) | 128 (29.8%) | 36 (25.2%) | 92 (21.4%) | 25 (17.5%) | 72 (16.7%) | 13 (9.1%) | <0.001 |
| 4 | 44 (10.2%) | 36 (25.2%) | 49 (11.4%) | 31 (21.7%) | 77 (17.9%) | 30 (21%) | 108 (25.1%) | 24 (16.8%) | 101 (23.5%) | 11(.7%) | 50 (11.6%) | 11 (7.7%) | <0.001 |
| 5 | 47 (10.9%) | 44 (30.8%) | 49 (11.4%) | 21 (14.7%) | 76 (17.7%) | 20 (14%) | 94 (21.9%) | 21 (14.7%) | 69 (16%) | 21 (14.7%) | 95 (22.1%) | 16 (11.2%) | <0.001 |
| 6 | 50 (11.6%) | 41 (28.7%) | 78 (18.1%) | 39 (27.3%) | 97 (22.6%) | 21 (14.7%) | 101 (23.5%) | 22 (15.4%) | 67 (15.6%) | 16 (11.2%) | 58 (13.5%) | 14 (9.8%) | <0.001 |
| 7 | 28 (6.5%) | 19 (3.3%) | 38 (8.8%) | 31 (21.7%) | 81 (18.8%) | 28 (19.6%) | 132 (30.7%) | 30 (21%) | 93 (21.6%) | 21 (14.7%) | 37 (8.6%) | 5 (3.5%) | <0.001 |
| 8 | 58 (13.5%) | 45 (31.5%) | 86 (20%) | 29 (20.3%) | 96 (22.3%) | 39 (27.3%) | 105 (24.4%) | 17 (11.9%) | 48 (11.2%) | 8 (5.6%) | 47 (10.9%) | 8 (5.6%) | <0.001 |
| 9 | 51 (11.9%) | 43 (30.1%) | 88 (20.5%) | 31 (21.7%) | 84 (19.5%) | 22 (15.4%) | 87 (20.2%) | 19 (13.3%) | 72 (16.7%) | 20 (14%) | 47 (10.9%) | 8 (5.6%) | <0.001 |
| 10 | 16 (3.7%) | 10 (7%) | 34 (7.9%) | 21 (14.7%) | 62 (14.4%) | 32 (22.4%) | 109 (25.3%) | 42 (29.4%) | 132 (30.7%) | 23 (16.1%) | 77 (17.9%) | 15 (10.5%) | <0.001 |
| 11 | 19 (4.4%) | 21 (14.7%) | 46 (10.7%) | 31 (21.7%) | 71 (16.5%) | 29 (20.3%) | 118 (27.4%) | 34 (23.8%) | 100 (23.3%) | 13 (9.1%) | 76 (17.7%) | 15 (10.5%) | <0.001 |
| 12 | 14 (3.3%) | 10 (7%) | 28 (6.5%) | 16 (11.2%) | 53 (12.3%) | 27 (18.9%) | 130 (30.2%) | 41 (28.7%) | 122 (28.4%) | 29 (20.3%) | 82 (19.1%) | 20 (14%) | 0.001 |
| 13 | 19 (4.4%) | 26 (18.2%) | 29 (6.7%) | 25 (17.5%) | 52 (12.1%) | 34 (23.8%) | 121 (28.1%) | 24 (16.8%) | 108 (25.1%) | 17 (11.9%) | 100 (23.3%) | 17 (11.9%) | <0.001 |
| 14 | 33 (7.7%) | 20 (14%) | 39 (9.1%) | 30 (21%) | 66 (15.3%) | 29 (20.3%) | 113 (26.3%) | 28 (19.6%) | 101 (23.5%) | 21 (14.7%) | 78 (18.1%) | 15 (10.5%) | <0.001 |
| 15 | 14 (3.3%) | 12 (8.4%) | 30 (7%) | 19 (13.3%) | 62 (14.4%) | 22 (15.4%) | 98 (22.8%) | 27 (18.9%) | 128 (29.8%) | 36 (25.2%) | 98 (22.8%) | 27 (18.9%) | 0.009 |
| 16 | 29 (6.7%) | 25 (17.5%) | 33 (7.7%) | 27 (18.5%) | 77 (17.9%) | 24 (16.8%) | 122 (28.4%) | 28 (19.6%) | 93 (21.6%) | 24 (16.8%) | 76 (17.7%) | 15 (10.5%) | <0.001 |
| 17 | 19 (4.4%) | 15 (10.5%) | 39 (9.1%) | 23 (16.1%) | 57 (13.3%) | 29 (20.3%) | 119 (27.7%) | 32 (22.4%) | 126 (29.3%) | 33 (23.1%) | 69 (16%) | 11 (7.7%) | <0.001 |
| 18 | 77 (17.9%) | 58 (40.6%) | 76 (17.7%) | 24 (16.8%) | 57 (13.3%) | 21 (14.7%) | 82 (19.1%) | 15 (10.5%) | 74 (17.2%) | 13 (9.1%) | 64 (14.9%) | 12 (8.4%) | <0.001 |
| 19 | 22 (5.1%) | 18 (12.6%) | 28 (6.5%) | 20 (14%) | 52 (12.1%) | 23 (16.1%) | 100 (23.3%) | 28 (19.6%) | 133 (30.9%) | 29 (20.3%) | 95 (22.1%) | 25 (17.5%) | <0.001 |
| 20 | 40 (9.3%) | 28 (19.6%) | 29 (6.7%) | 14 (9.8%) | 57 (13.3%) | 18 (12.6%) | 94 (21.9%) | 28 (19.6%) | 102 (23.7%) | 330 (21%) | 107 (24.9%) | 25 (17.5%) | 0.002 |
| 21 | 18 (4.2%) | 14 (9.8%) | 28 (6.5%) | 17 (11.9%) | 40 (9.3%) | 19 (13.3%) | 96 (22.3%) | 28 (19.6%) | 112 (26%) | 30 (21%) | 136 (31.6%) | 35 (24.5%) | 0.002 |
| Q | Very Strongly Disagree | Strongly Disagree | Mildly Disagree | Neutral | Mildly Agree | Strongly Agree | Very Strongly Agree | p-Value 1 | |||||||
|---|---|---|---|---|---|---|---|---|---|---|---|---|---|---|---|
| L.R | H.R | L.R | H.R | L.R | H.R | L.R | H.R | L.R | H.R | L.R | H.R | L.R | H.R | ||
| 1 | 26 (6%) | 18 (12.6%) | 34 (7.9%) | 20 (14%) | 40 (9.3%) | 16 (11.2%) | 66 (15.3%) | 16 (11.2%) | 85 (19.85%) | 25 (17.5%) | 76 (17.7%) | 30 (21%) | 103 (24%) | 18 (12.6%) | 0.001 |
| 2 | 30 (7%) | 25 (17.5%) | 22 (5.1%) | 13 (9.1%) | 29 (6.7%) | 14 (9.8%) | 50 (11.6%) | 11 (7.7%) | 81 (18.8%) | 19 (13.3%) | 89 (20.7%) | 33 (23.1%) | 129 (30%) | 28 (19.6%) | 0.001 |
| 3 | 12 (2.8%) | 12 (8.4%) | 12 (2.8%) | 14 (9.8%) | 25 (5.8%) | 15 (10.5%) | 53 (12.3%) | 19 (13.3%) | 79 (18.4%) | 17 (18.9%) | 80 (18.6%) | 30 (21%) | 168 (39.1%) | 26 (18.2%) | <0.001 |
| 4 | 15 (3.5%) | 17 (11.9%) | 22 (5.1%) | 15 (10.5%) | 31 (7.2%) | 13 (9.1%) | 45 (10.5%) | 20 (14%) | 73 (17%) | 28 (19.6%) | 102 (23.7%) | 30 (21%) | 142 (33%) | 20 (14%) | <0.001 |
| 5 | 35 (8.1%) | 34 (23.8%) | 24 (5.6%) | 16 (11.2%) | 31 (7.2%) | 14 (9.8%) | 51 (11.9%) | 9 (6.3%) | 63 (14.7%) | 18 (12.6%) | 64 (14.9%) | 18 (12.6%) | 162 (37.7%) | 34 (23.8%) | <0.001 |
| 6 | 35 (8.1%) | 15 (10.5%) | 39 (9.1%) | 20 (14%) | 47 (10.9%) | 32 (22.4%) | 86 (20%) | 15 (10.5%) | 81 (18.8%) | 27 (18.9%) | 67 (15.6%) | 14 (9.8%) | 74 (17.2%) | 20 (14%) | 0.005 |
| 7 | 45 (10.5%) | 28 (19.6%) | 46 (10.7%) | 27 (18.9%) | 55 (12.8%) | 20 (14%) | 81 (18.8%) | 14 (9.8%) | 89 (20.7%) | 26 (18.2%) | 62 (14.4%) | 13 (19.1%) | 52 (12.1%) | 15 (10.5%) | 0.001 |
| 8 | 37 (8.6%) | 30 (21%) | 45 (10.5%) | 30 (21%) | 39 (9.1%) | 20 (14%) | 61 (14.2%) | 17 (11.9%) | 93 (21.6%) | 26 (18.2%) | 74 (17.2%) | 13 (9.1%) | 81 (18.8%) | 7 (4.9%) | <0.001 |
| 9 | 35 (8.1%) | 18 (12.6%) | 34 (7.9%) | 24 (16.8%) | 36 (8.4%) | 19 (13.3%) | 67 (15.6%) | 15 (10.5%) | 80 (18.6%) | 27 (18.9%) | 85 (19.8%) | 17 (11.9%) | 93 (21.6%) | 23 (16.1%) | <0.001 |
| 10 | 22 (5.1%) | 17 (11.9%) | 18 (4.2%) | 18 (12.6%) | 25 (5.8%) | 11 (7.7%) | 52 (12.1%) | 16 (11.2%) | 62 (14.4%) | 25 (17.5%) | 71 (16.5%) | 19 (13.3%) | 180 (41.9%) | 37 (25.9%) | <0.001 |
| 11 | 17 (4%) | 10 (7%) | 15 (3.5%) | 16 (11.2%) | 22 (5.1%) | 22 (15.4%) | 60 (14%) | 23 (16.1%) | 92 (21.4%) | 24 (16.8%) | 101 (23.5%) | 21 (14.7%) | 123 (28.6%) | 27 (18.9%) | <0.001 |
| 12 | 35 (8.1%) | 25 (17.5%) | 46 (10.7%) | 22 (15.4%) | 37 (8.6%) | 20 (14%) | 64 (14.9%) | 14 (9.8%) | 102 (23.7%) | 23 (16.1%) | 61 (14.2%) | 21 (14.7%) | 85 (19.8%) | 18 (12.6%) | <0.001 |
| Q | Not at All | Several Days | More than Half the Days | Nearly Every Day | p-Value 1 | ||||
|---|---|---|---|---|---|---|---|---|---|
| L.R | H.R | L.R | H.R | L.R | H.R | L.R | H.R | ||
| 1 | 96 (22.3%) | 10 (7%) | 171 (39.8%) | 52 (36.4%) | 121 (28.1%) | 44 (30.8%) | 42 (9.8%) | 37 (25.9%) | <0.001 |
| 2 | 83 (19.3%) | 7 (4.9%) | 194 (45.1%) | 44 (30.8%) | 108 (25.1%) | 52 (36.4%) | 44 (10.2%) | 40 (28%) | <0.001 |
| 3 | 170 (39.5%) | 37 (25.9%) | 120 (27.9%) | 37 (25.9%) | 78 (18.1%) | 28 (19.6%) | 62 (14.4%) | 41 (28.7%) | <0.001 |
| 4 | 81 (18.8%) | 10 (7%) | 154 (35.8%) | 33 (23.1%) | 131 (30.5%) | 43 (30.1%) | 64 (14.9%) | 57 (39.9%) | <0.001 |
| 5 | 187 (43.5%) | 32 (22.4%) | 122 (28.4%) | 30 (21%) | 85 (19.8%) | 45 (31.5%) | 35 (8.1%) | 36 (25.2%) | <0.001 |
| 6 | 215 (50%) | 27 (18.9%) | 114 (26.5%) | 33 (23.1%) | 66 (15.3%) | 41 (28.7%) | 35 (8.1%) | 42 (29.4%) | <0.001 |
| 7 | 175 (40.7%) | 39 (27.3%) | 135 (31.4%) | 29 (20.3%) | 84 (19.5%) | 34 (23.8%) | 36 (8.4%) | 41 (28.7%) | <0.001 |
| 8 | 234 (54.4%) | 52 (36.4%) | 127 (29.5%) | 33 (23.1%) | 43 (10%) | 29 (20.3%) | 26 (6%) | 29 (20.3%) | <0.001 |
| 9 | 347 (80.7%) | 65 (45.5%) | 55 (12.8%) | 24 (16.8%) | 21 (4.9%) | 23 (16.1%) | 6 (1.4%) | 31 (21.7%) | <0.001 |
| Q | Disagree | Mildly Disagree | Mildly Agree | Agree | p-Value 1 | ||||
|---|---|---|---|---|---|---|---|---|---|
| L.R | H.R | L.R | H.R | L.R | H.R | L.R | H.R | ||
| 1 | 73 (17%) | 45 (31.5%) | 141 (32.8%) | 52 (36.4%) | 167 (38.8%) | 36 (25.2%) | 49 (11.4%) | 10 (7%) | <0.001 |
| 2 | 19 (4.4%) | 32 (22.4%) | 91 (21.2%) | 57 (39.9%) | 200 (46.5%) | 43 (30.1%) | 120 (27.9%) | 11 (7.7%) | <0.001 |
| 3 | 24 (5.6%) | 35 (24.5%) | 92 (21.4%) | 50 (35%) | 183 (42.6%) | 49 (34.3%) | 131 (30.5%) | 9 (6.3%) | <0.001 |
| 4 | 41 (9.5%) | 39 (27.3%) | 100 (23.3%) | 40 (28%) | 182 (42.3%) | 49 (34.3%) | 107 (24.9%) | 15 (10.5%) | <0.001 |
| 5 | 27 (6.3%) | 29 (20.3%) | 94 (21.9%) | 45 (31.5%) | 209 (48.6%) | 58 (40.6%) | 100 (23.3%) | 11 (7.7%) | <0.001 |
| 6 | 28 (6.5%) | 38 (26.6%) | 107 (24.9%) | 48 (33.6%) | 179 (41.6%) | 45 (31.5%) | 116 (27%) | 12 (8.4%) | <0.001 |
| 7 | 32 (7.4%) | 41 (28.7%) | 96 (22.3%) | 42 (29.4%) | 214 (49.8%) | 48 (33.6%) | 88 (20.5%) | 12 (8.4%) | <0.001 |
| 8 | 20 (4.7%) | 35 (24.5%) | 113 (26.3%) | 51 (35.7%) | 196 (45.6%) | 47 (32.9%) | 101 (23.5%) | 10 (7%) | <0.001 |
| 9 | 18 (4.2%) | 32 (22.4%) | 63 (14.7%) | 41 (28.7%) | 221 (51.4%) | 51 (35.7%) | 128 (29.8%) | 19 (13.3%) | <0.001 |
| Q | L.R | H.R | |
|---|---|---|---|
| 1 | Never | 322 (74.9%) | 2 (1.4%) |
| It was just a brief passing thought | 102 (23.7%) | 60 (42%) | |
| I have had a plan at least once to kill myself but did not try to do it. | 6 (1.4%) | 37 (25.9%) | |
| I have had a plan at least once to kill myself and really wanted to die. | - | 23 (16.1%) | |
| I have attempted to kill myself but did not want to die. | - | 11 (7.7%) | |
| I have attempted to kill myself and really hoped to die. | - | 10 (7%) | |
| 2 | Never | 385 (89.5%) | 22 (15.4%) |
| Rarely (1 time) | 41 (9.5%) | 47 (32.5%) | |
| Sometimes (2 times) | 4 (0.9%) | 36 (25.2%) | |
| Often (3–4 times) | - | 22 (15.4%) | |
| Very often (5 or more times) | - | 16 (11.2%) | |
| 3 | No | 385 (89.5%) | 53 (37.1%) |
| Yes, at one time, but did not really want to die | 40 (9.3%) | 36 (25.2%) | |
| Yes, at one time, and really wanted to die | 3 (0.7%) | 21 (14.7%) | |
| Yes, more than once, but did not want to do it | 2 (0.5%) | 17 (11.9%) | |
| Yes, more than once, and really wanted to do it | - | 16 (11.2%) | |
| 4 | Never | 346 (80.5%) | 12 (8.4%) |
| No chance at all | 44 (10.2%) | 22 (15.4%) | |
| Rather unlikely | 32 (7.4%) | 45 (31.5%) | |
| Unlikely | 5 (1.2%) | 23 (16.1%) | |
| Likely | 3 (0.7%) | 32 (22.4%) | |
| Rather likely | - | 7 (4.9%) | |
| Very likely | - | 2 (1.4%) |
References
- World Health Organization (WHO). Suicide Key Facts 2019. Available online: https://www.who.int/news-room/fact-sheets/detail/suicide (accessed on 15 November 2020).
- Gunnell, D.; Caul, S.; Appleby, L.; John, A.; Hawton, K. The incidence of suicide in university students in England and Wales 2000/2001–2016/2017: Record linkage study. J. Affect. Disord. 2020, 261, 113–120. [Google Scholar] [CrossRef] [PubMed]
- Centers for Disease Control and Prevention. Leading Causes of Death and Injury. 2018. Available online: https://www.cdc.gov/injury/wisqars/leadingcauses.html (accessed on 15 November 2020).
- Eskin, M.; AlBuhairan, F.; Rezaeian, M.; Abdel-Khalek, A.M.; Harlak, H.; El-Nayal, M.; Asad, N.; Khan, A.; Mechri, A.; Noor, I.M.; et al. Suicidal thoughts, attempts and motives among university students in 12 Muslim-majority countries. Psychiatr. Q. 2019, 90, 229–248. [Google Scholar] [CrossRef] [PubMed]
- Shaker, S.H.; Hosseini Kasnaviyyeh, S.M.; Basir Ghafouri, H.; Tavakkoli, N.; Yasinzadeh, M.; Masoumi, G.; Chahardovali, M.; Amiri, H. Epidemiological survey of the attempted suicide patients admitted at Hazrat Rasoul Hospital in Tehran 2007–2011. Sci. J. Forensic Med. 2017, 23, 7–15. (In Persian) [Google Scholar]
- Azizpour, Y.; Asadollahi, K.; Sayehmiri, K.; Kaikhavani, S. Investigation of the outcomes and varieties of violent suicides during a period of twenty years in Ilam, Iran. Tehran Univ. Med. J. 2017, 75, 530–537. (In Persian) [Google Scholar]
- Bakhtar, M.; Rezaeian, M. The prevalence of suicide thoughts and attempted suicide plus their risk factors among Iranian students: A systematic review study. J. Rafsanjan Univ. Med. Sci. 2017, 15, 1061–1076. (In Persian) [Google Scholar]
- World Health Organization (WHO). Mental Health Action Plan 2013–2020; World Health Organization: Geneva, Switzerland, 2013; Available online: https://www.who.int/mental_health/publications/action_plan/en/ (accessed on 15 November 2020).
- Golchin, M.; Ahmadi, M.; Soleymani, S.; Seyedi, F. Suicide narratives from the perspective of the attempters: The study of reasons and consequences. Iran Soc. Probl. 2020, 10, 271–298. [Google Scholar] [CrossRef]
- Ghodraty, T. Prediction of suicidal thoughts based on emotional failure and attachment styles among university students. J. Ardabil Univ. Med. Sci. 2019, 19, 204–215. (In Persian) [Google Scholar] [CrossRef]
- Havassi, N.; Khorshidi, A.; Khorshidi, A.; Jafari, A.; Havassi, F. Evaluating the Predictors of Suicide Deaths. J. Maz. Univ. Med. Sci. 2017, 27, 217–227. (In Persian) [Google Scholar]
- Bae, S.M.; Lee, S.A.; Lee, S.-H. Prediction by data mining, of suicide attempts in Korean adolescents: A national study. Neuropsychiatr. Dis. Treat. 2015, 11, 2367. [Google Scholar] [CrossRef]
- DelPozo-Banos, M.; John, A.; Petkov, N.; Berridge, D.M.; Southern, K.; LLoyd, K.; Jones, C.; Spencer, S.; Manuel Travieso, C. Using neural networks with routine health records to identify suicide risk: Feasibility study. JMIR Ment. Health 2018, 5, e10144. [Google Scholar] [CrossRef]
- Behirooz, A.; Haghayegh, S.A. Comparison of suicidal thoughts and stress levels among depressed students with morning and evening types. Shenakht J. Psychol. Psychiatry 2019, 6, 64–74. (In Persian) [Google Scholar] [CrossRef]
- Gradus, J.L. Posttraumatic stress disorder and death from suicide. Curr. Psychiatry Rep. 2018, 20, 98. [Google Scholar] [CrossRef] [PubMed]
- Yoo, Y.; Park, H.-J.; Park, S.; Cho, M.J.; Cho, S.-J.; Lee, J.Y.; Choi, S.-H.; Lee, J.-Y. Interpersonal trauma moderates the relationship between personality factors and suicidality of individuals with posttraumatic stress disorder. PLoS ONE 2018, 13, e0191198. [Google Scholar] [CrossRef] [PubMed]
- Passos, I.C.; Mwangi, B.; Cao, B.; Hamilton, J.E.; Wu, M.-J.; Zhang, X.Y.; Zunta-Soares, G.B.; Quevedo, J.; Kauer-Sant’Anna, M.; Kapczinski, F.; et al. Identifying a clinical signature of suicidality among patients with mood disorders: A pilot study using a machine learning approach. J. Affect. Disord. 2016, 193, 109–116. [Google Scholar] [CrossRef]
- Krysinska, K.; Lester, D. Post-traumatic stress disorder and suicide risk: A systematic review. Arch. Suicide Res. 2010, 14, 1–23. [Google Scholar] [CrossRef]
- Gold, S.N. APA Handbook of Trauma Psychology; American Psychological Association: Washington, DC, USA, 2017. [Google Scholar]
- Wilcox, H.C.; Storr, C.L.; Breslau, N. Posttraumatic stress disorder and suicide attempts in a community sample of urban American young adults. Arch. Gen. Psychiatry 2009, 66, 305–311. [Google Scholar] [CrossRef]
- Reifels, L.; Spittal, M.J.; Dückers, M.L.; Mills, K.; Pirkis, J. Suicidality risk and (repeat) disaster exposure: Findings from a nationally representative population survey. Psychiatry 2018, 81, 158–172. [Google Scholar] [CrossRef]
- Stein, D.J.; Chiu, W.T.; Hwang, I.; Kessler, R.C.; Sampson, N.; Alonso, J.; Borges, G.; Bromet, E.; Bruffaerts, R.; de Girolamo, G.; et al. Cross-national analysis of the associations between traumatic events and suicidal behavior: Findings from the WHO World Mental Health Surveys. PLoS ONE 2010, 5, e10574. [Google Scholar] [CrossRef]
- Keyes, C.L. Mental health in adolescence: Is America’s youth flourishing? Am. J. Orthopsychiatry 2006, 76, 395–402. [Google Scholar] [CrossRef]
- Brailovskaia, J.; Teismann, T.; Margraf, J. Positive mental health, stressful life events, and suicide ideation. Crisis 2020, 41, 383–388. [Google Scholar] [CrossRef]
- Brailovskaia, J.; Forkmann, T.; Glaesmer, H.; Paashaus, L.; Rath, D.; Schönfelder, A.; Juckel, G.; Teismann, T. Positive mental health moderates the association between suicide ideation and suicide attempts. J. Affect. Disord. 2019, 245, 246–249. [Google Scholar] [CrossRef] [PubMed]
- Siegmann, P.; Willutzki, U.; Fritsch, N.; Nyhuis, P.; Wolter, M.; Teismann, T. Positive mental health as a moderator of the association between risk factors and suicide ideation/behavior in psychiatric inpatients. Psychiatry Res. 2019, 273, 678–684. [Google Scholar] [CrossRef] [PubMed]
- Teismann, T.; Brailovskaia, J.; Margraf, J. Positive mental health, positive affect and suicide ideation. Int. J. Clin. Health Psychol. 2019, 19, 165–169. [Google Scholar] [CrossRef] [PubMed]
- Teismann, T.; Brailovskaia, J.; Siegmann, P.; Nyhuis, P.; Wolter, M.; Willutzki, U. Dual factor model of mental health: Co-occurrence of positive mental health and suicide ideation in inpatients and outpatients. Psychiatry Res. 2018, 260, 343–345. [Google Scholar] [CrossRef]
- Teismann, T.; Forkmann, T.; Brailovskaia, J.; Siegmann, P.; Glaesmer, H.; Margraf, J. Positive mental health moderates the association between depression and suicide ideation: A longitudinal study. Int. J. Clin. Health Psychol. 2018, 18, 1–7. [Google Scholar] [CrossRef]
- Guo, J.; Liu, C.; Kong, D.; Solomon, P.; Fu, M. The relationship between PTSD and suicidality among Wenchuan earthquake survivors: The role of PTG and social support. J. Affect. Disord. 2018, 235, 90–95. [Google Scholar] [CrossRef]
- Strader, M.A. Moderating Effects of Posttraumatic Growth on Suicidal Ideation after Combat Exposure; Georgia Southern University: Statesboro, GA, USA, 2018. [Google Scholar]
- Sheline, K.T.; Rosén, L.A. Posttraumatic growth moderates suicide risk among trauma exposed undergraduates. J. Coll. Stud. Dev. 2017, 58, 402–412. [Google Scholar] [CrossRef]
- Tedeschi, R.G.; Calhoun, L.G. Posttraumatic growth: Conceptual foundations and empirical evidence. Psychol. Inq. 2004, 15, 1–18. [Google Scholar] [CrossRef]
- Tedeschi, R.G.; Shakespeare-Finch, J.; Taku, K.; Calhoun, L.G. Posttraumatic Growth: Theory, Research, and Applications; Routledge: New York, NY, USA, 2018. [Google Scholar]
- Johnson, J.; Wood, A.M.; Gooding, P.; Taylor, P.J.; Tarrier, N. Resilience to suicidality: The buffering hypothesis. Clin. Psychol. Rev. 2011, 31, 563–591. [Google Scholar] [CrossRef]
- Whiteman, S.E.; Kramer, L.B.; Petri, J.M.; Weathers, F.W. Trauma type and suicidal ideation: The mediating effect of cognitive distortions. Traumatology 2019, 25, 262–268. [Google Scholar] [CrossRef]
- Ribeiro, J.; Franklin, J.; Fox, K.; Bentley, K.; Kleiman, E.; Chang, B.; Nock, M.K. Letter to the Editor: Suicide as a complex classification problem: Machine learning and related techniques can advance suicide prediction-a reply to Roaldset. Psychol. Med. 2016, 46, 2009–2010. [Google Scholar] [CrossRef] [PubMed]
- Huang, X.; Ribeiro, J.D.; Franklin, J.C. The differences between suicide ideators and suicide attempters: Simple, complicated, or complex? J. Consult. Clin. Psychol. 2020, 88, 554–569. [Google Scholar] [CrossRef] [PubMed]
- Van Mens, K.; de Schepper, C.; Wijnen, B.; Koldijk, S.J.; Schnack, H.; de Looff, P.; Lokkerbol, J.; Wetherall, K.; Cleare, S.; O’Connor, R.C.; et al. Predicting future suicidal behaviour in young adults, with different machine learning techniques: A population-based longitudinal study. J. Affect. Disord. 2020, 271, 169–177. [Google Scholar] [CrossRef] [PubMed]
- Kessler, R.C.; Warner, C.H.; Ivany, C.; Petukhova, M.V.; Rose, S.; Bromet, E.J.; Brown, M., 3rd; Cai, T.; Colpe, L.J.; Cox, K.L.; et al. Predicting suicides after psychiatric hospitalization in US Army soldiers: The Army Study to Assess Risk and Resilience in Servicemembers (Army STARRS). JAMA Psychiatry 2015, 72, 49–57. [Google Scholar] [CrossRef]
- Kuroki, Y. Risk factors for suicidal behaviors among Filipino Americans: A data mining approach. Am. J. Orthopsychiatry 2015, 85, 34. [Google Scholar] [CrossRef]
- Walsh, C.G.; Ribeiro, J.D.; Franklin, J.C. Predicting suicide attempts in adolescents with longitudinal clinical data and machine learning. J. Child Psychol. Psychiatry 2018, 59, 1261–1270. [Google Scholar] [CrossRef]
- Walsh, C.G.; Ribeiro, J.D.; Franklin, J.C. Predicting risk of suicide attempts over time through machine learning. Clin. Psychol. Sci. 2017, 5, 457–469. [Google Scholar] [CrossRef]
- Ribeiro, J.D.; Huang, X.; Fox, K.R.; Walsh, C.G.; Linthicum, K.P. Predicting imminent suicidal thoughts and nonfatal attempts: The role of complexity. Clin. Psychol. Sci. 2019, 7, 941–957. [Google Scholar] [CrossRef]
- Ellis, P.D. The Essential Guide to Effect Sizes: Statistical Power, Meta-Analysis, and the Interpretation of Research Results; Cambridge University Press: Cambridge, UK, 2010. [Google Scholar]
- Colquhoun, D. An investigation of the false discovery rate and the misinterpretation of p-values. R. Soc. Open Sci. 2014, 1, 140216. [Google Scholar] [CrossRef]
- Ghosh, A.K.; Wittich, C.M.; Rhodes, D.J.; Beckman, T.J.; Edson, R.S. Mayo Clinic Internal Medicine Review; Informa Healthcare: New York, NY, USA, 2008. [Google Scholar]
- Mohammadinia, N.; Rezaei, M.; Sameizadehtoosi, T.; Darban, F. Assessing suicidal ideation frequency in medical students. Q. J. Nurs. Manag. 2012, 1, 83–91. (In Persian) [Google Scholar]
- Charan, J.; Biswas, T. How to calculate sample size for different study designs in medical research? Indian J. Psychol. Med. 2013, 35, 121. [Google Scholar] [CrossRef] [PubMed]
- Daniel, W.W.; Cross, C.L. Biostatistics: A Foundation for Analysis in the Health Sciences; Wiley: New York, NY, USA, 2018. [Google Scholar]
- Heen, M.S.; Lieberman, J.D.; Miethe, T.D. A comparison of different online sampling approaches for generating national samples. Cent. Crime Justice Policy 2014, 1, 1–8. [Google Scholar]
- Oyekcin, D.G.; Sahin, E.M.; Aldemir, E. Mental health, suicidality and hopelessness among university students in Turkey. Asian J. Psychiatry 2017, 29, 185–189. [Google Scholar] [CrossRef] [PubMed]
- Grant, J.E.; Lust, K.; Fridberg, D.J.; King, A.C.; Chamberlain, S.R. E-cigarette use (vaping) is associated with illicit drug use, mental health problems, and impulsivity in university students. Ann. Clin. Psychiatry Off. J. Am. Acad. Clin. Psychiatr. 2019, 31, 27. [Google Scholar]
- Patsali, M.E.; Mousa, D.P.; Papadopoulou, E.V.; Papadopoulou, K.K.; Kaparounaki, C.K.; Diakogiannis, I.; Fountoulakis, K.N. University students’ changes in mental health status and determinants of behavior during the COVID-19 lockdown in Greece. Psychiatry Res. 2020, 292, 113298. [Google Scholar] [CrossRef] [PubMed]
- Weathers, F.W.; Litz, B.T.; Keane, T.M.; Palmieri, P.A.; Marx, B.P.; Schnurr, P.P. The PTSD Checklist for dsm-5 (PCL-5). Scale Available from the National Center for PTSD. 2013. Available online: www.ptsd.va.gov (accessed on 15 November 2020).
- Ashbaugh, A.R.; Houle-Johnson, S.; Herbert, C.; El-Hage, W.; Brunet, A. Psychometric validation of the English and French versions of the Posttraumatic Stress Disorder Checklist for DSM-5 (PCL-5). PLoS ONE 2016, 11, e0161645. [Google Scholar] [CrossRef]
- Sadeghi, M.; Taghva, A.; Goudarzi, N.; Rah Nejat, A. Validity and reliability of persian version of “post-traumatic stress disorder scale” in war veterans. Iran. J. War Public Health 2016, 8, 243–249. (In Persian) [Google Scholar]
- Tedeschi, R.G.; Calhoun, L.G. The Posttraumatic Growth Inventory: Measuring the positive legacy of trauma. J. Trauma. Stress 1996, 9, 455–471. [Google Scholar] [CrossRef]
- Mazor, Y.; Gelkopf, M.; Mueser, K.T.; Roe, D. Posttraumatic growth in psychosis. Front. Psychiatry 2016, 7, 202. [Google Scholar] [CrossRef]
- Mahmoudi, S.; Rahimi, C.; Mohammadi, N. Psychometric properties of posttraumatic growth inventory in an Iranian sample. J. Psychol. Models Methods 2013, 3, 93–108. (In Persian) [Google Scholar]
- Kroenke, K.; Spitzer, R.L. The PHQ-9: A new depression diagnostic and severity measure. Psychiatric Ann. 2002, 32, 509–515. [Google Scholar] [CrossRef]
- Kroenke, K.; Spitzer, R.L.; Williams, J.B. The PHQ-9: Validity of a brief depression severity measure. J. Gen. Intern. Med. 2001, 16, 606–613. [Google Scholar] [CrossRef]
- Ardestani, M.S.; Ashtiani, R.D.; Rezaei, Z.; Vasegh, S.; Gudarzi, S.S. Validation of Persian version of PHQ-9 for diagnosis of major depressive episode in psychiatric wards in IRAN. Int. J. Appl. Behav. Sci. 2019, 5, 1–8. [Google Scholar] [CrossRef]
- Zimet, G.D.; Dahlem, N.W.; Zimet, S.G.; Farley, G.K. The multidimensional scale of perceived social support. J. Personal. Assess. 1988, 52, 30–41. [Google Scholar] [CrossRef]
- Rostami, R.; Shahmohamadi, K.; Ghaedi, G.; Besharat, M.A.; Akbari Zardkhaneh, S.; Nosratabadi, M. Relations among self-efficacy, emotional intelligence and perceived social support in university students. Horiz. Med. Sci. 2010, 16, 46–54. [Google Scholar]
- Lukat, J.; Margraf, J.; Lutz, R.; van der Veld, W.M.; Becker, E.S. Psychometric properties of the positive mental health scale (PMH-scale). BMC Psychol. 2016, 4, 8. [Google Scholar] [CrossRef] [PubMed]
- Heshmati Molaei, N.D.; Fathi Ashtiani, A.P. Investigating the psychometric properties of the Positive Mental Health Scale in the cultural context and a sample of Iranian society. In Proceedings of the First International Conference on Culture, Psychopathology and Education, Tehran, Iran, 3 May 2017; Al-Zahra University: Tehran, Iran, 2017. (In Persian). [Google Scholar]
- Unal, I. Defining an optimal cut-point value in ROC analysis: An alternative approach. Comput. Math. Methods Med. 2017. [Google Scholar] [CrossRef] [PubMed]
- Osman, A.; Bagge, C.L.; Gutierrez, P.M.; Konick, L.C.; Kopper, B.A.; Barrios, F.X. The Suicidal Behaviors Questionnaire-Revised (SBQ-R): Validation with clinical and nonclinical samples. Assessment 2001, 8, 443–454. [Google Scholar] [CrossRef]
- Amini-Tehrani, M.; Nasiri, M.; Jalali, T.; Sadeghi, R.; Ghotbi, A.; Zamanian, H. Validation and psychometric properties of Suicide Behaviors Questionnaire-Revised (SBQ-R) in Iran. Asian J. Psychiatry 2020, 47, 101856. [Google Scholar] [CrossRef]
- Dash, M.; Liu, H. Feature selection for classification. Intell. Data Anal. 1997, 1, 131–156. [Google Scholar] [CrossRef]
- Meinshausen, N.; Bühlmann, P. Stability selection. J. R. Stat. Soc. Ser. B (Stat. Methodol.) 2010, 72, 417–473. [Google Scholar] [CrossRef]
- Pregibon, D. Logistic regression diagnostics. Ann. Stat. 1981, 9, 705–724. [Google Scholar] [CrossRef]
- Džeroski, S.; Ženko, B. (Eds.) Stacking with multi-response model trees. In International Workshop on Multiple Classifier Systems; Springer: New York, NY, USA, 2002. [Google Scholar]
- Zhang, H.; Li, M. RWO-Sampling: A random walk over-sampling approach to imbalanced data classification. Inf. Fusion 2014, 20, 99–116. [Google Scholar] [CrossRef]
- Drummond, C.; Holte, R.C. C4. 5, class imbalance, and cost sensitivity: Why under-sampling beats over-sampling. In Workshop on Learning from Imbalanced Datasets II; Citeseer: Washington DC, USA, 21 August 2003; Volume 11, pp. 1–8. [Google Scholar]
- Mosteller, F. A k-Sample Slippage Test for an Extreme Population; Selected Papers of Frederick Mosteller; Springer: New York, NY, USA, 2006; pp. 101–109. [Google Scholar]
- Mohebian, M.R.; Marateb, H.R.; Mansourian, M.; Mañanas, M.A.; Mokarian, F. A hybrid computer-aided-diagnosis system for prediction of breast cancer recurrence (HPBCR) using optimized ensemble learning. Comput. Struct. Biotechnol. J. 2017, 15, 75–85. [Google Scholar] [CrossRef] [PubMed]
- Boughorbel, S.; Jarray, F.; El-Anbari, M. Optimal classifier for imbalanced data using Matthews Correlation Coefficient metric. PLoS ONE 2017, 12, e0177678. [Google Scholar] [CrossRef] [PubMed]
- Cramér, H. Mathematical Methods of Statistics; Princeton University Press: Princeton, NJ, USA, 1999. [Google Scholar]
- Sokolova, M.; Japkowicz, N.; Szpakowicz, S. (Eds.) Beyond accuracy, F-score and ROC: A family of discriminant measures for performance evaluation. In Australasian Joint Conference on Artificial Intelligence; Springer: Berlin/Heidelberg, Germany, 2006. [Google Scholar]
- Bossuyt, P.M.; Reitsma, J.B.; Bruns, D.E.; Gatsonis, C.A.; Glasziou, P.P.; Irwig, L.; Lijmer, J.G.; Moher, D.; Rennie, D.; de Vet, H.C.W.; et al. STARD 2015: An updated list of essential items for reporting diagnostic accuracy studies. Clin. Chem. 2015, 61, 1446–1452. [Google Scholar] [CrossRef]
- Marateb, H.R.; Mohebian, M.R.; Javanmard, S.H.; Tavallaei, A.A.; Tajadini, M.H.; Heidari-Beni; Mananas, M.A.; Motlagh, M.E.; Heshmat, R.; Mansourian, M.; et al. Prediction of dyslipidemia using gene mutations, family history of diseases and anthropometric indications in children and adolescents: The CASPIAN-III study. CSBJ 2018, 16, 121–130. [Google Scholar] [CrossRef]
- Ghosh, A.K. Mayo Clinic Internal Medicine Review, 8th ed.; Taylor & Francis: Boca Raton, FL, USA, 2008. [Google Scholar]
- O’Neill, S.; O’Connor, R.C. Suicide in Northern Ireland: Epidemiology, risk factors, and prevention. Lancet Psychiatry 2020, 7, 538–546. [Google Scholar] [CrossRef]
- Hayes, J.A.; Petrovich, J.; Janis, R.A.; Yang, Y.; Castonguay, L.G.; Locke, B.D. Suicide among college students in psychotherapy: Individual predictors and latent classes. J. Couns. Psychol. 2020, 67, 104. [Google Scholar] [CrossRef]
- Kratovic, L.; Smith, L.J.; Vujanovic, A.A. PTSD Symptoms, Suicidal Ideation, and Suicide Risk in University Students: The Role of Distress Tolerance. J. Aggress. Maltreatment Trauma 2020, 1–19. [Google Scholar] [CrossRef]
- Nock, M.K.; Ursano, R.J.; Heeringa, S.G.; Stein, M.B.; Jain, S.; Raman, R.; Sun, X.; Chiu, W.T.; Colpe, L.J.; Fullerton, C.S.; et al. Mental disorders, comorbidity, and pre-enlistment suicidal behavior among new soldiers in the US Army: Results from the Army Study to Assess Risk and Resilience in Servicemembers (Army STARRS). Suicide Life-Threat. Behav. 2015, 45, 588–599. [Google Scholar] [CrossRef]
- Shafiei, M.; Basharpour, S.; Heidarirad, H. Comparison of the meaning of life, suicidal thoughts, and cognitive distortions between female patient affected by post-traumatic stress disorder and non-patient. Thought Behav. Clin. Psychol. 2016, 10, 68. (In Persian) [Google Scholar]
- Tanji, F.; Tomata, Y.; Zhang, S.; Otsuka, T.; Tsuji, I. Psychological distress and completed suicide in Japan: A comparison of the impact of moderate and severe psychological distress. Prev. Med. 2018, 116, 99–103. [Google Scholar] [CrossRef]
- Owusu-Ansah, F.E.; Addae, A.A.; Peasah, B.O.; Oppong Asante, K.; Osafo, J. Suicide among university students: Prevalence, risks and protective factors. Health Psychol. Behav. Med. 2020, 8, 220–233. [Google Scholar] [CrossRef]
- Wu, C.Y.; Lee, M.B.; Liao, S.C.; Chan, C.T.; Liu, L.U.; Chen, C.Y. Psychological distress of suicide attempters predicts one-year suicidal death during 2007-2016: A population-based study. JFMA 2020, 119, 1306–1313. [Google Scholar] [CrossRef]
- Li, W.; Dorstyn, D.S.; Jarmon, E. Identifying suicide risk among college students: A systematic review. Death Stud. 2020, 44, 450–458. [Google Scholar] [CrossRef] [PubMed]
- Kaniuka, A.R.; Kelliher Rabon, J.; Brooks, B.D.; Sirois, F.; Kleiman, E.; Hirsch, J.K. Gratitude and suicide risk among college students: Substantiating the protective benefits of being thankful. J. Am. Coll. Health 2020, 11, 1–8. [Google Scholar] [CrossRef] [PubMed]
- Tsai, A.C.; Lucas, M.; Sania, A.; Kim, D.; Kawachi, I. Social integration and suicide mortality among men: 24-year cohort study of US health professionals. Ann. Intern. Med. 2014, 161, 85–95. [Google Scholar] [CrossRef]
- Nagra, G.S.; Lin, A.; Upthegrove, R. What bridges the gap between self-harm and suicidality? The role of forgiveness, resilience and. J. Am. Acad. Child Adolesc. Psychiatry 2016, 50, 772–781. [Google Scholar] [CrossRef]
- Thomas, A.L.; Brausch, A.M. Family and peer support moderates the relationship between distress tolerance and suicide risk in black college students. J. Am. Coll. Health 2020, 1–8. [Google Scholar] [CrossRef]
- Borowsky, I.W.; Taliaferro, L.A.; McMorris, B.J. Suicidal thinking and behavior among youth involved in verbal and social bullying: Risk and protective factors. J. Adolesc. Health 2013, 53, S4–S12. [Google Scholar] [CrossRef]
- Statistical Center of Iran. University Students Based on Gender in 2015–2016. Table 17–5. 2016. Available online: https://www.amar.org.ir/Portals/0/Files/yearbook1394/yearbook94_17-5.pdf (accessed on 15 November 2020).

| Total (N = 573) | Low Risk (L.R) N = 430 | High Risk (H.R) N = 143 | p-Value 1 | |
|---|---|---|---|---|
| Gender (Female) | 310 (72.1%) | 109 (76.2%) | 0.384 | |
| Age (year) | 25.08 ± 6.8 [18–52] | 22.4 ± 3.9 [19–43] | <0.001 | |
| Grade | Bachelor | 253 (58.8%) | 108 (75.5%) | 0.008 |
| Masters | 136 (31.6%) | 22 (15.4%) | ||
| PhD | 41 (9.5%) | 13 (9.1%) | ||
| The field of study | Liberal Arts | 286 (62.3%) | 80 (55.9%) | 0.114 |
| Basic Sciences | 22 (5.1%) | 11 (7.7%) | ||
| Engineering Sciences | 100 (23.3%) | 35 (24.5%) | ||
| Medical Sciences | 28 (6.5%) | 13 (9.1%) | ||
| Foreign Languages | 12 (2.8%) | 4 (2.8%) | ||
| Educational level | Weak | 2 (0.5%) | 7 (4.9%) | 0.001 |
| Middle | 82 (19.1%) | 34 (23.8%) | ||
| Good | 252 (58.6%) | 75 (52.4%) | ||
| Excellent | 93 (21.6%) | 27 (189%) | ||
| Occupational status | Unemployed | 265 (61.6%) | 105 (73.4%) | 0.003 |
| Part time | 99 (23%) | 31 (21.7%) | ||
| Full time | 66 (15.3%) | 7 (4.9%) | ||
| Marital status | Single | 328 (76.3%) | 126 (88.1%) | 0.002 |
| Married | 98 (22.8%) | 16 (11.2%) | ||
| Divorced | 3 (0.7%) | 1 (0.7%) | ||
| Widow | 1 (0.2%) | - | ||
| History of psychological illness | None | 342 (79.5%) | 85 (59.4%) | 0.001 |
| Bipolar | - | 2 (1.4%) | ||
| Depression | 25 (5.8%) | 31 (21.7%) | ||
| Obsession | 20 (4.7) | 10 (7%) | ||
| Anxiety | 43 (10%) | 14 (9.8%) | ||
| Panic | - | 1 (0.7%) | ||
| Index | Name | Weight | Index | Name | Weight |
|---|---|---|---|---|---|
| 1 | Exposure to Trauma | 0.96 | 13 | PMH 3 | 1 |
| 2 | PCL 4 | 0.81 | 14 | PMH6 | 0.91 |
| 3 | PCL 5 | 0.72 | 15 | PMH7 | 0.79 |
| 4 | PCL 9 | 1 | 16 | PMH8 | 0.97 |
| 5 | PCL 10 | 0.86 | 17 | PMH9 | 0/97 |
| 6 | PCL 11 | 0.98 | 18 | PHQ2 | 0.66 |
| 7 | PCL 12 | 0.66 | 19 | PHQ6 | 1 |
| 8 | PCL 14 | 1 | 20 | PHQ9 | 1 |
| 9 | PCL 15 | 1 | 21 | PTG2 | 1 |
| 10 | PCL 16 | 0.61 | 22 | PTG13 | 0.96 |
| 11 | Psychological Illness | 0.91 | 23 | MSPSS8 | 0.72 |
| 12 | PMH 2 | 1 |
| Indices Folds | TP | TN | FP | FN | Se (%) | Sp (%) | PPV (%) | AUC | MCC | DOR | DP | K(C) |
|---|---|---|---|---|---|---|---|---|---|---|---|---|
| 1 | 39 | 143 | 1 | 9 | 81 | 99 | 98 | 0.90 | 0.86 | 620 | 2.73 | 0.85 |
| 2 | 40 | 139 | 4 | 8 | 83 | 97 | 91 | 0.90 | 0.83 | 174 | 2.19 | 0.83 |
| 3 | 37 | 140 | 3 | 10 | 79 | 98 | 93 | 0.88 | 0.81 | 173 | 2.19 | 0.81 |
| Overall | 116 | 422 | 8 | 27 | 81 | 98 | 94 | 0.90 | 0.83 | 227 | 2.30 | 0.83 |
| CI 95% | - | - | - | - | [75–88] | [97–99] | [89–98] | [0.86–0.93] | [0.81–0.86] | [100–512] | [1.96–2.65] | [0.78–0.88] |
Publisher’s Note: MDPI stays neutral with regard to jurisdictional claims in published maps and institutional affiliations. |
© 2020 by the authors. Licensee MDPI, Basel, Switzerland. This article is an open access article distributed under the terms and conditions of the Creative Commons Attribution (CC BY) license (http://creativecommons.org/licenses/by/4.0/).
Share and Cite
Naghavi, A.; Teismann, T.; Asgari, Z.; Mohebbian, M.R.; Mansourian, M.; Mañanas, M.Á. Accurate Diagnosis of Suicide Ideation/Behavior Using Robust Ensemble Machine Learning: A University Student Population in the Middle East and North Africa (MENA) Region. Diagnostics 2020, 10, 956. https://doi.org/10.3390/diagnostics10110956
Naghavi A, Teismann T, Asgari Z, Mohebbian MR, Mansourian M, Mañanas MÁ. Accurate Diagnosis of Suicide Ideation/Behavior Using Robust Ensemble Machine Learning: A University Student Population in the Middle East and North Africa (MENA) Region. Diagnostics. 2020; 10(11):956. https://doi.org/10.3390/diagnostics10110956
Chicago/Turabian StyleNaghavi, Azam, Tobias Teismann, Zahra Asgari, Mohammad Reza Mohebbian, Marjan Mansourian, and Miguel Ángel Mañanas. 2020. "Accurate Diagnosis of Suicide Ideation/Behavior Using Robust Ensemble Machine Learning: A University Student Population in the Middle East and North Africa (MENA) Region" Diagnostics 10, no. 11: 956. https://doi.org/10.3390/diagnostics10110956
APA StyleNaghavi, A., Teismann, T., Asgari, Z., Mohebbian, M. R., Mansourian, M., & Mañanas, M. Á. (2020). Accurate Diagnosis of Suicide Ideation/Behavior Using Robust Ensemble Machine Learning: A University Student Population in the Middle East and North Africa (MENA) Region. Diagnostics, 10(11), 956. https://doi.org/10.3390/diagnostics10110956